|
|||||||||||||||||||||||||||||||||||||||||||||||||||||||||||||||||||||||||||||||||||||||||||||||||||||||||||||||||||||||||||||||||||||||||||||||||||||||||||||||||||||||||||||||||||||||||||||||||||||||||||||||||||||||||||||||||||||||||||||||||||||||||||||||||||||||||||||||||||||||||||||||||||||||||||||||||||||||||||||||||||||||||||||||||||||||||||||||
| |
| Phenotypic Information (metabolism pathway, cancer, disease, phenome) |
| |
| |
| Gene-Gene Network Information: Co-Expression Network, Interacting Genes & KEGG |
| |
|


| Gene Summary for AGXT2 |
| Basic gene info. | Gene symbol | AGXT2 |
| Gene name | alanine--glyoxylate aminotransferase 2 | |
| Synonyms | AGT2|DAIBAT | |
| Cytomap | UCSC genome browser: 5p13 | |
| Genomic location | chr5 :34998205-35048240 | |
| Type of gene | protein-coding | |
| RefGenes | NM_031900.3, | |
| Ensembl id | ENSG00000113492 | |
| Description | (R)-3-amino-2-methylpropionate--pyruvate transaminasealanine--glyoxylate aminotransferase 2, mitochondrialbeta-ALAAT IIbeta-alanine-pyruvate aminotransferase | |
| Modification date | 20141207 | |
| dbXrefs | MIM : 612471 | |
| HGNC : HGNC | ||
| Ensembl : ENSG00000113492 | ||
| HPRD : 10638 | ||
| Vega : OTTHUMG00000090788 | ||
| Protein | UniProt: go to UniProt's Cross Reference DB Table | |
| Expression | CleanEX: HS_AGXT2 | |
| BioGPS: 64902 | ||
| Gene Expression Atlas: ENSG00000113492 | ||
| The Human Protein Atlas: ENSG00000113492 | ||
| Pathway | NCI Pathway Interaction Database: AGXT2 | |
| KEGG: AGXT2 | ||
| REACTOME: AGXT2 | ||
| ConsensusPathDB | ||
| Pathway Commons: AGXT2 | ||
| Metabolism | MetaCyc: AGXT2 | |
| HUMANCyc: AGXT2 | ||
| Regulation | Ensembl's Regulation: ENSG00000113492 | |
| miRBase: chr5 :34,998,205-35,048,240 | ||
| TargetScan: NM_031900 | ||
| cisRED: ENSG00000113492 | ||
| Context | iHOP: AGXT2 | |
| cancer metabolism search in PubMed: AGXT2 | ||
| UCL Cancer Institute: AGXT2 | ||
| Assigned class in ccmGDB | C | |
| Top |
| Phenotypic Information for AGXT2(metabolism pathway, cancer, disease, phenome) |
| Cancer | CGAP: AGXT2 |
| Familial Cancer Database: AGXT2 | |
| * This gene is included in those cancer gene databases. |
|
|
|
|
|
|
| |||||||||||||||||||||||||||||||||||||||||||||||||||||||||||||||||||||||||||||||||||||||||||||||||||||||||||||||||||||||||||||||||||||||||||||||||||||||||||||||||||||||||||||||||||||||||||||||||||||||||||||||||||||||||||||||||||||||||||||||||||||||||||||||||||||||||||||||||||||||||||||||||||||||||||||||||||||||||||||||||||||||||||||||||||||||||
Oncogene 1 | Significant driver gene in | ||||||||||||||||||||||||||||||||||||||||||||||||||||||||||||||||||||||||||||||||||||||||||||||||||||||||||||||||||||||||||||||||||||||||||||||||||||||||||||||||||||||||||||||||||||||||||||||||||||||||||||||||||||||||||||||||||||||||||||||||||||||||||||||||||||||||||||||||||||||||||||||||||||||||||||||||||||||||||||||||||||||||||||||||||||||||||||||
| cf) number; DB name 1 Oncogene; http://nar.oxfordjournals.org/content/35/suppl_1/D721.long, 2 Tumor Suppressor gene; https://bioinfo.uth.edu/TSGene/, 3 Cancer Gene Census; http://www.nature.com/nrc/journal/v4/n3/abs/nrc1299.html, 4 CancerGenes; http://nar.oxfordjournals.org/content/35/suppl_1/D721.long, 5 Network of Cancer Gene; http://ncg.kcl.ac.uk/index.php, 1Therapeutic Vulnerabilities in Cancer; http://cbio.mskcc.org/cancergenomics/statius/ |
| KEGG_ALANINE_ASPARTATE_AND_GLUTAMATE_METABOLISM KEGG_GLYCINE_SERINE_AND_THREONINE_METABOLISM REACTOME_METABOLISM_OF_AMINO_ACIDS_AND_DERIVATIVES REACTOME_METABOLISM_OF_NUCLEOTIDES REACTOME_PYRIMIDINE_METABOLISM | |
| OMIM | |
| Orphanet | |
| Disease | KEGG Disease: AGXT2 |
| MedGen: AGXT2 (Human Medical Genetics with Condition) | |
| ClinVar: AGXT2 | |
| Phenotype | MGI: AGXT2 (International Mouse Phenotyping Consortium) |
| PhenomicDB: AGXT2 | |
| Mutations for AGXT2 |
| * Under tables are showing count per each tissue to give us broad intuition about tissue specific mutation patterns.You can go to the detailed page for each mutation database's web site. |
| There's no structural variation information in COSMIC data for this gene. |
| * From mRNA Sanger sequences, Chitars2.0 arranged chimeric transcripts. This table shows AGXT2 related fusion information. |
| ID | Head Gene | Tail Gene | Accession | Gene_a | qStart_a | qEnd_a | Chromosome_a | tStart_a | tEnd_a | Gene_a | qStart_a | qEnd_a | Chromosome_a | tStart_a | tEnd_a |
| AF121182 | SERPINA1 | 1 | 56 | 14 | 94848980 | 94849230 | AGXT2 | 55 | 359 | 5 | 35013072 | 35025960 | |
| Top |
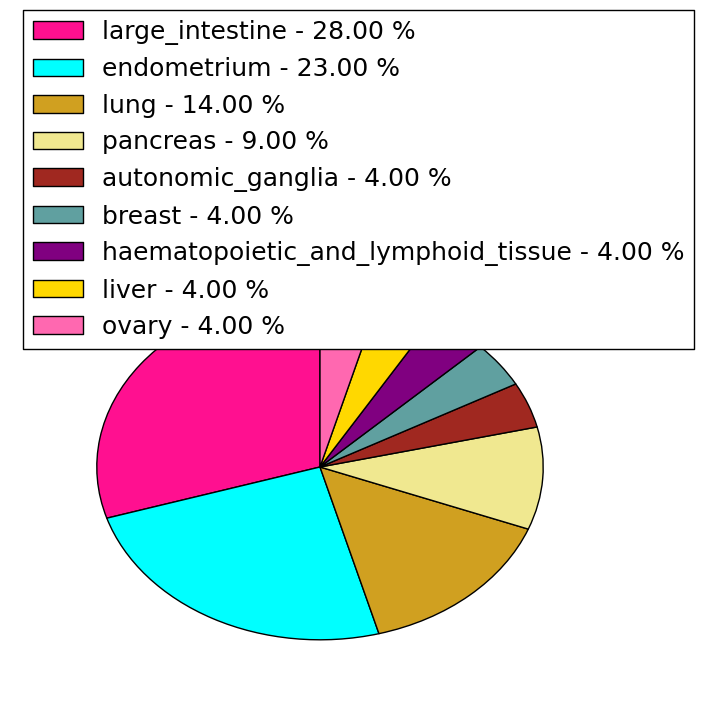
| Mutation type/ Tissue ID | brca | cns | cerv | endome | haematopo | kidn | Lintest | liver | lung | ns | ovary | pancre | prost | skin | stoma | thyro | urina | |||
| Total # sample | 1 | 3 | 1 | |||||||||||||||||
| GAIN (# sample) | 1 | 3 | 1 | |||||||||||||||||
| LOSS (# sample) |
| cf) Tissue ID; Tissue type (1; Breast, 2; Central_nervous_system, 3; Cervix, 4; Endometrium, 5; Haematopoietic_and_lymphoid_tissue, 6; Kidney, 7; Large_intestine, 8; Liver, 9; Lung, 10; NS, 11; Ovary, 12; Pancreas, 13; Prostate, 14; Skin, 15; Stomach, 16; Thyroid, 17; Urinary_tract) |
| Top |
|
 |
| Top |
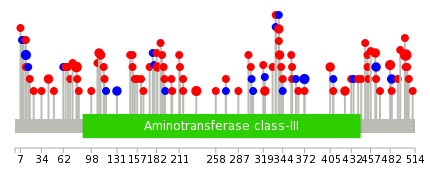
| Stat. for Non-Synonymous SNVs (# total SNVs=70) | (# total SNVs=21) |
 |  |
(# total SNVs=1) | (# total SNVs=0) |
 |
| Top |
| * When you move the cursor on each content, you can see more deailed mutation information on the Tooltip. Those are primary_site,primary_histology,mutation(aa),pubmedID. |
| GRCh37 position | Mutation(aa) | Unique sampleID count |
| chr5:34998865-34998865 | p.R502C | 6 |
| chr5:35039555-35039555 | p.T79M | 4 |
| chr5:34998924-34998924 | p.R482H | 3 |
| chr5:35047956-35047956 | p.L14L | 3 |
| chr5:35032909-35032909 | p.R233C | 3 |
| chr5:35013131-35013131 | p.A372A | 3 |
| chr5:35014173-35014173 | p.H339Y | 2 |
| chr5:35010122-35010122 | p.E441* | 2 |
| chr5:35003913-35003913 | p.C464C | 2 |
| chr5:35039462-35039462 | p.G110E | 2 |
| Top |
|
 |
| Point Mutation/ Tissue ID | 1 | 2 | 3 | 4 | 5 | 6 | 7 | 8 | 9 | 10 | 11 | 12 | 13 | 14 | 15 | 16 | 17 | 18 | 19 | 20 |
| # sample | 2 | 15 | 3 | 1 | 1 | 1 | 8 | 2 | 4 | 19 | 10 | 14 | ||||||||
| # mutation | 2 | 15 | 3 | 1 | 1 | 1 | 12 | 2 | 4 | 18 | 12 | 14 | ||||||||
| nonsynonymous SNV | 1 | 9 | 1 | 1 | 1 | 1 | 11 | 1 | 3 | 15 | 9 | 10 | ||||||||
| synonymous SNV | 1 | 6 | 2 | 1 | 1 | 1 | 3 | 3 | 4 |
| cf) Tissue ID; Tissue type (1; BLCA[Bladder Urothelial Carcinoma], 2; BRCA[Breast invasive carcinoma], 3; CESC[Cervical squamous cell carcinoma and endocervical adenocarcinoma], 4; COAD[Colon adenocarcinoma], 5; GBM[Glioblastoma multiforme], 6; Glioma Low Grade, 7; HNSC[Head and Neck squamous cell carcinoma], 8; KICH[Kidney Chromophobe], 9; KIRC[Kidney renal clear cell carcinoma], 10; KIRP[Kidney renal papillary cell carcinoma], 11; LAML[Acute Myeloid Leukemia], 12; LUAD[Lung adenocarcinoma], 13; LUSC[Lung squamous cell carcinoma], 14; OV[Ovarian serous cystadenocarcinoma ], 15; PAAD[Pancreatic adenocarcinoma], 16; PRAD[Prostate adenocarcinoma], 17; SKCM[Skin Cutaneous Melanoma], 18:STAD[Stomach adenocarcinoma], 19:THCA[Thyroid carcinoma], 20:UCEC[Uterine Corpus Endometrial Carcinoma]) |
| Top |
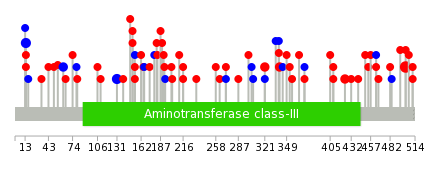
| * We represented just top 10 SNVs. When you move the cursor on each content, you can see more deailed mutation information on the Tooltip. Those are primary_site, primary_histology, mutation(aa), pubmedID. |
| Genomic Position | Mutation(aa) | Unique sampleID count |
| chr5:34998865 | p.R502C | 6 |
| chr5:35037140 | p.L14L | 3 |
| chr5:35047956 | p.L131L | 3 |
| chr5:34998837 | p.G62G | 2 |
| chr5:35010173 | p.D340N | 2 |
| chr5:35014170 | p.A154D | 2 |
| chr5:35037072 | p.E321G | 2 |
| chr5:35039605 | p.E424K | 2 |
| chr5:35025869 | p.R511K | 2 |
| chr5:35025913 | p.K304K | 1 |
| * Copy number data were extracted from TCGA using R package TCGA-Assembler. The URLs of all public data files on TCGA DCC data server were gathered on Jan-05-2015. Function ProcessCNAData in TCGA-Assembler package was used to obtain gene-level copy number value which is calculated as the average copy number of the genomic region of a gene. |
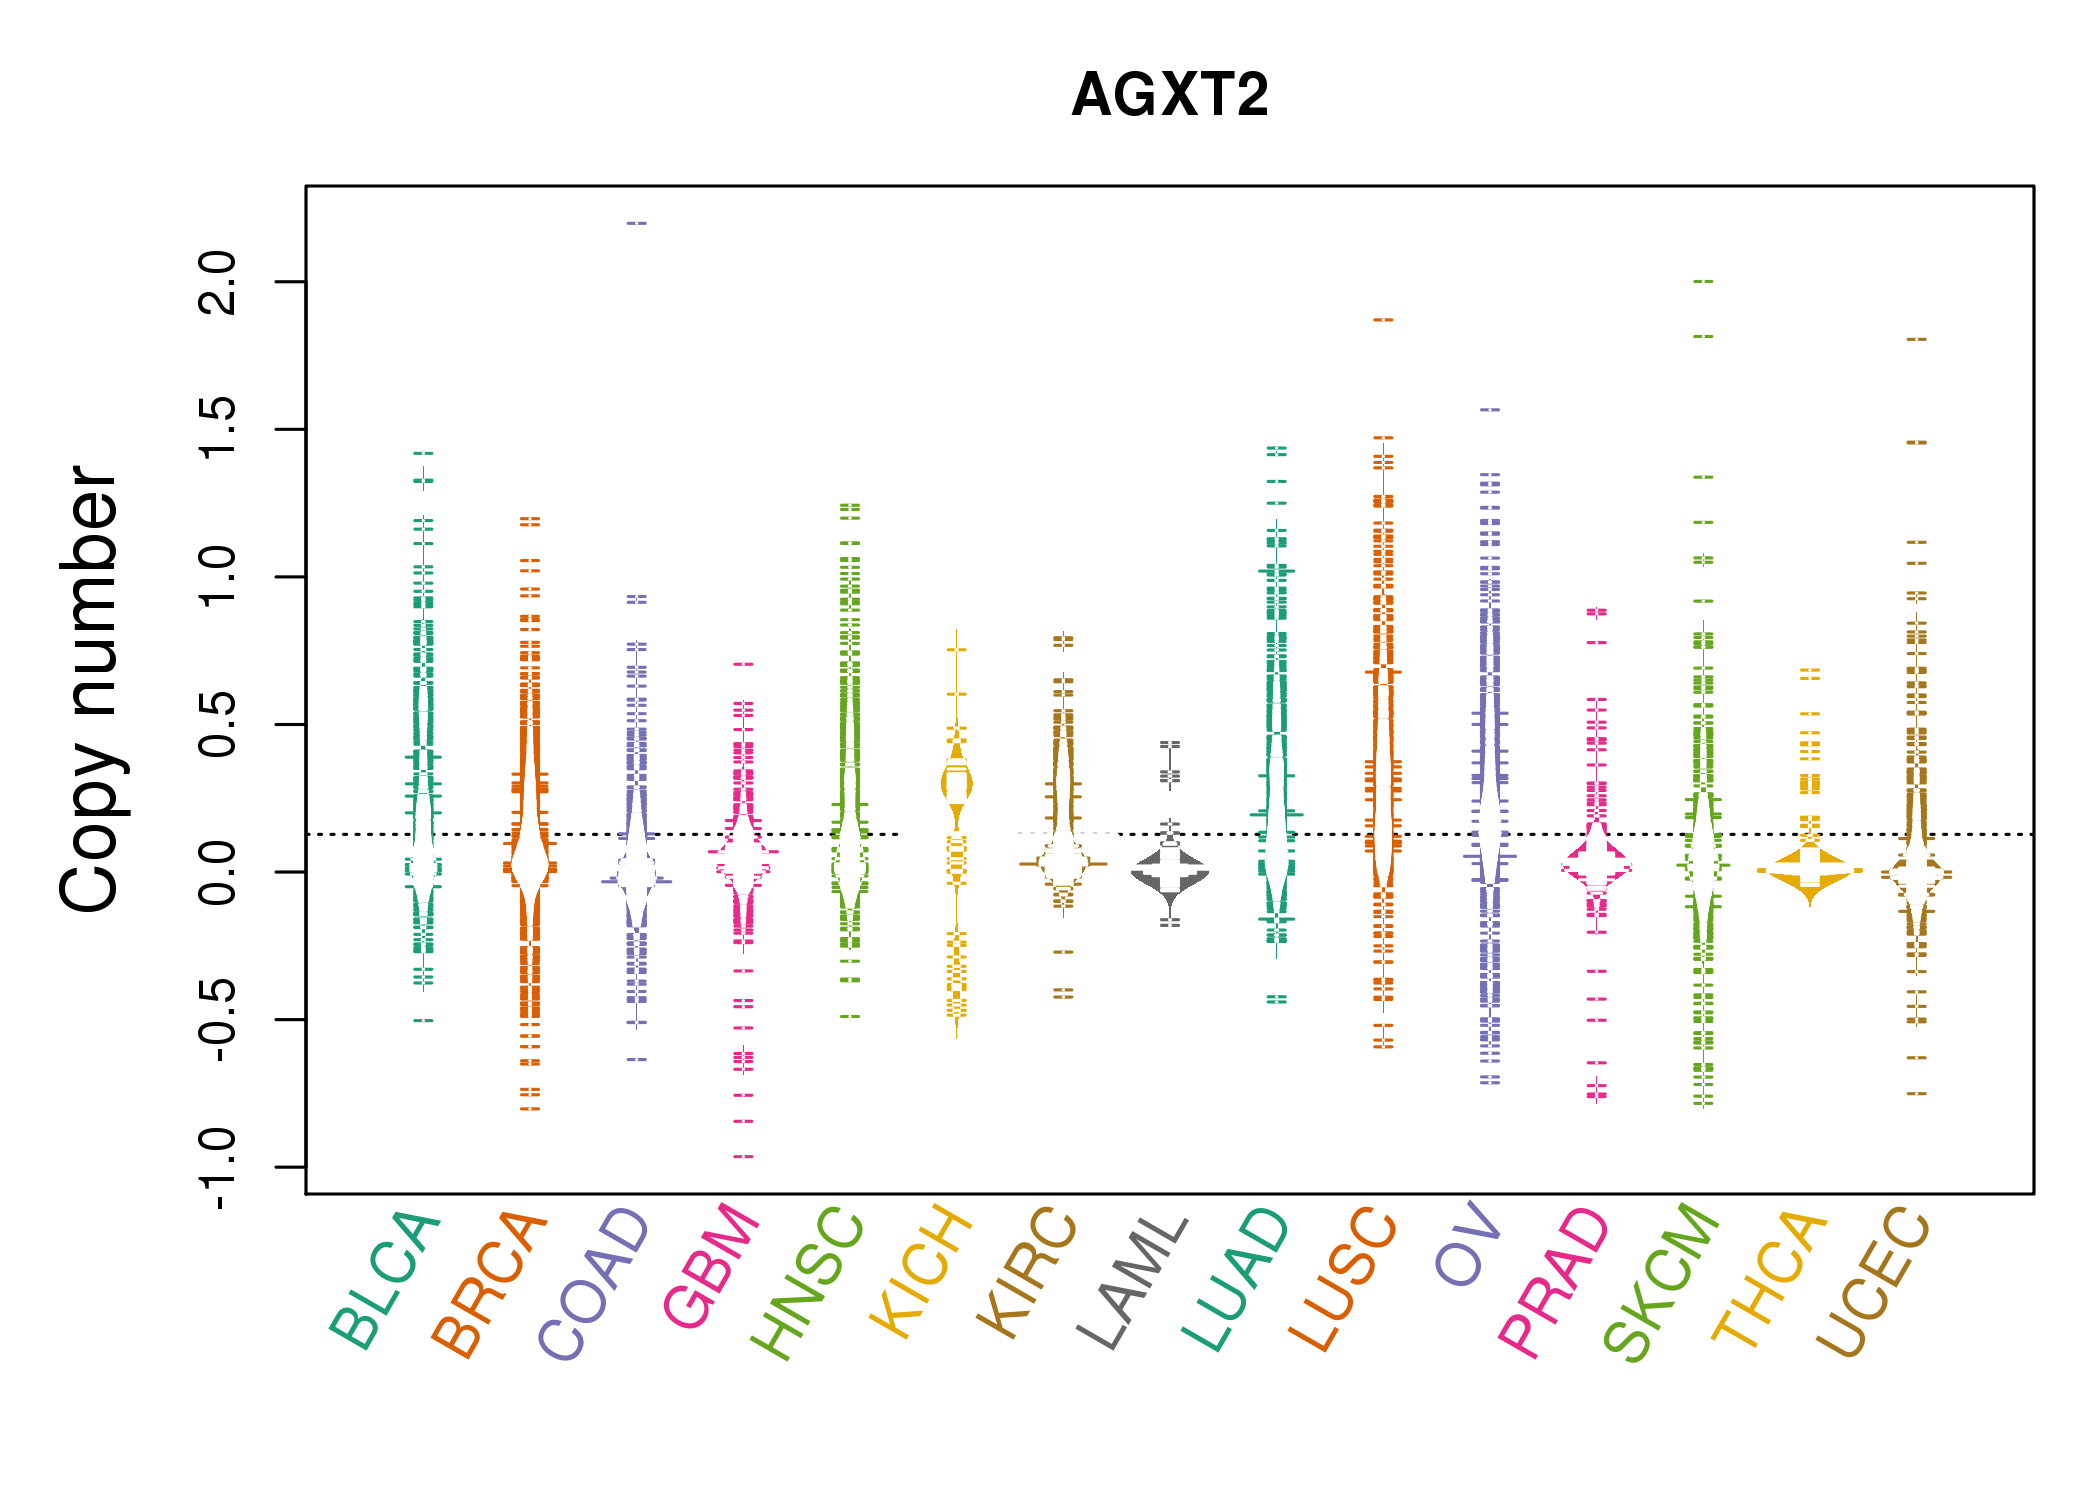 |
| cf) Tissue ID[Tissue type]: BLCA[Bladder Urothelial Carcinoma], BRCA[Breast invasive carcinoma], CESC[Cervical squamous cell carcinoma and endocervical adenocarcinoma], COAD[Colon adenocarcinoma], GBM[Glioblastoma multiforme], Glioma Low Grade, HNSC[Head and Neck squamous cell carcinoma], KICH[Kidney Chromophobe], KIRC[Kidney renal clear cell carcinoma], KIRP[Kidney renal papillary cell carcinoma], LAML[Acute Myeloid Leukemia], LUAD[Lung adenocarcinoma], LUSC[Lung squamous cell carcinoma], OV[Ovarian serous cystadenocarcinoma ], PAAD[Pancreatic adenocarcinoma], PRAD[Prostate adenocarcinoma], SKCM[Skin Cutaneous Melanoma], STAD[Stomach adenocarcinoma], THCA[Thyroid carcinoma], UCEC[Uterine Corpus Endometrial Carcinoma] |
| Top |
| Gene Expression for AGXT2 |
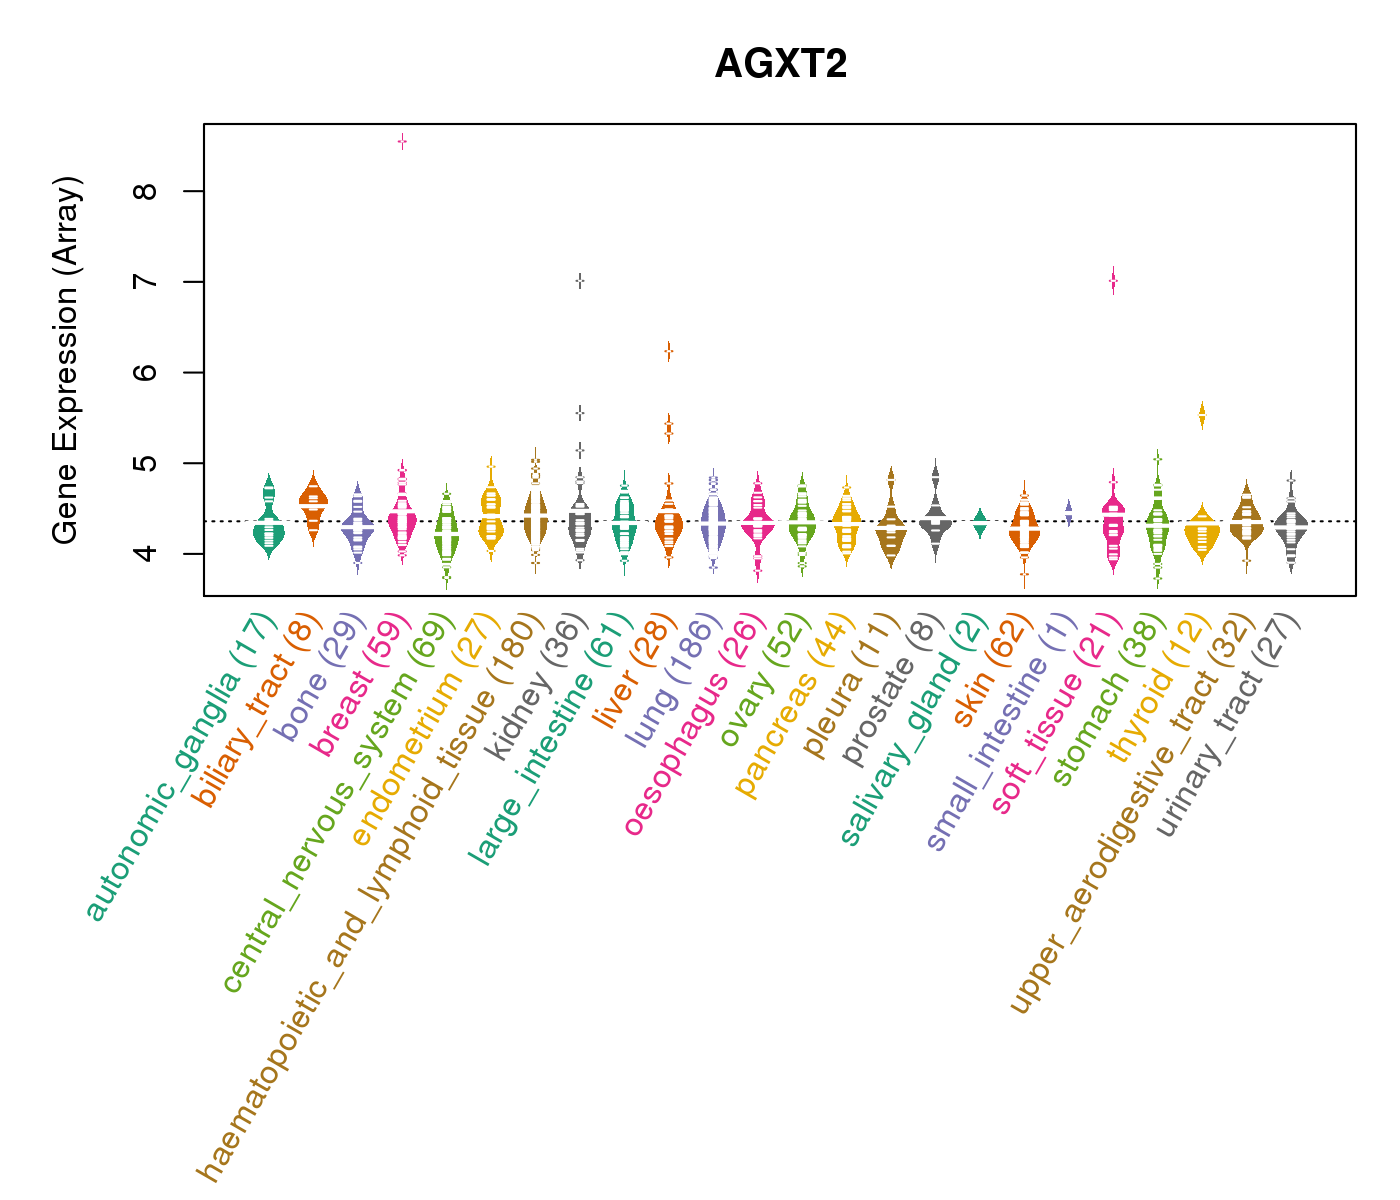
| * CCLE gene expression data were extracted from CCLE_Expression_Entrez_2012-10-18.res: Gene-centric RMA-normalized mRNA expression data. |
 |
| * Normalized gene expression data of RNASeqV2 was extracted from TCGA using R package TCGA-Assembler. The URLs of all public data files on TCGA DCC data server were gathered at Jan-05-2015. Only eight cancer types have enough normal control samples for differential expression analysis. (t test, adjusted p<0.05 (using Benjamini-Hochberg FDR)) |
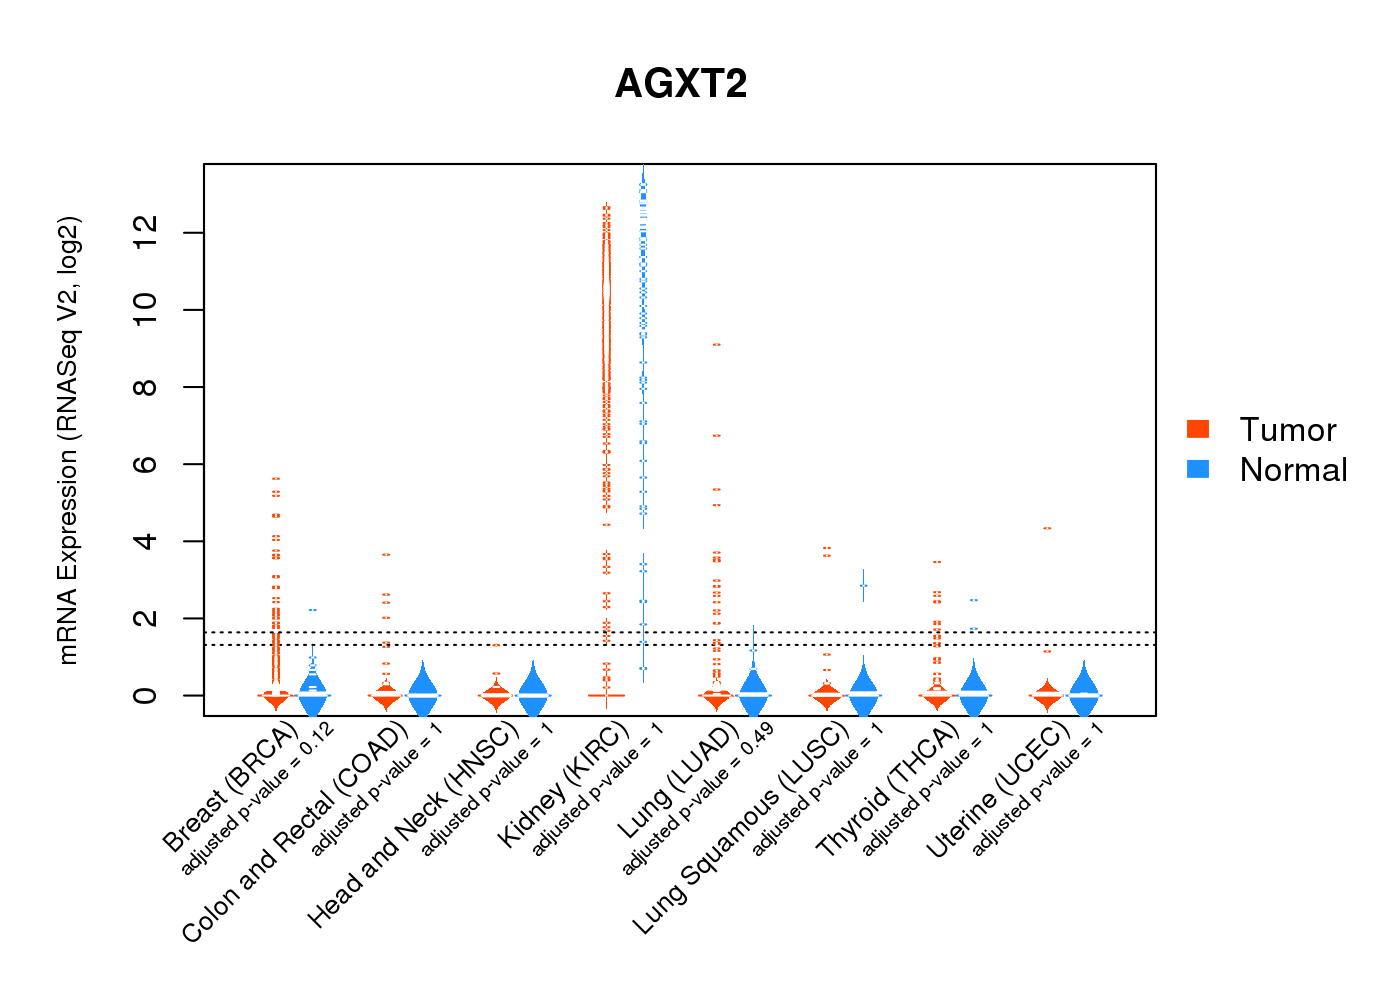 |
| Top |
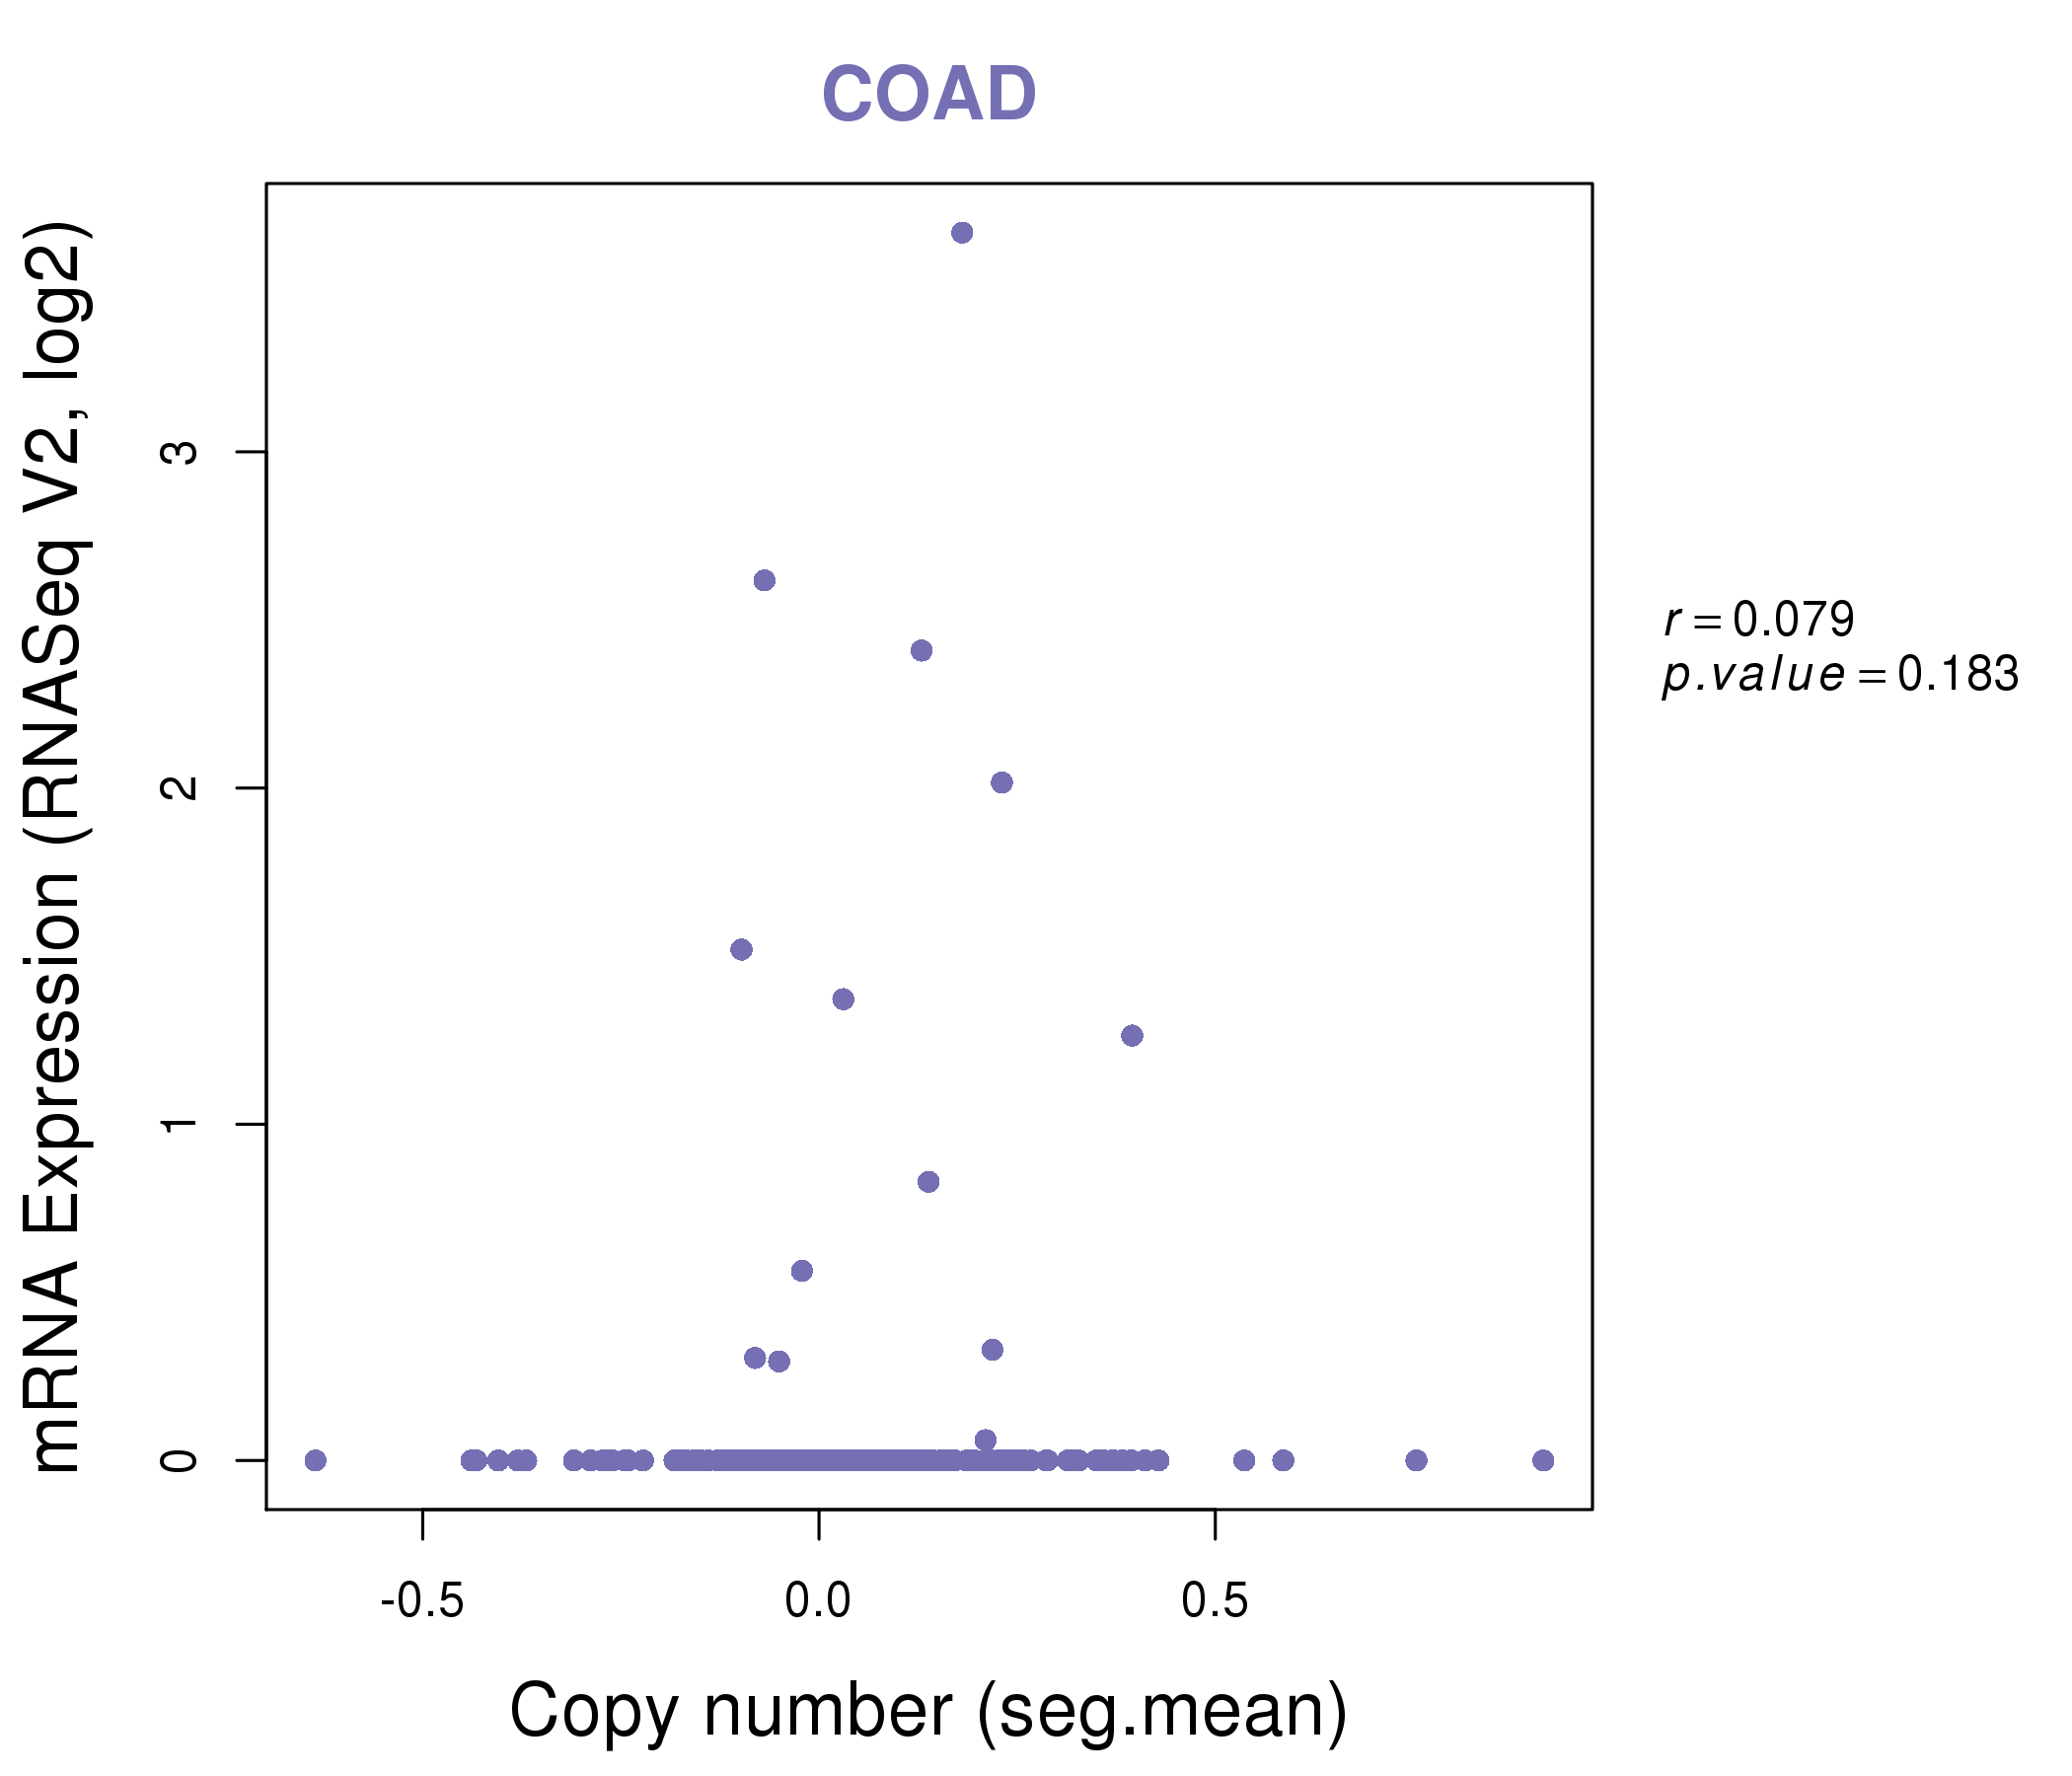
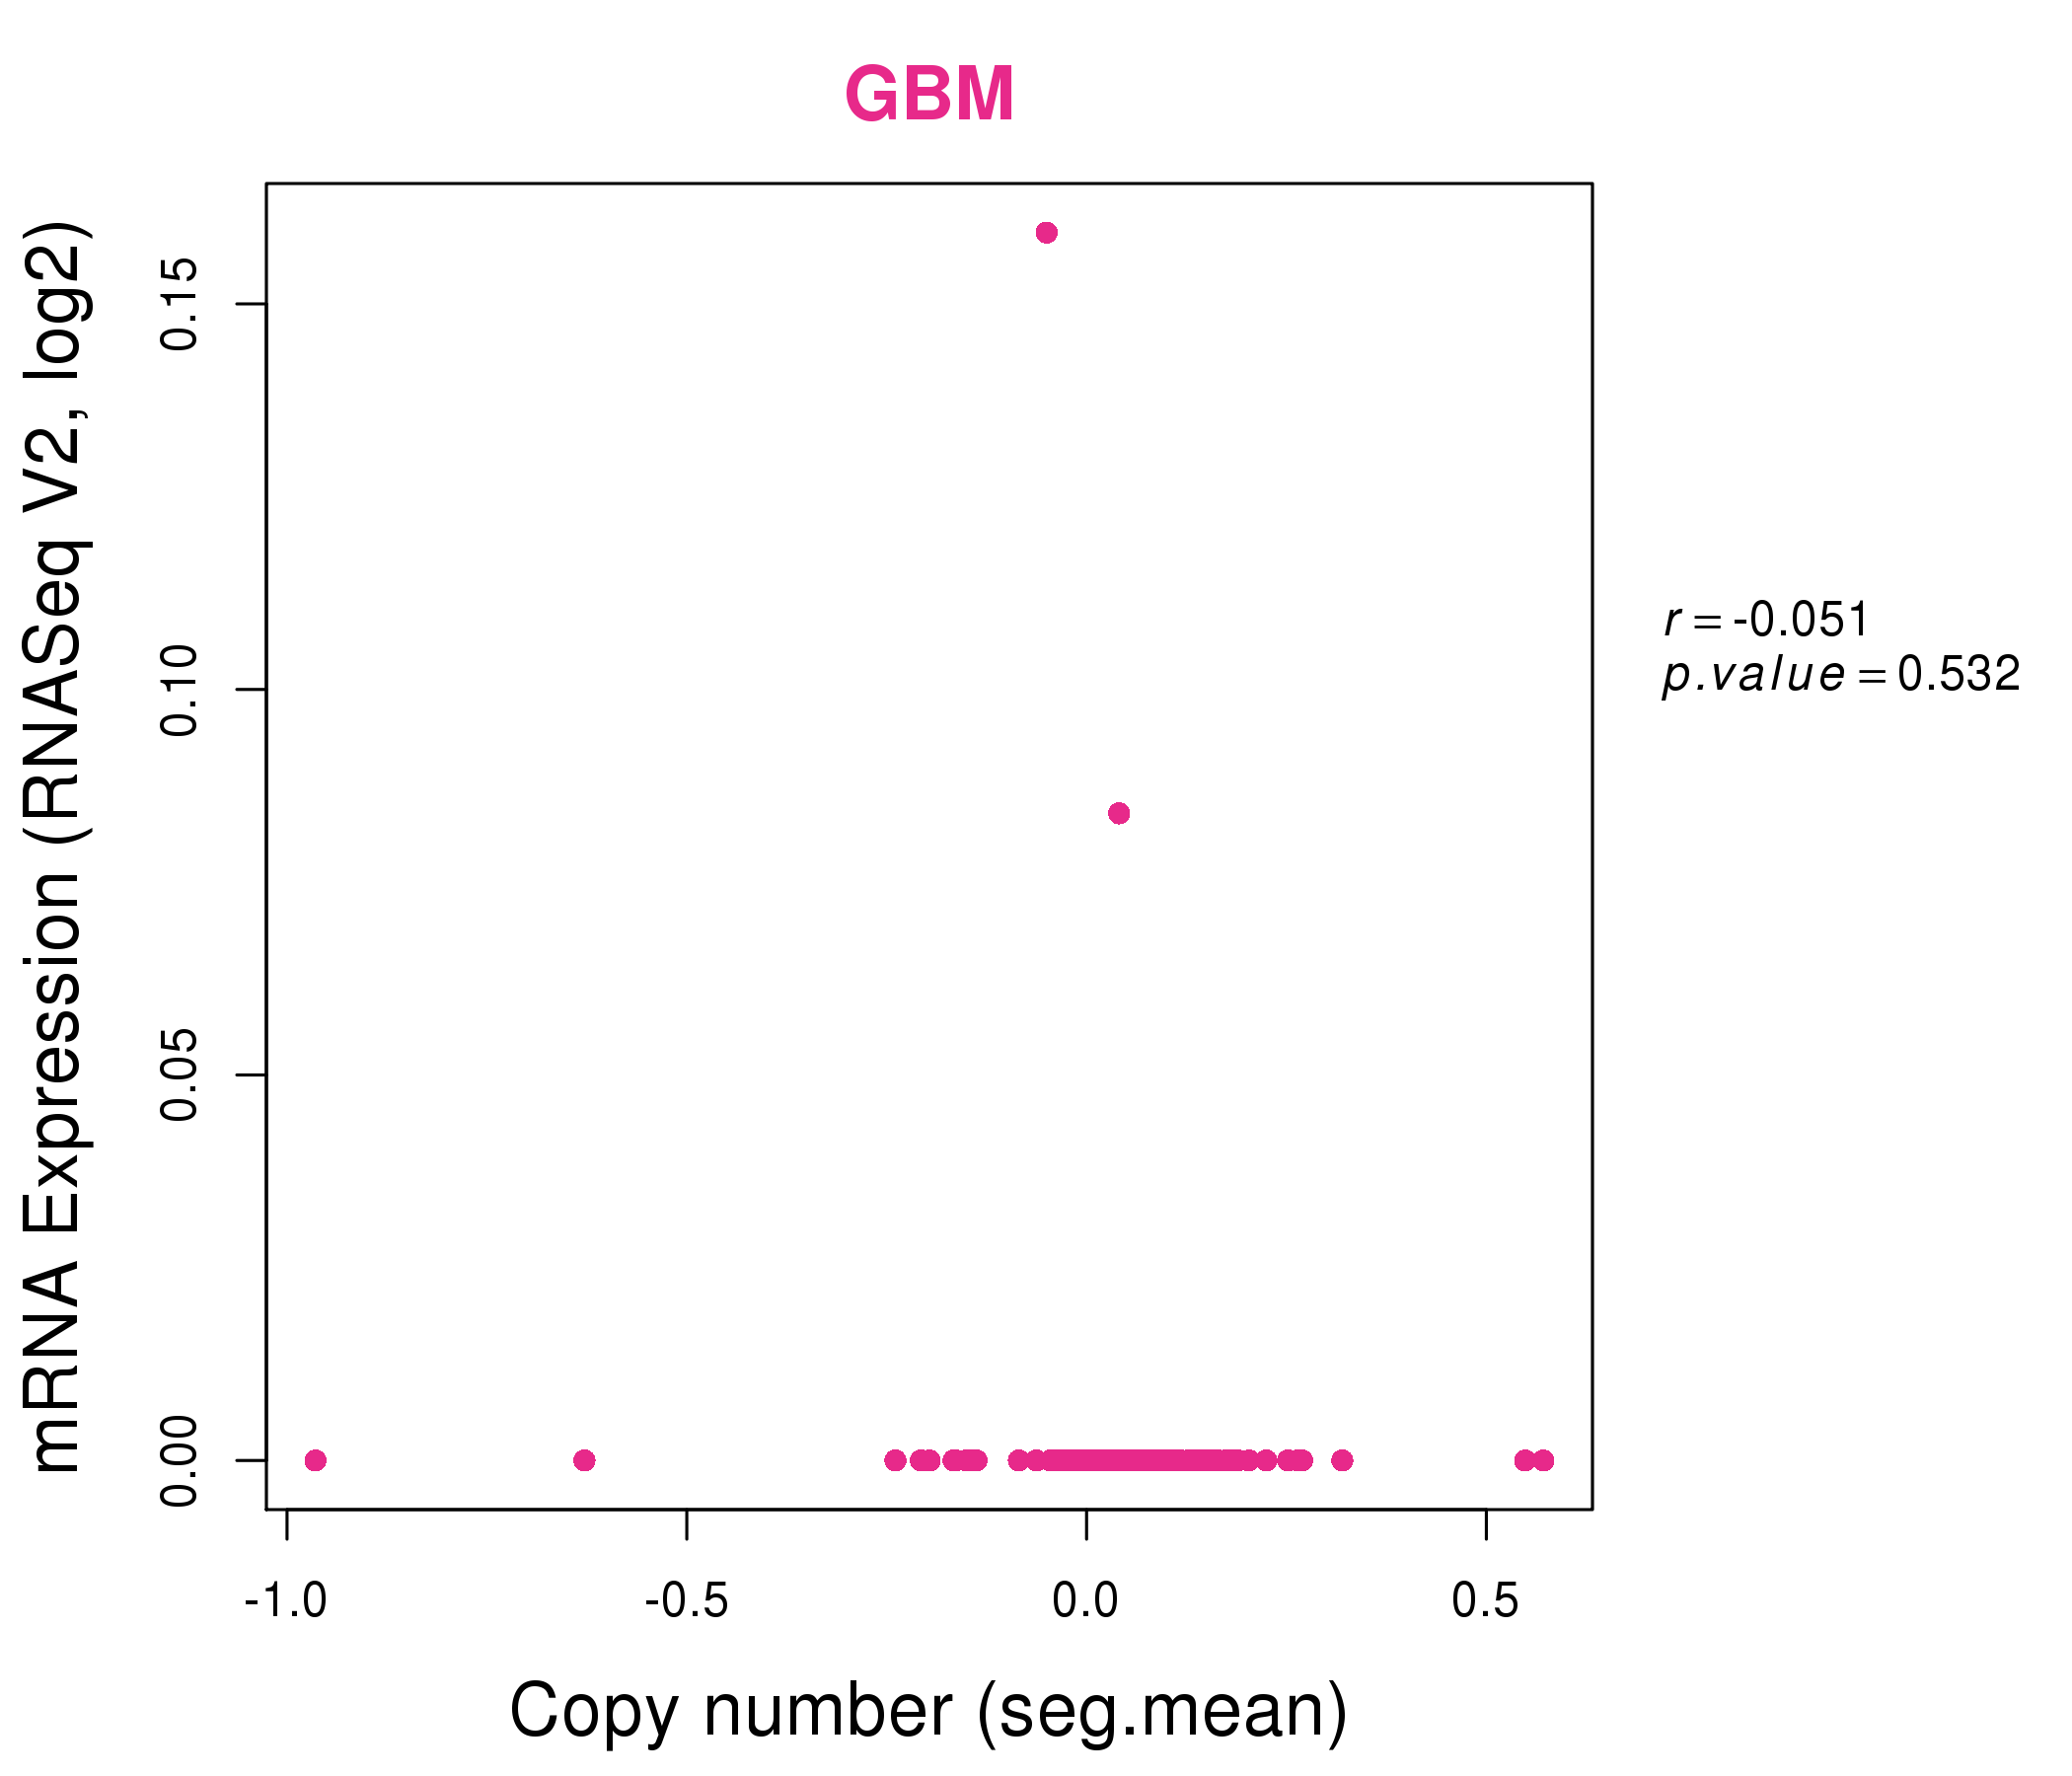
| * This plots show the correlation between CNV and gene expression. |
: Open all plots for all cancer types
 |
|
 |
|

| Top |
| Gene-Gene Network Information |
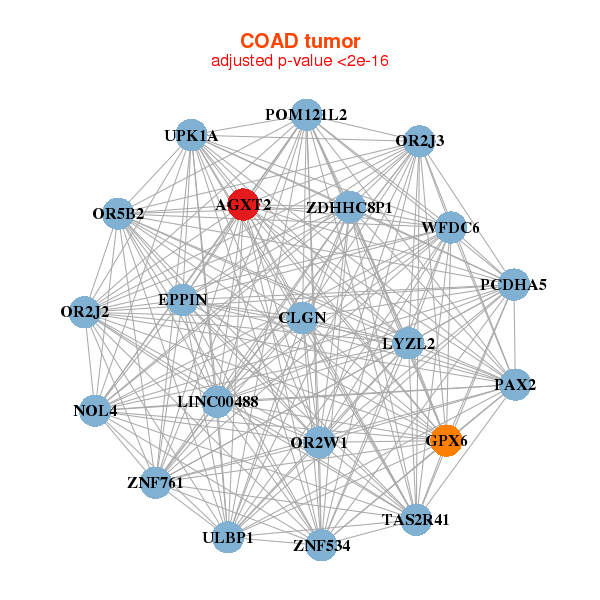
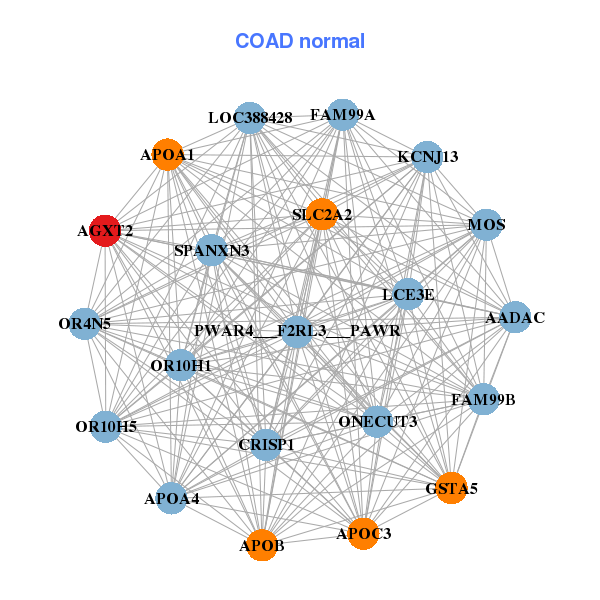
| * Co-Expression network figures were drawn using R package igraph. Only the top 20 genes with the highest correlations were shown. Red circle: input gene, orange circle: cell metabolism gene, sky circle: other gene |
: Open all plots for all cancer types
 |
| ||||
| AFM,AGXT2,APCS,APOA2,APOA4,APOC3,C8A, C9,CREB3L3,CRP,F2,F9,FABP1,FGF23, HP,ITIH1,LEAP2,MT1B,PLG,SERPINA7,TM4SF5 | AGXT2,AOX2P,ATP11AUN,CGB2,DEFB125,GH2,GNG8, HDGFL1,HELT,IAPP,KRTAP13-2,LHX9,NKX6-3,OR10J5, OR2M3,PSG8,SLC17A3,SLC6A19,TP53TG5,WFDC8,ZNF645 | ||||
 |
| ||||
| AGXT2,LINC00488,CLGN,GPX6,LYZL2,NOL4,OR2J2, OR2J3,OR2W1,OR5B2,PAX2,PCDHA5,POM121L2,EPPIN, TAS2R41,ULBP1,UPK1A,WFDC6,ZDHHC8P1,ZNF534,ZNF761 | AADAC,AGXT2,APOA1,APOA4,APOB,APOC3,CRISP1, FAM99A,FAM99B,GSTA5,KCNJ13,LCE3E,LOC388428,MOS, ONECUT3,OR10H1,OR10H5,OR4N5,PWAR4___F2RL3___PAWR,SLC2A2,SPANXN3 |

| * Co-Expression network figures were drawn using R package igraph. Only the top 20 genes with the highest correlations were shown. Red circle: input gene, orange circle: cell metabolism gene, sky circle: other gene |
: Open all plots for all cancer types
| Top |
: Open all interacting genes' information including KEGG pathway for all interacting genes from DAVID
| Top |
| Pharmacological Information for AGXT2 |
| DB Category | DB Name | DB's ID and Url link |
| * Gene Centered Interaction Network. |
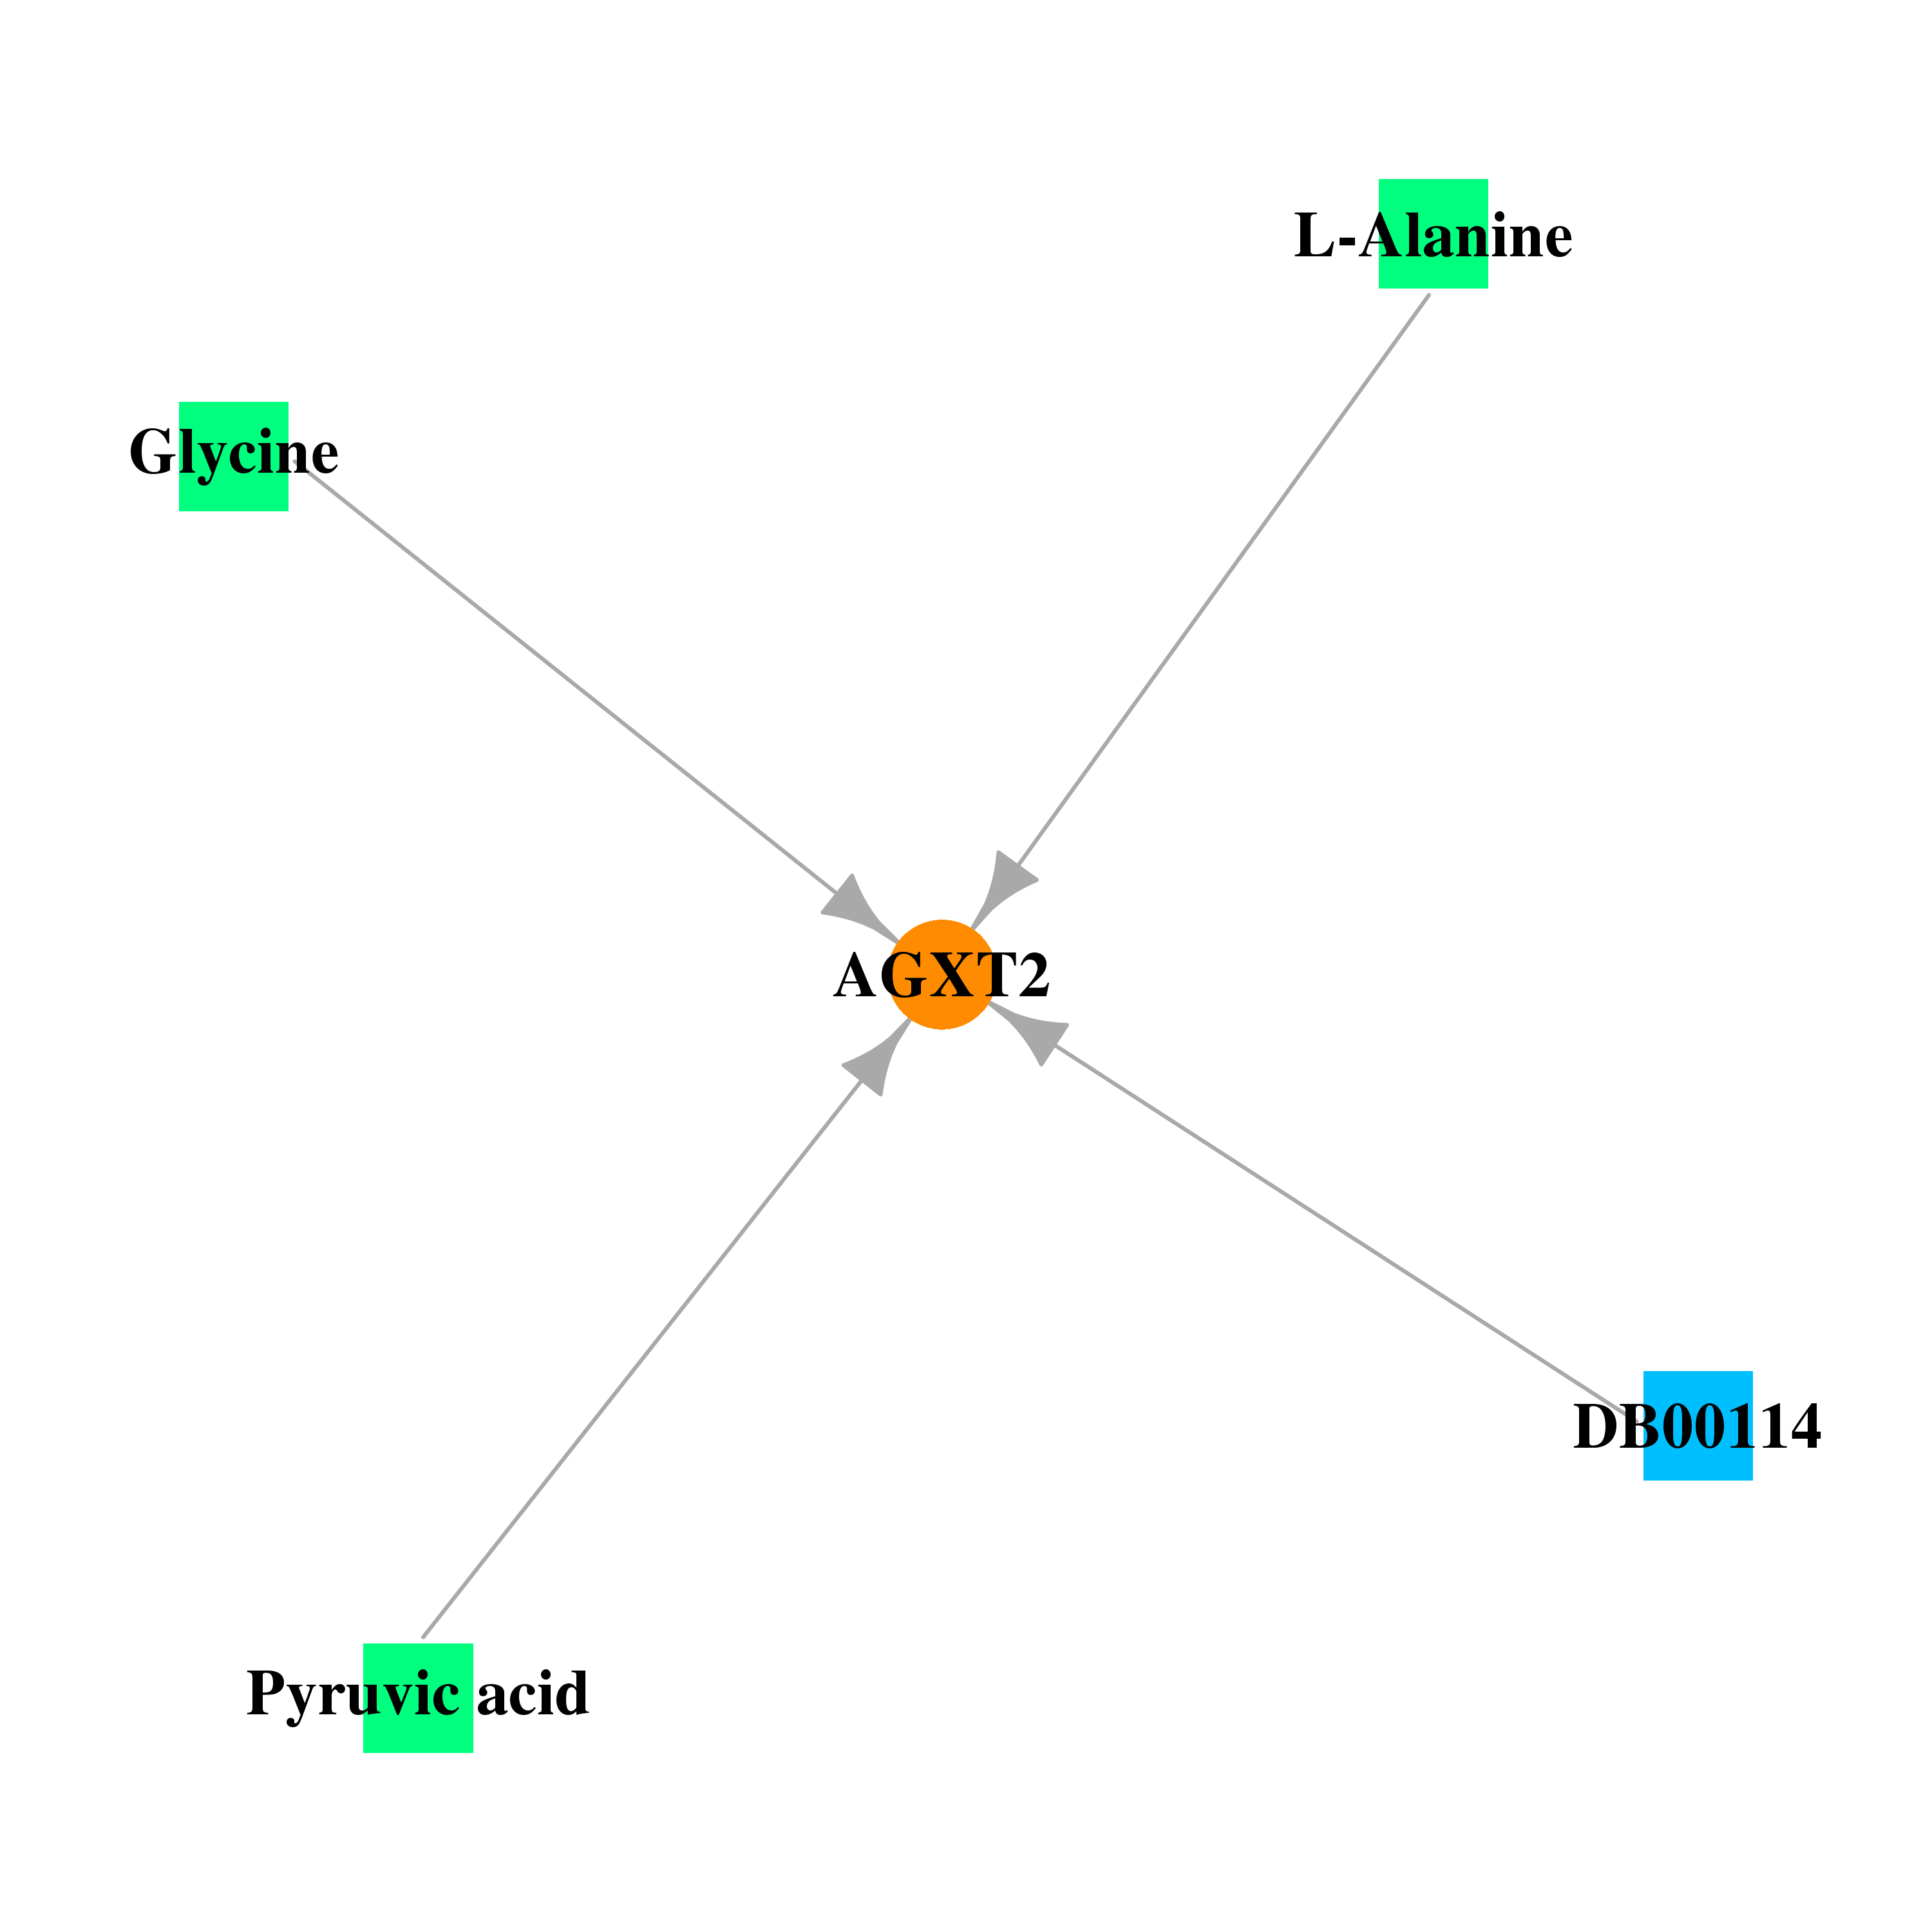 |
| * Drug Centered Interaction Network. |
| DrugBank ID | Target Name | Drug Groups | Generic Name | Drug Centered Network | Drug Structure |
| DB00114 | alanine--glyoxylate aminotransferase 2 | nutraceutical | Pyridoxal Phosphate |  |  |
| DB00119 | alanine--glyoxylate aminotransferase 2 | approved; nutraceutical | Pyruvic acid | 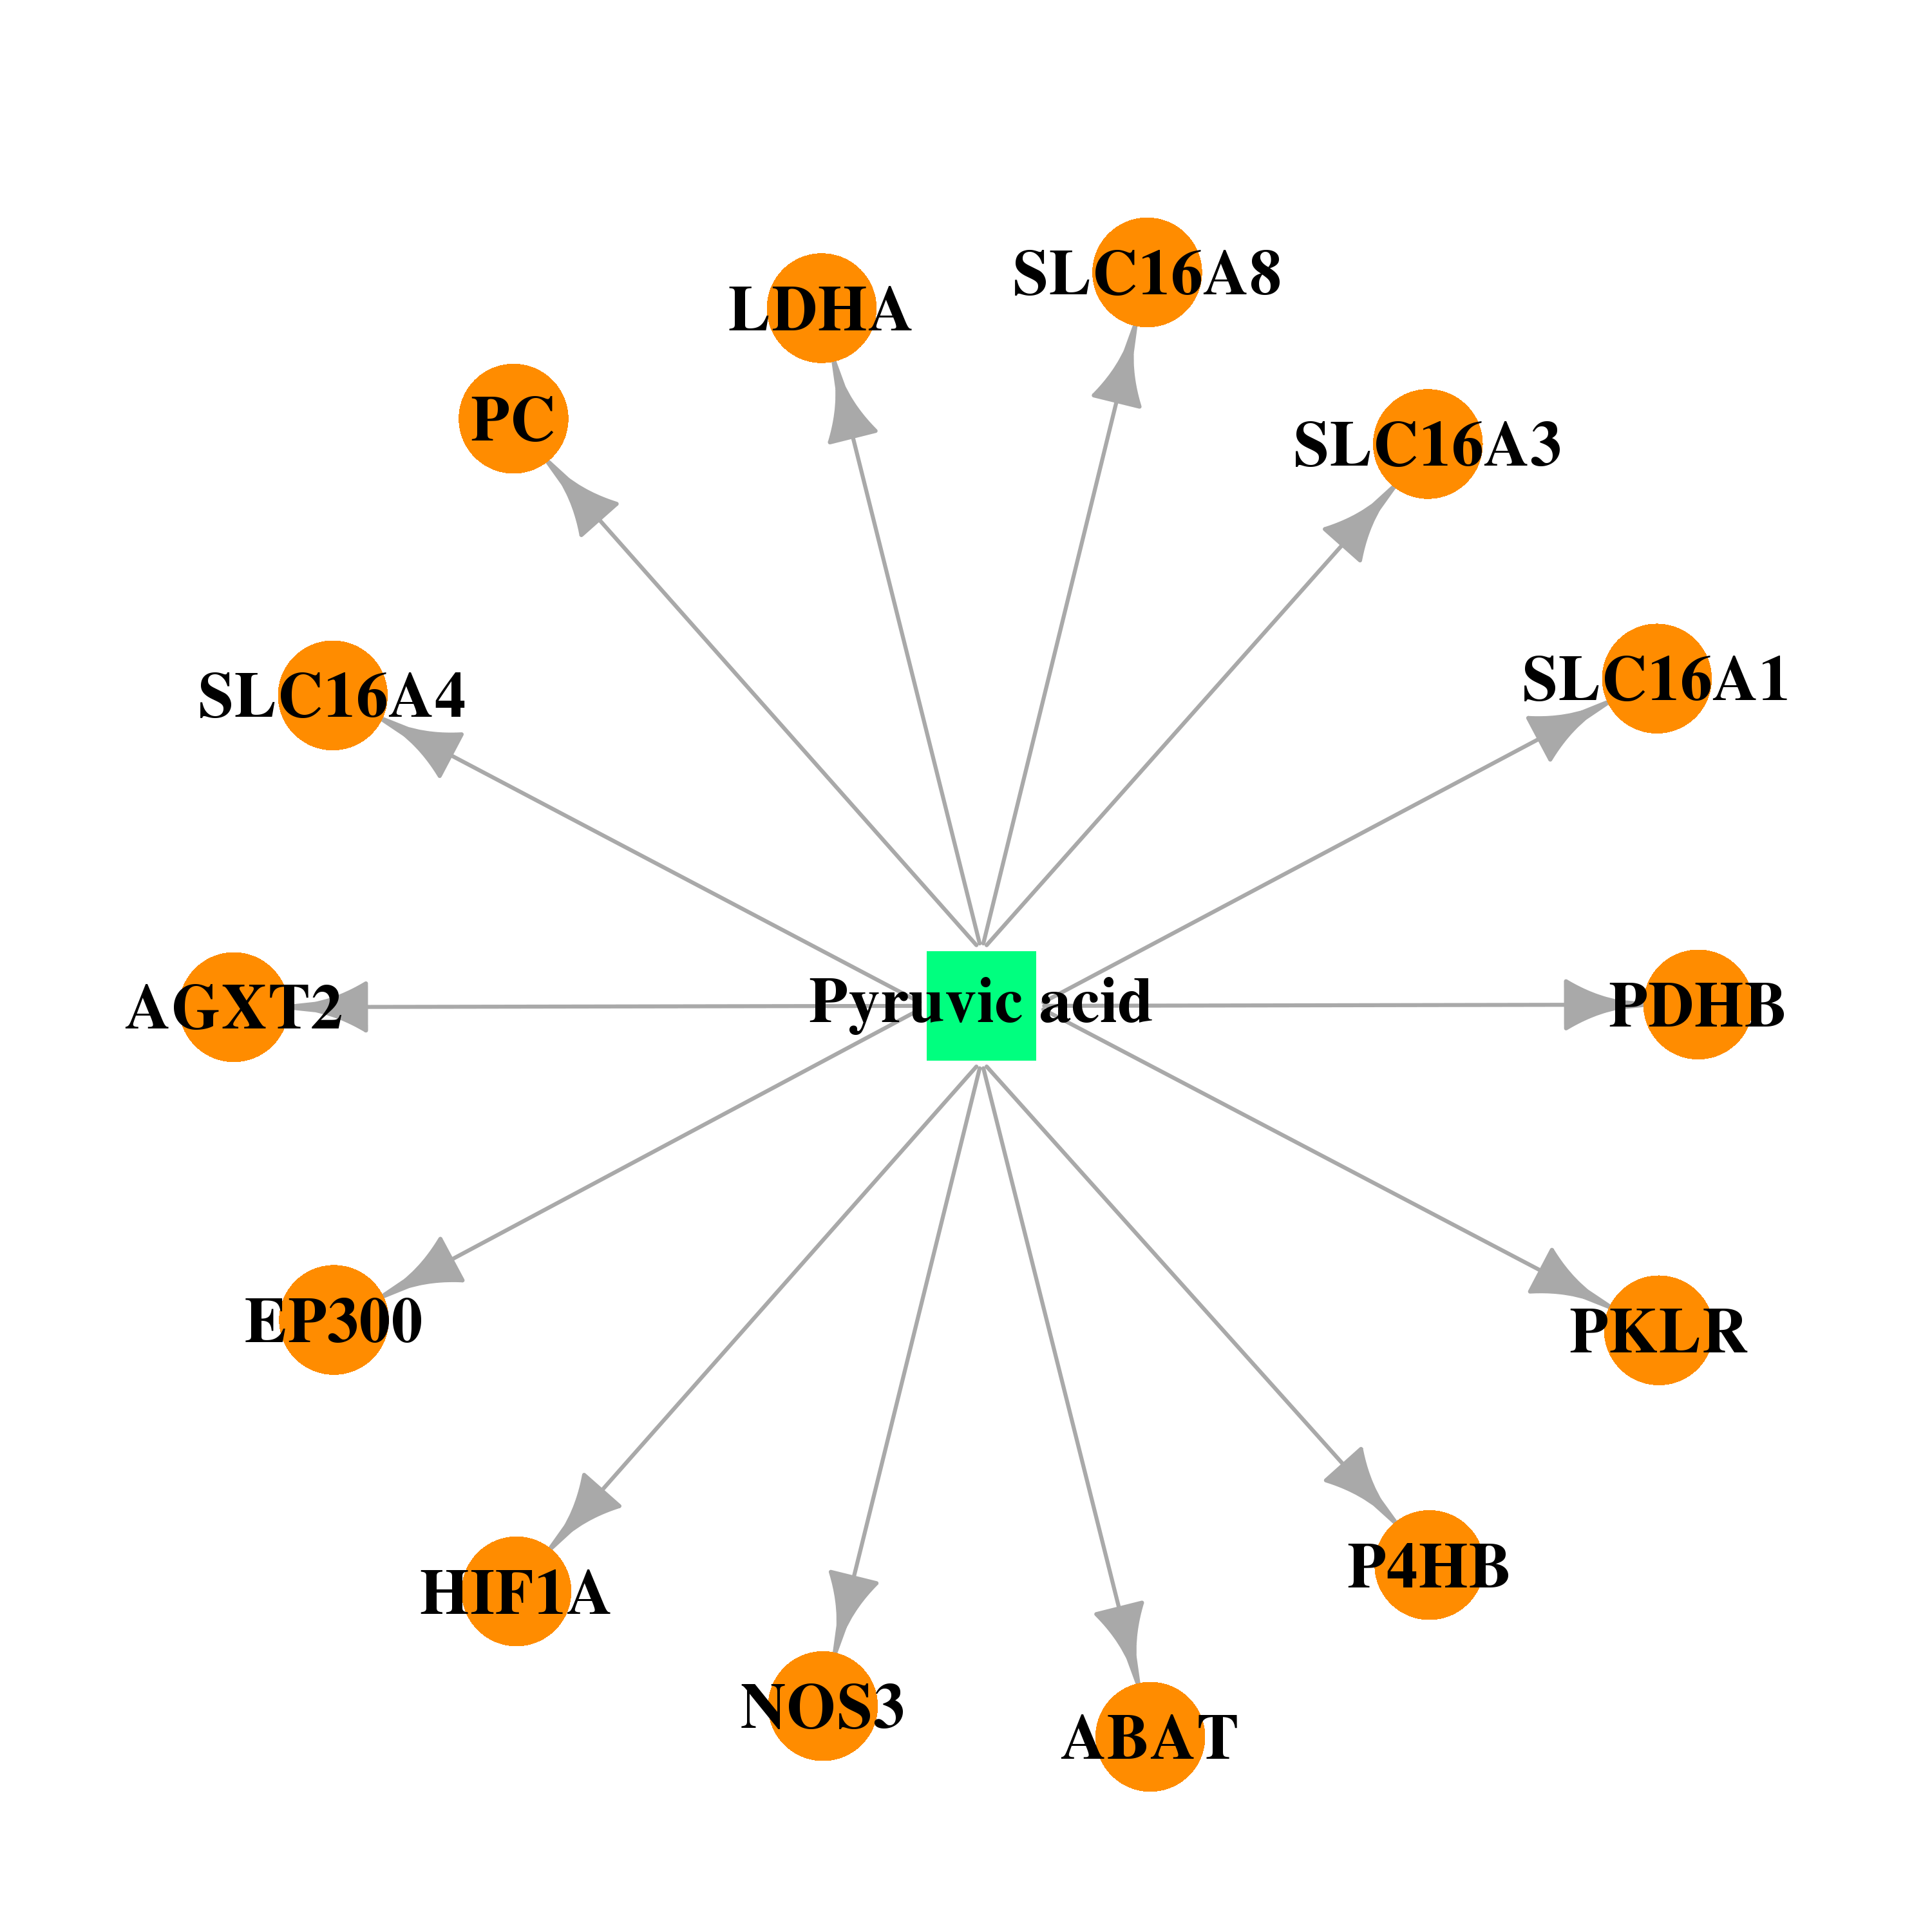 |  |
| DB00145 | alanine--glyoxylate aminotransferase 2 | approved; nutraceutical | Glycine |  |  |
| DB00160 | alanine--glyoxylate aminotransferase 2 | approved; nutraceutical | L-Alanine |  |  |
| Top |
| Cross referenced IDs for AGXT2 |
| * We obtained these cross-references from Uniprot database. It covers 150 different DBs, 18 categories. http://www.uniprot.org/help/cross_references_section |
: Open all cross reference information
|
Copyright © 2016-Present - The Univsersity of Texas Health Science Center at Houston @ |