|
|||||||||||||||||||||||||||||||||||||||||||||||||||||||||||||||||||||||||||||||||||||||||||||||||||||||||||||||||||||||||||||||||||||||||||||||||||||||||||||||||||||||||||||||||||||||||||||||||||||||||||||||||||||||||||||||||||||||||||||||||||||||||||||||||||||||||||||||||||||||||||||||||||||||||||||||||||||||||||||||||||||||||||||||||||
| |
| Phenotypic Information (metabolism pathway, cancer, disease, phenome) |
| |
| |
| Gene-Gene Network Information: Co-Expression Network, Interacting Genes & KEGG |
| |
|


| Gene Summary for SLC2A1 |
| Basic gene info. | Gene symbol | SLC2A1 |
| Gene name | solute carrier family 2 (facilitated glucose transporter), member 1 | |
| Synonyms | DYT17|DYT18|DYT9|EIG12|GLUT|GLUT-1|GLUT1|GLUT1DS|HTLVR|PED | |
| Cytomap | UCSC genome browser: 1p34.2 | |
| Genomic location | chr1 :43391045-43424847 | |
| Type of gene | protein-coding | |
| RefGenes | NM_006516.2, | |
| Ensembl id | ENSG00000117394 | |
| Description | glucose transporter type 1, erythrocyte/brainhepG2 glucose transporterhuman T-cell leukemia virus (I and II) receptorreceptor for HTLV-1 and HTLV-2solute carrier family 2, facilitated glucose transporter member 1 | |
| Modification date | 20141222 | |
| dbXrefs | MIM : 138140 | |
| MIM : 143090 | ||
| HGNC : HGNC | ||
| Ensembl : ENSG00000117394 | ||
| HPRD : 00683 | ||
| Vega : OTTHUMG00000007657 | ||
| Protein | UniProt: go to UniProt's Cross Reference DB Table | |
| Expression | CleanEX: HS_SLC2A1 | |
| BioGPS: 6513 | ||
| Gene Expression Atlas: ENSG00000117394 | ||
| The Human Protein Atlas: ENSG00000117394 | ||
| Pathway | NCI Pathway Interaction Database: SLC2A1 | |
| KEGG: SLC2A1 | ||
| REACTOME: SLC2A1 | ||
| ConsensusPathDB | ||
| Pathway Commons: SLC2A1 | ||
| Metabolism | MetaCyc: SLC2A1 | |
| HUMANCyc: SLC2A1 | ||
| Regulation | Ensembl's Regulation: ENSG00000117394 | |
| miRBase: chr1 :43,391,045-43,424,847 | ||
| TargetScan: NM_006516 | ||
| cisRED: ENSG00000117394 | ||
| Context | iHOP: SLC2A1 | |
| cancer metabolism search in PubMed: SLC2A1 | ||
| UCL Cancer Institute: SLC2A1 | ||
| Assigned class in ccmGDB | A - This gene has a literature evidence and it belongs to cancer gene. | |
| References showing role of SLC2A1 in cancer cell metabolism | 1. Ooi AT, Gomperts BN (2015) Molecular Pathways: Targeting Cellular Energy Metabolism in Cancer via Inhibition of SLC2A1 and LDHA. Clin Cancer Res 21: 2440-2444. doi: 10.1158/1078-0432.CCR-14-1209. pmid: 4452440. go to article 2. Grimm M, Munz A, Teriete P, Nadtotschi T, Reinert S (2014) GLUT-1(+)/TKTL1(+) coexpression predicts poor outcome in oral squamous cell carcinoma. Oral Surg Oral Med Oral Pathol Oral Radiol 117: 743-753. doi: 10.1016/j.oooo.2014.02.007. go to article 3. Lopez-Serra P, Marcilla M, Villanueva A, Ramos-Fernandez A, Palau A, et al. (2014) A DERL3-associated defect in the degradation of SLC2A1 mediates the Warburg effect. Nat Commun 5: 3608. doi: 10.1038/ncomms4608. pmid: 3988805. go to article 4. Wang YD, Li SJ, Liao JX (2013) Inhibition of glucose transporter 1 (GLUT1) chemosensitized head and neck cancer cells to cisplatin. Technol Cancer Res Treat 12: 525-535. doi: 10.7785/tcrt.2012.500343. go to article | |
| Top |
| Phenotypic Information for SLC2A1(metabolism pathway, cancer, disease, phenome) |
| Cancer | CGAP: SLC2A1 |
| Familial Cancer Database: SLC2A1 | |
| * This gene is included in those cancer gene databases. |
|
|
|
|
|
|
| |||||||||||||||||||||||||||||||||||||||||||||||||||||||||||||||||||||||||||||||||||||||||||||||||||||||||||||||||||||||||||||||||||||||||||||||||||||||||||||||||||||||||||||||||||||||||||||||||||||||||||||||||||||||||||||||||||||||||||||||||||||||||||||||||||||||||||||||||||||||||||||||||||||||||||||||||||||||||||||||||||||||||||||
Oncogene 1 | Significant driver gene in | ||||||||||||||||||||||||||||||||||||||||||||||||||||||||||||||||||||||||||||||||||||||||||||||||||||||||||||||||||||||||||||||||||||||||||||||||||||||||||||||||||||||||||||||||||||||||||||||||||||||||||||||||||||||||||||||||||||||||||||||||||||||||||||||||||||||||||||||||||||||||||||||||||||||||||||||||||||||||||||||||||||||||||||||||||
| cf) number; DB name 1 Oncogene; http://nar.oxfordjournals.org/content/35/suppl_1/D721.long, 2 Tumor Suppressor gene; https://bioinfo.uth.edu/TSGene/, 3 Cancer Gene Census; http://www.nature.com/nrc/journal/v4/n3/abs/nrc1299.html, 4 CancerGenes; http://nar.oxfordjournals.org/content/35/suppl_1/D721.long, 5 Network of Cancer Gene; http://ncg.kcl.ac.uk/index.php, 1Therapeutic Vulnerabilities in Cancer; http://cbio.mskcc.org/cancergenomics/statius/ |
| REACTOME_METABOLISM_OF_VITAMINS_AND_COFACTORS REACTOME_INTEGRATION_OF_ENERGY_METABOLISM REACTOME_METABOLISM_OF_CARBOHYDRATES | |
| OMIM | |
| Orphanet | |
| Disease | KEGG Disease: SLC2A1 |
| MedGen: SLC2A1 (Human Medical Genetics with Condition) | |
| ClinVar: SLC2A1 | |
| Phenotype | MGI: SLC2A1 (International Mouse Phenotyping Consortium) |
| PhenomicDB: SLC2A1 | |
| Mutations for SLC2A1 |
| * Under tables are showing count per each tissue to give us broad intuition about tissue specific mutation patterns.You can go to the detailed page for each mutation database's web site. |
| There's no structural variation information in COSMIC data for this gene. |
| * From mRNA Sanger sequences, Chitars2.0 arranged chimeric transcripts. This table shows SLC2A1 related fusion information. |
| ID | Head Gene | Tail Gene | Accession | Gene_a | qStart_a | qEnd_a | Chromosome_a | tStart_a | tEnd_a | Gene_a | qStart_a | qEnd_a | Chromosome_a | tStart_a | tEnd_a |
| AW366615 | ACTR1A | 1 | 98 | 10 | 104240498 | 104240595 | SLC2A1 | 93 | 176 | 1 | 43396338 | 43396424 | |
| AW856224 | PERP | 35 | 285 | 6 | 138413330 | 138428298 | SLC2A1 | 279 | 515 | 1 | 43393319 | 43394674 | |
| AW352237 | SLC2A1 | 1 | 89 | 1 | 43406854 | 43406943 | ATN1 | 81 | 248 | 12 | 7047661 | 7047828 | |
| BE828104 | BLMH | 1 | 91 | 17 | 28576084 | 28576174 | SLC2A1 | 87 | 372 | 1 | 43406768 | 43407053 | |
| Top |
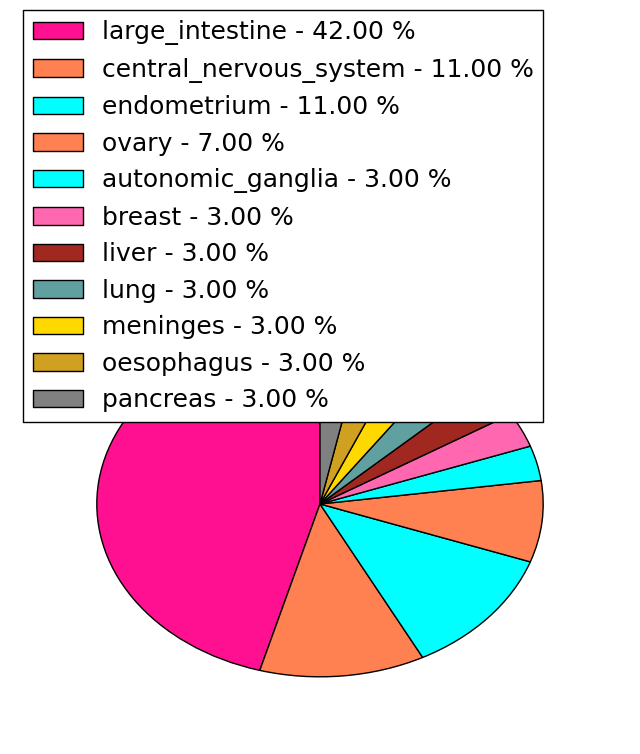
| Mutation type/ Tissue ID | brca | cns | cerv | endome | haematopo | kidn | Lintest | liver | lung | ns | ovary | pancre | prost | skin | stoma | thyro | urina | |||
| Total # sample | 1 | 1 | 1 | |||||||||||||||||
| GAIN (# sample) | 1 | 1 | 1 | |||||||||||||||||
| LOSS (# sample) |
| cf) Tissue ID; Tissue type (1; Breast, 2; Central_nervous_system, 3; Cervix, 4; Endometrium, 5; Haematopoietic_and_lymphoid_tissue, 6; Kidney, 7; Large_intestine, 8; Liver, 9; Lung, 10; NS, 11; Ovary, 12; Pancreas, 13; Prostate, 14; Skin, 15; Stomach, 16; Thyroid, 17; Urinary_tract) |
| Top |
|
 |
| Top |
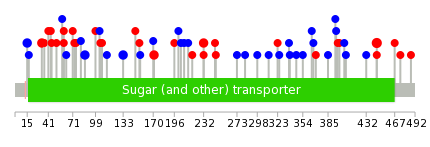
| Stat. for Non-Synonymous SNVs (# total SNVs=26) | (# total SNVs=19) |
 |  |
(# total SNVs=0) | (# total SNVs=0) |
| Top |
| * When you move the cursor on each content, you can see more deailed mutation information on the Tooltip. Those are primary_site,primary_histology,mutation(aa),pubmedID. |
| GRCh37 position | Mutation(aa) | Unique sampleID count |
| chr1:43392858-43392858 | p.F445L | 3 |
| chr1:43408966-43408966 | p.A15A | 2 |
| chr1:43396302-43396302 | p.A171T | 2 |
| chr1:43396734-43396734 | p.F86F | 2 |
| chr1:43395437-43395437 | p.R232C | 2 |
| chr1:43408914-43408914 | p.I33L | 2 |
| chr1:43396414-43396414 | p.C133C | 2 |
| chr1:43394886-43394886 | p.V323M | 1 |
| chr1:43396803-43396803 | p.T63T | 1 |
| chr1:43392792-43392792 | p.F467L | 1 |
| Top |
|
 |
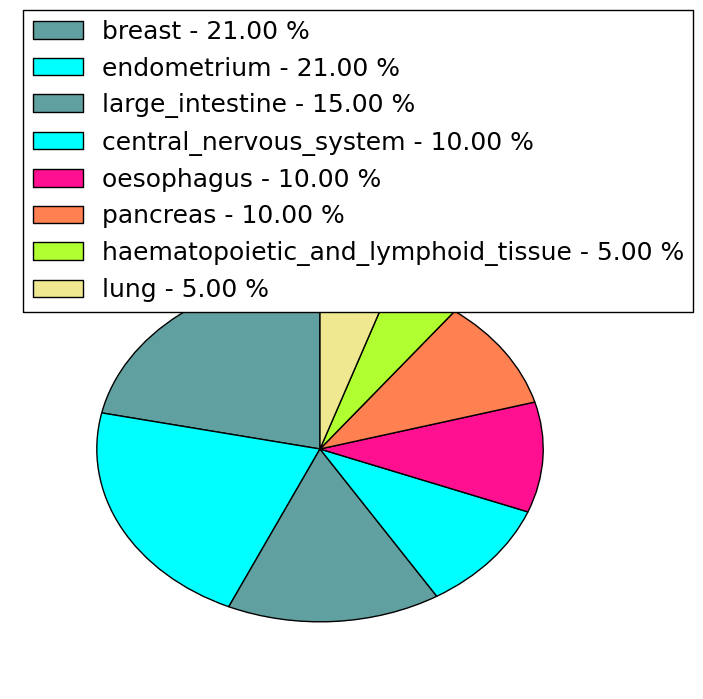
| Point Mutation/ Tissue ID | 1 | 2 | 3 | 4 | 5 | 6 | 7 | 8 | 9 | 10 | 11 | 12 | 13 | 14 | 15 | 16 | 17 | 18 | 19 | 20 |
| # sample | 3 | 2 | 1 | 7 | 3 | 2 | 1 | 1 | 2 | 10 | 10 | 7 | ||||||||
| # mutation | 4 | 2 | 1 | 6 | 3 | 2 | 1 | 1 | 2 | 10 | 10 | 7 | ||||||||
| nonsynonymous SNV | 3 | 1 | 6 | 2 | 2 | 1 | 2 | 3 | 5 | 3 | ||||||||||
| synonymous SNV | 1 | 2 | 1 | 1 | 7 | 5 | 4 |
| cf) Tissue ID; Tissue type (1; BLCA[Bladder Urothelial Carcinoma], 2; BRCA[Breast invasive carcinoma], 3; CESC[Cervical squamous cell carcinoma and endocervical adenocarcinoma], 4; COAD[Colon adenocarcinoma], 5; GBM[Glioblastoma multiforme], 6; Glioma Low Grade, 7; HNSC[Head and Neck squamous cell carcinoma], 8; KICH[Kidney Chromophobe], 9; KIRC[Kidney renal clear cell carcinoma], 10; KIRP[Kidney renal papillary cell carcinoma], 11; LAML[Acute Myeloid Leukemia], 12; LUAD[Lung adenocarcinoma], 13; LUSC[Lung squamous cell carcinoma], 14; OV[Ovarian serous cystadenocarcinoma ], 15; PAAD[Pancreatic adenocarcinoma], 16; PRAD[Prostate adenocarcinoma], 17; SKCM[Skin Cutaneous Melanoma], 18:STAD[Stomach adenocarcinoma], 19:THCA[Thyroid carcinoma], 20:UCEC[Uterine Corpus Endometrial Carcinoma]) |
| Top |
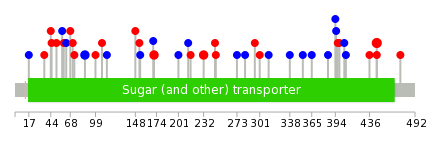
| * We represented just top 10 SNVs. When you move the cursor on each content, you can see more deailed mutation information on the Tooltip. Those are primary_site, primary_histology, mutation(aa), pubmedID. |
| Genomic Position | Mutation(aa) | Unique sampleID count |
| chr1:43392858 | p.F445L | 3 |
| chr1:43396302 | p.R232C | 2 |
| chr1:43395437 | p.A171T | 2 |
| chr1:43396734 | p.F86F | 2 |
| chr1:43395620 | p.A407A | 1 |
| chr1:43392885 | p.E246K | 1 |
| chr1:43396779 | p.S68L | 1 |
| chr1:43394917 | p.A405A | 1 |
| chr1:43393333 | p.T63T | 1 |
| chr1:43396789 | p.P399Q | 1 |
| * Copy number data were extracted from TCGA using R package TCGA-Assembler. The URLs of all public data files on TCGA DCC data server were gathered on Jan-05-2015. Function ProcessCNAData in TCGA-Assembler package was used to obtain gene-level copy number value which is calculated as the average copy number of the genomic region of a gene. |
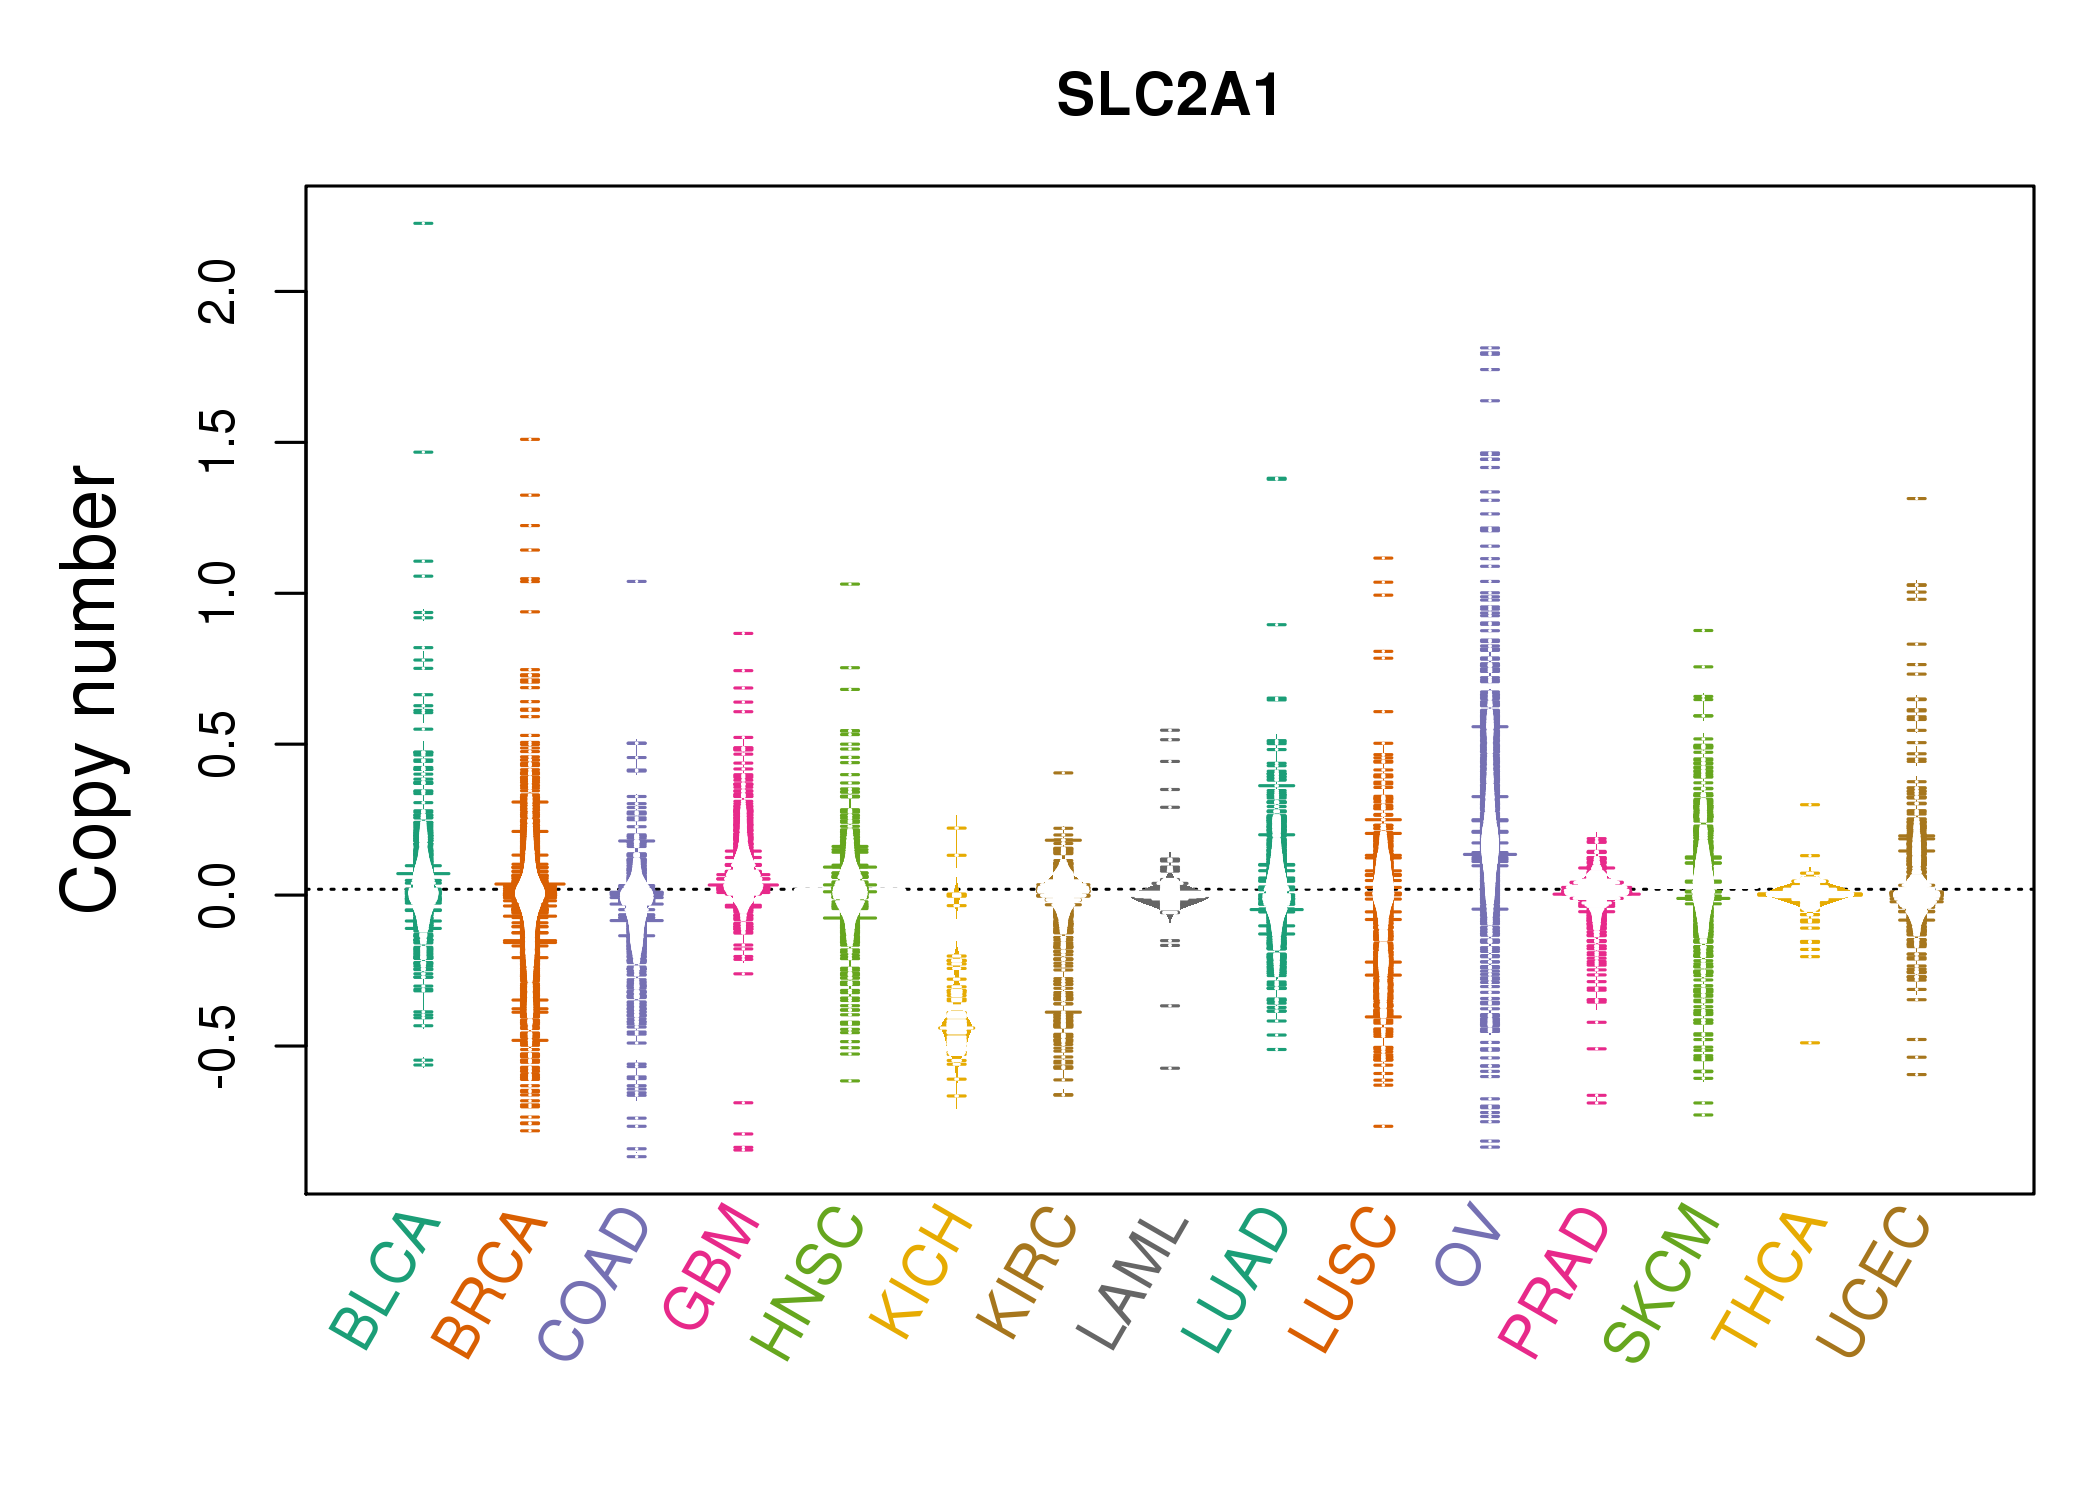 |
| cf) Tissue ID[Tissue type]: BLCA[Bladder Urothelial Carcinoma], BRCA[Breast invasive carcinoma], CESC[Cervical squamous cell carcinoma and endocervical adenocarcinoma], COAD[Colon adenocarcinoma], GBM[Glioblastoma multiforme], Glioma Low Grade, HNSC[Head and Neck squamous cell carcinoma], KICH[Kidney Chromophobe], KIRC[Kidney renal clear cell carcinoma], KIRP[Kidney renal papillary cell carcinoma], LAML[Acute Myeloid Leukemia], LUAD[Lung adenocarcinoma], LUSC[Lung squamous cell carcinoma], OV[Ovarian serous cystadenocarcinoma ], PAAD[Pancreatic adenocarcinoma], PRAD[Prostate adenocarcinoma], SKCM[Skin Cutaneous Melanoma], STAD[Stomach adenocarcinoma], THCA[Thyroid carcinoma], UCEC[Uterine Corpus Endometrial Carcinoma] |
| Top |
| Gene Expression for SLC2A1 |
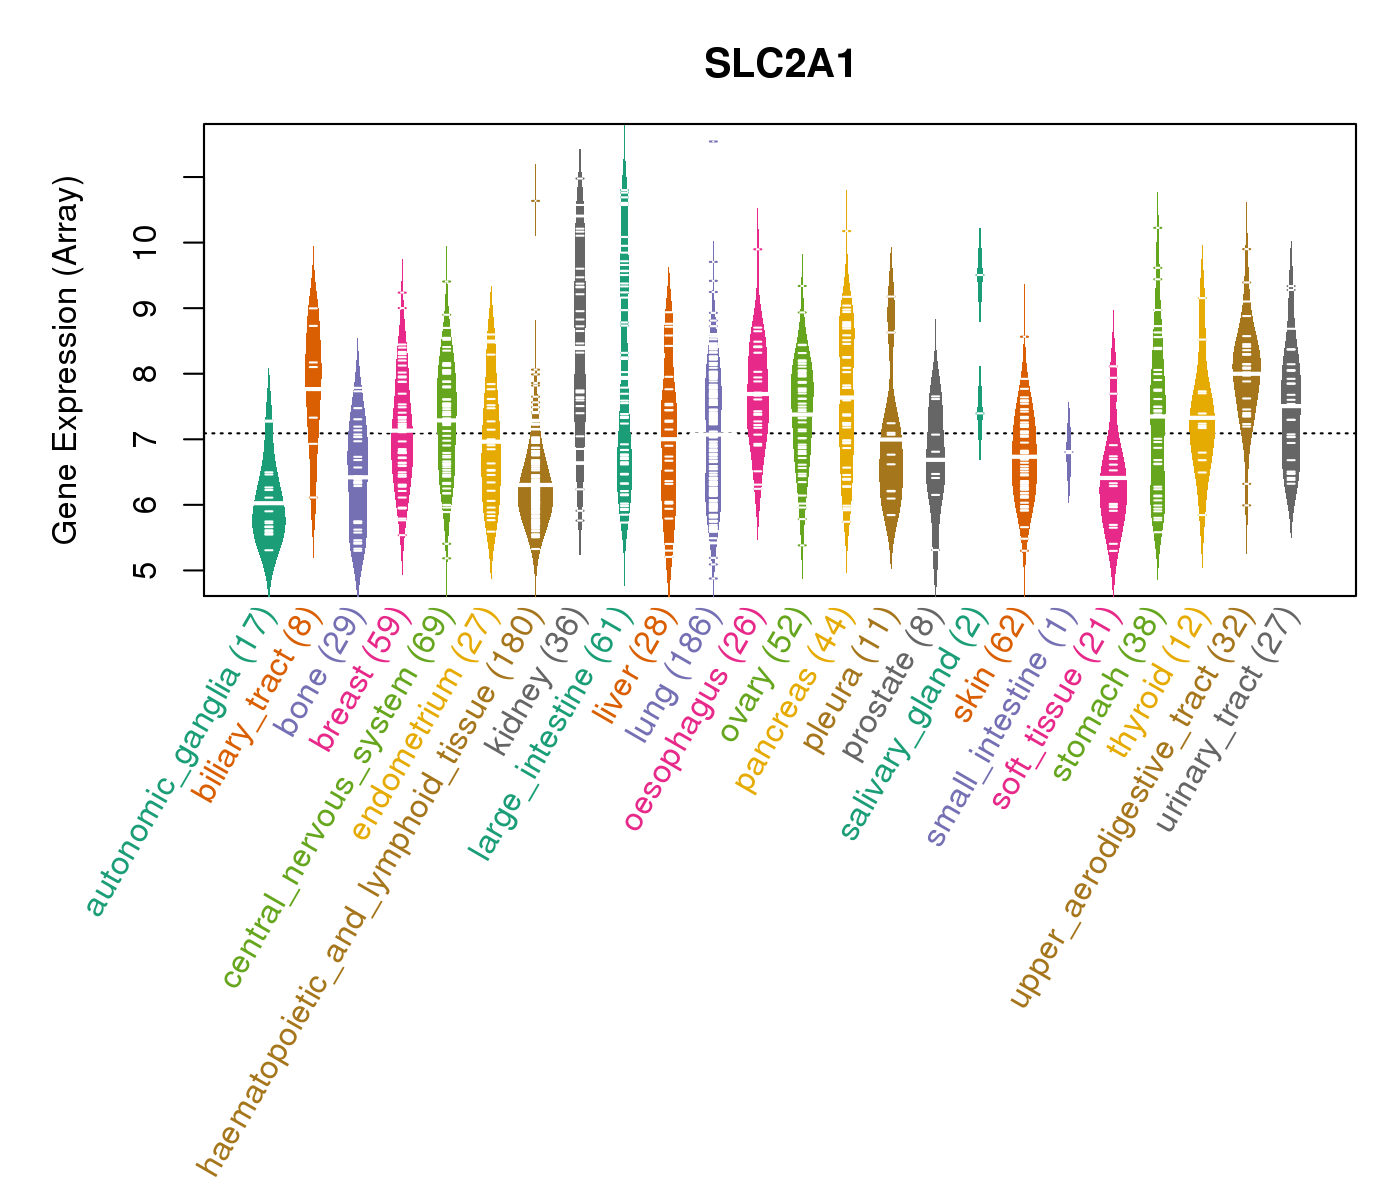
| * CCLE gene expression data were extracted from CCLE_Expression_Entrez_2012-10-18.res: Gene-centric RMA-normalized mRNA expression data. |
 |
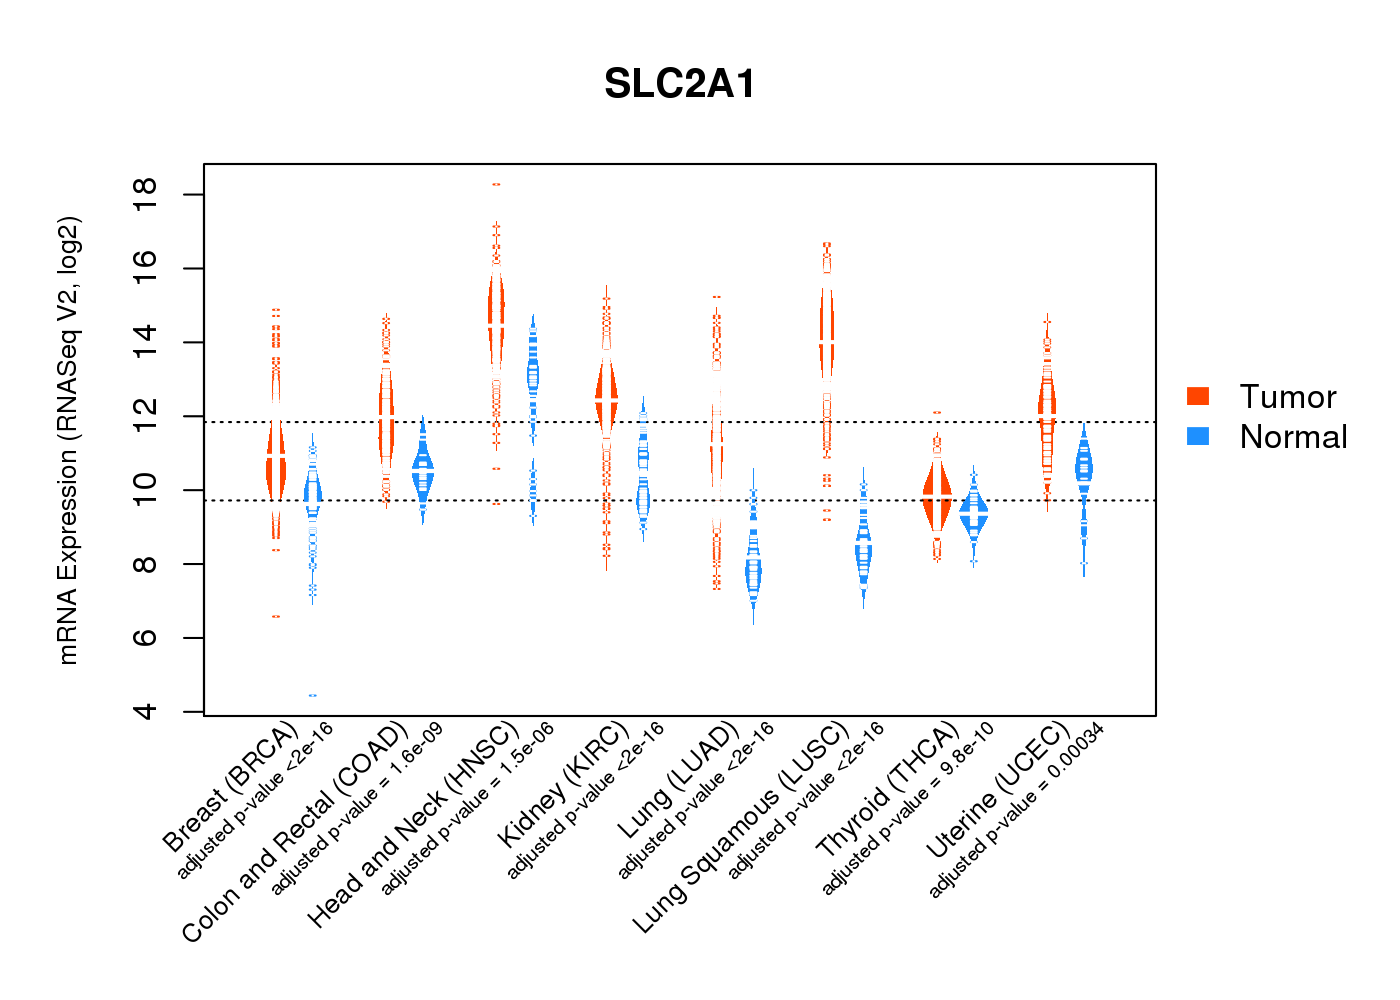
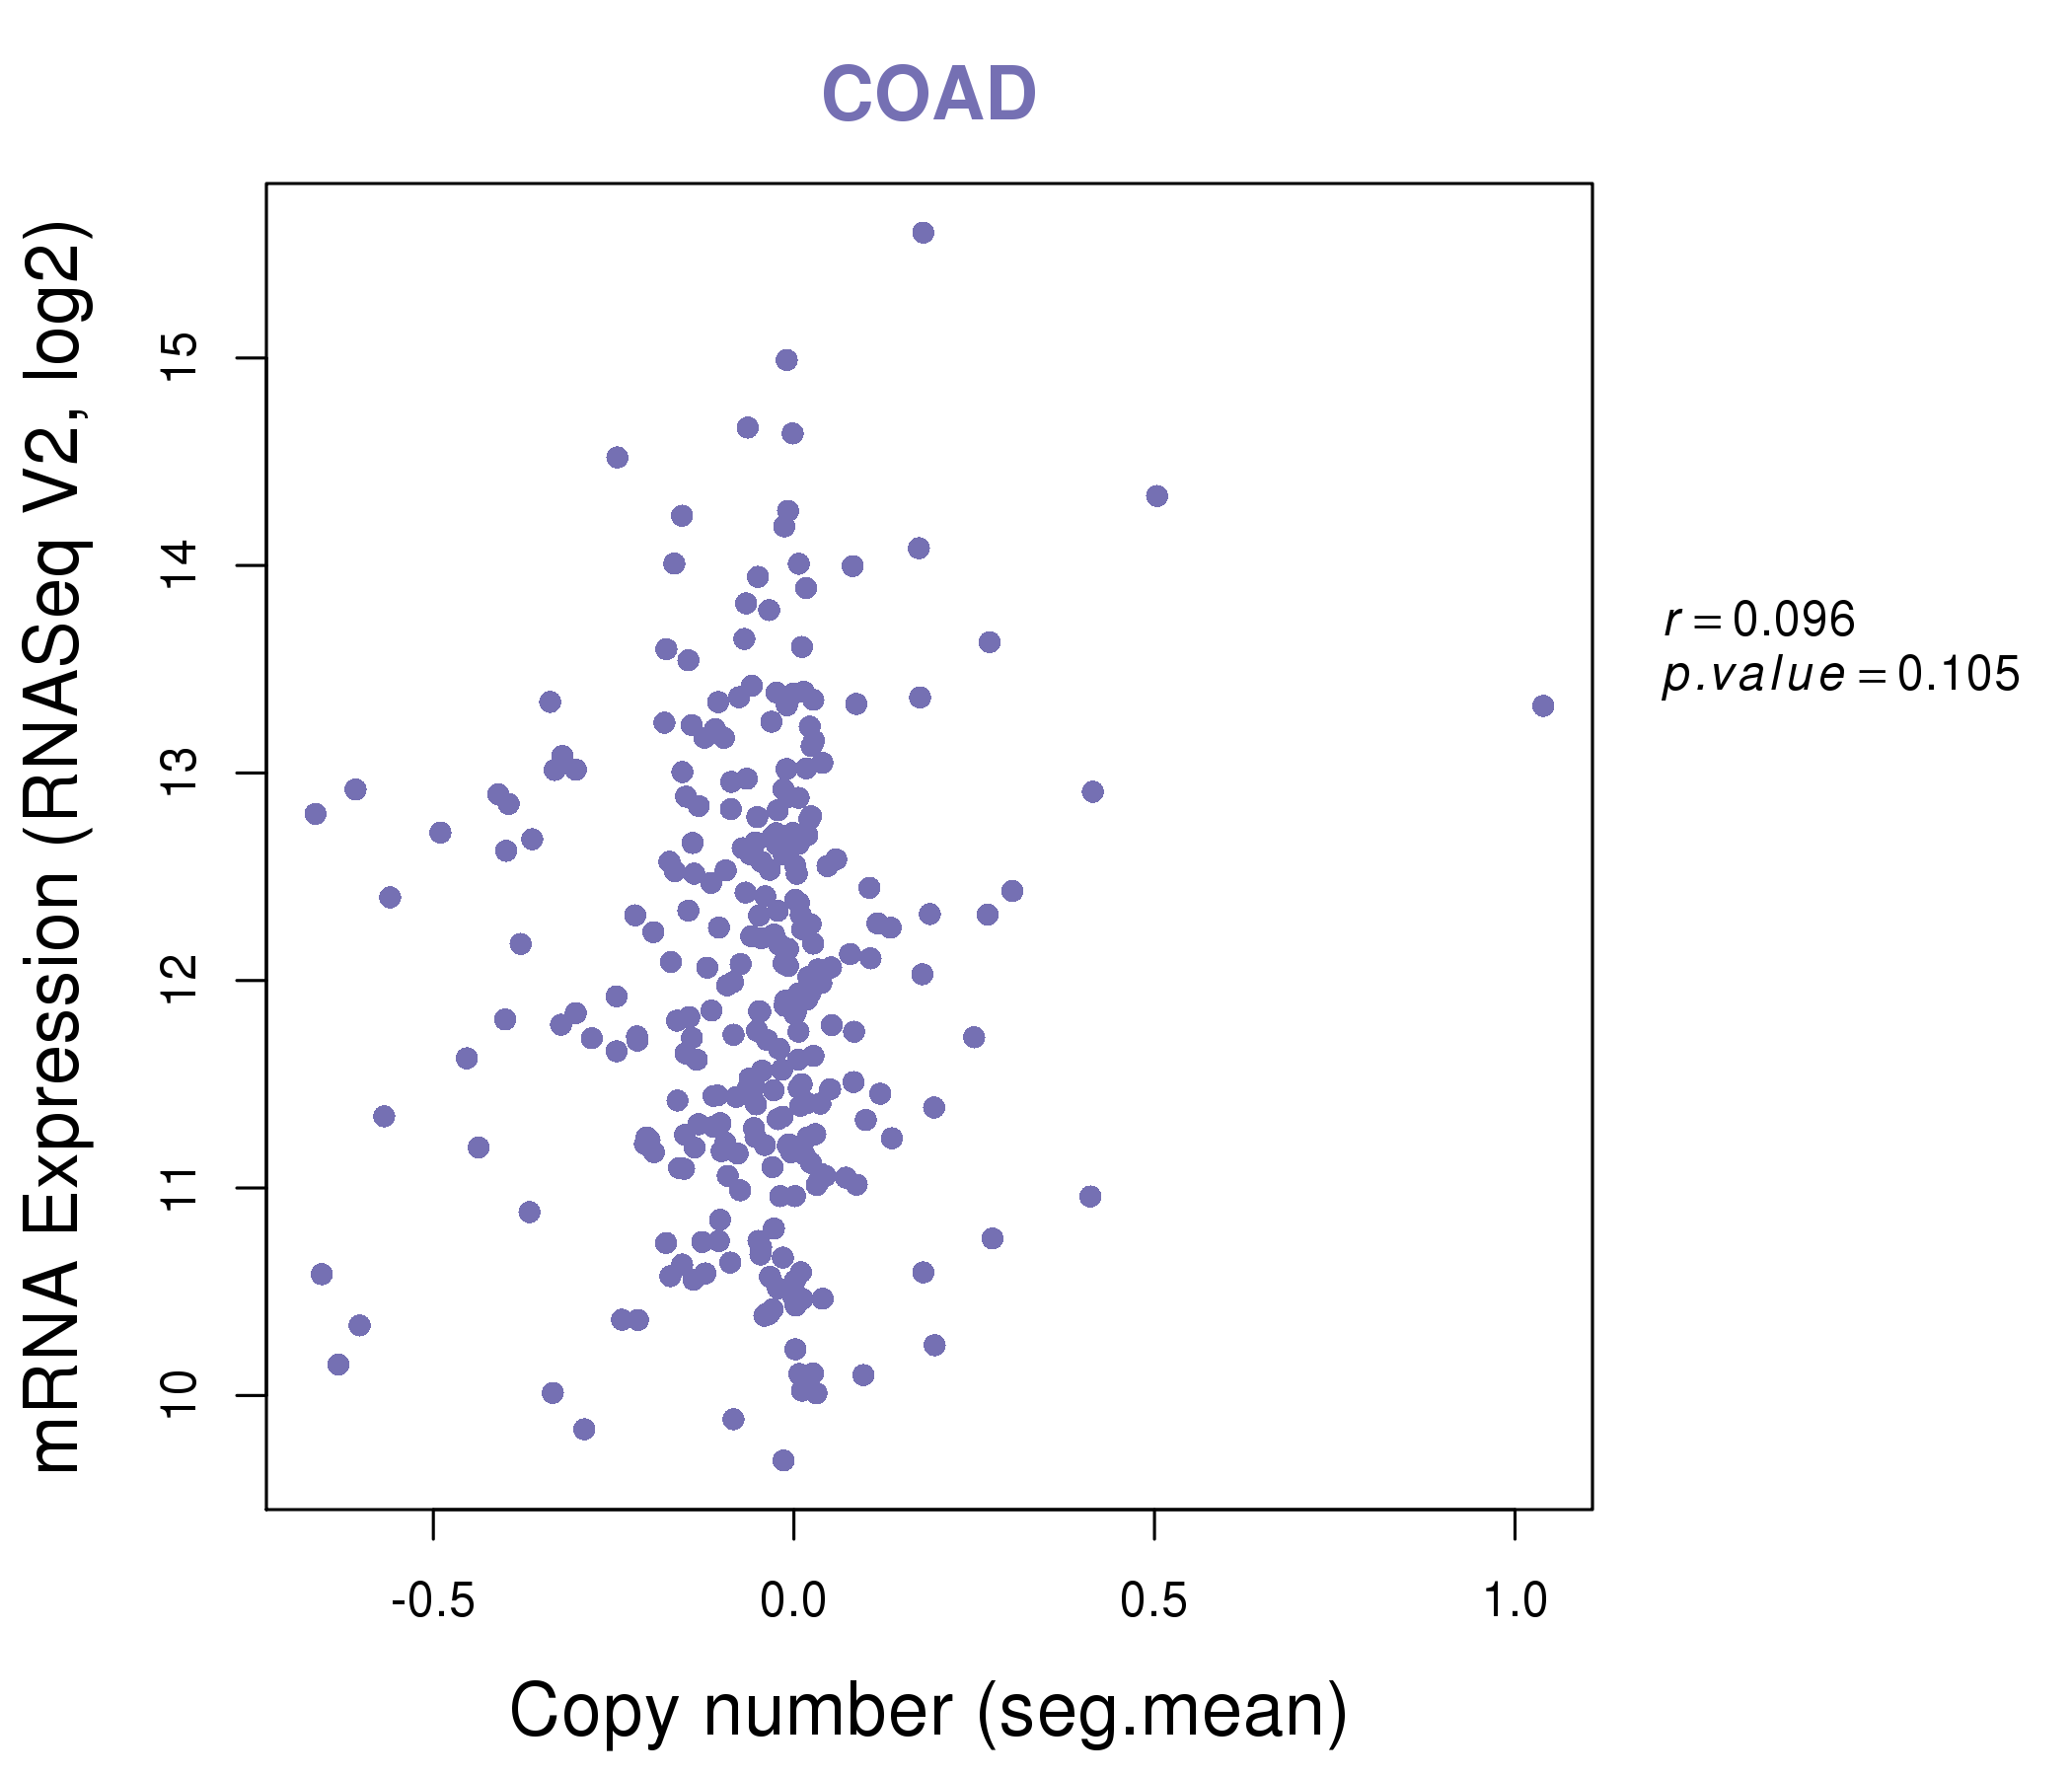
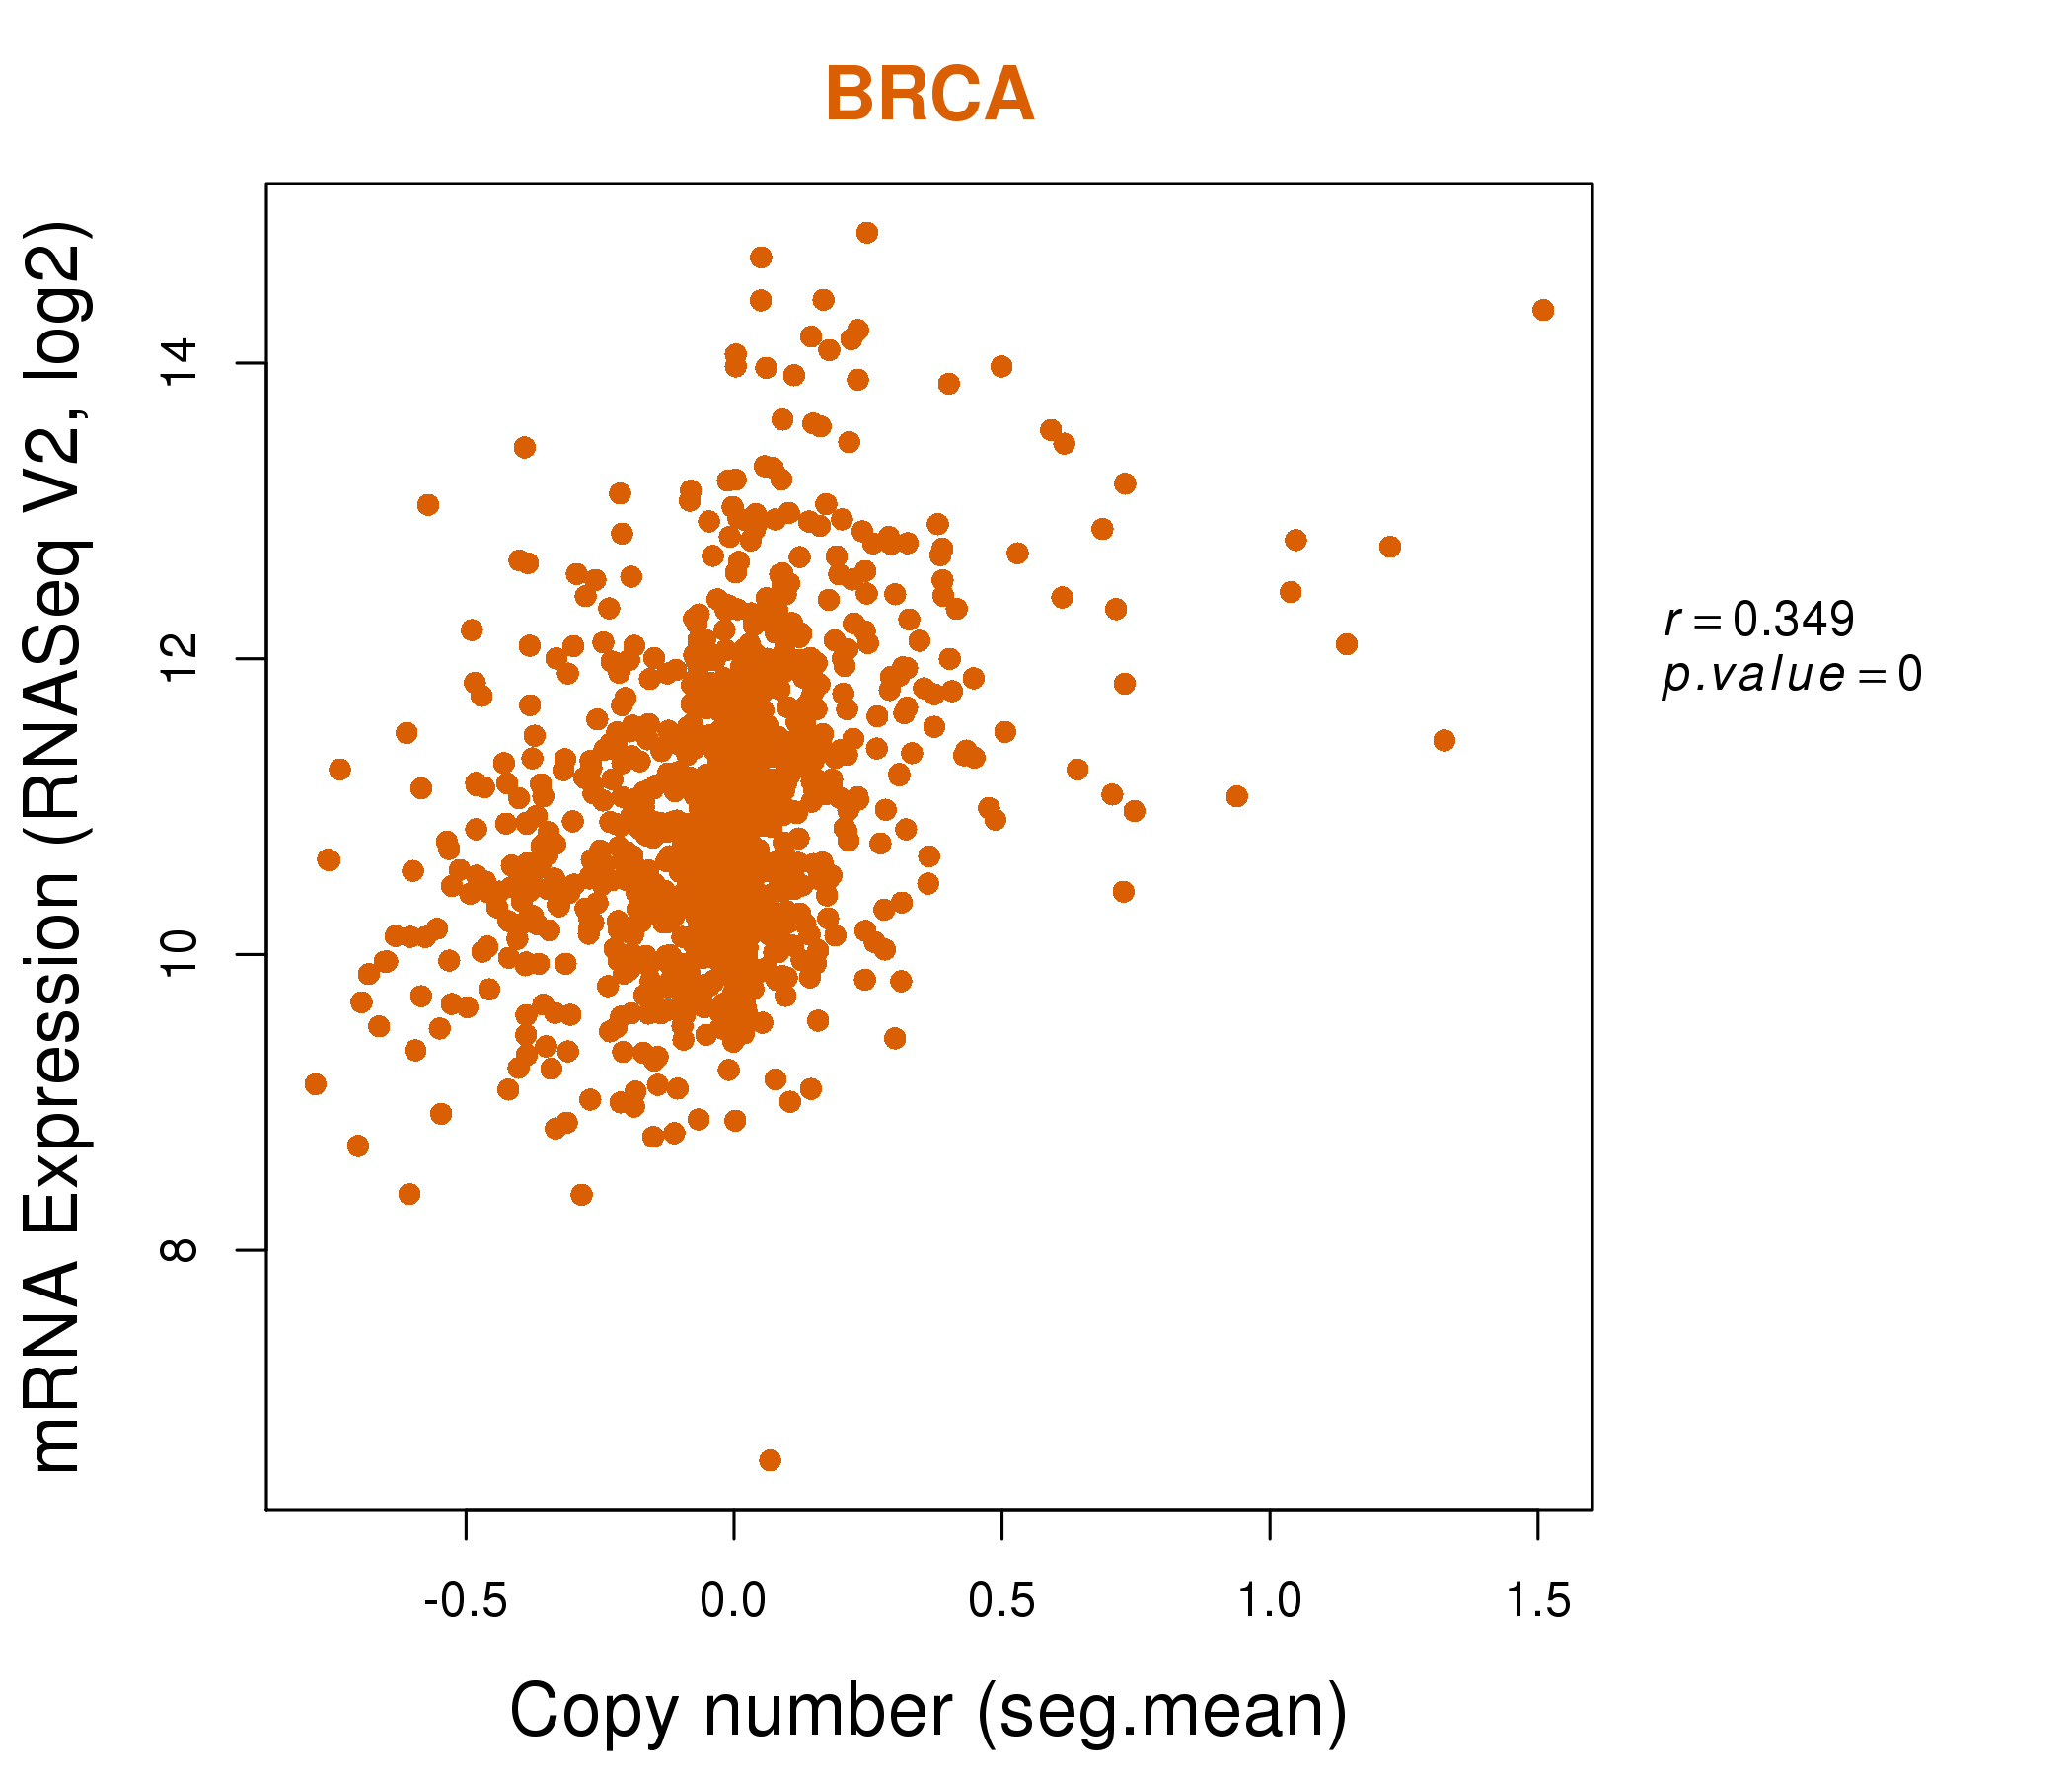
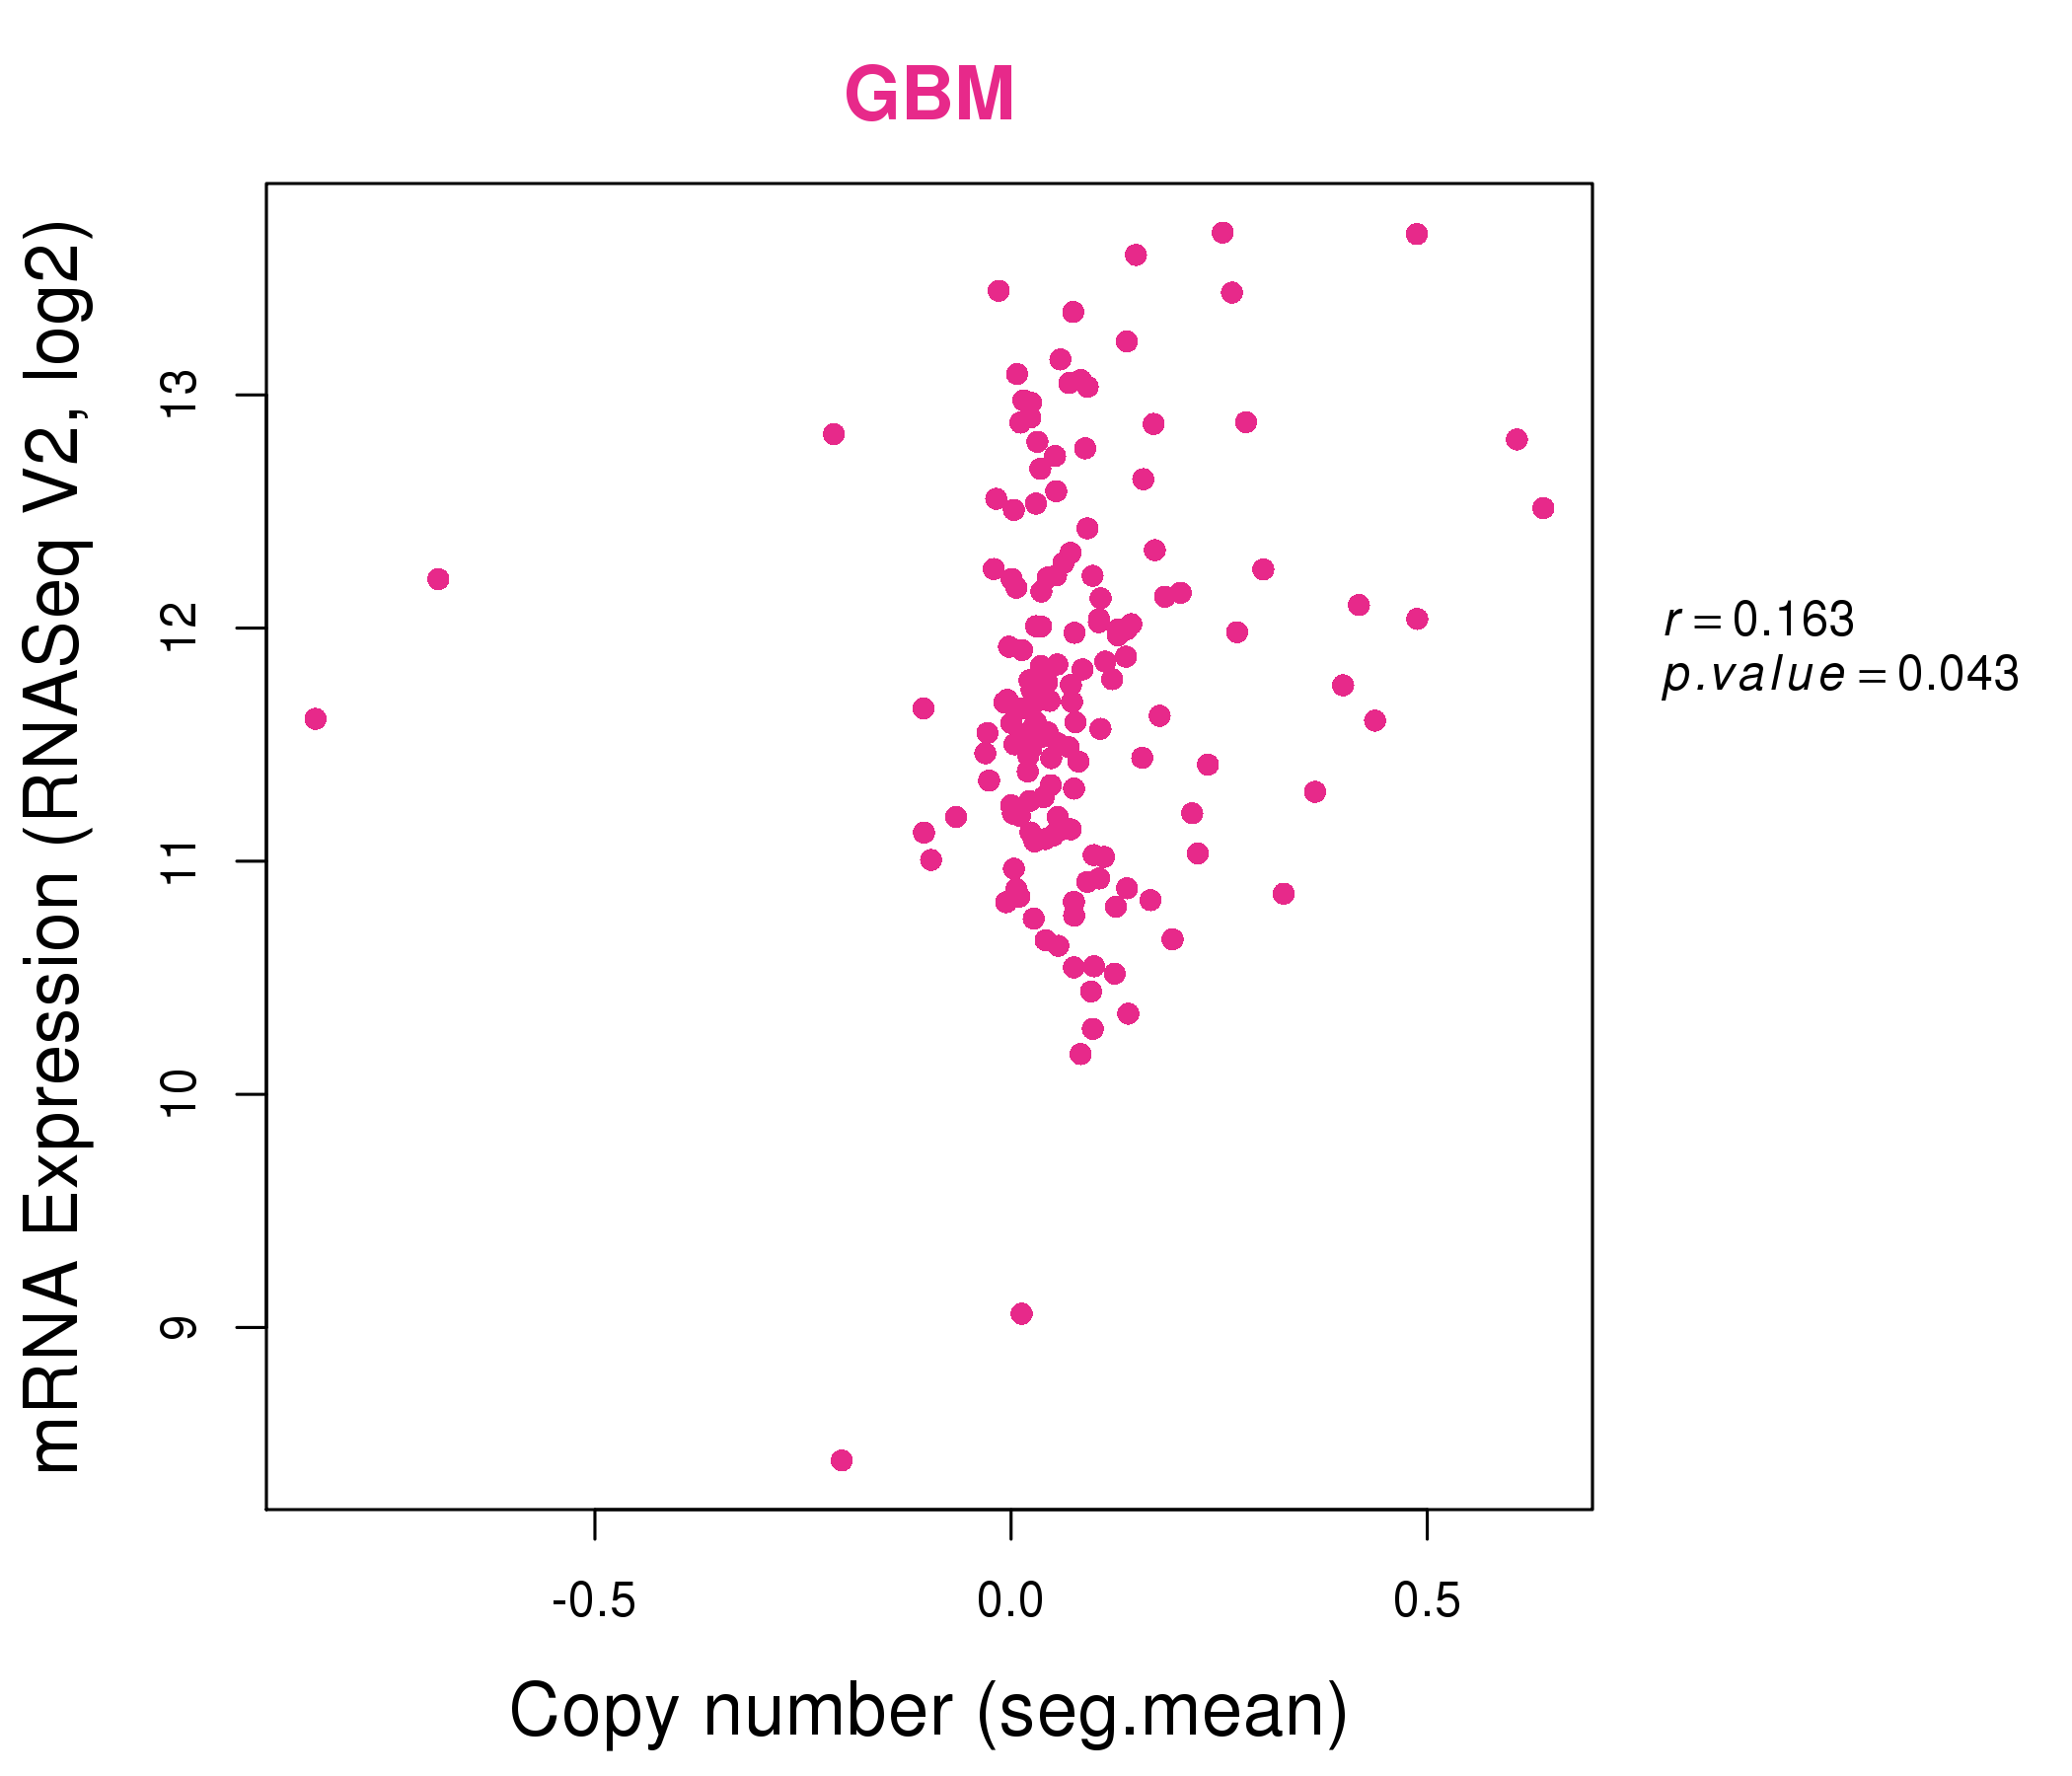
| * Normalized gene expression data of RNASeqV2 was extracted from TCGA using R package TCGA-Assembler. The URLs of all public data files on TCGA DCC data server were gathered at Jan-05-2015. Only eight cancer types have enough normal control samples for differential expression analysis. (t test, adjusted p<0.05 (using Benjamini-Hochberg FDR)) |
 |
| Top |
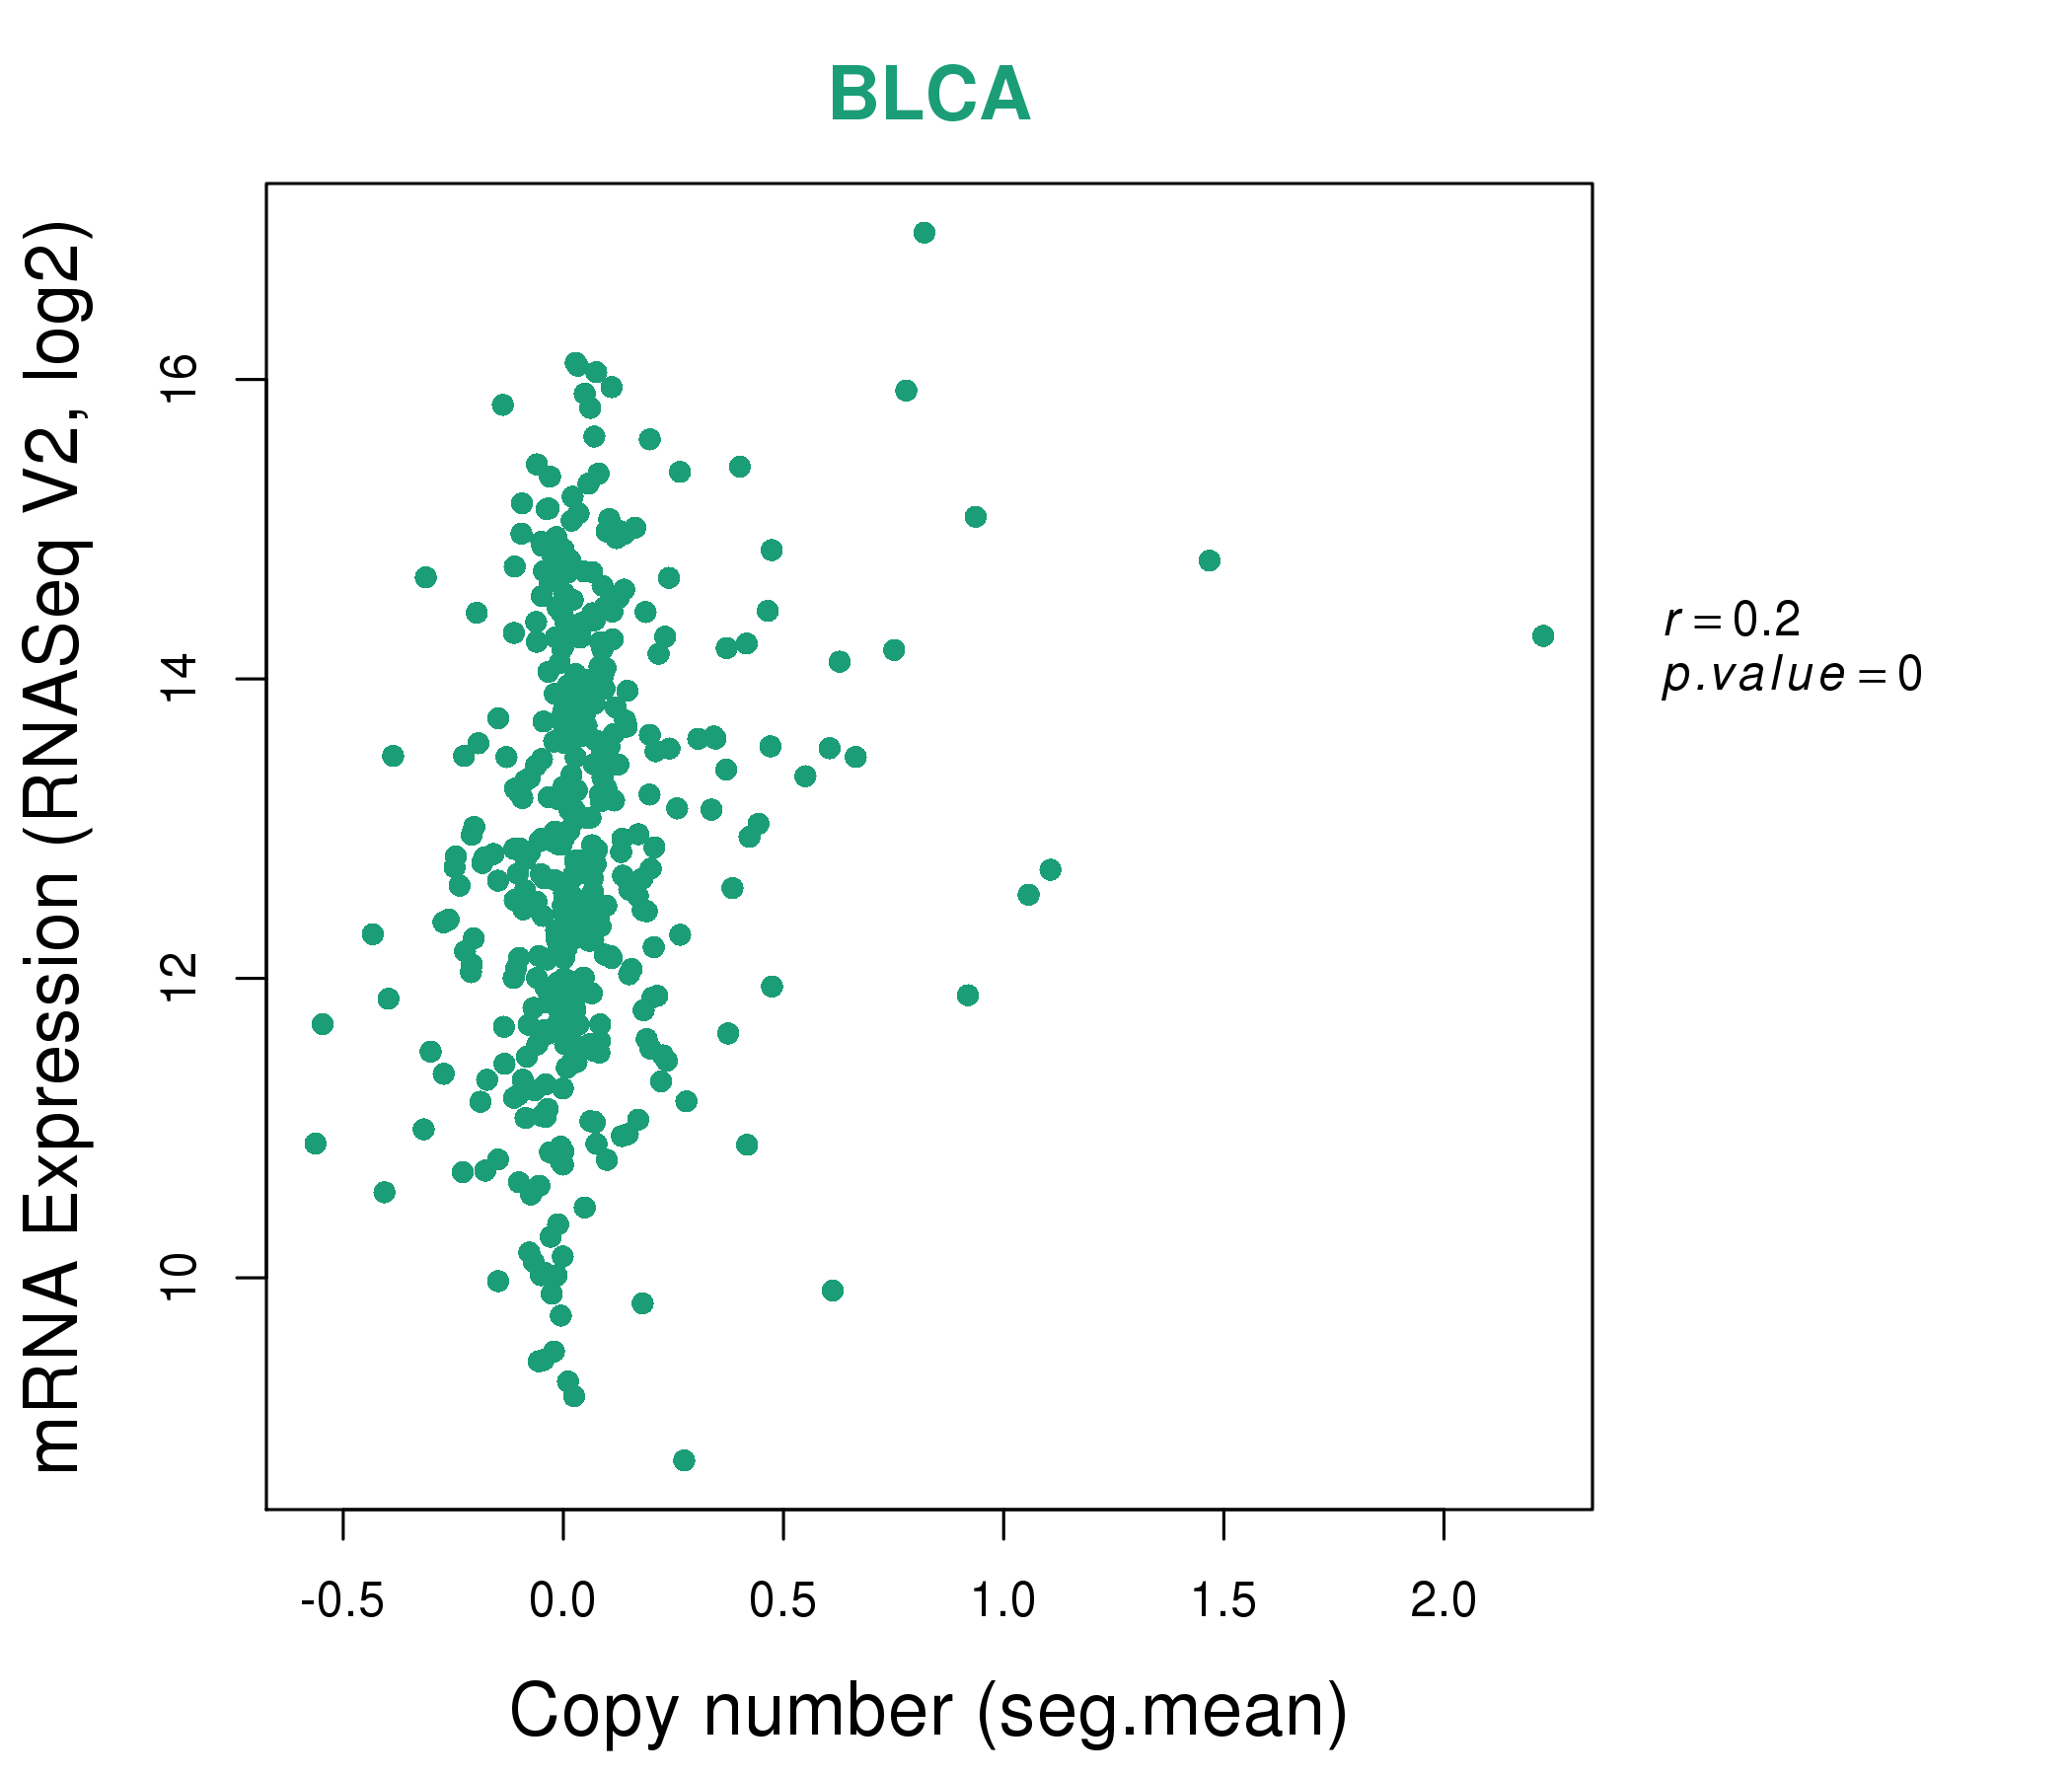
| * This plots show the correlation between CNV and gene expression. |
: Open all plots for all cancer types
 |
|
 |
|
| Top |
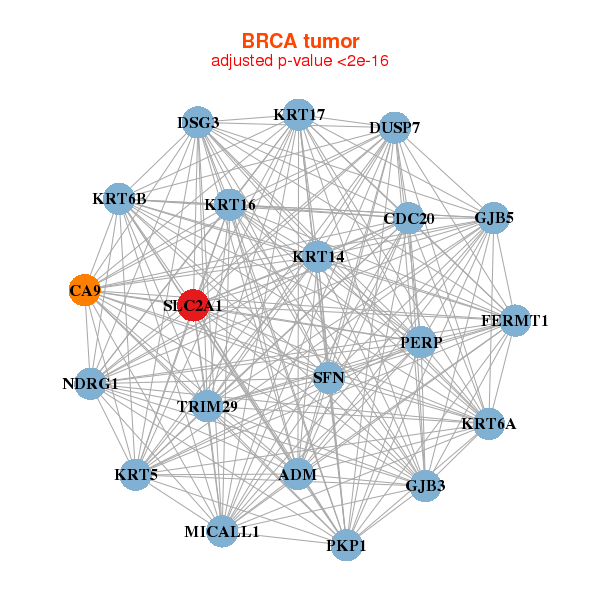
| Gene-Gene Network Information |
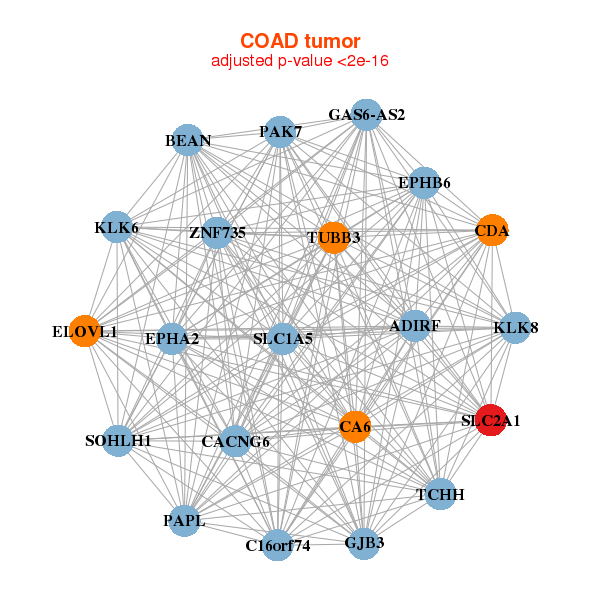
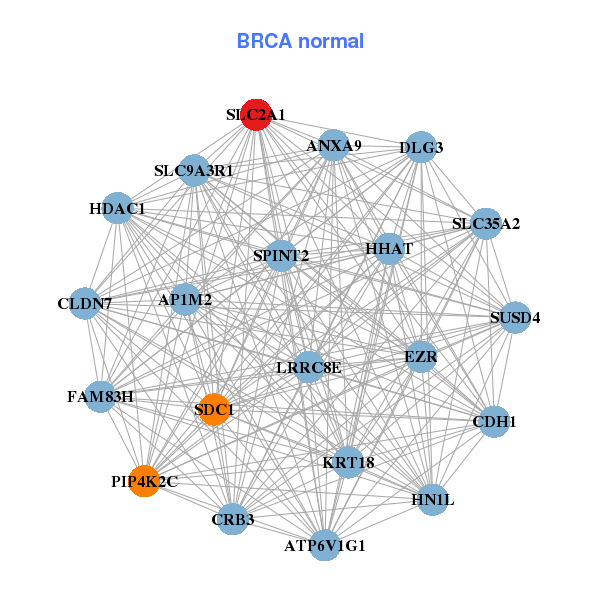
| * Co-Expression network figures were drawn using R package igraph. Only the top 20 genes with the highest correlations were shown. Red circle: input gene, orange circle: cell metabolism gene, sky circle: other gene |
: Open all plots for all cancer types
 |
| ||||
| ADM,CA9,CDC20,DSG3,DUSP7,FERMT1,GJB3, GJB5,KRT14,KRT16,KRT17,KRT5,KRT6A,KRT6B, MICALL1,NDRG1,PERP,PKP1,SFN,SLC2A1,TRIM29 | ANXA9,AP1M2,ATP6V1G1,CDH1,CLDN7,CRB3,DLG3, EZR,FAM83H,HDAC1,HHAT,HN1L,KRT18,LRRC8E, PIP4K2C,SDC1,SLC2A1,SLC35A2,SLC9A3R1,SPINT2,SUSD4 | ||||
 |
| ||||
| BEAN,ADIRF,C16orf74,CA6,CACNG6,CDA,ELOVL1, EPHA2,EPHB6,GAS6-AS2,GJB3,KLK6,KLK8,PAK7, PAPL,SLC1A5,SLC2A1,SOHLH1,TCHH,TUBB3,ZNF735 | ACTG1,B3GNT3,BAIAP2L1,BCL10,CLDN4,DHDDS,EFNB1, FA2H,GAK,KLF4,MIDN,PCSK7,PICK1,SH2B3, SLC2A1,SLC35D1,TMEM2,TMPRSS2,TRIM11,ZDHHC18,ZDHHC5 |
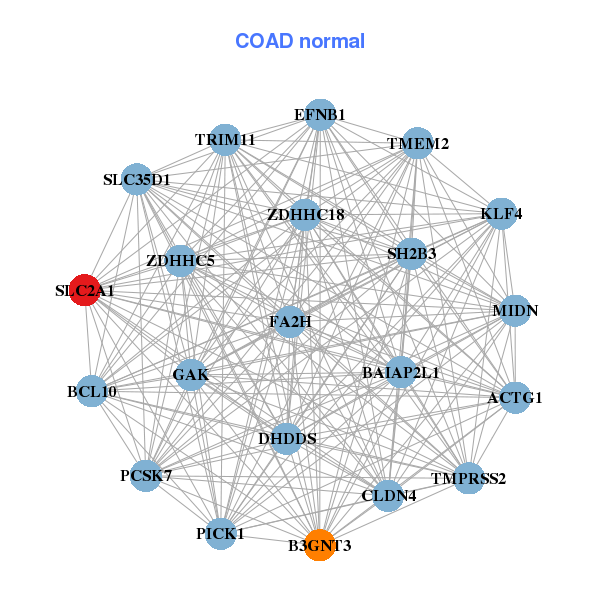
| * Co-Expression network figures were drawn using R package igraph. Only the top 20 genes with the highest correlations were shown. Red circle: input gene, orange circle: cell metabolism gene, sky circle: other gene |
: Open all plots for all cancer types
| Top |
: Open all interacting genes' information including KEGG pathway for all interacting genes from DAVID
| Top |
| Pharmacological Information for SLC2A1 |
| DB Category | DB Name | DB's ID and Url link |
| * Gene Centered Interaction Network. |
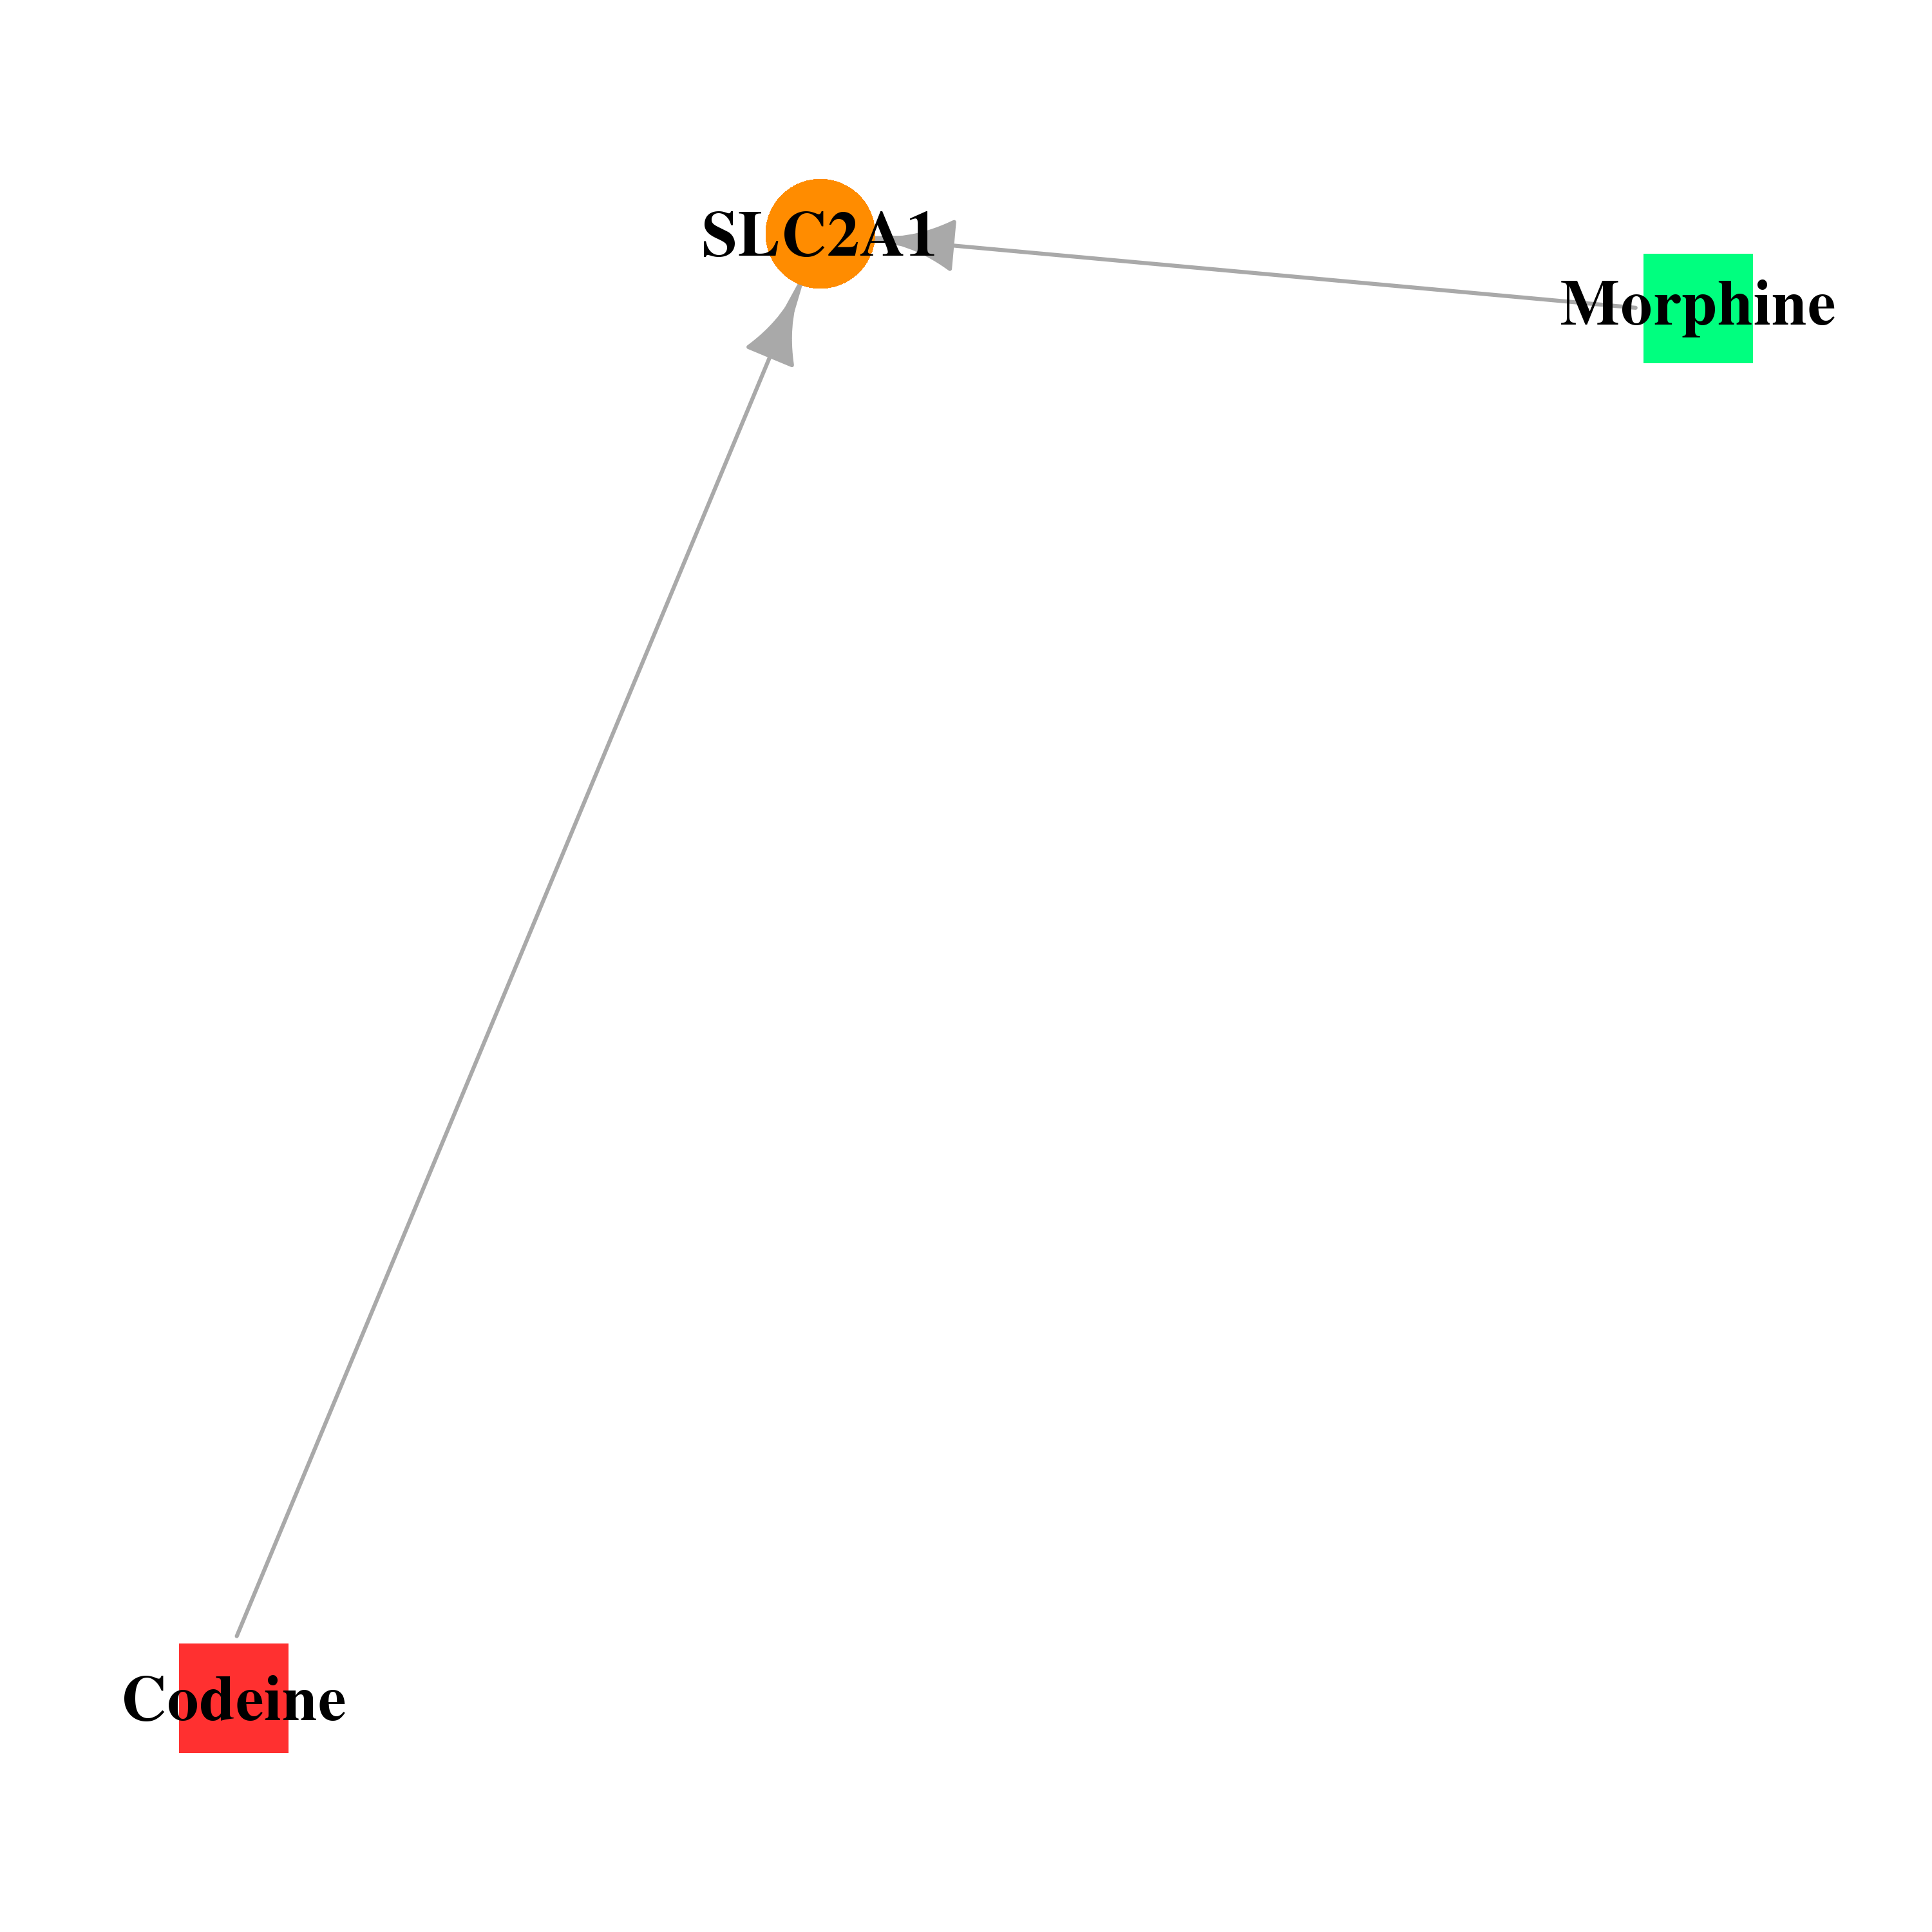 |
| * Drug Centered Interaction Network. |
| DrugBank ID | Target Name | Drug Groups | Generic Name | Drug Centered Network | Drug Structure |
| DB00318 | solute carrier family 2 (facilitated glucose transporter), member 1 | illicit; approved | Codeine | 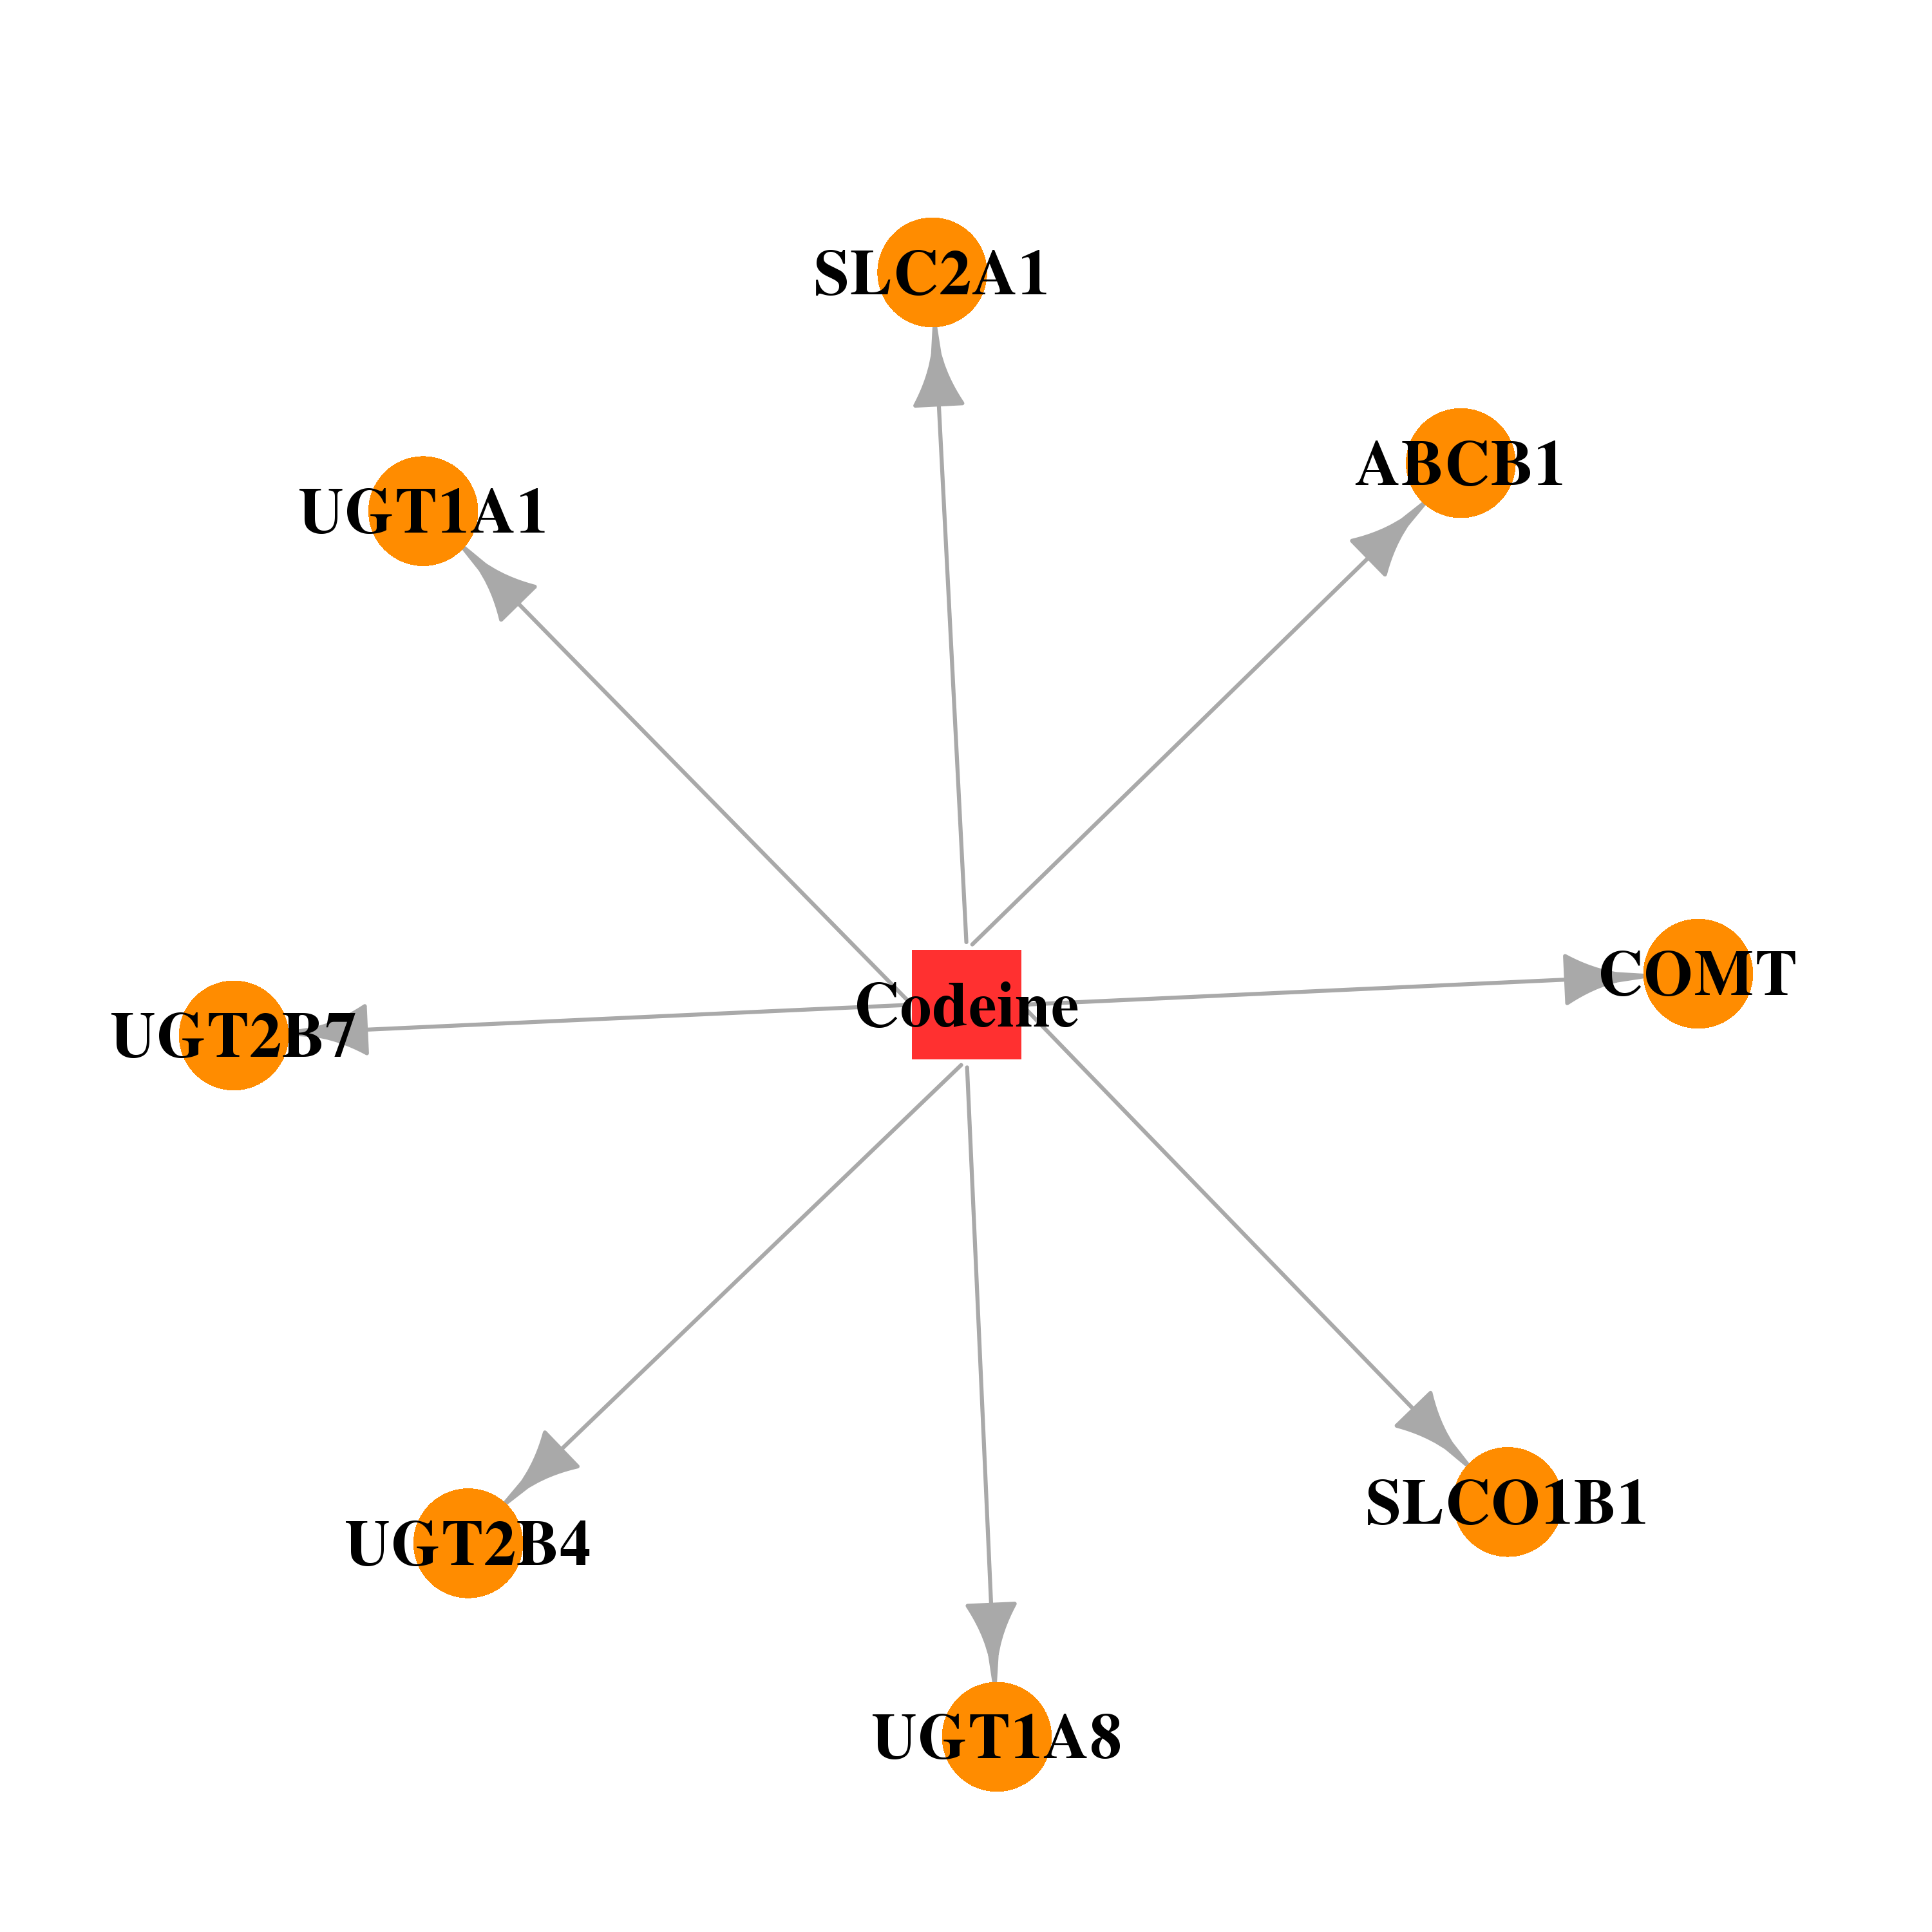 | 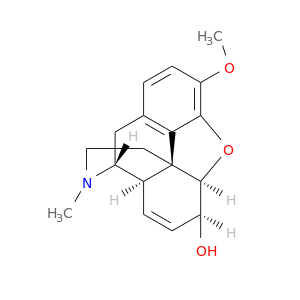 |
| DB00295 | solute carrier family 2 (facilitated glucose transporter), member 1 | approved; investigational | Morphine | 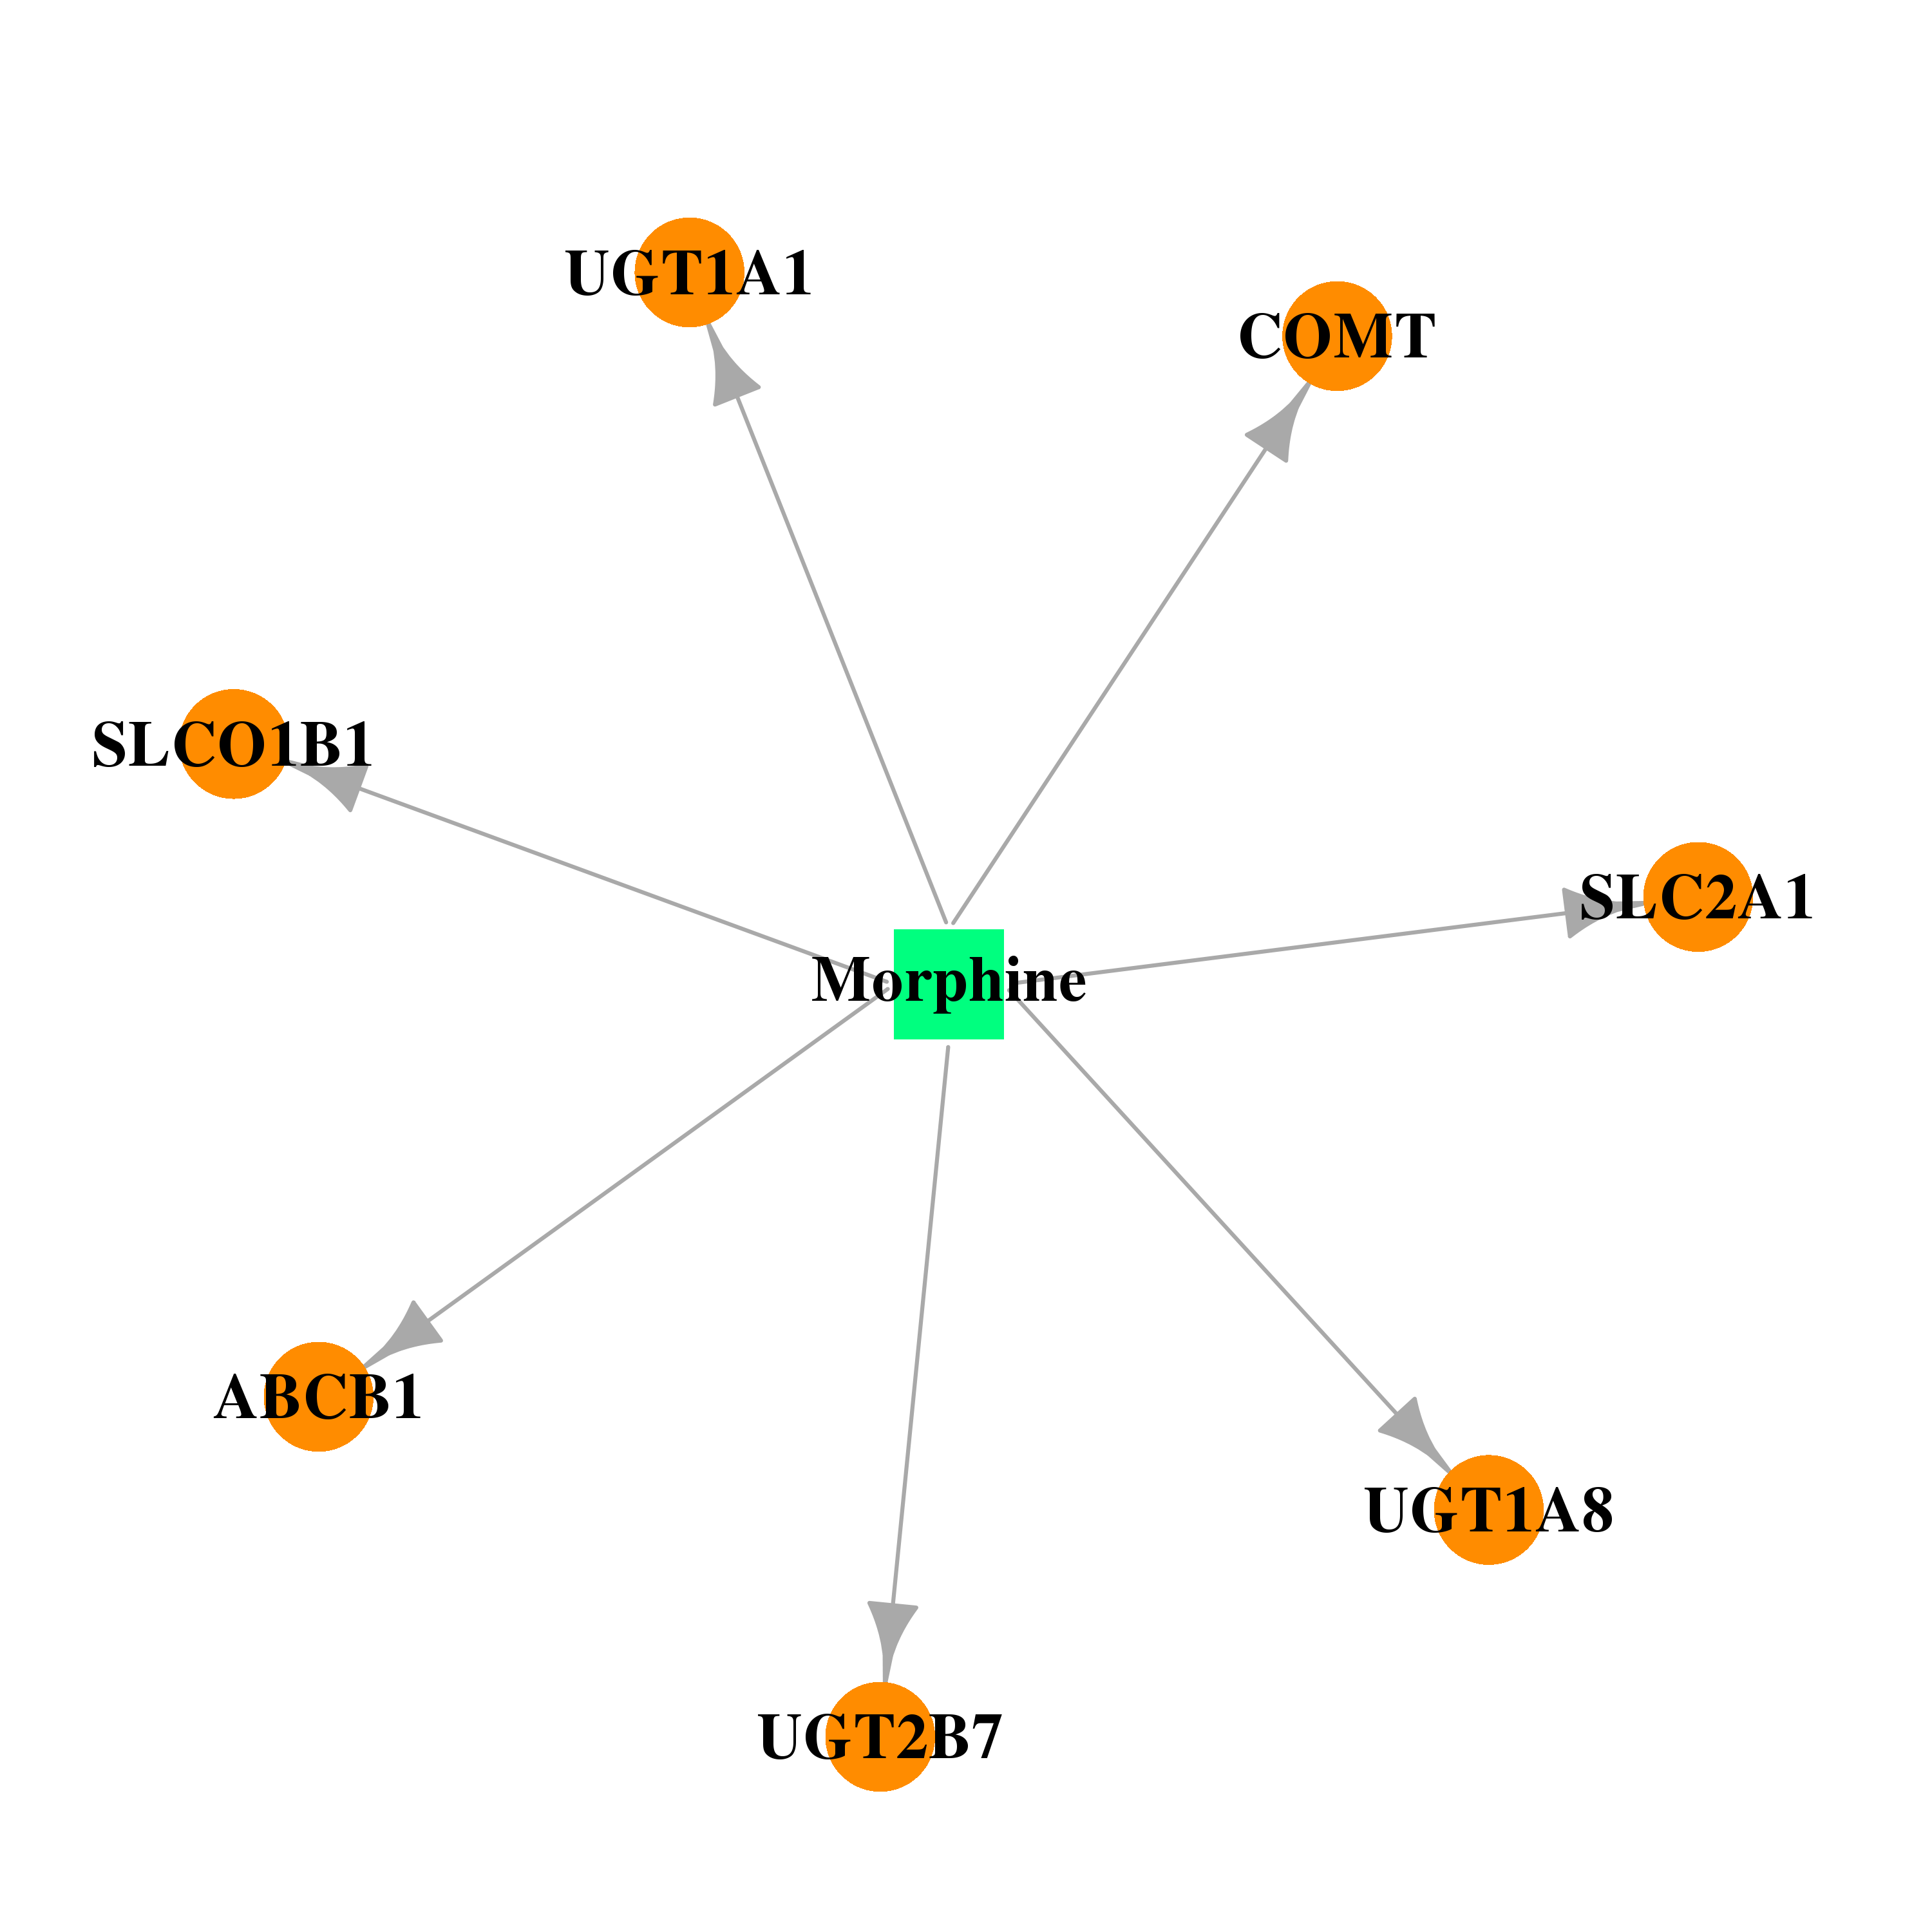 |  |
| Top |
| Cross referenced IDs for SLC2A1 |
| * We obtained these cross-references from Uniprot database. It covers 150 different DBs, 18 categories. http://www.uniprot.org/help/cross_references_section |
: Open all cross reference information
|
Copyright © 2016-Present - The Univsersity of Texas Health Science Center at Houston @ |