|
||||||||||||||||||||
| |
| Phenotypic Information (metabolism pathway, cancer, disease, phenome) |
| |
| |
| Gene-Gene Network Information: Co-Expression Network, Interacting Genes & KEGG |
| |
|


| Gene Summary for SLC2A4 |
| Basic gene info. | Gene symbol | SLC2A4 |
| Gene name | solute carrier family 2 (facilitated glucose transporter), member 4 | |
| Synonyms | GLUT4 | |
| Cytomap | UCSC genome browser: 17p13 | |
| Genomic location | chr17 :7185053-7191367 | |
| Type of gene | protein-coding | |
| RefGenes | NM_001042.2, | |
| Ensembl id | ENSG00000181856 | |
| Description | GLUT-4glucose transporter type 4, insulin-responsiveinsulin-responsive glucose transporter type 4solute carrier family 2, facilitated glucose transporter member 4 | |
| Modification date | 20141207 | |
| dbXrefs | MIM : 138190 | |
| HGNC : HGNC | ||
| Ensembl : ENSG00000181856 | ||
| HPRD : 00688 | ||
| Vega : OTTHUMG00000102181 | ||
| Protein | UniProt: go to UniProt's Cross Reference DB Table | |
| Expression | CleanEX: HS_SLC2A4 | |
| BioGPS: 6517 | ||
| Gene Expression Atlas: ENSG00000181856 | ||
| The Human Protein Atlas: ENSG00000181856 | ||
| Pathway | NCI Pathway Interaction Database: SLC2A4 | |
| KEGG: SLC2A4 | ||
| REACTOME: SLC2A4 | ||
| ConsensusPathDB | ||
| Pathway Commons: SLC2A4 | ||
| Metabolism | MetaCyc: SLC2A4 | |
| HUMANCyc: SLC2A4 | ||
| Regulation | Ensembl's Regulation: ENSG00000181856 | |
| miRBase: chr17 :7,185,053-7,191,367 | ||
| TargetScan: NM_001042 | ||
| cisRED: ENSG00000181856 | ||
| Context | iHOP: SLC2A4 | |
| cancer metabolism search in PubMed: SLC2A4 | ||
| UCL Cancer Institute: SLC2A4 | ||
| Assigned class in ccmGDB | C | |
| Top |
| Phenotypic Information for SLC2A4(metabolism pathway, cancer, disease, phenome) |
| Cancer | CGAP: SLC2A4 |
| Familial Cancer Database: SLC2A4 | |
| * This gene is included in those cancer gene databases. |
|
|
|
|
|
|
| ||||||||||||||
Oncogene 1 | Significant driver gene in | |||||||||||||||||||
| cf) number; DB name 1 Oncogene; http://nar.oxfordjournals.org/content/35/suppl_1/D721.long, 2 Tumor Suppressor gene; https://bioinfo.uth.edu/TSGene/, 3 Cancer Gene Census; http://www.nature.com/nrc/journal/v4/n3/abs/nrc1299.html, 4 CancerGenes; http://nar.oxfordjournals.org/content/35/suppl_1/D721.long, 5 Network of Cancer Gene; http://ncg.kcl.ac.uk/index.php, 1Therapeutic Vulnerabilities in Cancer; http://cbio.mskcc.org/cancergenomics/statius/ |
| REACTOME_METABOLISM_OF_CARBOHYDRATES | |
| OMIM | |
| Orphanet | |
| Disease | KEGG Disease: SLC2A4 |
| MedGen: SLC2A4 (Human Medical Genetics with Condition) | |
| ClinVar: SLC2A4 | |
| Phenotype | MGI: SLC2A4 (International Mouse Phenotyping Consortium) |
| PhenomicDB: SLC2A4 | |
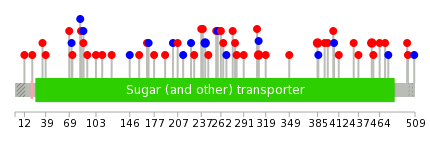
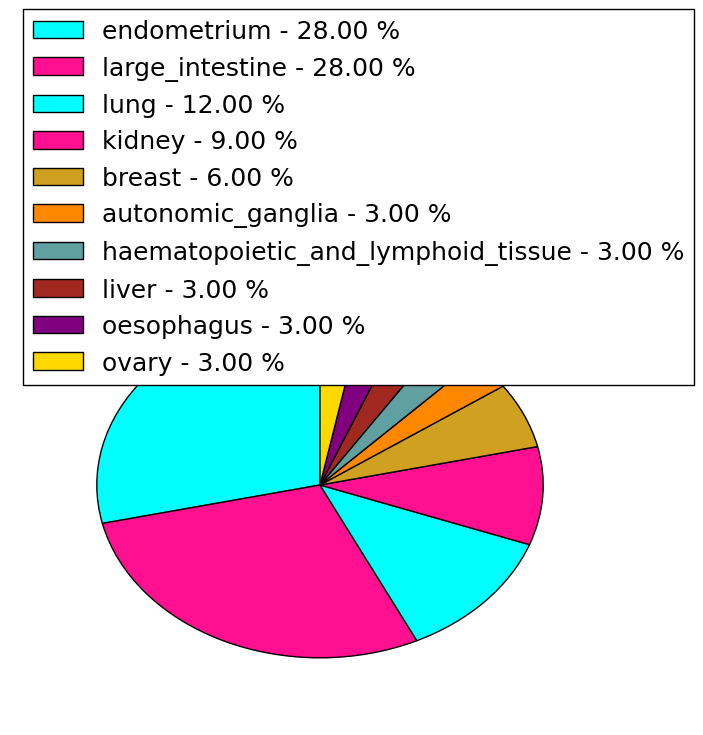
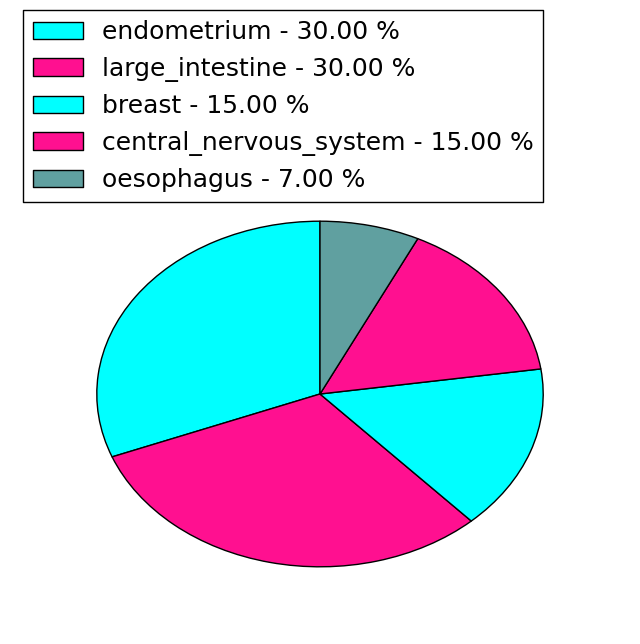
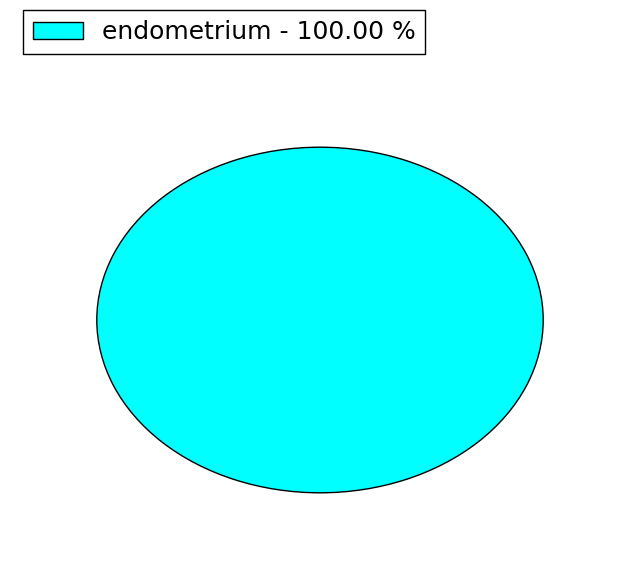
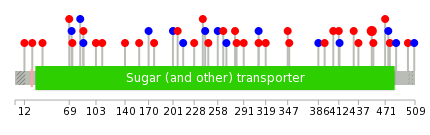
| Mutations for SLC2A4 |
| * Under tables are showing count per each tissue to give us broad intuition about tissue specific mutation patterns.You can go to the detailed page for each mutation database's web site. |
| There's no structural variation information in COSMIC data for this gene. |
| * From mRNA Sanger sequences, Chitars2.0 arranged chimeric transcripts. This table shows SLC2A4 related fusion information. |
| ID | Head Gene | Tail Gene | Accession | Gene_a | qStart_a | qEnd_a | Chromosome_a | tStart_a | tEnd_a | Gene_a | qStart_a | qEnd_a | Chromosome_a | tStart_a | tEnd_a |
| Top |
| There's no copy number variation information in COSMIC data for this gene. |
| Top |
|
 |
| Top |
| Stat. for Non-Synonymous SNVs (# total SNVs=32) | (# total SNVs=13) |
 |  |
(# total SNVs=1) | (# total SNVs=0) |
 |
| Top |
| * When you move the cursor on each content, you can see more deailed mutation information on the Tooltip. Those are primary_site,primary_histology,mutation(aa),pubmedID. |
| GRCh37 position | Mutation(aa) | Unique sampleID count |
| chr17:7189832-7189832 | p.R472* | 2 |
| chr17:7187697-7187697 | p.K242K | 2 |
| chr17:7188167-7188167 | p.S310L | 2 |
| chr17:7186902-7186902 | p.I87I | 2 |
| chr17:7189779-7189779 | p.A454V | 2 |
| chr17:7189054-7189054 | p.I385F | 2 |
| chr17:7186634-7186634 | p.S35F | 1 |
| chr17:7187906-7187906 | p.Q277L | 1 |
| chr17:7189082-7189082 | p.F394C | 1 |
| chr17:7187101-7187101 | p.G123D | 1 |
| Top |
|
 |
| Point Mutation/ Tissue ID | 1 | 2 | 3 | 4 | 5 | 6 | 7 | 8 | 9 | 10 | 11 | 12 | 13 | 14 | 15 | 16 | 17 | 18 | 19 | 20 |
| # sample | 1 | 3 | 9 | 1 | 1 | 1 | 1 | 1 | 2 | 2 | 9 | 2 | 13 | |||||||
| # mutation | 1 | 3 | 10 | 1 | 1 | 1 | 1 | 1 | 2 | 2 | 10 | 3 | 13 | |||||||
| nonsynonymous SNV | 1 | 1 | 7 | 1 | 1 | 1 | 1 | 2 | 1 | 6 | 3 | 9 | ||||||||
| synonymous SNV | 2 | 3 | 1 | 1 | 4 | 4 |
| cf) Tissue ID; Tissue type (1; BLCA[Bladder Urothelial Carcinoma], 2; BRCA[Breast invasive carcinoma], 3; CESC[Cervical squamous cell carcinoma and endocervical adenocarcinoma], 4; COAD[Colon adenocarcinoma], 5; GBM[Glioblastoma multiforme], 6; Glioma Low Grade, 7; HNSC[Head and Neck squamous cell carcinoma], 8; KICH[Kidney Chromophobe], 9; KIRC[Kidney renal clear cell carcinoma], 10; KIRP[Kidney renal papillary cell carcinoma], 11; LAML[Acute Myeloid Leukemia], 12; LUAD[Lung adenocarcinoma], 13; LUSC[Lung squamous cell carcinoma], 14; OV[Ovarian serous cystadenocarcinoma ], 15; PAAD[Pancreatic adenocarcinoma], 16; PRAD[Prostate adenocarcinoma], 17; SKCM[Skin Cutaneous Melanoma], 18:STAD[Stomach adenocarcinoma], 19:THCA[Thyroid carcinoma], 20:UCEC[Uterine Corpus Endometrial Carcinoma]) |
| Top |
| * We represented just top 10 SNVs. When you move the cursor on each content, you can see more deailed mutation information on the Tooltip. Those are primary_site, primary_histology, mutation(aa), pubmedID. |
| Genomic Position | Mutation(aa) | Unique sampleID count |
| chr17:7189779 | p.A454V | 3 |
| chr17:7186902 | p.I87M | 2 |
| chr17:7186857 | p.N431S | 1 |
| chr17:7189140 | p.P73S | 1 |
| chr17:7187590 | p.A258A | 1 |
| chr17:7187948 | p.G437R | 1 |
| chr17:7186858 | p.L83L | 1 |
| chr17:7189193 | p.R265W | 1 |
| chr17:7187613 | p.R269R | 1 |
| chr17:7188167 | p.L456F | 1 |
| * Copy number data were extracted from TCGA using R package TCGA-Assembler. The URLs of all public data files on TCGA DCC data server were gathered on Jan-05-2015. Function ProcessCNAData in TCGA-Assembler package was used to obtain gene-level copy number value which is calculated as the average copy number of the genomic region of a gene. |
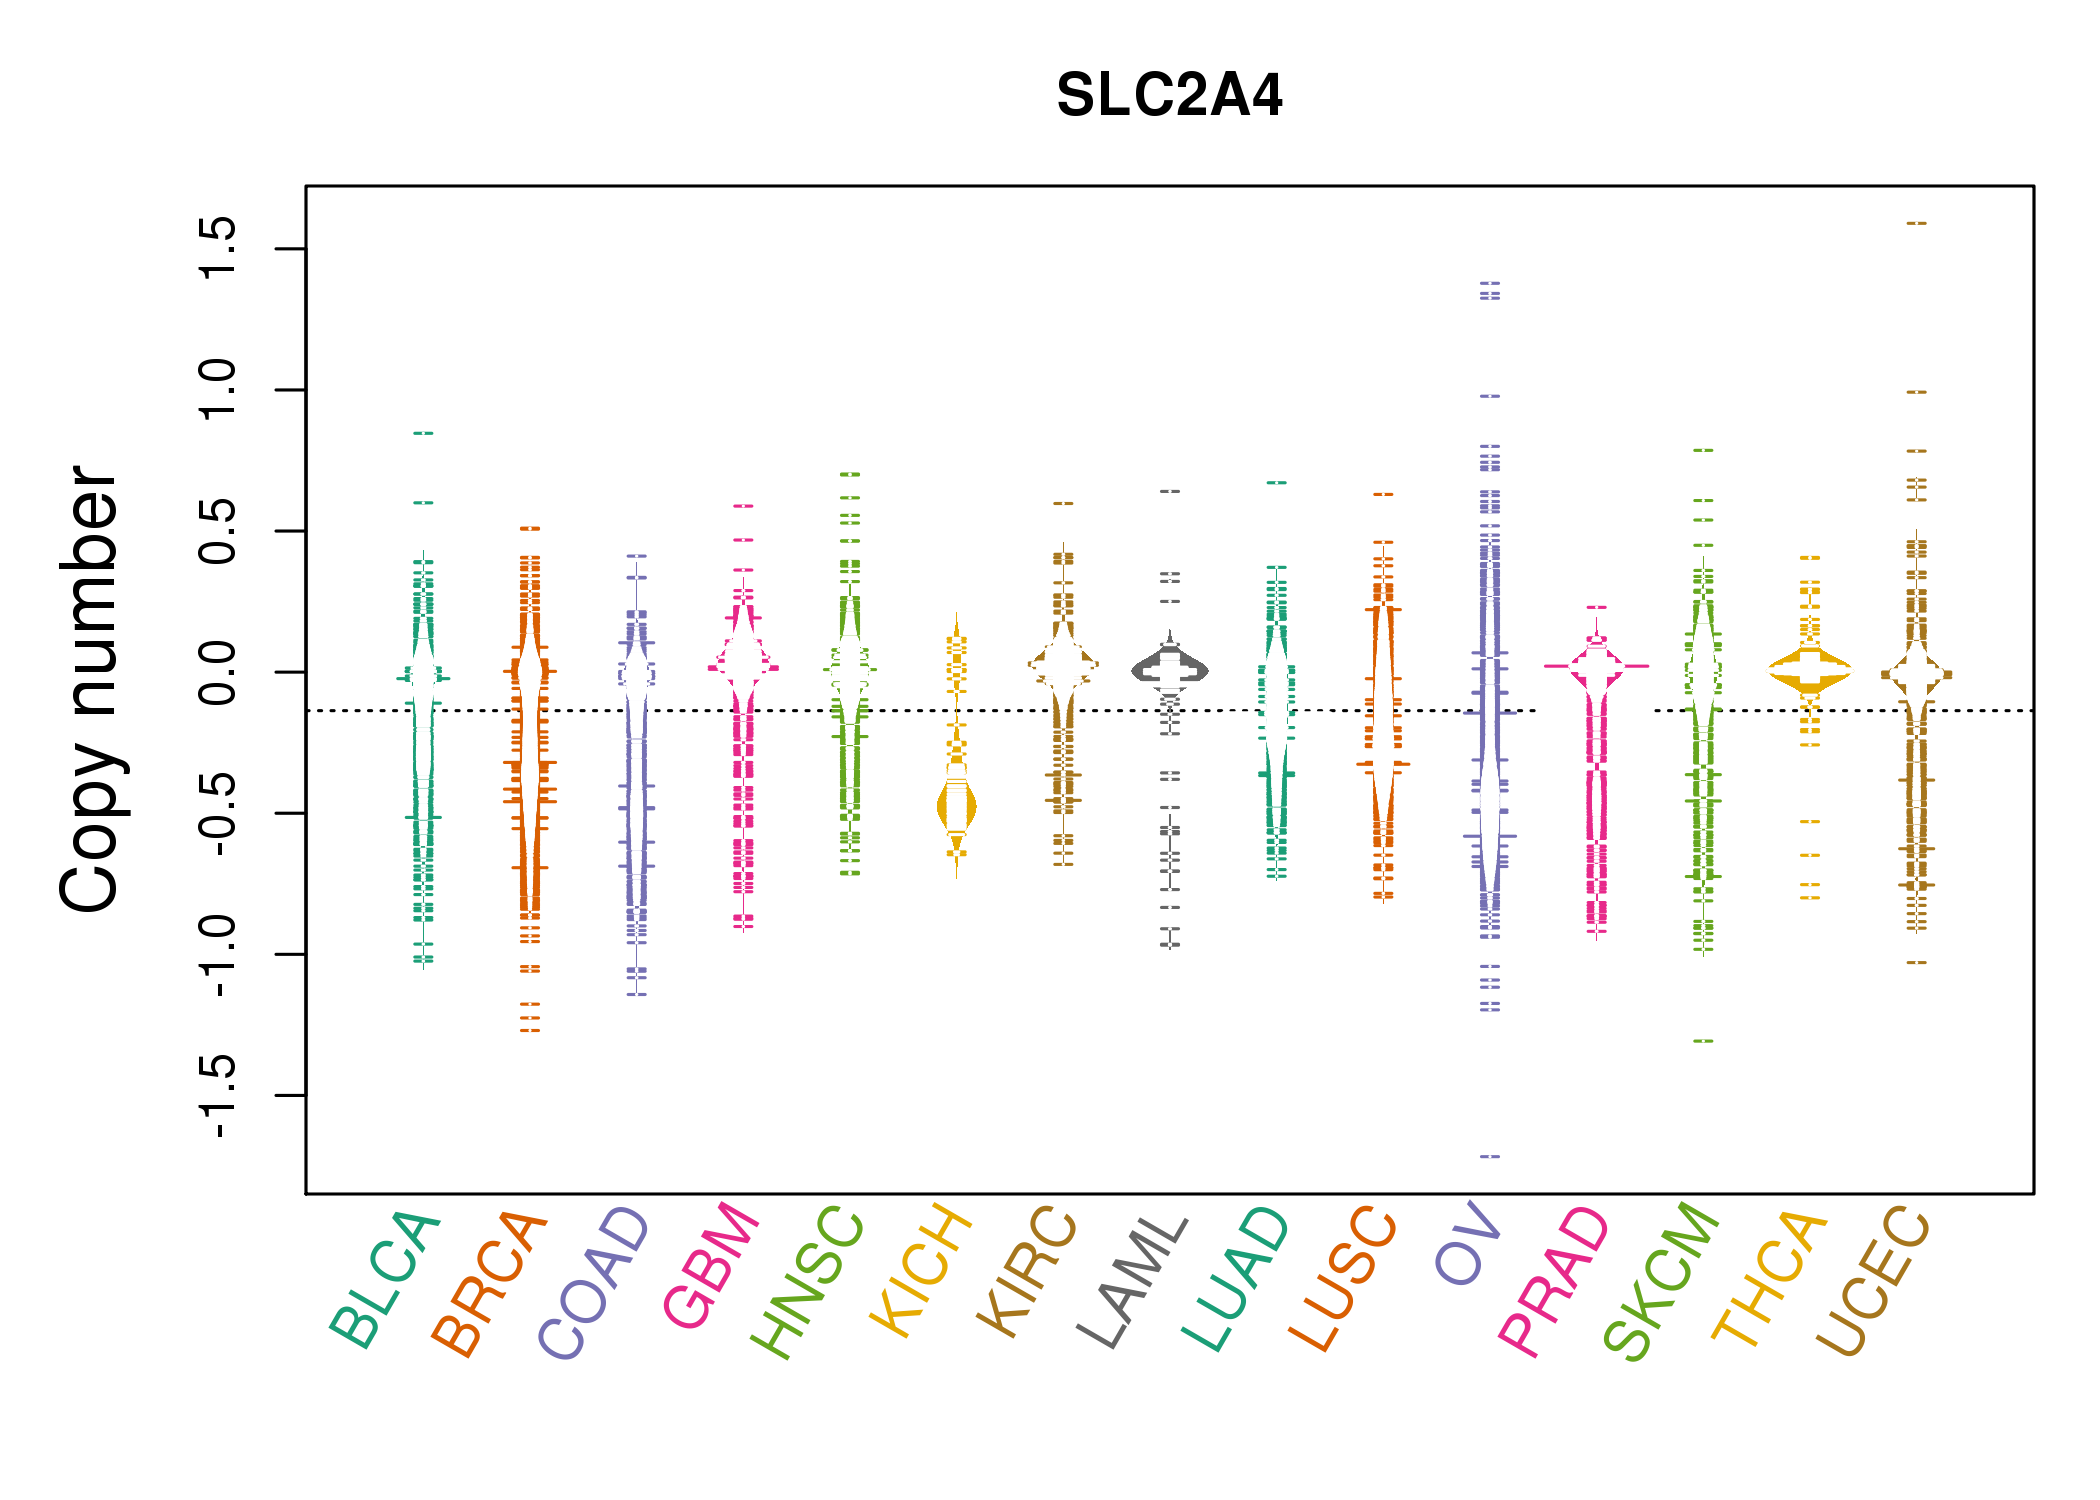 |
| cf) Tissue ID[Tissue type]: BLCA[Bladder Urothelial Carcinoma], BRCA[Breast invasive carcinoma], CESC[Cervical squamous cell carcinoma and endocervical adenocarcinoma], COAD[Colon adenocarcinoma], GBM[Glioblastoma multiforme], Glioma Low Grade, HNSC[Head and Neck squamous cell carcinoma], KICH[Kidney Chromophobe], KIRC[Kidney renal clear cell carcinoma], KIRP[Kidney renal papillary cell carcinoma], LAML[Acute Myeloid Leukemia], LUAD[Lung adenocarcinoma], LUSC[Lung squamous cell carcinoma], OV[Ovarian serous cystadenocarcinoma ], PAAD[Pancreatic adenocarcinoma], PRAD[Prostate adenocarcinoma], SKCM[Skin Cutaneous Melanoma], STAD[Stomach adenocarcinoma], THCA[Thyroid carcinoma], UCEC[Uterine Corpus Endometrial Carcinoma] |
| Top |
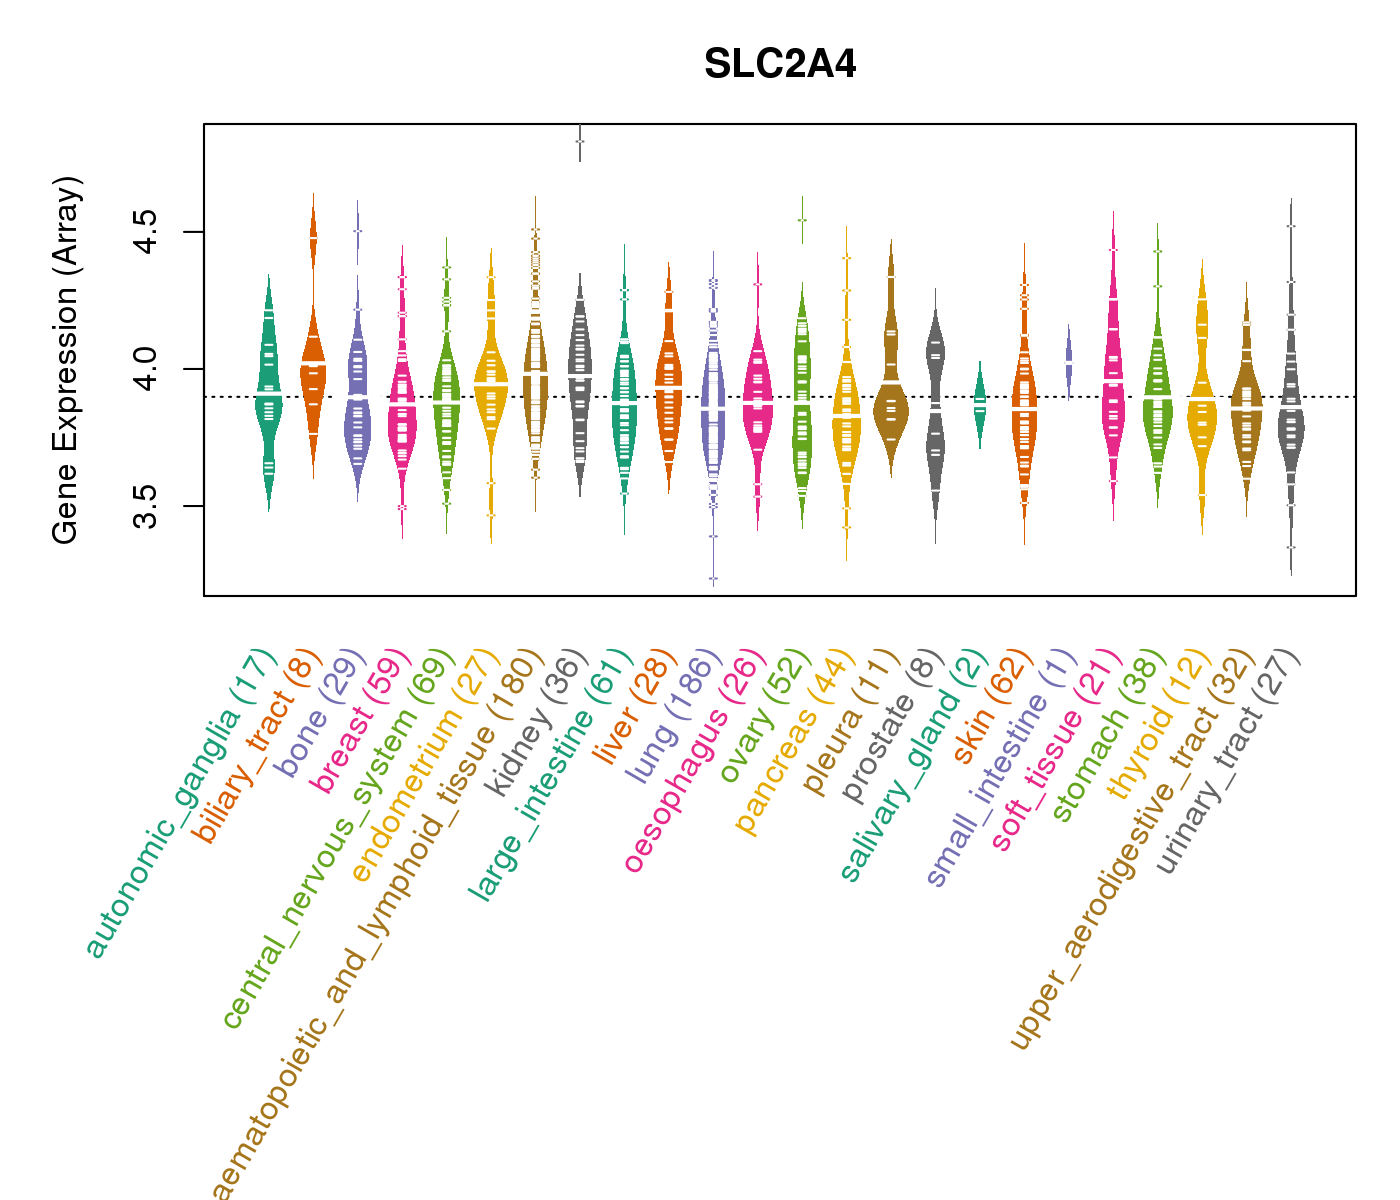
| Gene Expression for SLC2A4 |
| * CCLE gene expression data were extracted from CCLE_Expression_Entrez_2012-10-18.res: Gene-centric RMA-normalized mRNA expression data. |
 |
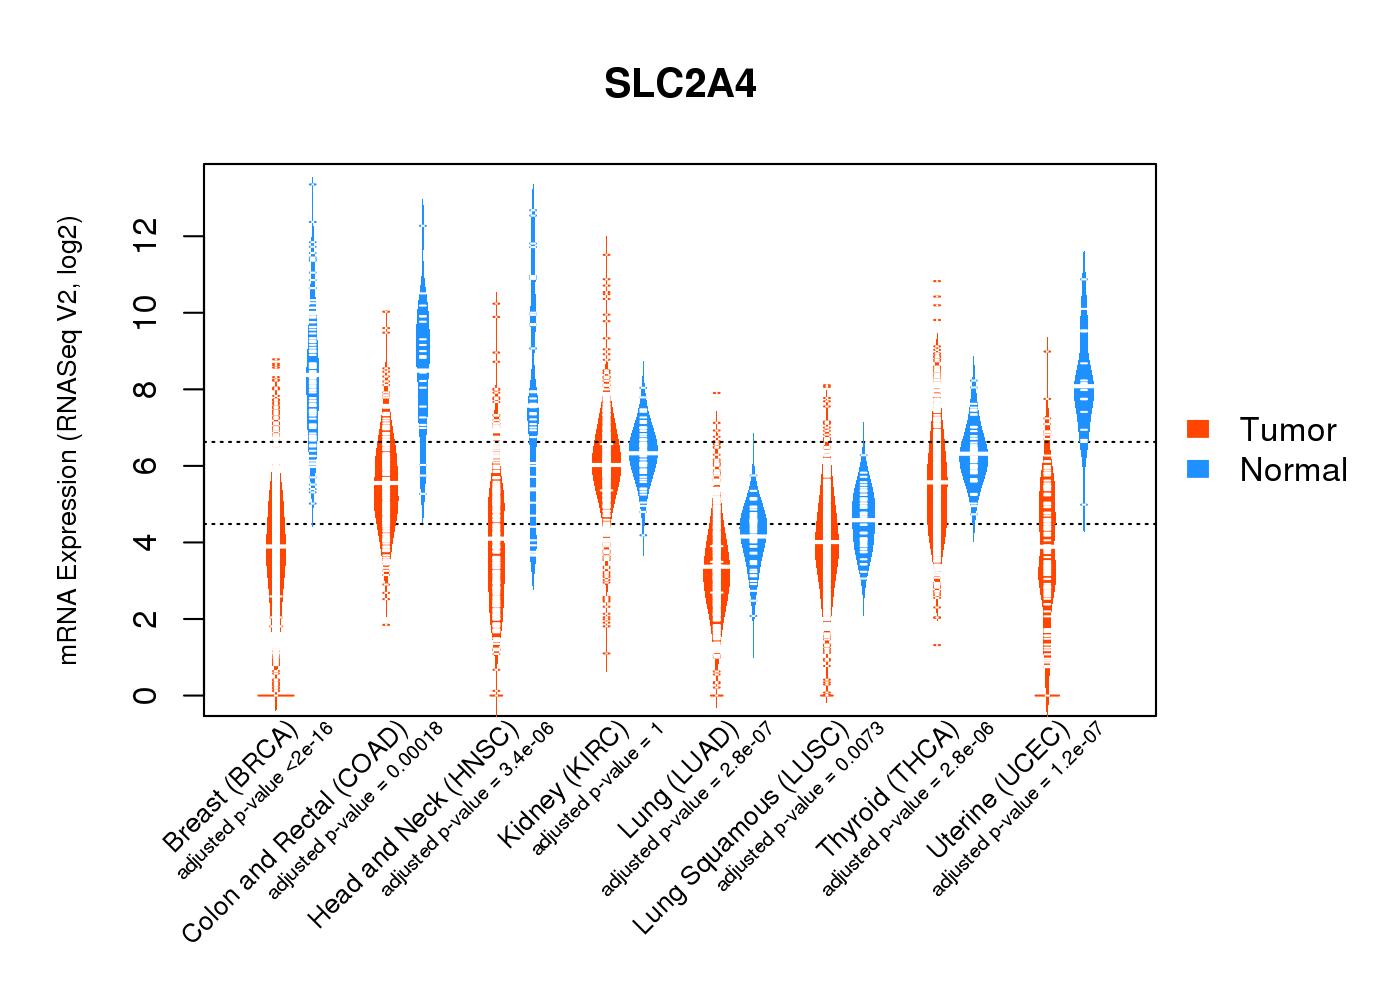
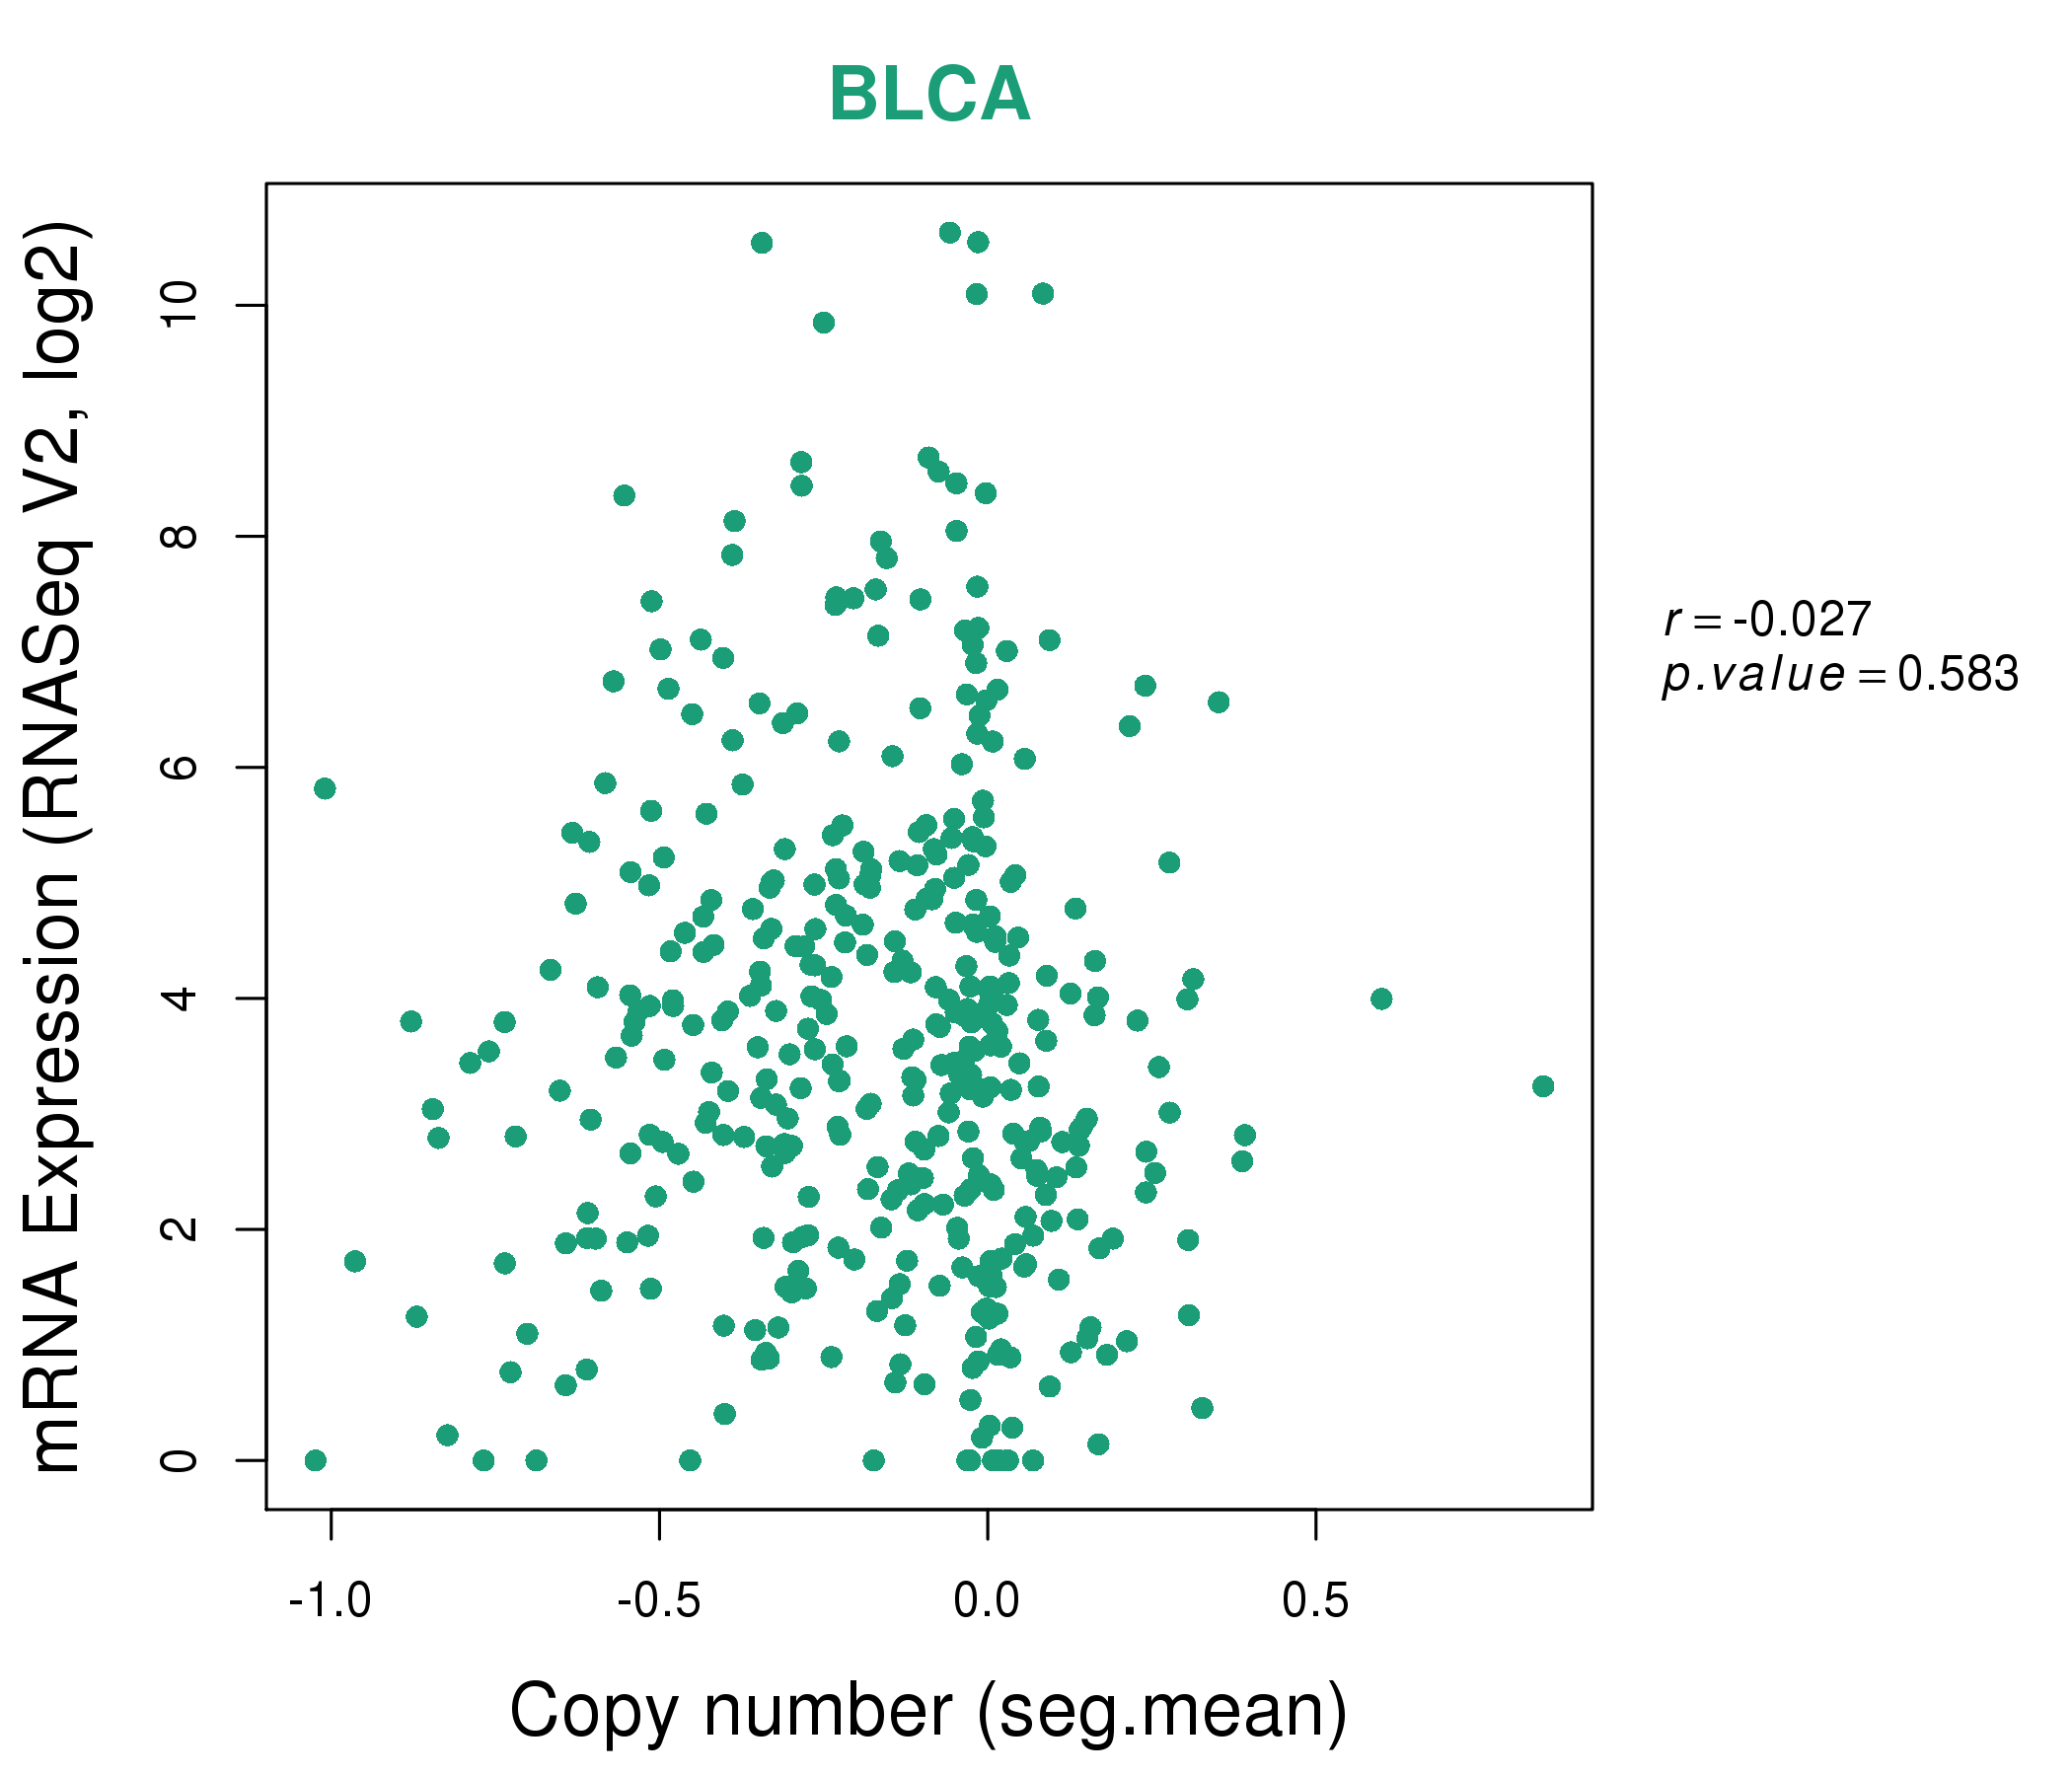
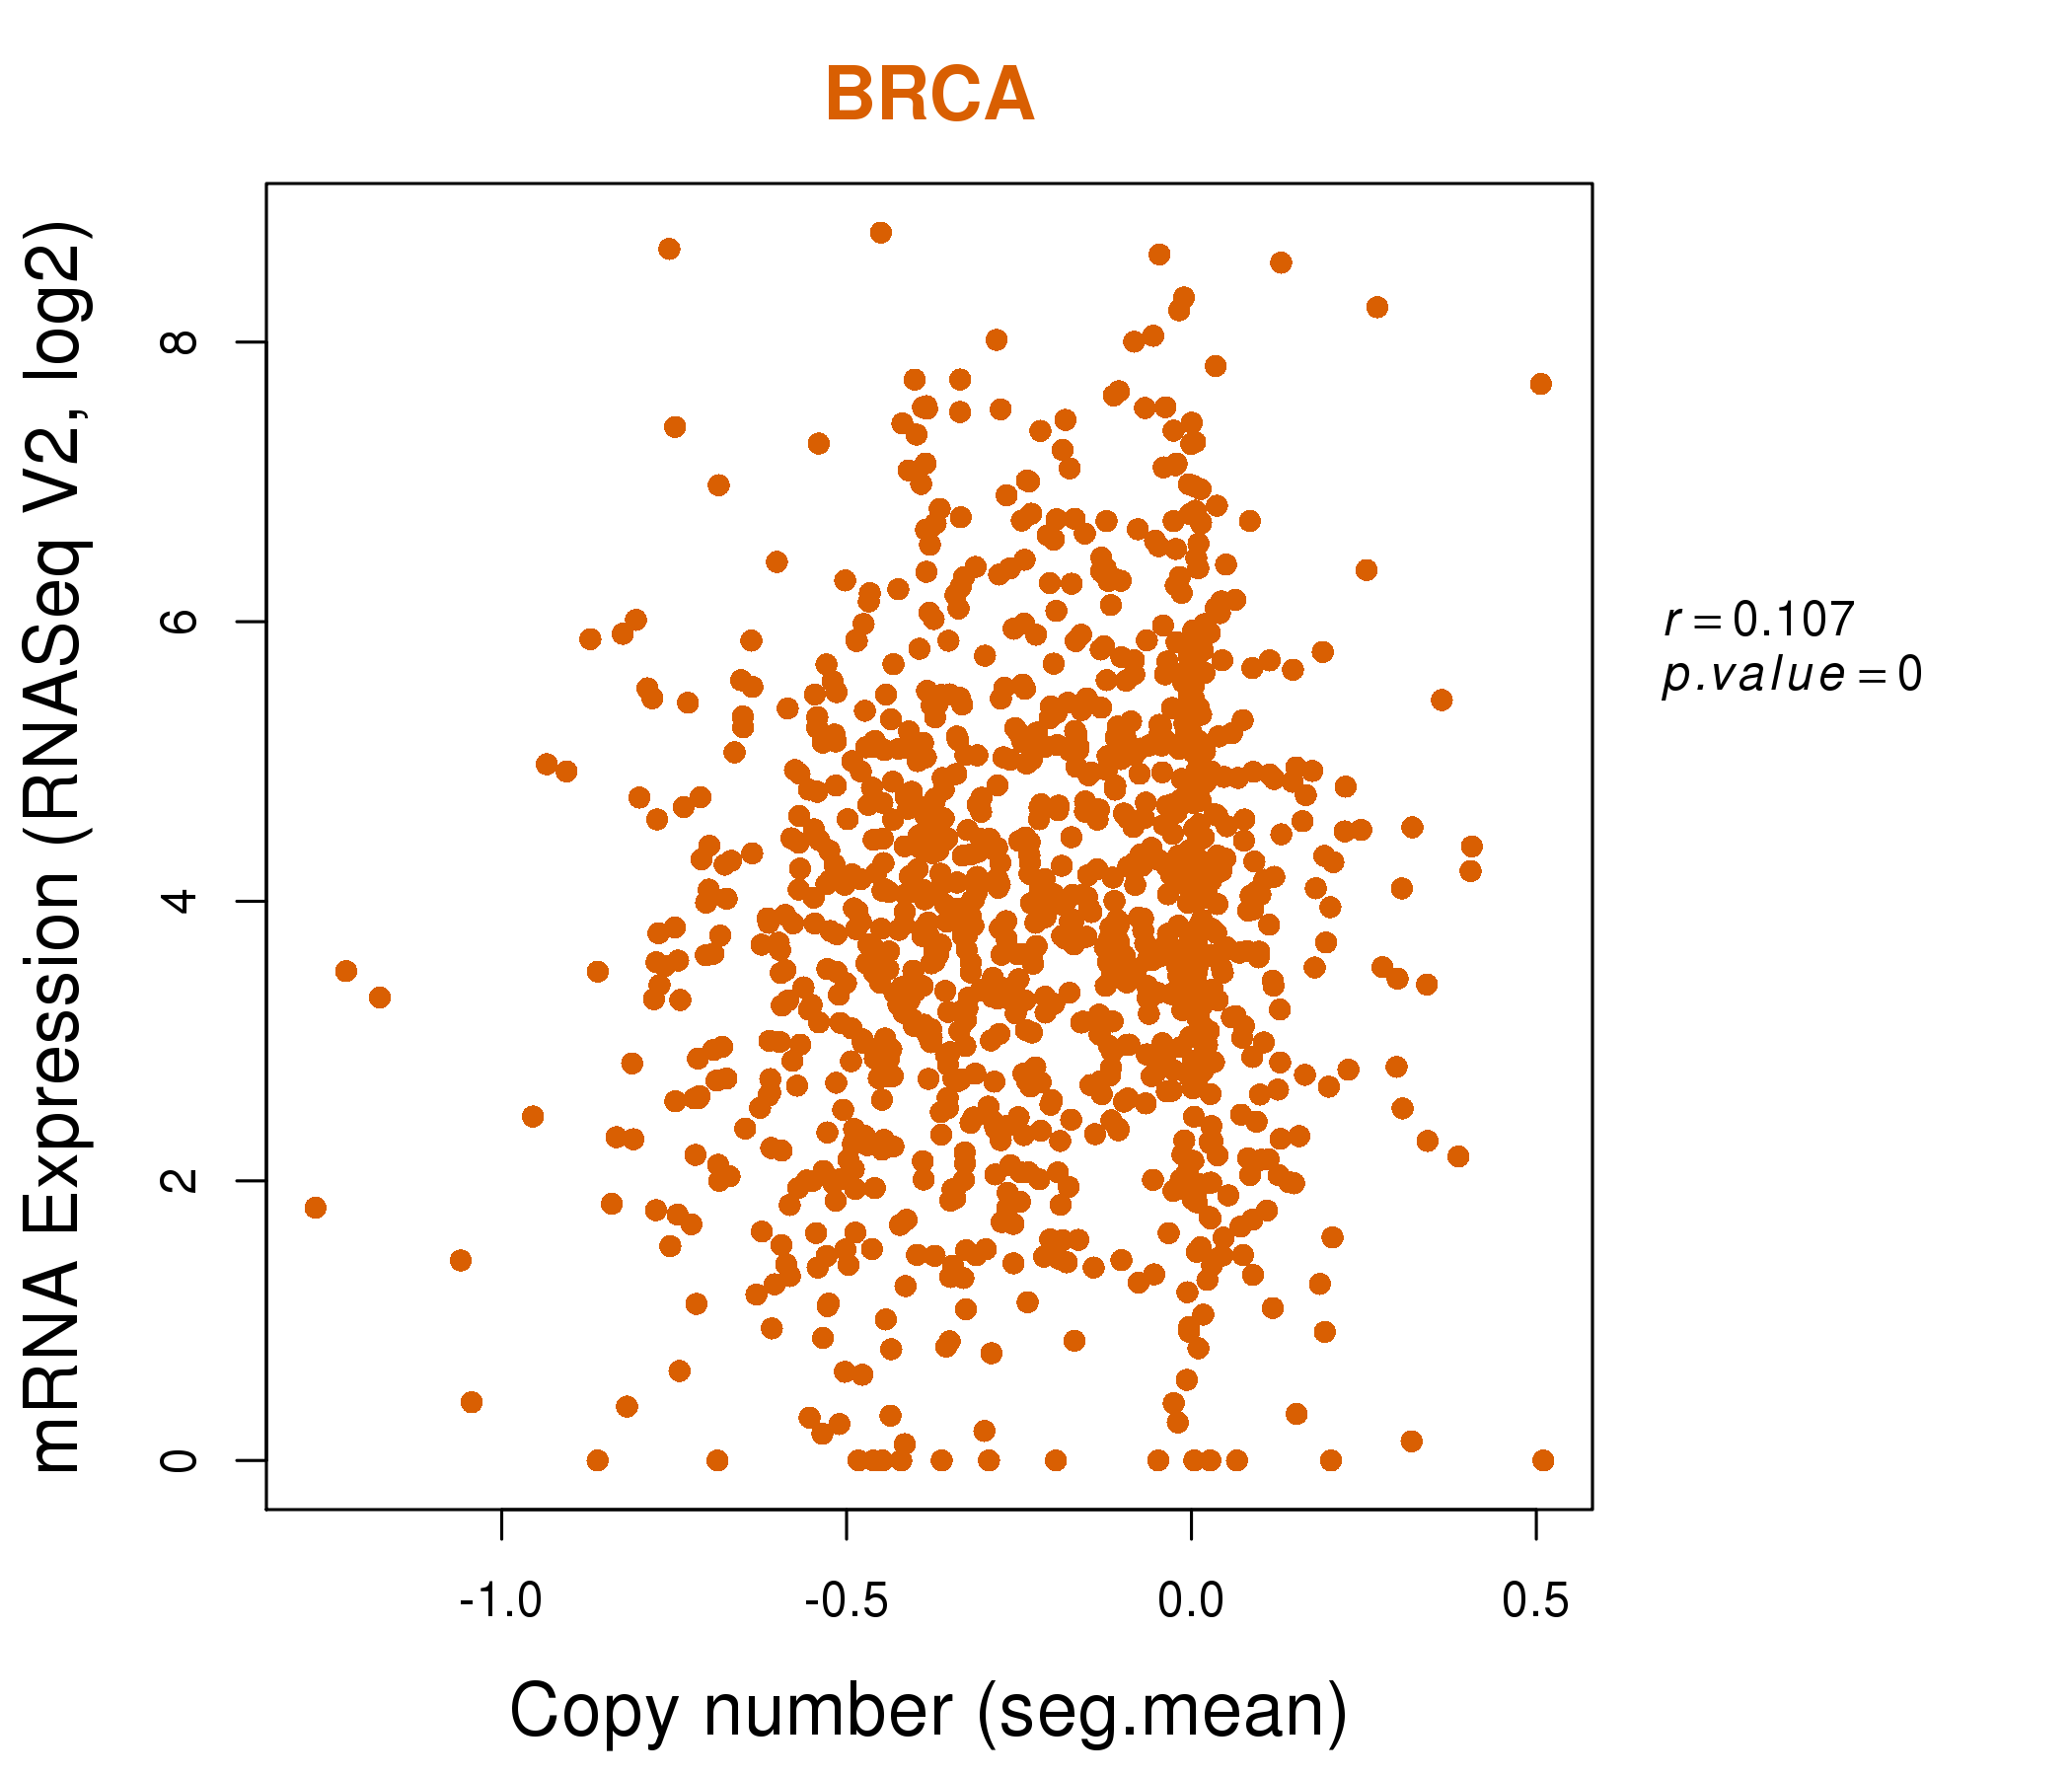
| * Normalized gene expression data of RNASeqV2 was extracted from TCGA using R package TCGA-Assembler. The URLs of all public data files on TCGA DCC data server were gathered at Jan-05-2015. Only eight cancer types have enough normal control samples for differential expression analysis. (t test, adjusted p<0.05 (using Benjamini-Hochberg FDR)) |
 |
| Top |
| * This plots show the correlation between CNV and gene expression. |
: Open all plots for all cancer types
 |
|
 |
|

| Top |
| Gene-Gene Network Information |
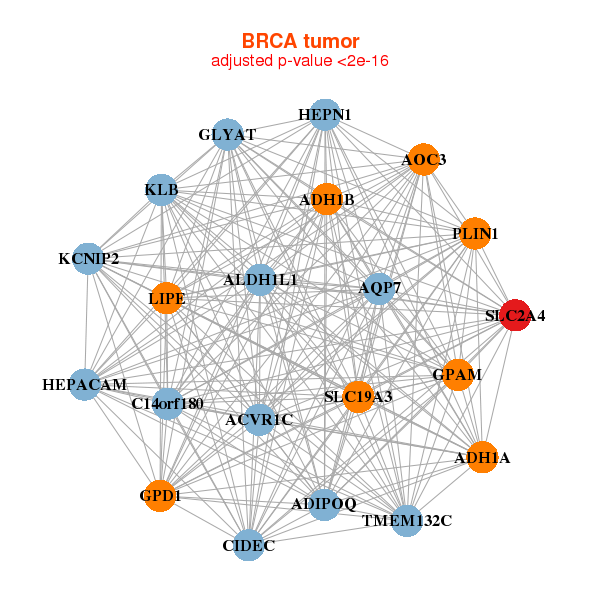
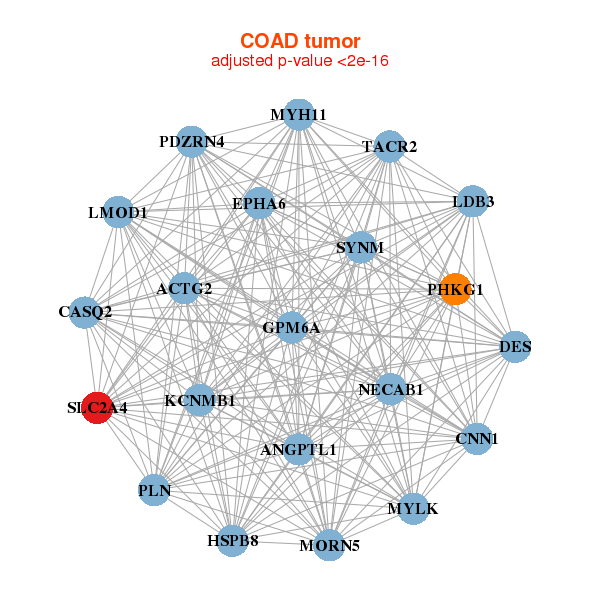
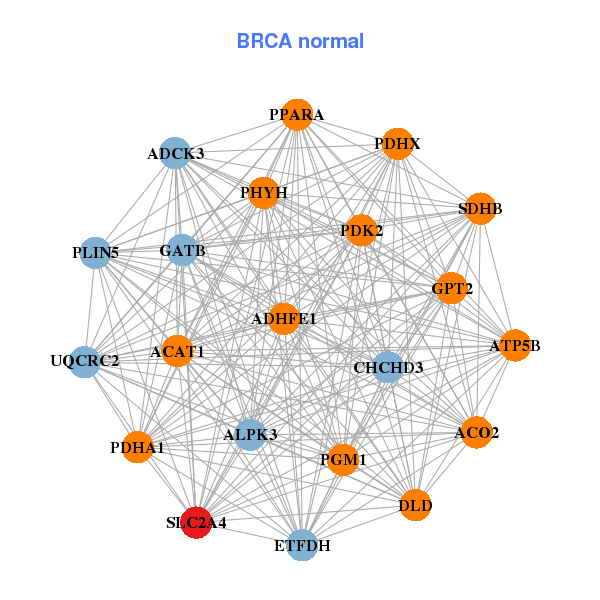
| * Co-Expression network figures were drawn using R package igraph. Only the top 20 genes with the highest correlations were shown. Red circle: input gene, orange circle: cell metabolism gene, sky circle: other gene |
: Open all plots for all cancer types
 |
| ||||
| ACVR1C,ADH1A,ADH1B,ADIPOQ,ALDH1L1,AOC3,AQP7, C14orf180,CIDEC,GLYAT,GPAM,GPD1,HEPACAM,HEPN1, KCNIP2,KLB,LIPE,PLIN1,SLC19A3,SLC2A4,TMEM132C | ACAT1,ACO2,ADHFE1,ALPK3,ATP5B,ADCK3,CHCHD3, DLD,ETFDH,GPT2,PDHA1,PDHX,PDK2,GATB, PGM1,PHYH,PLIN5,PPARA,SDHB,SLC2A4,UQCRC2 | ||||
 |
| ||||
| ACTG2,ANGPTL1,CASQ2,CNN1,DES,EPHA6,GPM6A, HSPB8,KCNMB1,LDB3,LMOD1,MORN5,MYH11,MYLK, NECAB1,PDZRN4,PHKG1,PLN,SLC2A4,SYNM,TACR2 | ACTN1,AOC3,ATP1A2,BVES,CACNA1C,CPXM2,CTXN1, DACT3,FAM46B,FLNA,GJC1,KY,NPTXR,PDLIM7, PNCK,PNMA1,PYGM,SLC2A4,SLC8A2,SMTN,TGFB1I1 |
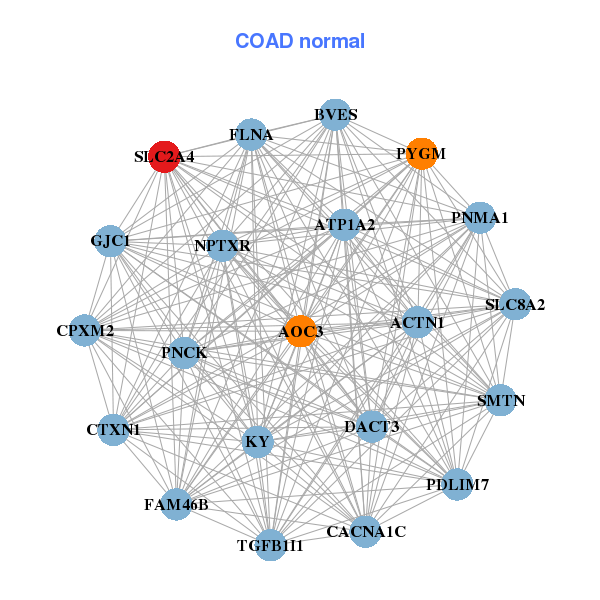
| * Co-Expression network figures were drawn using R package igraph. Only the top 20 genes with the highest correlations were shown. Red circle: input gene, orange circle: cell metabolism gene, sky circle: other gene |
: Open all plots for all cancer types
| Top |
: Open all interacting genes' information including KEGG pathway for all interacting genes from DAVID
| Top |
| Pharmacological Information for SLC2A4 |
| DB Category | DB Name | DB's ID and Url link |
| * Gene Centered Interaction Network. |
 |
| * Drug Centered Interaction Network. |
| DrugBank ID | Target Name | Drug Groups | Generic Name | Drug Centered Network | Drug Structure |
| DB00122 | solute carrier family 2 (facilitated glucose transporter), member 4 | approved; nutraceutical | Choline | 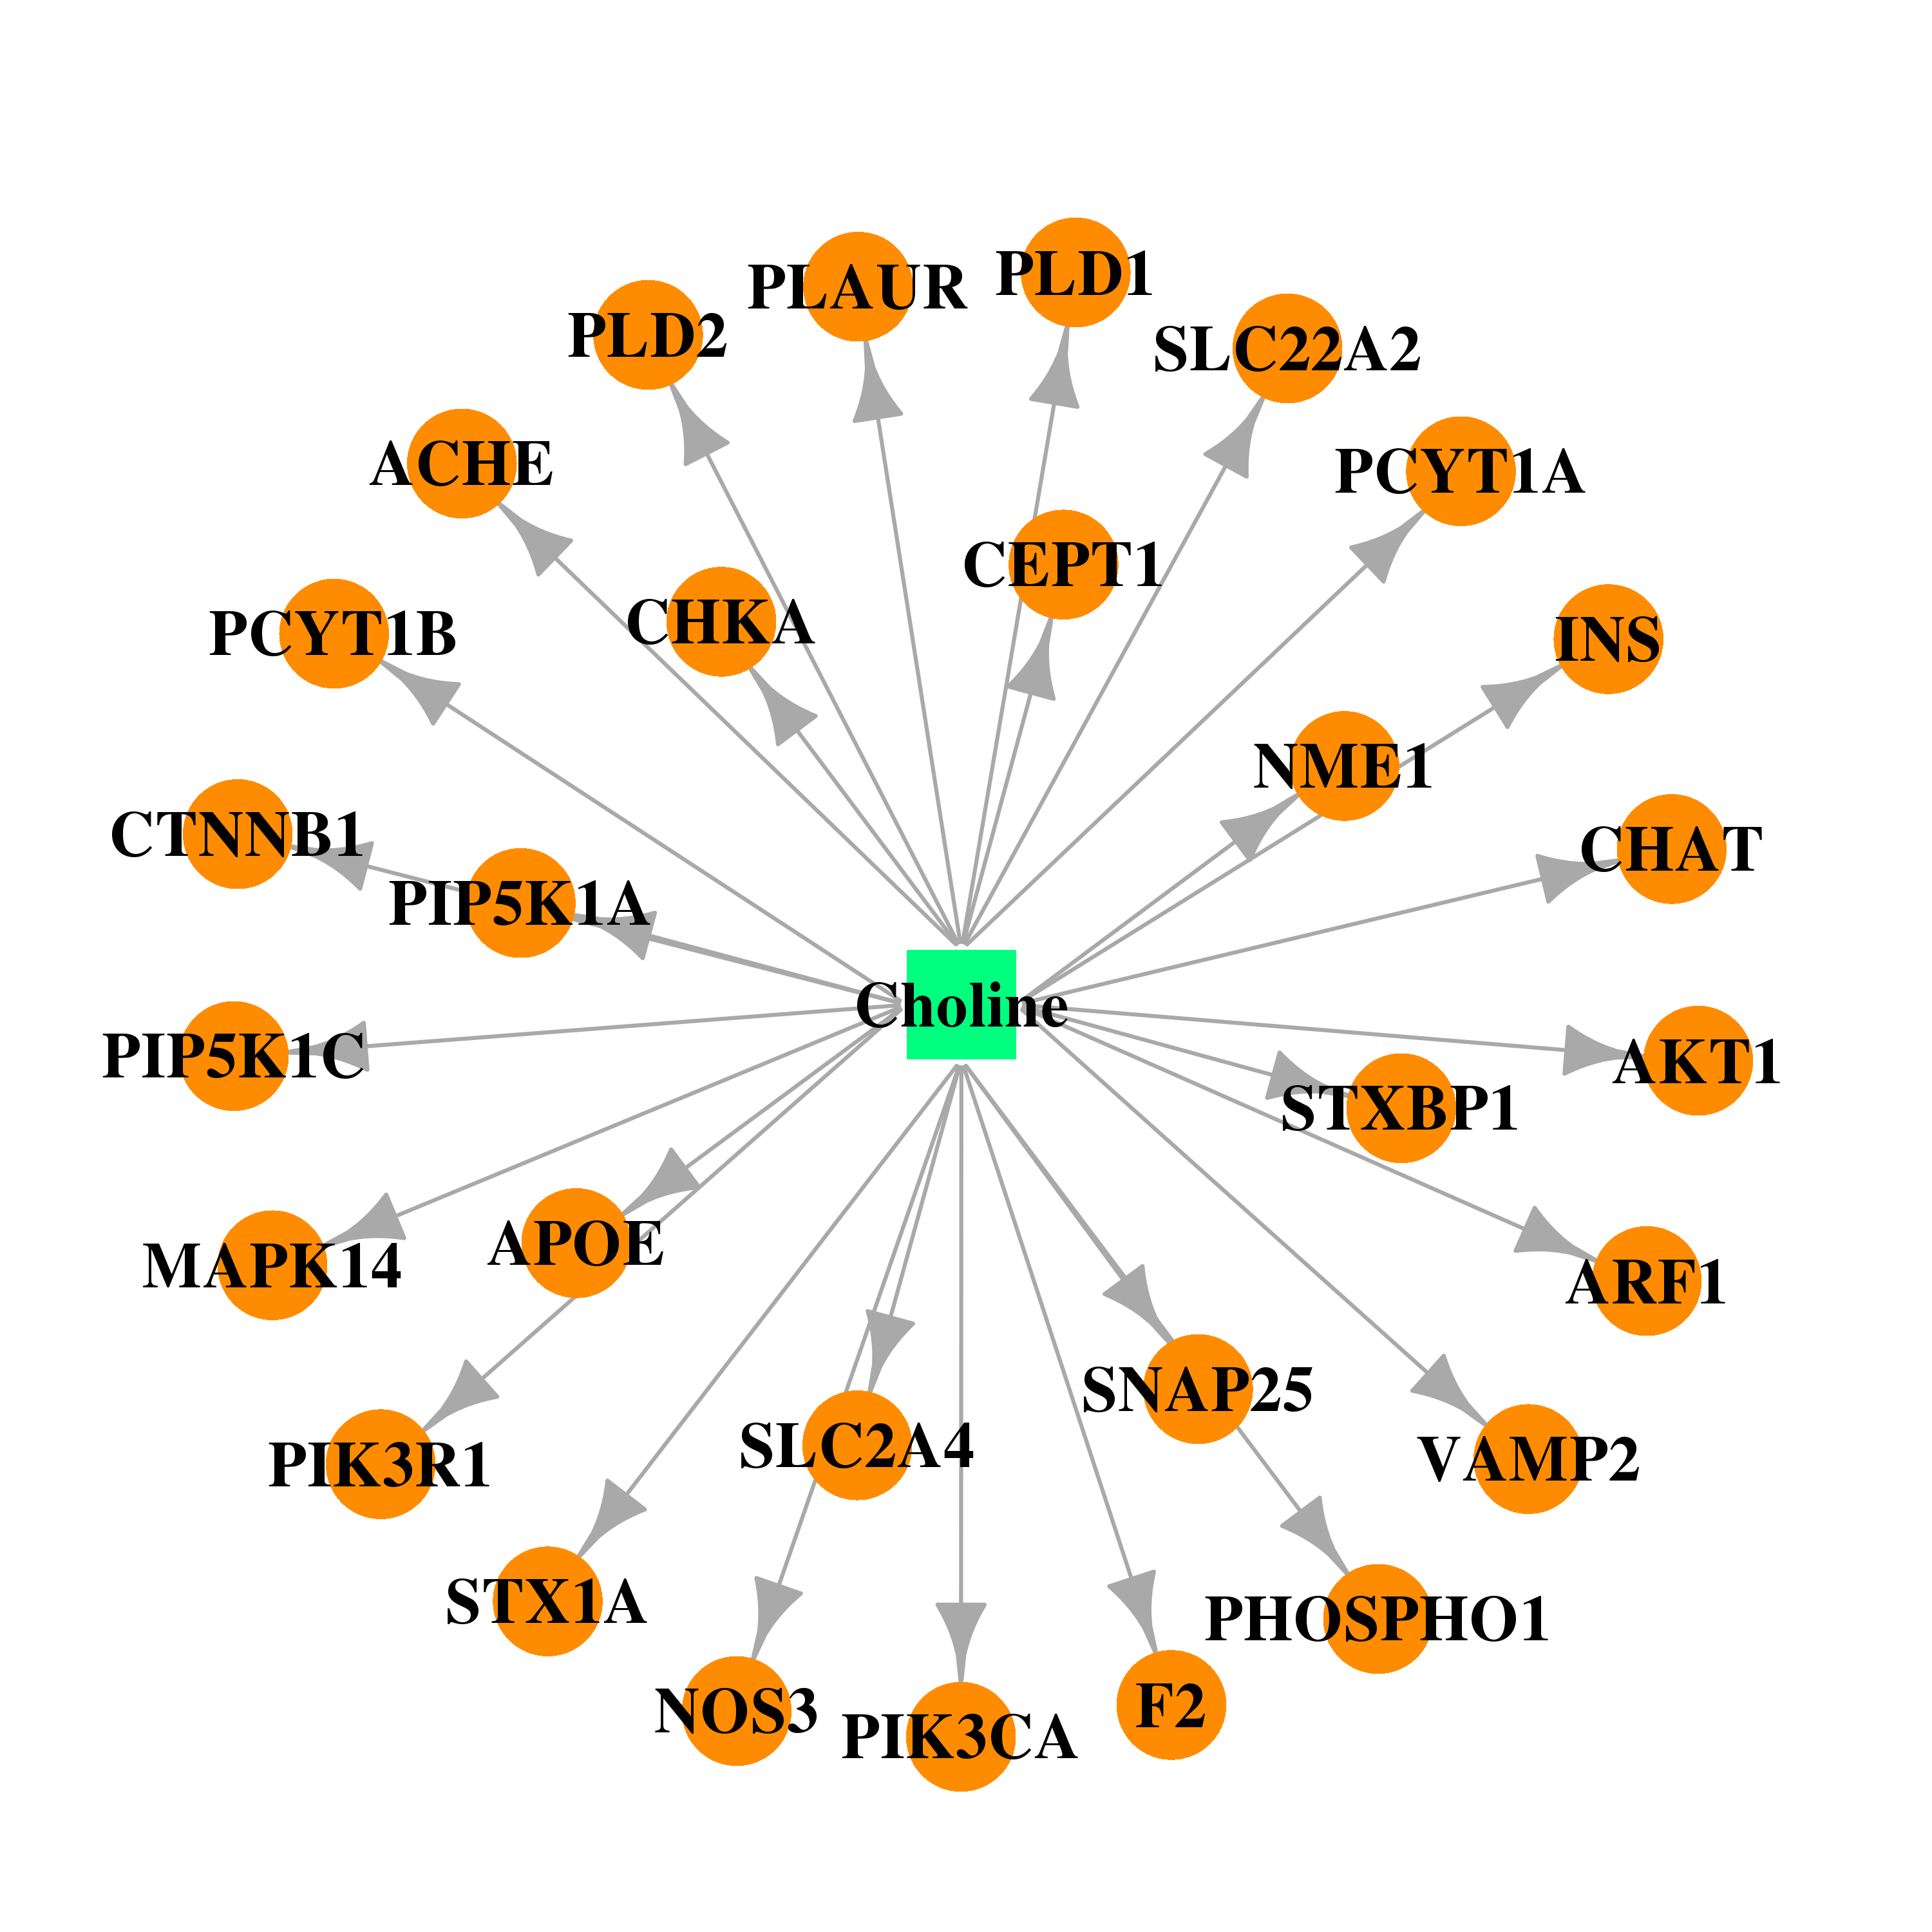 | 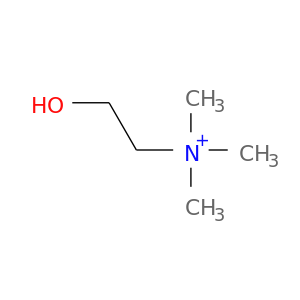 |
| Top |
| Cross referenced IDs for SLC2A4 |
| * We obtained these cross-references from Uniprot database. It covers 150 different DBs, 18 categories. http://www.uniprot.org/help/cross_references_section |
: Open all cross reference information
|
Copyright © 2016-Present - The Univsersity of Texas Health Science Center at Houston @ |