|
|||||||||||||||||||||||||||||||||||||||||||||||||||||||||||||||||||||||||||||||||||||||||||||||||||||||||||||||||||||||||||||||||||||||||||||||||||||||||||||||||||||||||||||||||||||||||||||||||||||||||||||||||||||||||||||||||||||||||||||||||||||||||||||||||||||||||||||||||||||||||||||||||||||||||||||||||||||||||||||||||||||||||||||||||||||||||
| |
| Phenotypic Information (metabolism pathway, cancer, disease, phenome) |
| |
| |
| Gene-Gene Network Information: Co-Expression Network, Interacting Genes & KEGG |
| |
|


| Gene Summary for NADK |
| Basic gene info. | Gene symbol | NADK |
| Gene name | NAD kinase | |
| Synonyms | dJ283E3.1 | |
| Cytomap | UCSC genome browser: 1p36.33 | |
| Genomic location | chr1 :1682670-1711508 | |
| Type of gene | protein-coding | |
| RefGenes | NM_001198993.1, NM_001198994.1,NM_001198995.1,NM_023018.4, | |
| Ensembl id | ENSG00000008130 | |
| Description | poly(P)/ATP NAD kinase | |
| Modification date | 20141207 | |
| dbXrefs | MIM : 611616 | |
| HGNC : HGNC | ||
| Ensembl : ENSG00000008130 | ||
| HPRD : 16907 | ||
| Vega : OTTHUMG00000000942 | ||
| Protein | UniProt: go to UniProt's Cross Reference DB Table | |
| Expression | CleanEX: HS_NADK | |
| BioGPS: 65220 | ||
| Gene Expression Atlas: ENSG00000008130 | ||
| The Human Protein Atlas: ENSG00000008130 | ||
| Pathway | NCI Pathway Interaction Database: NADK | |
| KEGG: NADK | ||
| REACTOME: NADK | ||
| ConsensusPathDB | ||
| Pathway Commons: NADK | ||
| Metabolism | MetaCyc: NADK | |
| HUMANCyc: NADK | ||
| Regulation | Ensembl's Regulation: ENSG00000008130 | |
| miRBase: chr1 :1,682,670-1,711,508 | ||
| TargetScan: NM_001198993 | ||
| cisRED: ENSG00000008130 | ||
| Context | iHOP: NADK | |
| cancer metabolism search in PubMed: NADK | ||
| UCL Cancer Institute: NADK | ||
| Assigned class in ccmGDB | C | |
| Top |
| Phenotypic Information for NADK(metabolism pathway, cancer, disease, phenome) |
| Cancer | CGAP: NADK |
| Familial Cancer Database: NADK | |
| * This gene is included in those cancer gene databases. |
|
|
|
|
|
| . | |||||||||||||||||||||||||||||||||||||||||||||||||||||||||||||||||||||||||||||||||||||||||||||||||||||||||||||||||||||||||||||||||||||||||||||||||||||||||||||||||||||||||||||||||||||||||||||||||||||||||||||||||||||||||||||||||||||||||||||||||||||||||||||||||||||||||||||||||||||||||||||||||||||||||||||||||||||||||||||||||||||||||||||||||||
Oncogene 1 | Significant driver gene in | ||||||||||||||||||||||||||||||||||||||||||||||||||||||||||||||||||||||||||||||||||||||||||||||||||||||||||||||||||||||||||||||||||||||||||||||||||||||||||||||||||||||||||||||||||||||||||||||||||||||||||||||||||||||||||||||||||||||||||||||||||||||||||||||||||||||||||||||||||||||||||||||||||||||||||||||||||||||||||||||||||||||||||||||||||||||||
| cf) number; DB name 1 Oncogene; http://nar.oxfordjournals.org/content/35/suppl_1/D721.long, 2 Tumor Suppressor gene; https://bioinfo.uth.edu/TSGene/, 3 Cancer Gene Census; http://www.nature.com/nrc/journal/v4/n3/abs/nrc1299.html, 4 CancerGenes; http://nar.oxfordjournals.org/content/35/suppl_1/D721.long, 5 Network of Cancer Gene; http://ncg.kcl.ac.uk/index.php, 1Therapeutic Vulnerabilities in Cancer; http://cbio.mskcc.org/cancergenomics/statius/ |
| KEGG_NICOTINATE_AND_NICOTINAMIDE_METABOLISM REACTOME_METABOLISM_OF_VITAMINS_AND_COFACTORS | |
| OMIM | |
| Orphanet | |
| Disease | KEGG Disease: NADK |
| MedGen: NADK (Human Medical Genetics with Condition) | |
| ClinVar: NADK | |
| Phenotype | MGI: NADK (International Mouse Phenotyping Consortium) |
| PhenomicDB: NADK | |
| Mutations for NADK |
| * Under tables are showing count per each tissue to give us broad intuition about tissue specific mutation patterns.You can go to the detailed page for each mutation database's web site. |
| - Statistics for Tissue and Mutation type | Top |
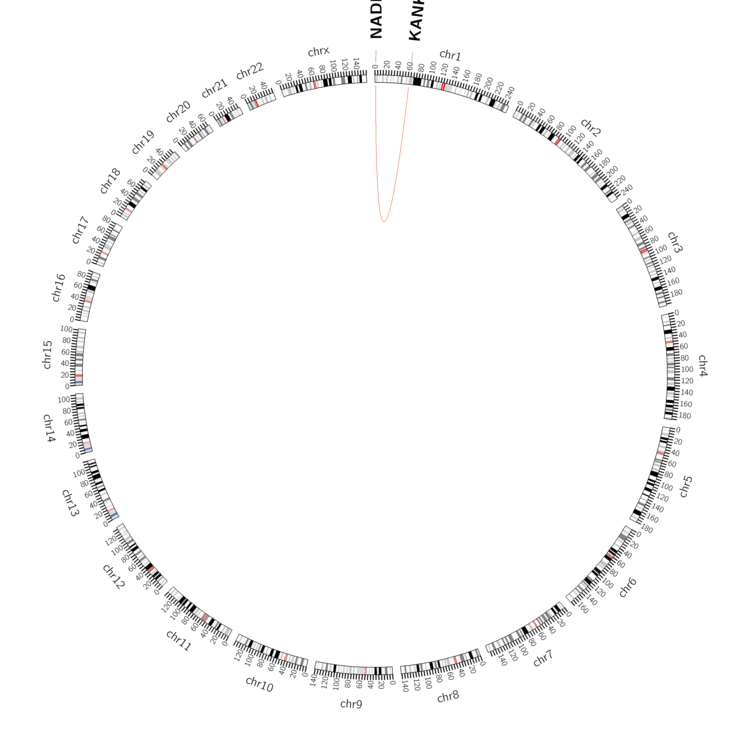 |
| - For Inter-chromosomal Variations |
| There's no inter-chromosomal structural variation. |
| - For Intra-chromosomal Variations |
| * Intra-chromosomal variantions includes 'intrachromosomal amplicon to amplicon', 'intrachromosomal amplicon to non-amplified dna', 'intrachromosomal deletion', 'intrachromosomal fold-back inversion', 'intrachromosomal inversion', 'intrachromosomal tandem duplication', 'Intrachromosomal unknown type', 'intrachromosomal with inverted orientation', 'intrachromosomal with non-inverted orientation'. |
 |
| Sample | Symbol_a | Chr_a | Start_a | End_a | Symbol_b | Chr_b | Start_b | End_b |
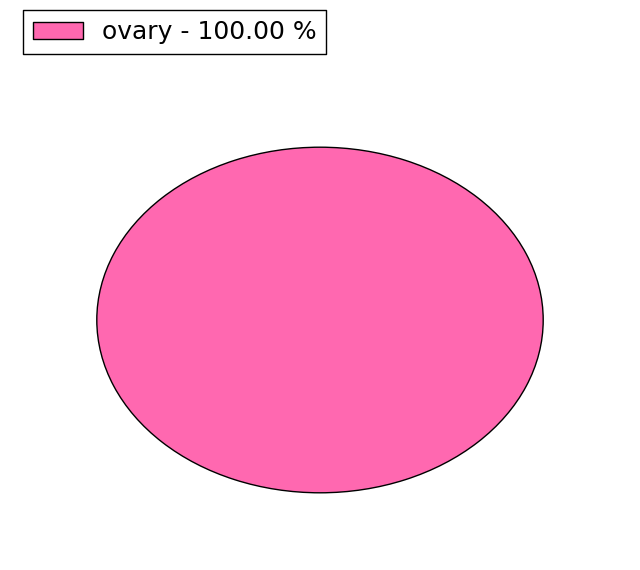
| ovary | NADK | chr1 | 1707983 | 1708003 | KANK4 | chr1 | 62781915 | 62781935 |
| cf) Tissue number; Tissue name (1;Breast, 2;Central_nervous_system, 3;Haematopoietic_and_lymphoid_tissue, 4;Large_intestine, 5;Liver, 6;Lung, 7;Ovary, 8;Pancreas, 9;Prostate, 10;Skin, 11;Soft_tissue, 12;Upper_aerodigestive_tract) |
| * From mRNA Sanger sequences, Chitars2.0 arranged chimeric transcripts. This table shows NADK related fusion information. |
| ID | Head Gene | Tail Gene | Accession | Gene_a | qStart_a | qEnd_a | Chromosome_a | tStart_a | tEnd_a | Gene_a | qStart_a | qEnd_a | Chromosome_a | tStart_a | tEnd_a |
| Top |
| Mutation type/ Tissue ID | brca | cns | cerv | endome | haematopo | kidn | Lintest | liver | lung | ns | ovary | pancre | prost | skin | stoma | thyro | urina | |||
| Total # sample | 1 | |||||||||||||||||||
| GAIN (# sample) | ||||||||||||||||||||
| LOSS (# sample) | 1 |
| cf) Tissue ID; Tissue type (1; Breast, 2; Central_nervous_system, 3; Cervix, 4; Endometrium, 5; Haematopoietic_and_lymphoid_tissue, 6; Kidney, 7; Large_intestine, 8; Liver, 9; Lung, 10; NS, 11; Ovary, 12; Pancreas, 13; Prostate, 14; Skin, 15; Stomach, 16; Thyroid, 17; Urinary_tract) |
| Top |
|
 |
| Top |
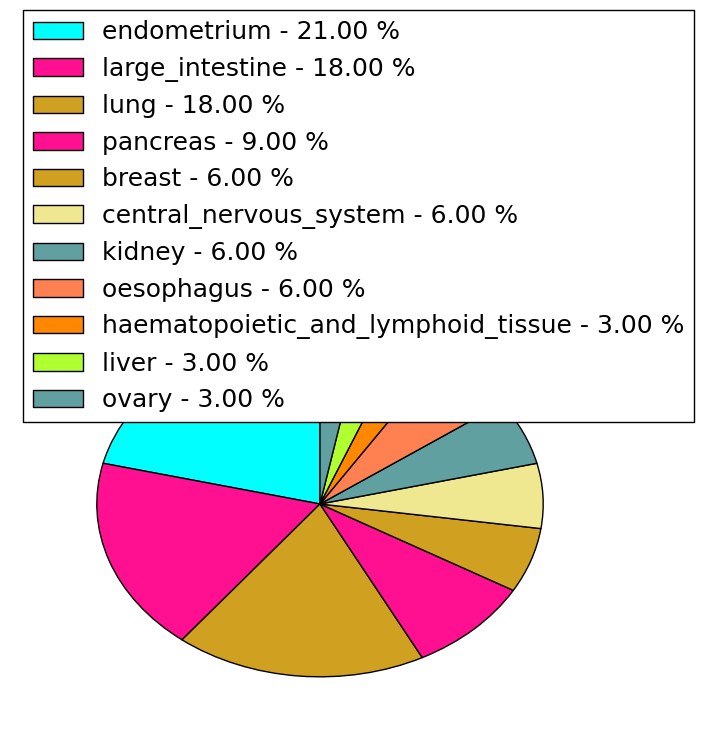
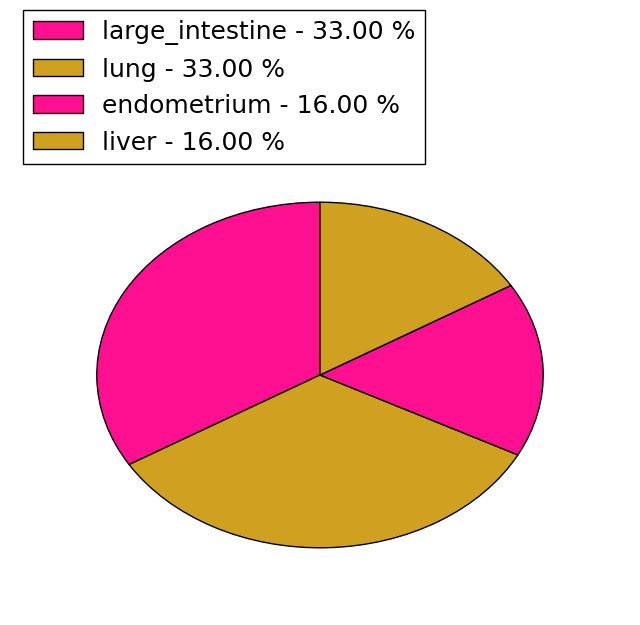
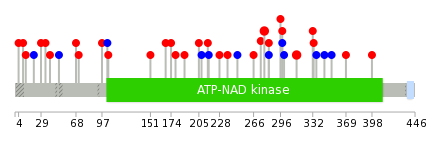
| Stat. for Non-Synonymous SNVs (# total SNVs=33) | (# total SNVs=6) |
 |  |
(# total SNVs=1) | (# total SNVs=2) |
 |  |
| Top |
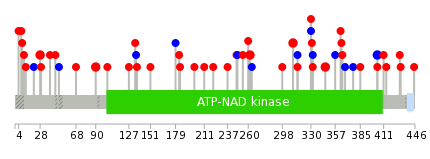
| * When you move the cursor on each content, you can see more deailed mutation information on the Tooltip. Those are primary_site,primary_histology,mutation(aa),pubmedID. |
| GRCh37 position | Mutation(aa) | Unique sampleID count |
| chr1:1684347-1684348 | p.E445_G446insE | 2 |
| chr1:1686834-1686834 | p.Q223* | 2 |
| chr1:1696764-1696764 | p.G28S | 2 |
| chr1:1685737-1685737 | p.T310M | 2 |
| chr1:1685554-1685554 | p.T346M | 2 |
| chr1:1686040-1686040 | p.N262K | 2 |
| chr1:1688745-1688745 | p.I90F | 2 |
| chr1:1684472-1684472 | p.P404P | 2 |
| chr1:1696825-1696825 | p.K7N | 1 |
| chr1:1686064-1686064 | p.A254fs | 1 |
| Top |
|
 |
| Point Mutation/ Tissue ID | 1 | 2 | 3 | 4 | 5 | 6 | 7 | 8 | 9 | 10 | 11 | 12 | 13 | 14 | 15 | 16 | 17 | 18 | 19 | 20 |
| # sample | 2 | 1 | 8 | 1 | 1 | 4 | 1 | 1 | 5 | 10 | 1 | 8 | ||||||||
| # mutation | 2 | 1 | 8 | 1 | 1 | 4 | 1 | 1 | 5 | 10 | 1 | 9 | ||||||||
| nonsynonymous SNV | 2 | 1 | 6 | 1 | 3 | 1 | 1 | 3 | 5 | 1 | 8 | |||||||||
| synonymous SNV | 2 | 1 | 1 | 2 | 5 | 1 |
| cf) Tissue ID; Tissue type (1; BLCA[Bladder Urothelial Carcinoma], 2; BRCA[Breast invasive carcinoma], 3; CESC[Cervical squamous cell carcinoma and endocervical adenocarcinoma], 4; COAD[Colon adenocarcinoma], 5; GBM[Glioblastoma multiforme], 6; Glioma Low Grade, 7; HNSC[Head and Neck squamous cell carcinoma], 8; KICH[Kidney Chromophobe], 9; KIRC[Kidney renal clear cell carcinoma], 10; KIRP[Kidney renal papillary cell carcinoma], 11; LAML[Acute Myeloid Leukemia], 12; LUAD[Lung adenocarcinoma], 13; LUSC[Lung squamous cell carcinoma], 14; OV[Ovarian serous cystadenocarcinoma ], 15; PAAD[Pancreatic adenocarcinoma], 16; PRAD[Prostate adenocarcinoma], 17; SKCM[Skin Cutaneous Melanoma], 18:STAD[Stomach adenocarcinoma], 19:THCA[Thyroid carcinoma], 20:UCEC[Uterine Corpus Endometrial Carcinoma]) |
| Top |
| * We represented just top 10 SNVs. When you move the cursor on each content, you can see more deailed mutation information on the Tooltip. Those are primary_site, primary_histology, mutation(aa), pubmedID. |
| Genomic Position | Mutation(aa) | Unique sampleID count |
| chr1:1685554 | p.T278M,NADK | 2 |
| chr1:1685737 | p.T314M,NADK | 2 |
| chr1:1688036 | p.A296V,NADK | 1 |
| chr1:1696783 | p.V104M,NADK | 1 |
| chr1:1686082 | p.G283G,NADK | 1 |
| chr1:1688055 | p.I103I,NADK | 1 |
| chr1:1685595 | p.G283E,NADK | 1 |
| chr1:1696810 | p.C274S | 1 |
| chr1:1686085 | p.R237C | 1 |
| chr1:1688616 | p.N266I,NADK | 1 |
| * Copy number data were extracted from TCGA using R package TCGA-Assembler. The URLs of all public data files on TCGA DCC data server were gathered on Jan-05-2015. Function ProcessCNAData in TCGA-Assembler package was used to obtain gene-level copy number value which is calculated as the average copy number of the genomic region of a gene. |
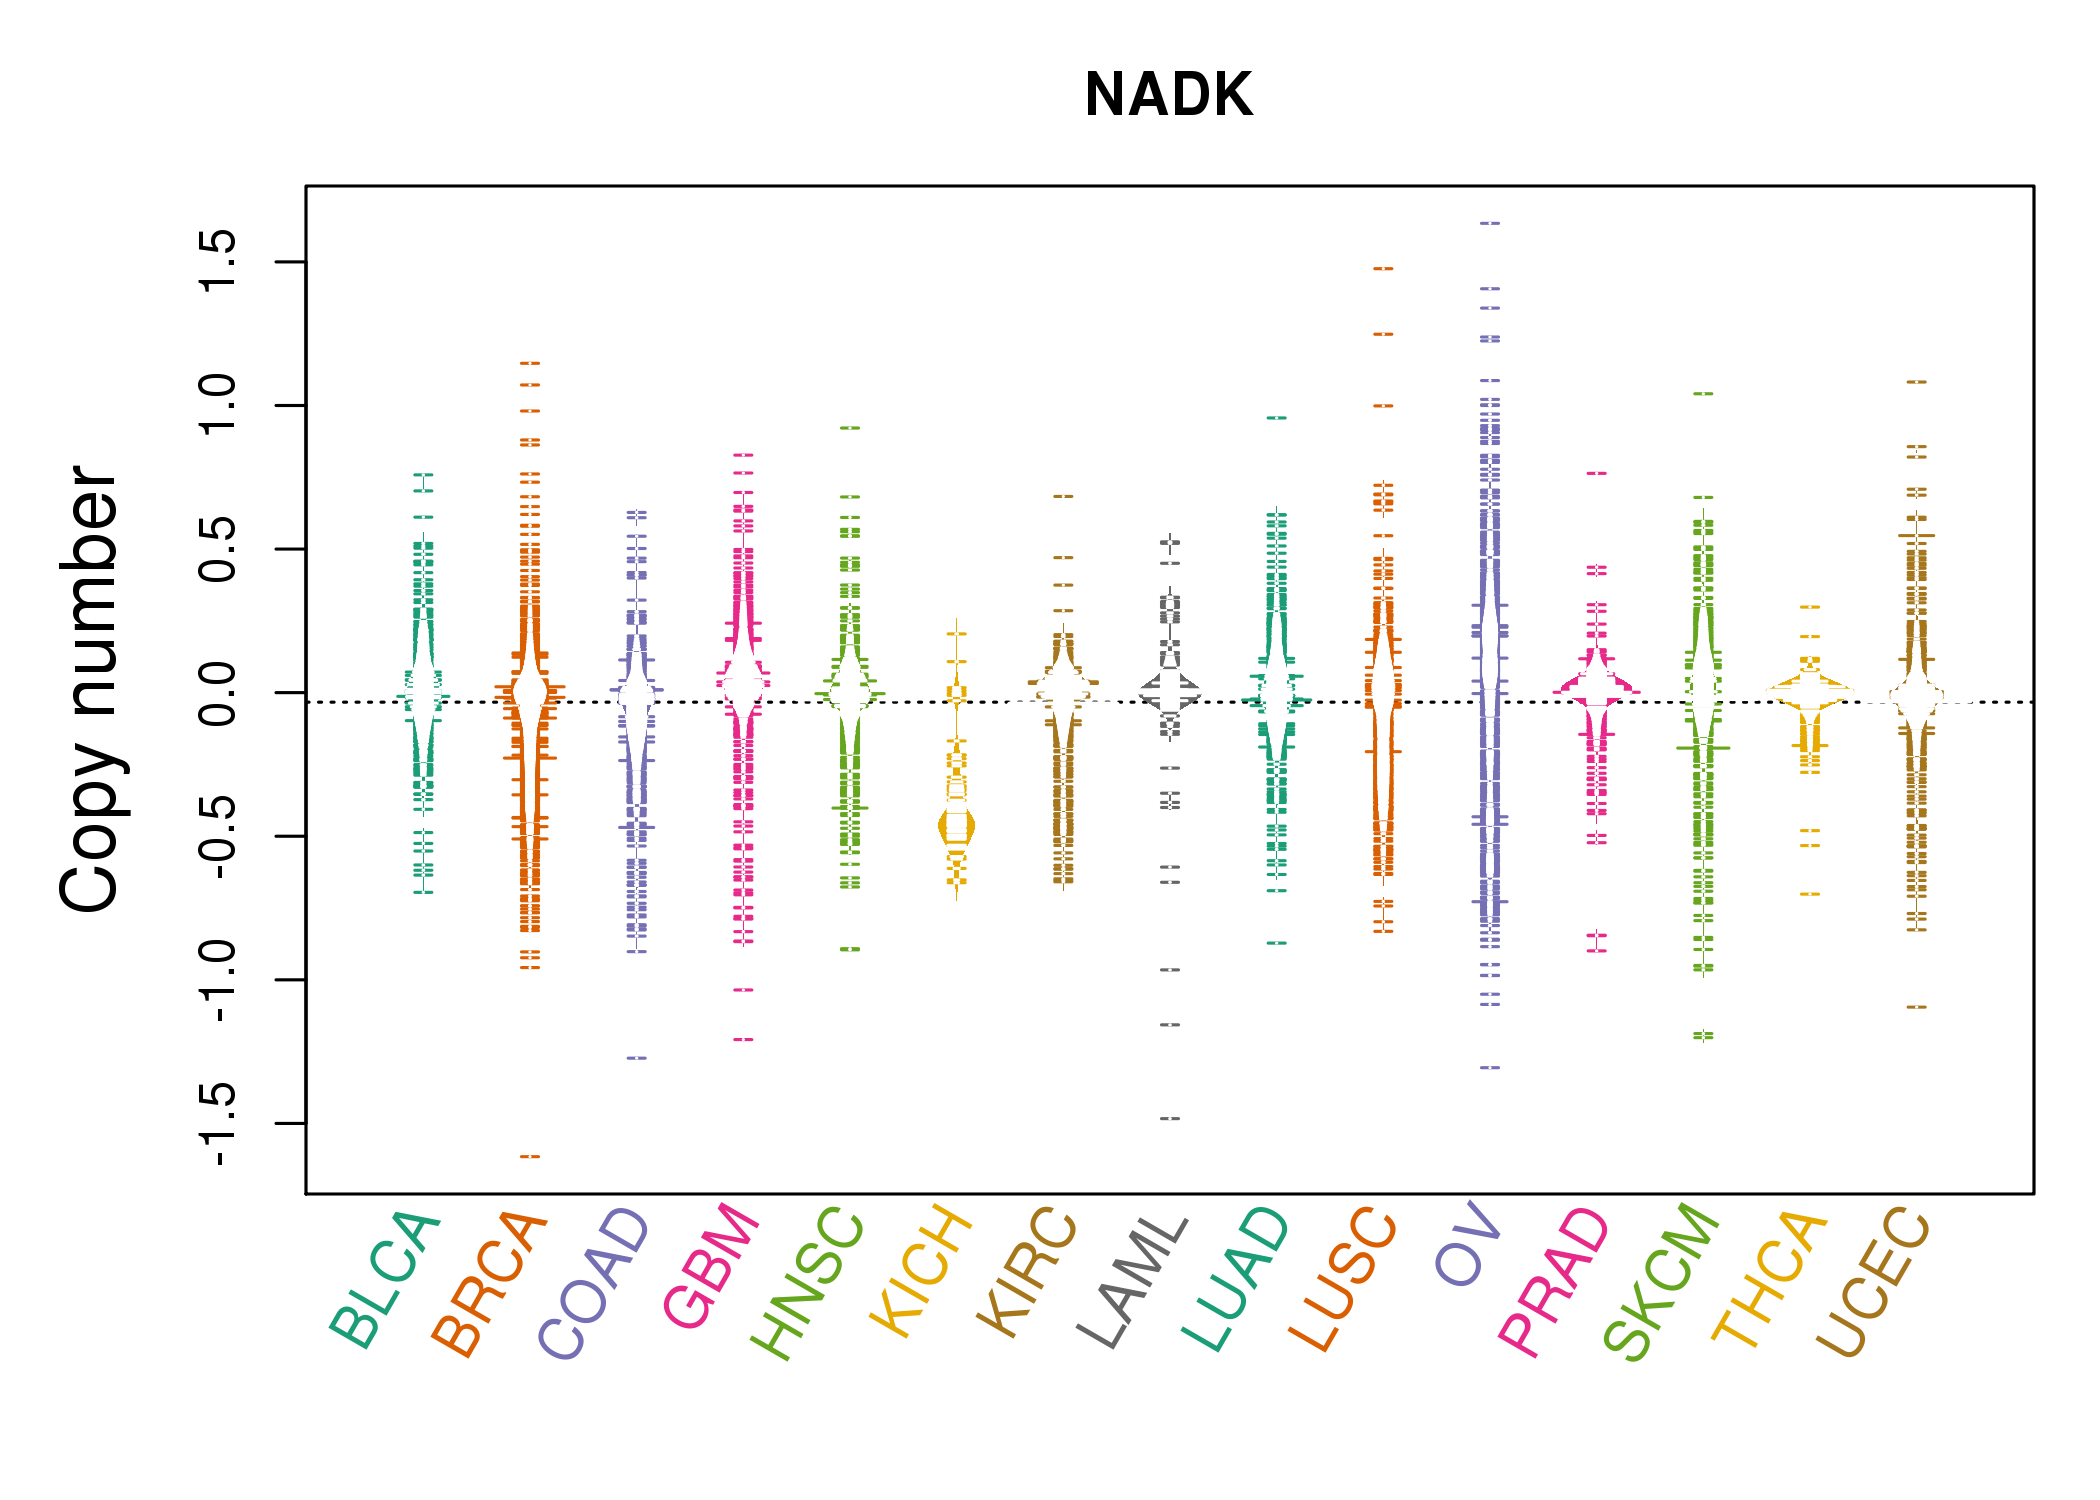 |
| cf) Tissue ID[Tissue type]: BLCA[Bladder Urothelial Carcinoma], BRCA[Breast invasive carcinoma], CESC[Cervical squamous cell carcinoma and endocervical adenocarcinoma], COAD[Colon adenocarcinoma], GBM[Glioblastoma multiforme], Glioma Low Grade, HNSC[Head and Neck squamous cell carcinoma], KICH[Kidney Chromophobe], KIRC[Kidney renal clear cell carcinoma], KIRP[Kidney renal papillary cell carcinoma], LAML[Acute Myeloid Leukemia], LUAD[Lung adenocarcinoma], LUSC[Lung squamous cell carcinoma], OV[Ovarian serous cystadenocarcinoma ], PAAD[Pancreatic adenocarcinoma], PRAD[Prostate adenocarcinoma], SKCM[Skin Cutaneous Melanoma], STAD[Stomach adenocarcinoma], THCA[Thyroid carcinoma], UCEC[Uterine Corpus Endometrial Carcinoma] |
| Top |
| Gene Expression for NADK |
| * CCLE gene expression data were extracted from CCLE_Expression_Entrez_2012-10-18.res: Gene-centric RMA-normalized mRNA expression data. |
 |
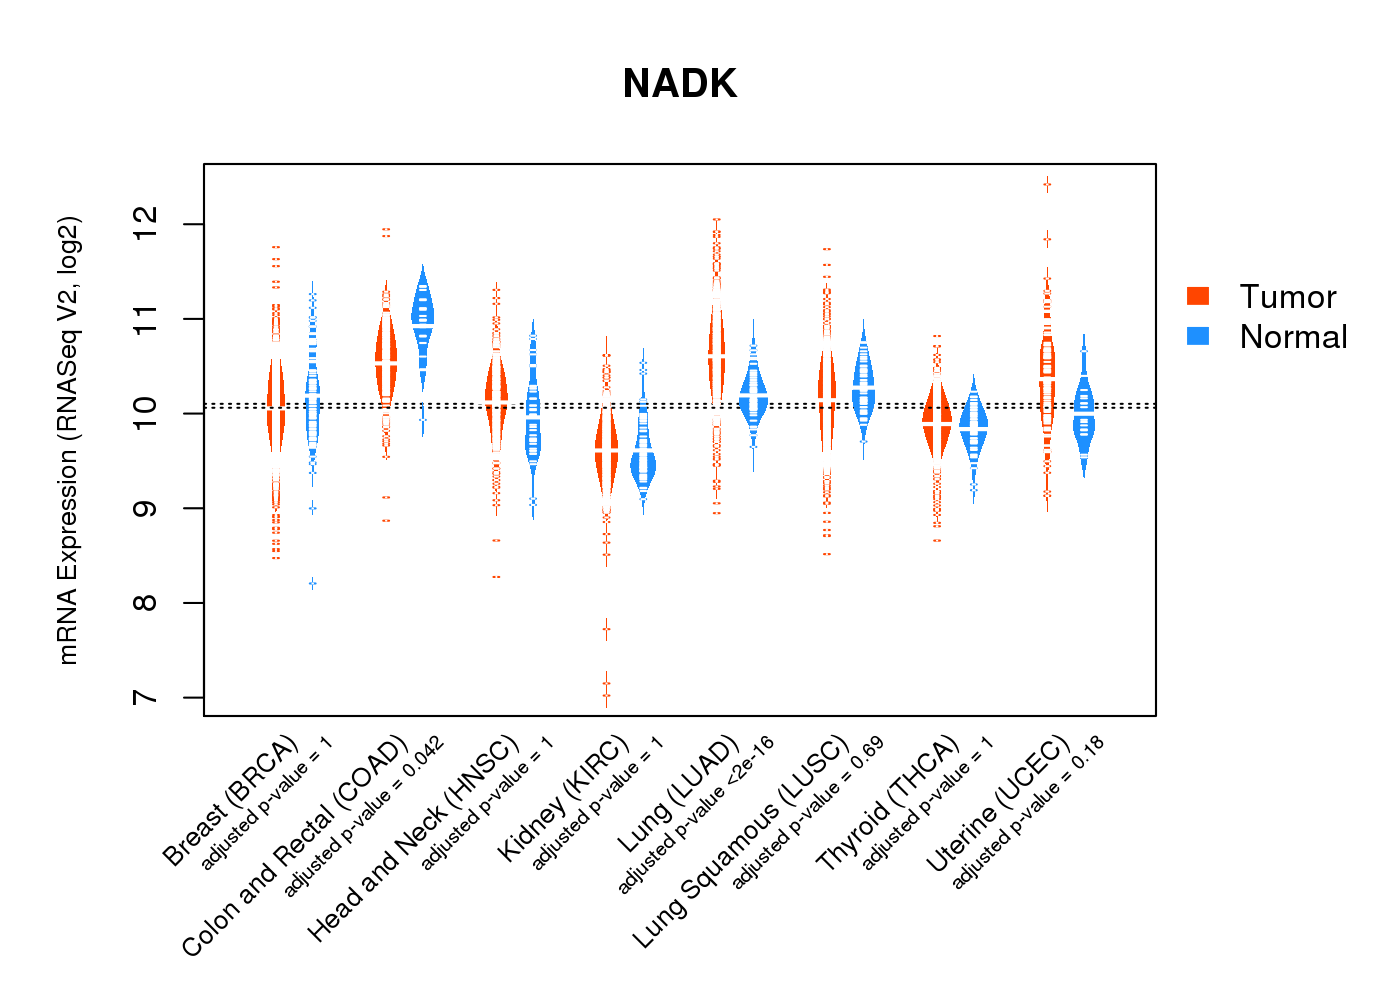
| * Normalized gene expression data of RNASeqV2 was extracted from TCGA using R package TCGA-Assembler. The URLs of all public data files on TCGA DCC data server were gathered at Jan-05-2015. Only eight cancer types have enough normal control samples for differential expression analysis. (t test, adjusted p<0.05 (using Benjamini-Hochberg FDR)) |
 |
| Top |
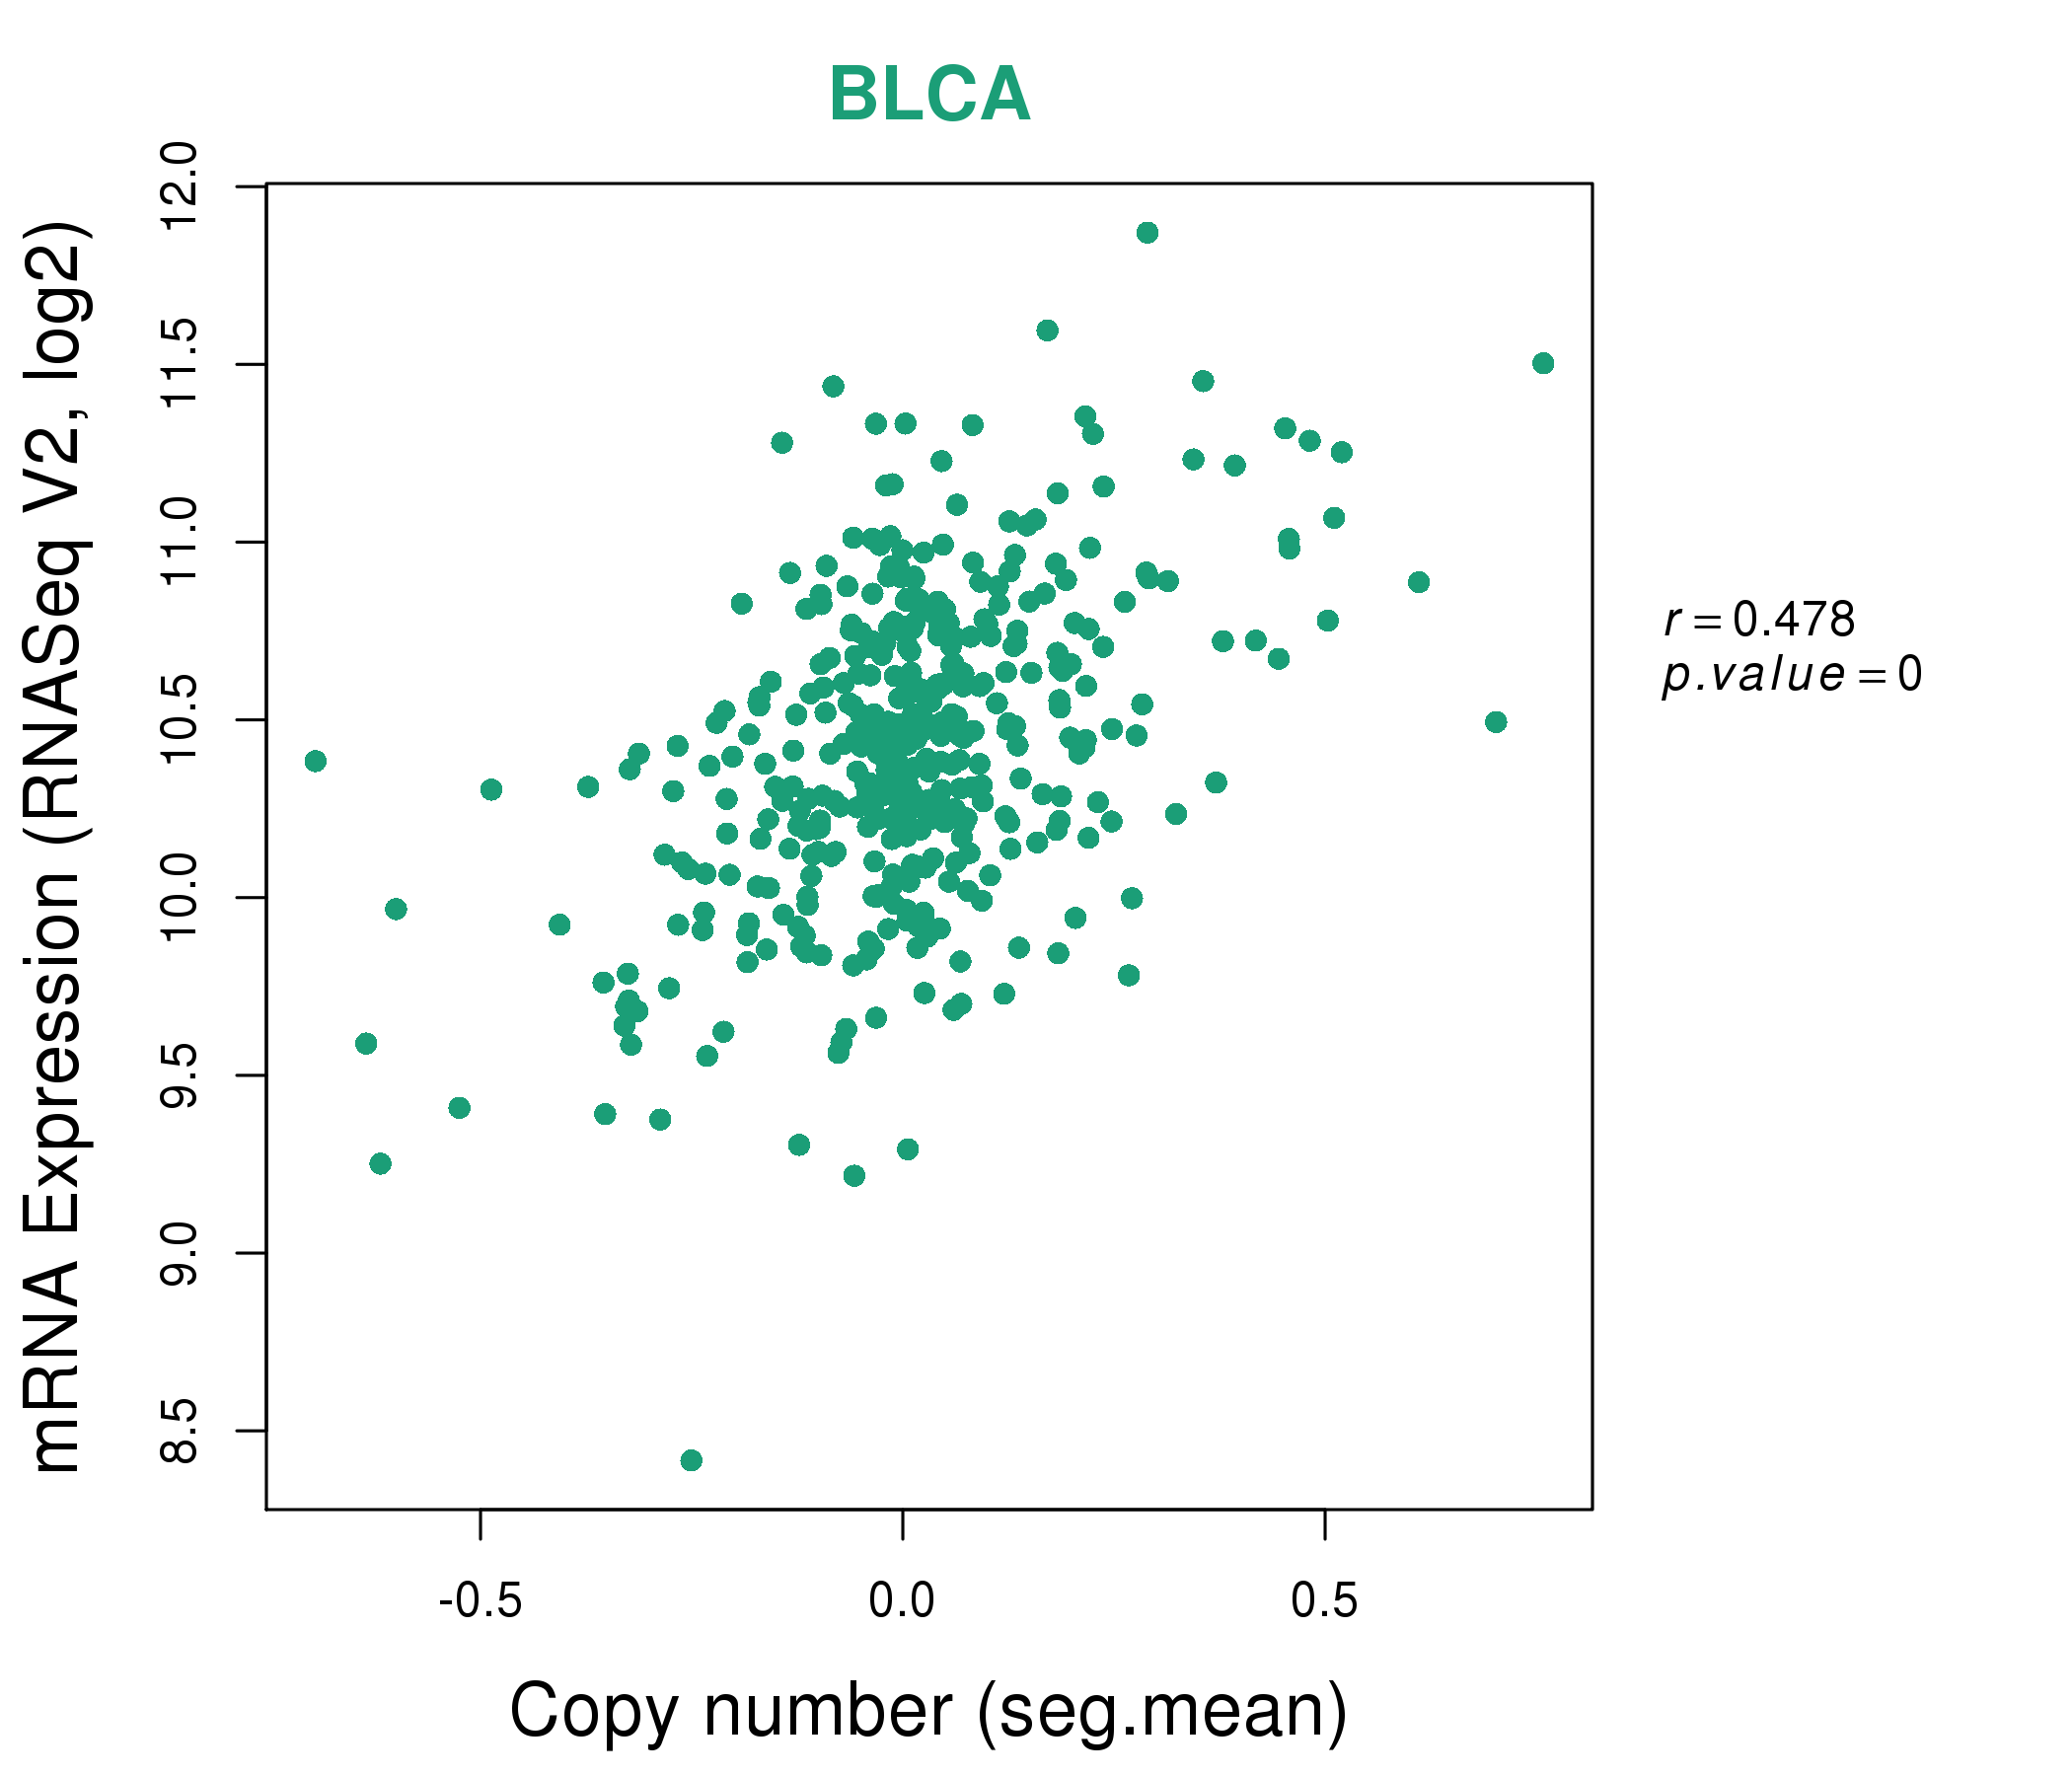
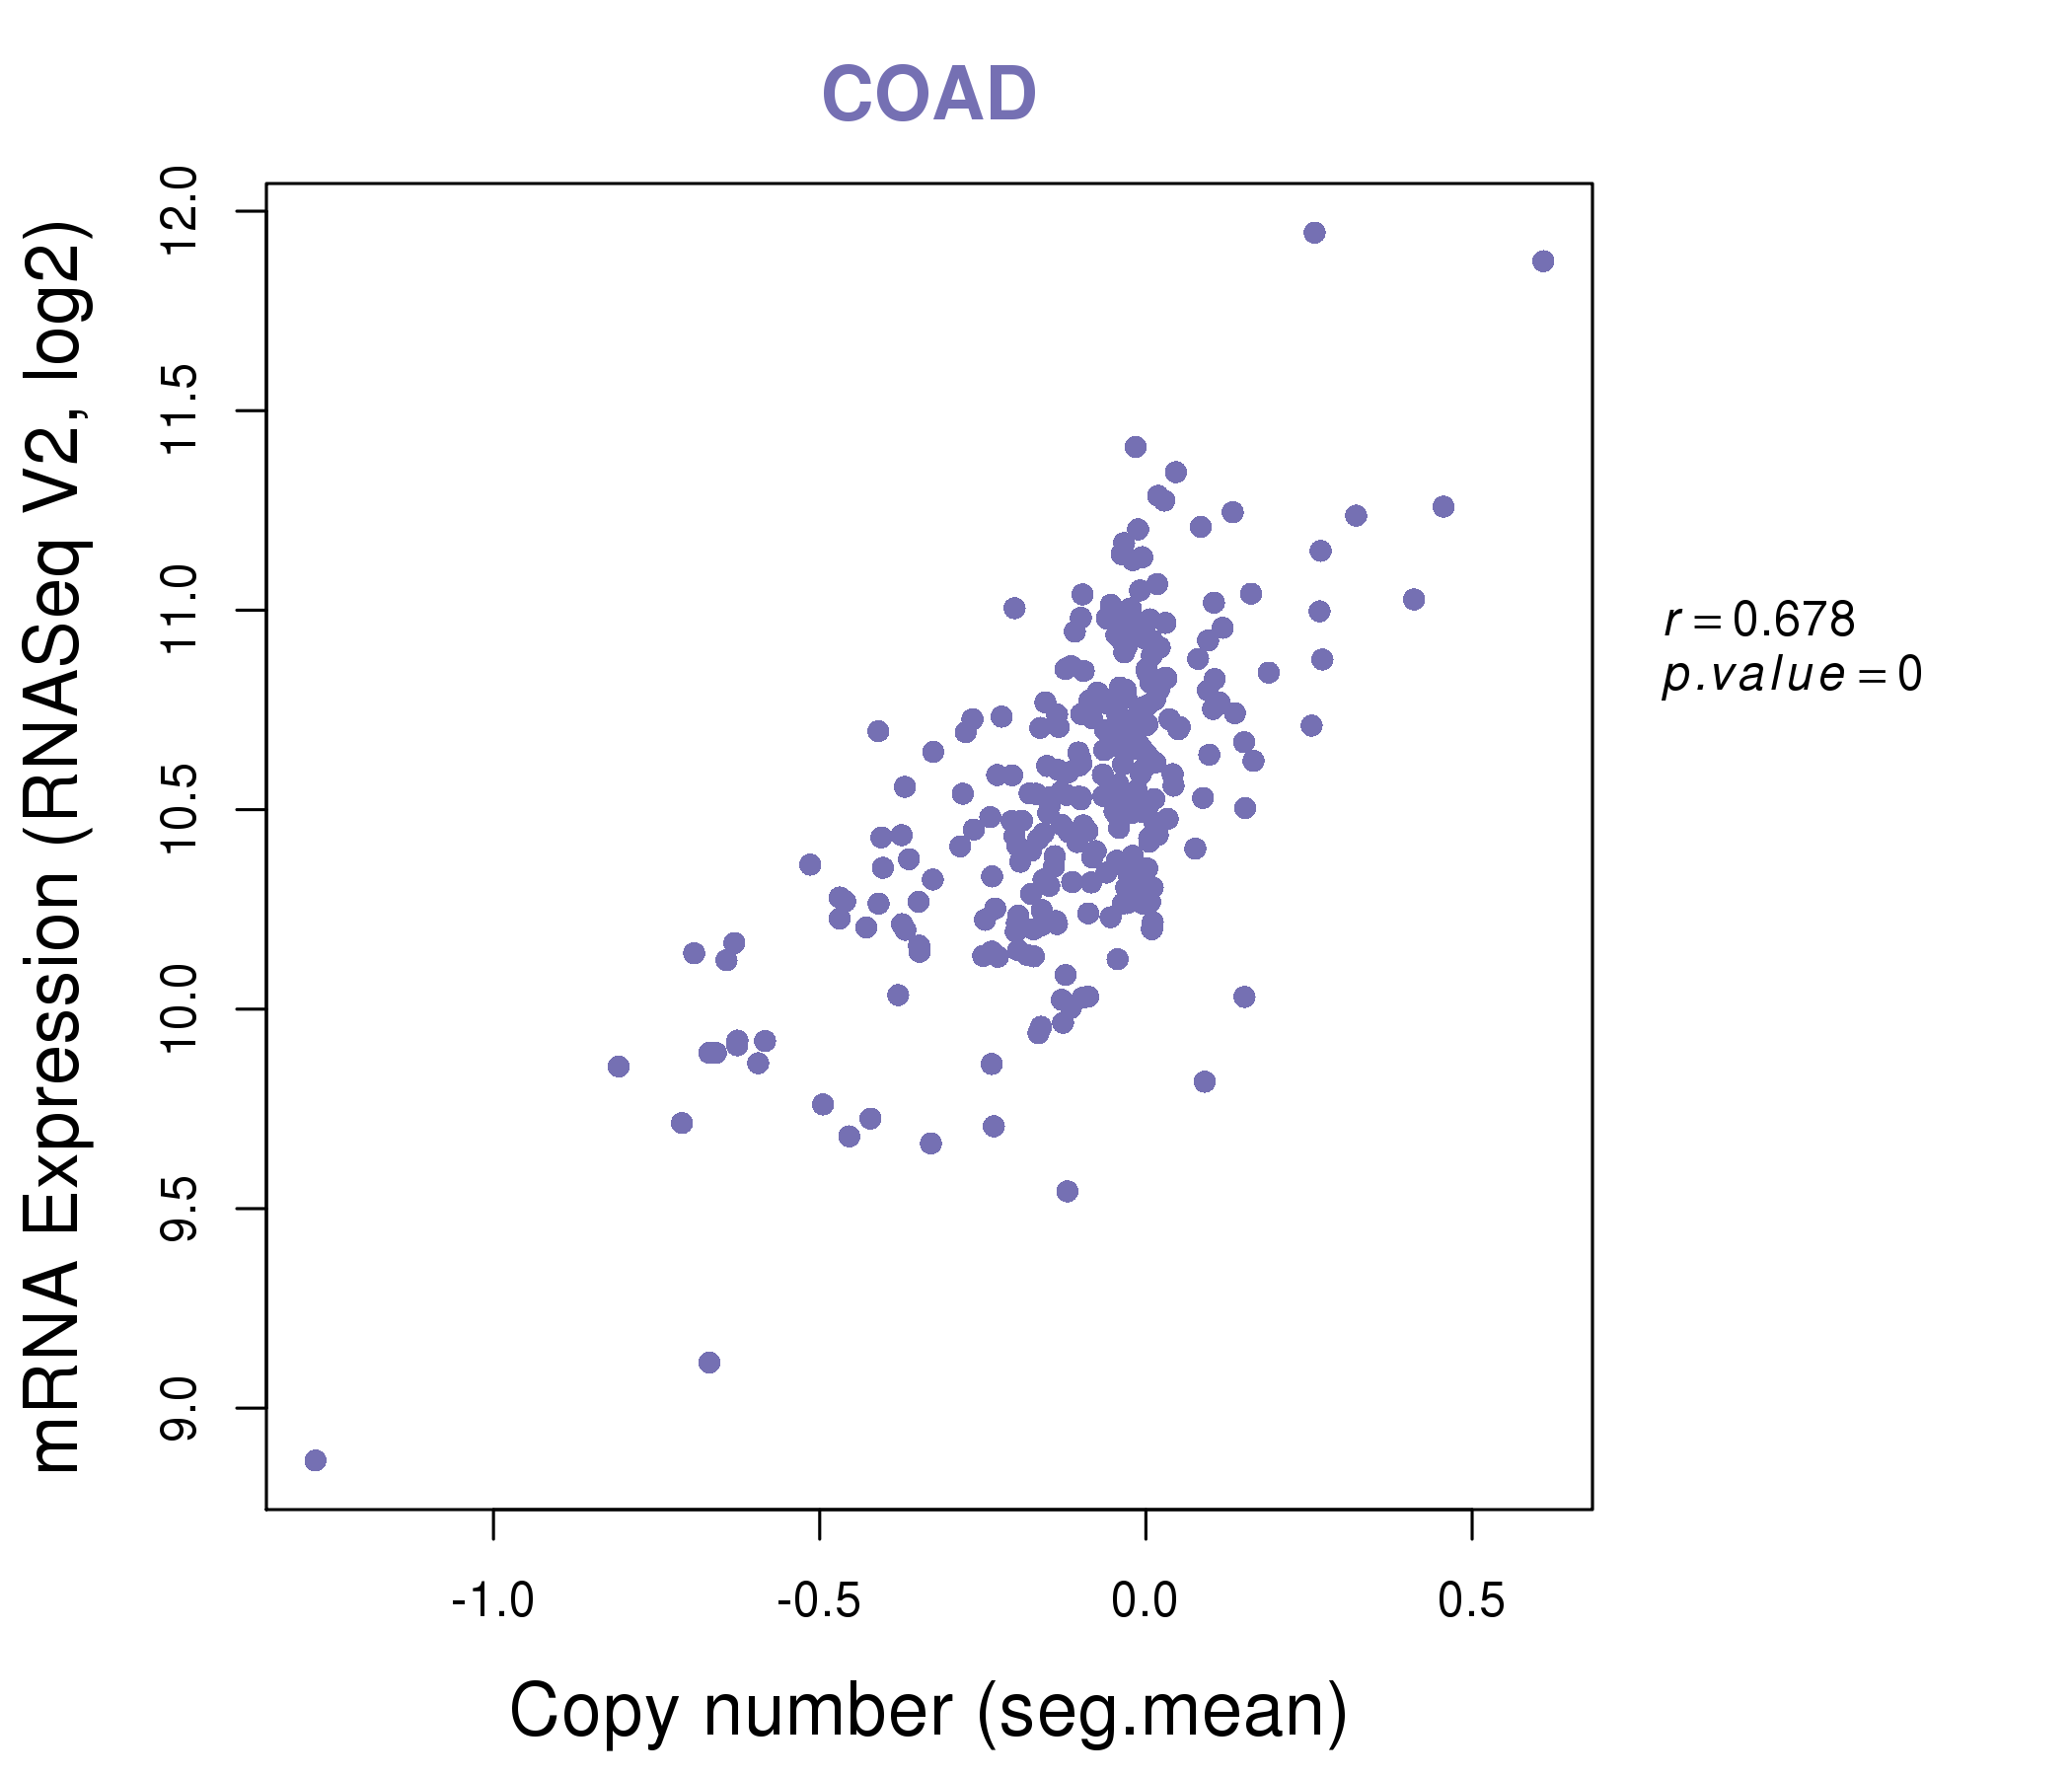
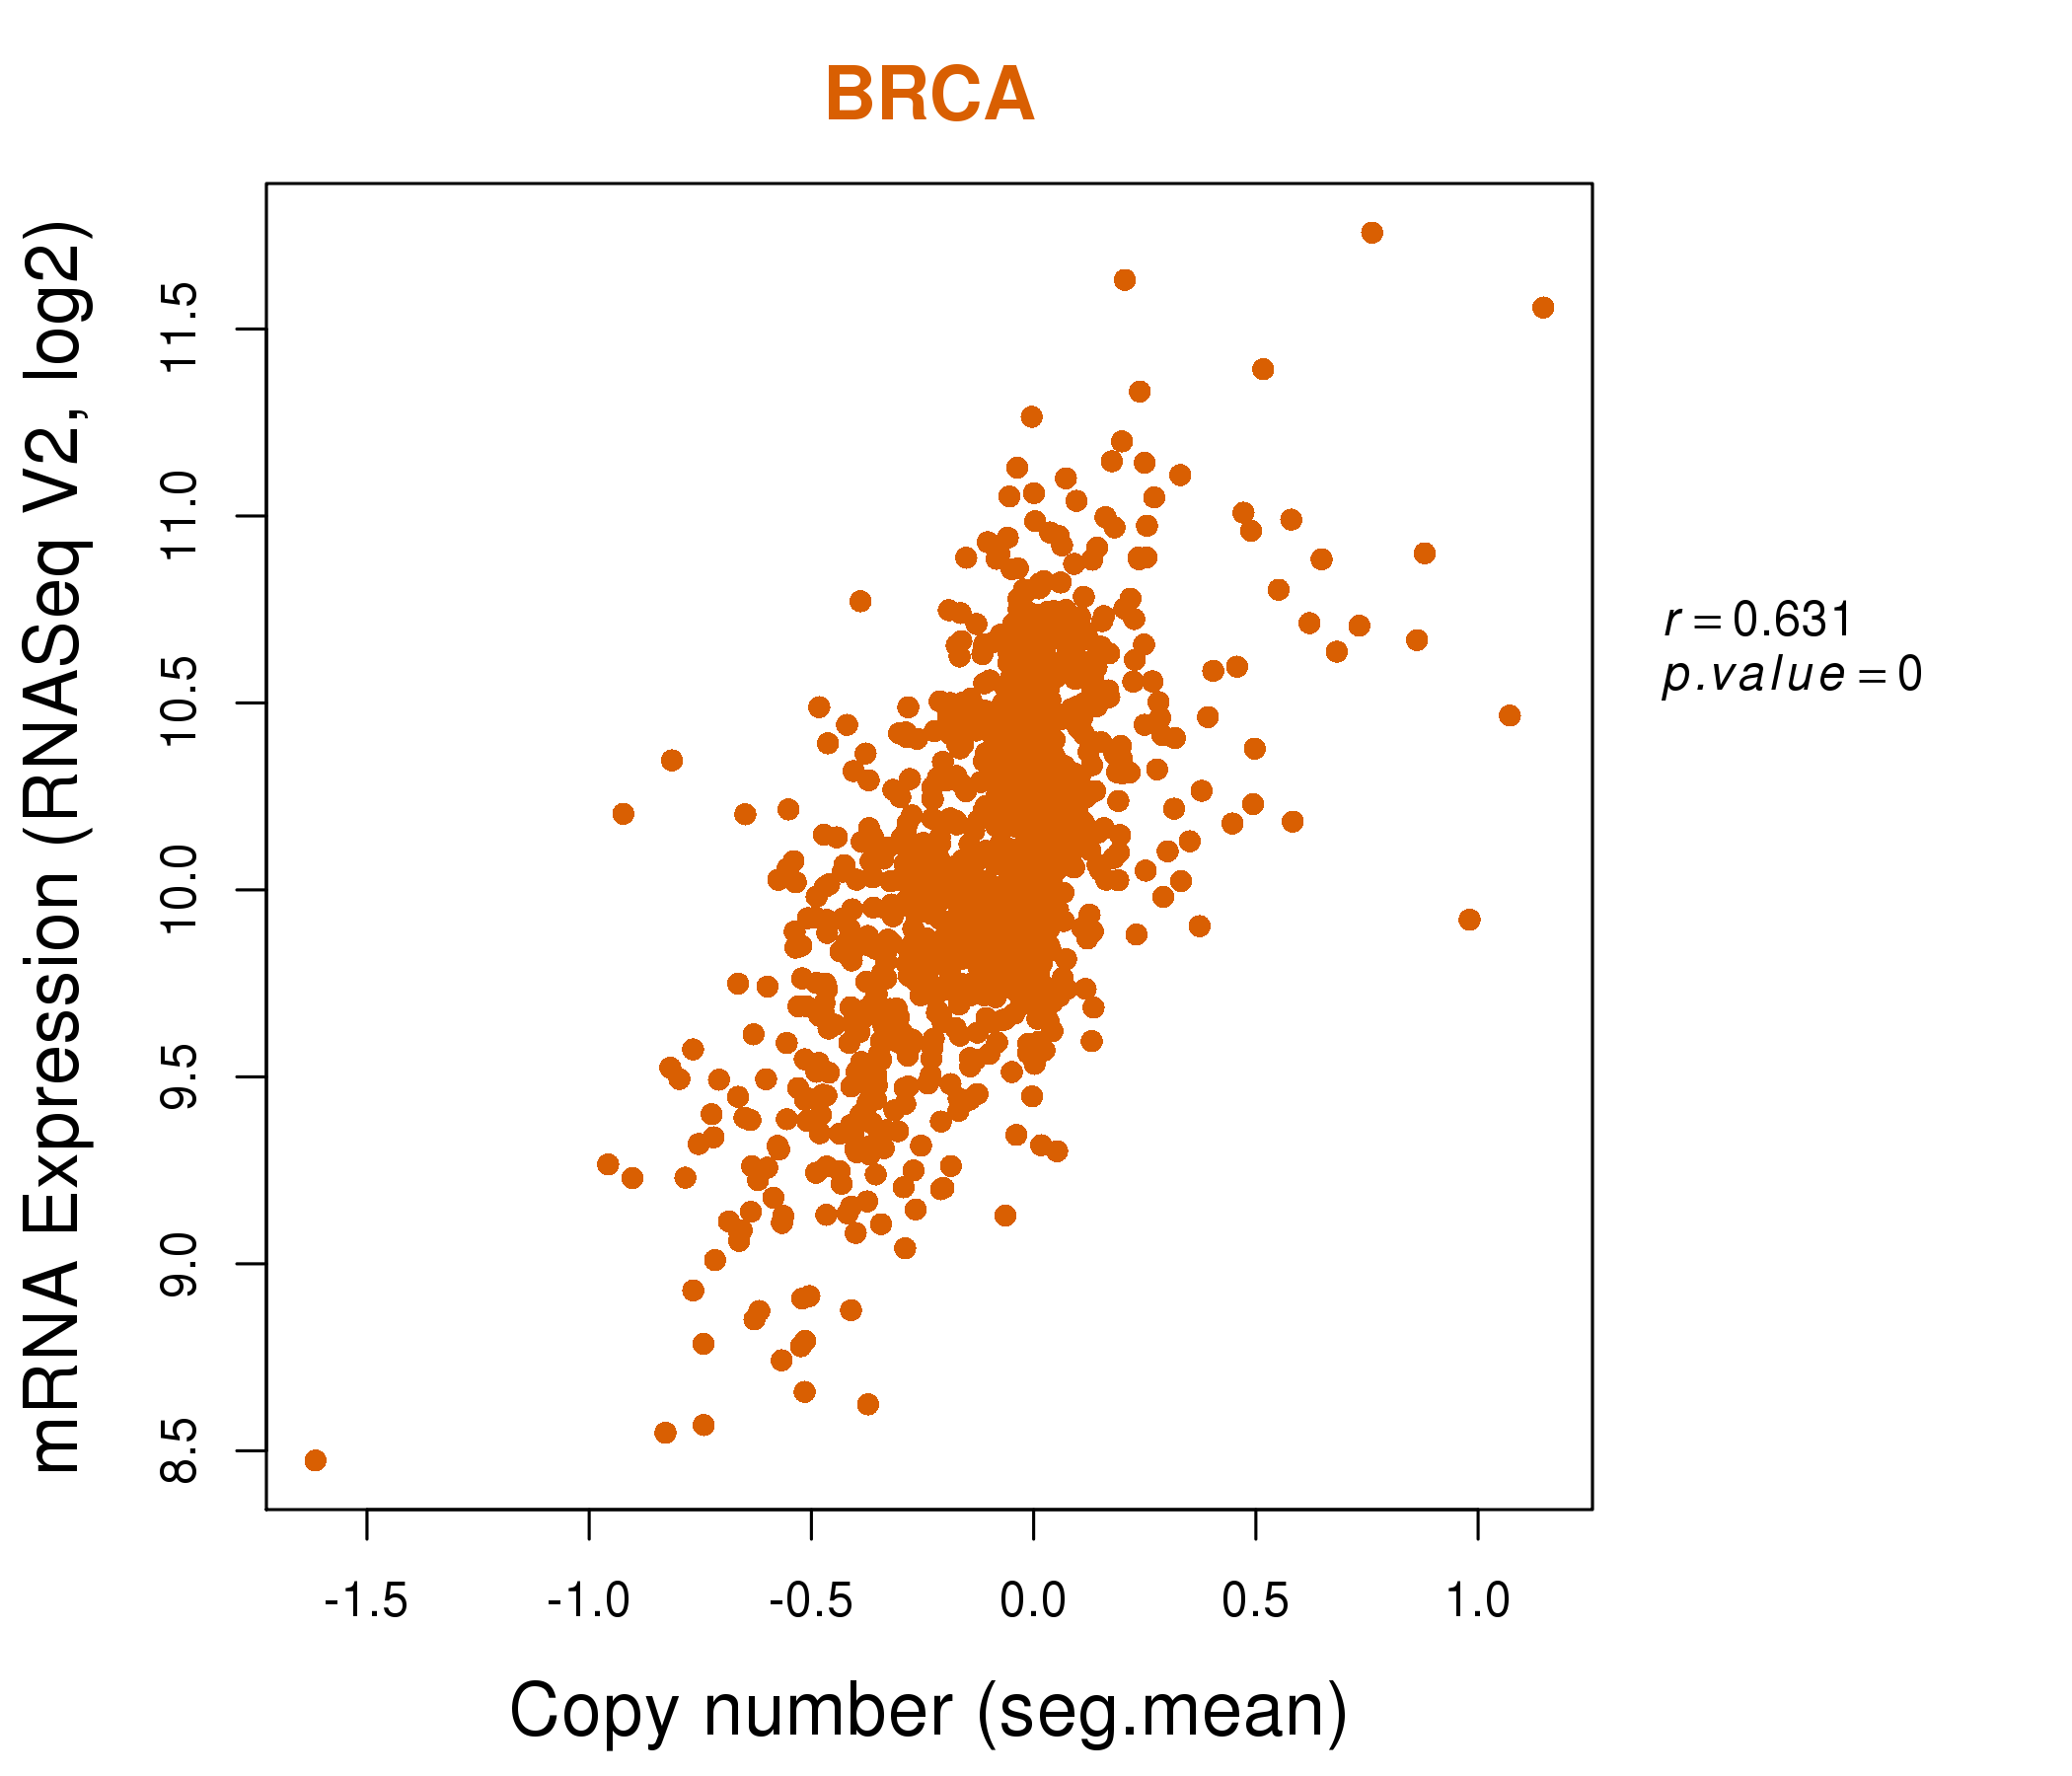
| * This plots show the correlation between CNV and gene expression. |
: Open all plots for all cancer types
 |
|
 |
|

| Top |
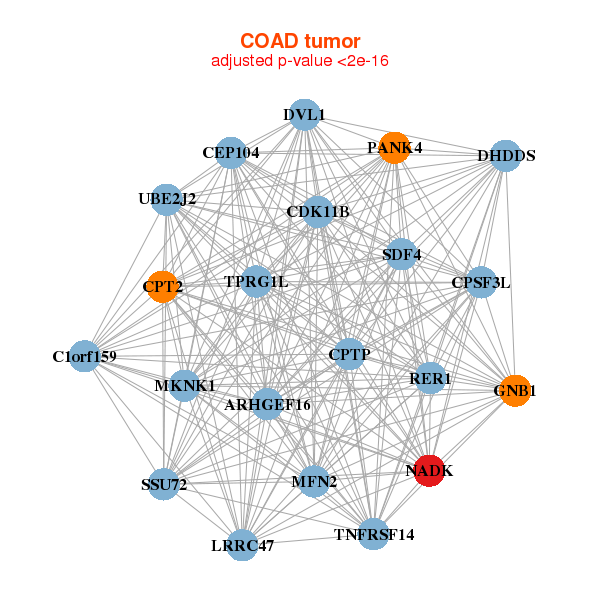
| Gene-Gene Network Information |
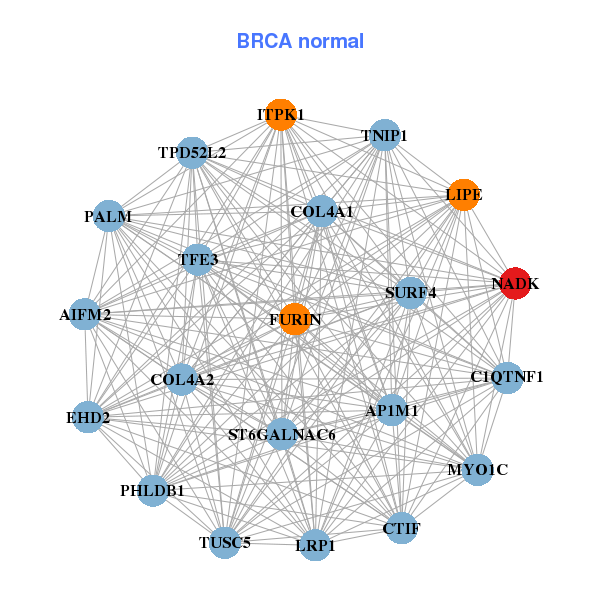
| * Co-Expression network figures were drawn using R package igraph. Only the top 20 genes with the highest correlations were shown. Red circle: input gene, orange circle: cell metabolism gene, sky circle: other gene |
: Open all plots for all cancer types
 |
| ||||
| ACAP3,ATAD3A,CDK11A,CDK11B,CPSF3L,DNAJC11,DVL1, CPTP,GNB1,LOC148413,LOC401010,LRRC47,MIB2,NADK, NOC2L,PANK4,PLEKHM2,SDF4,SSU72,UBE2J2,WRAP73 | AIFM2,AP1M1,C1QTNF1,COL4A1,COL4A2,EHD2,FURIN, ITPK1,CTIF,LIPE,LRP1,MYO1C,NADK,PALM, PHLDB1,ST6GALNAC6,SURF4,TFE3,TNIP1,TPD52L2,TUSC5 | ||||
 |
| ||||
| ARHGEF16,C1orf159,CDK11B,CPSF3L,CPT2,DHDDS,DVL1, CPTP,GNB1,CEP104,LRRC47,MFN2,MKNK1,NADK, PANK4,RER1,SDF4,SSU72,TNFRSF14,TPRG1L,UBE2J2 | ACSS2,ADAP1,AP1M2,APEX2,ARHGEF16,CAPN5,CLDN7, CRB3,DOK4,ELOVL1,LGALS4,LLGL2,NADK,SHD, SIRT7,SLC44A4,STXBP2,TJP3,TMEM8A,TPRN,TRPC4AP |
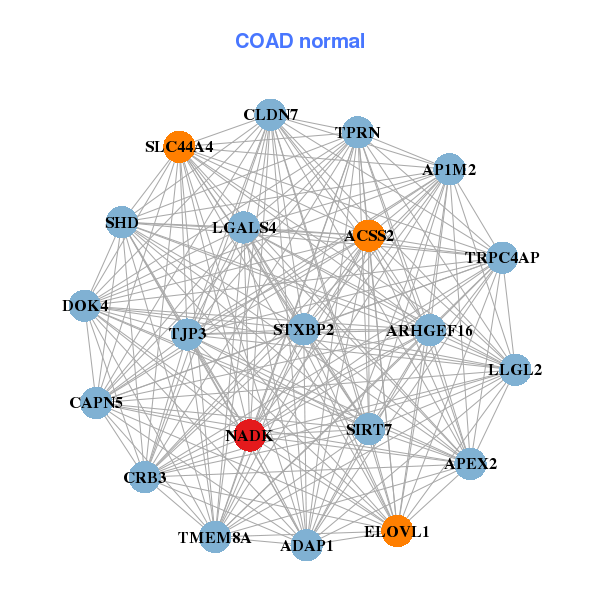
| * Co-Expression network figures were drawn using R package igraph. Only the top 20 genes with the highest correlations were shown. Red circle: input gene, orange circle: cell metabolism gene, sky circle: other gene |
: Open all plots for all cancer types
| Top |
: Open all interacting genes' information including KEGG pathway for all interacting genes from DAVID
| Top |
| Pharmacological Information for NADK |
| DB Category | DB Name | DB's ID and Url link |
| * Gene Centered Interaction Network. |
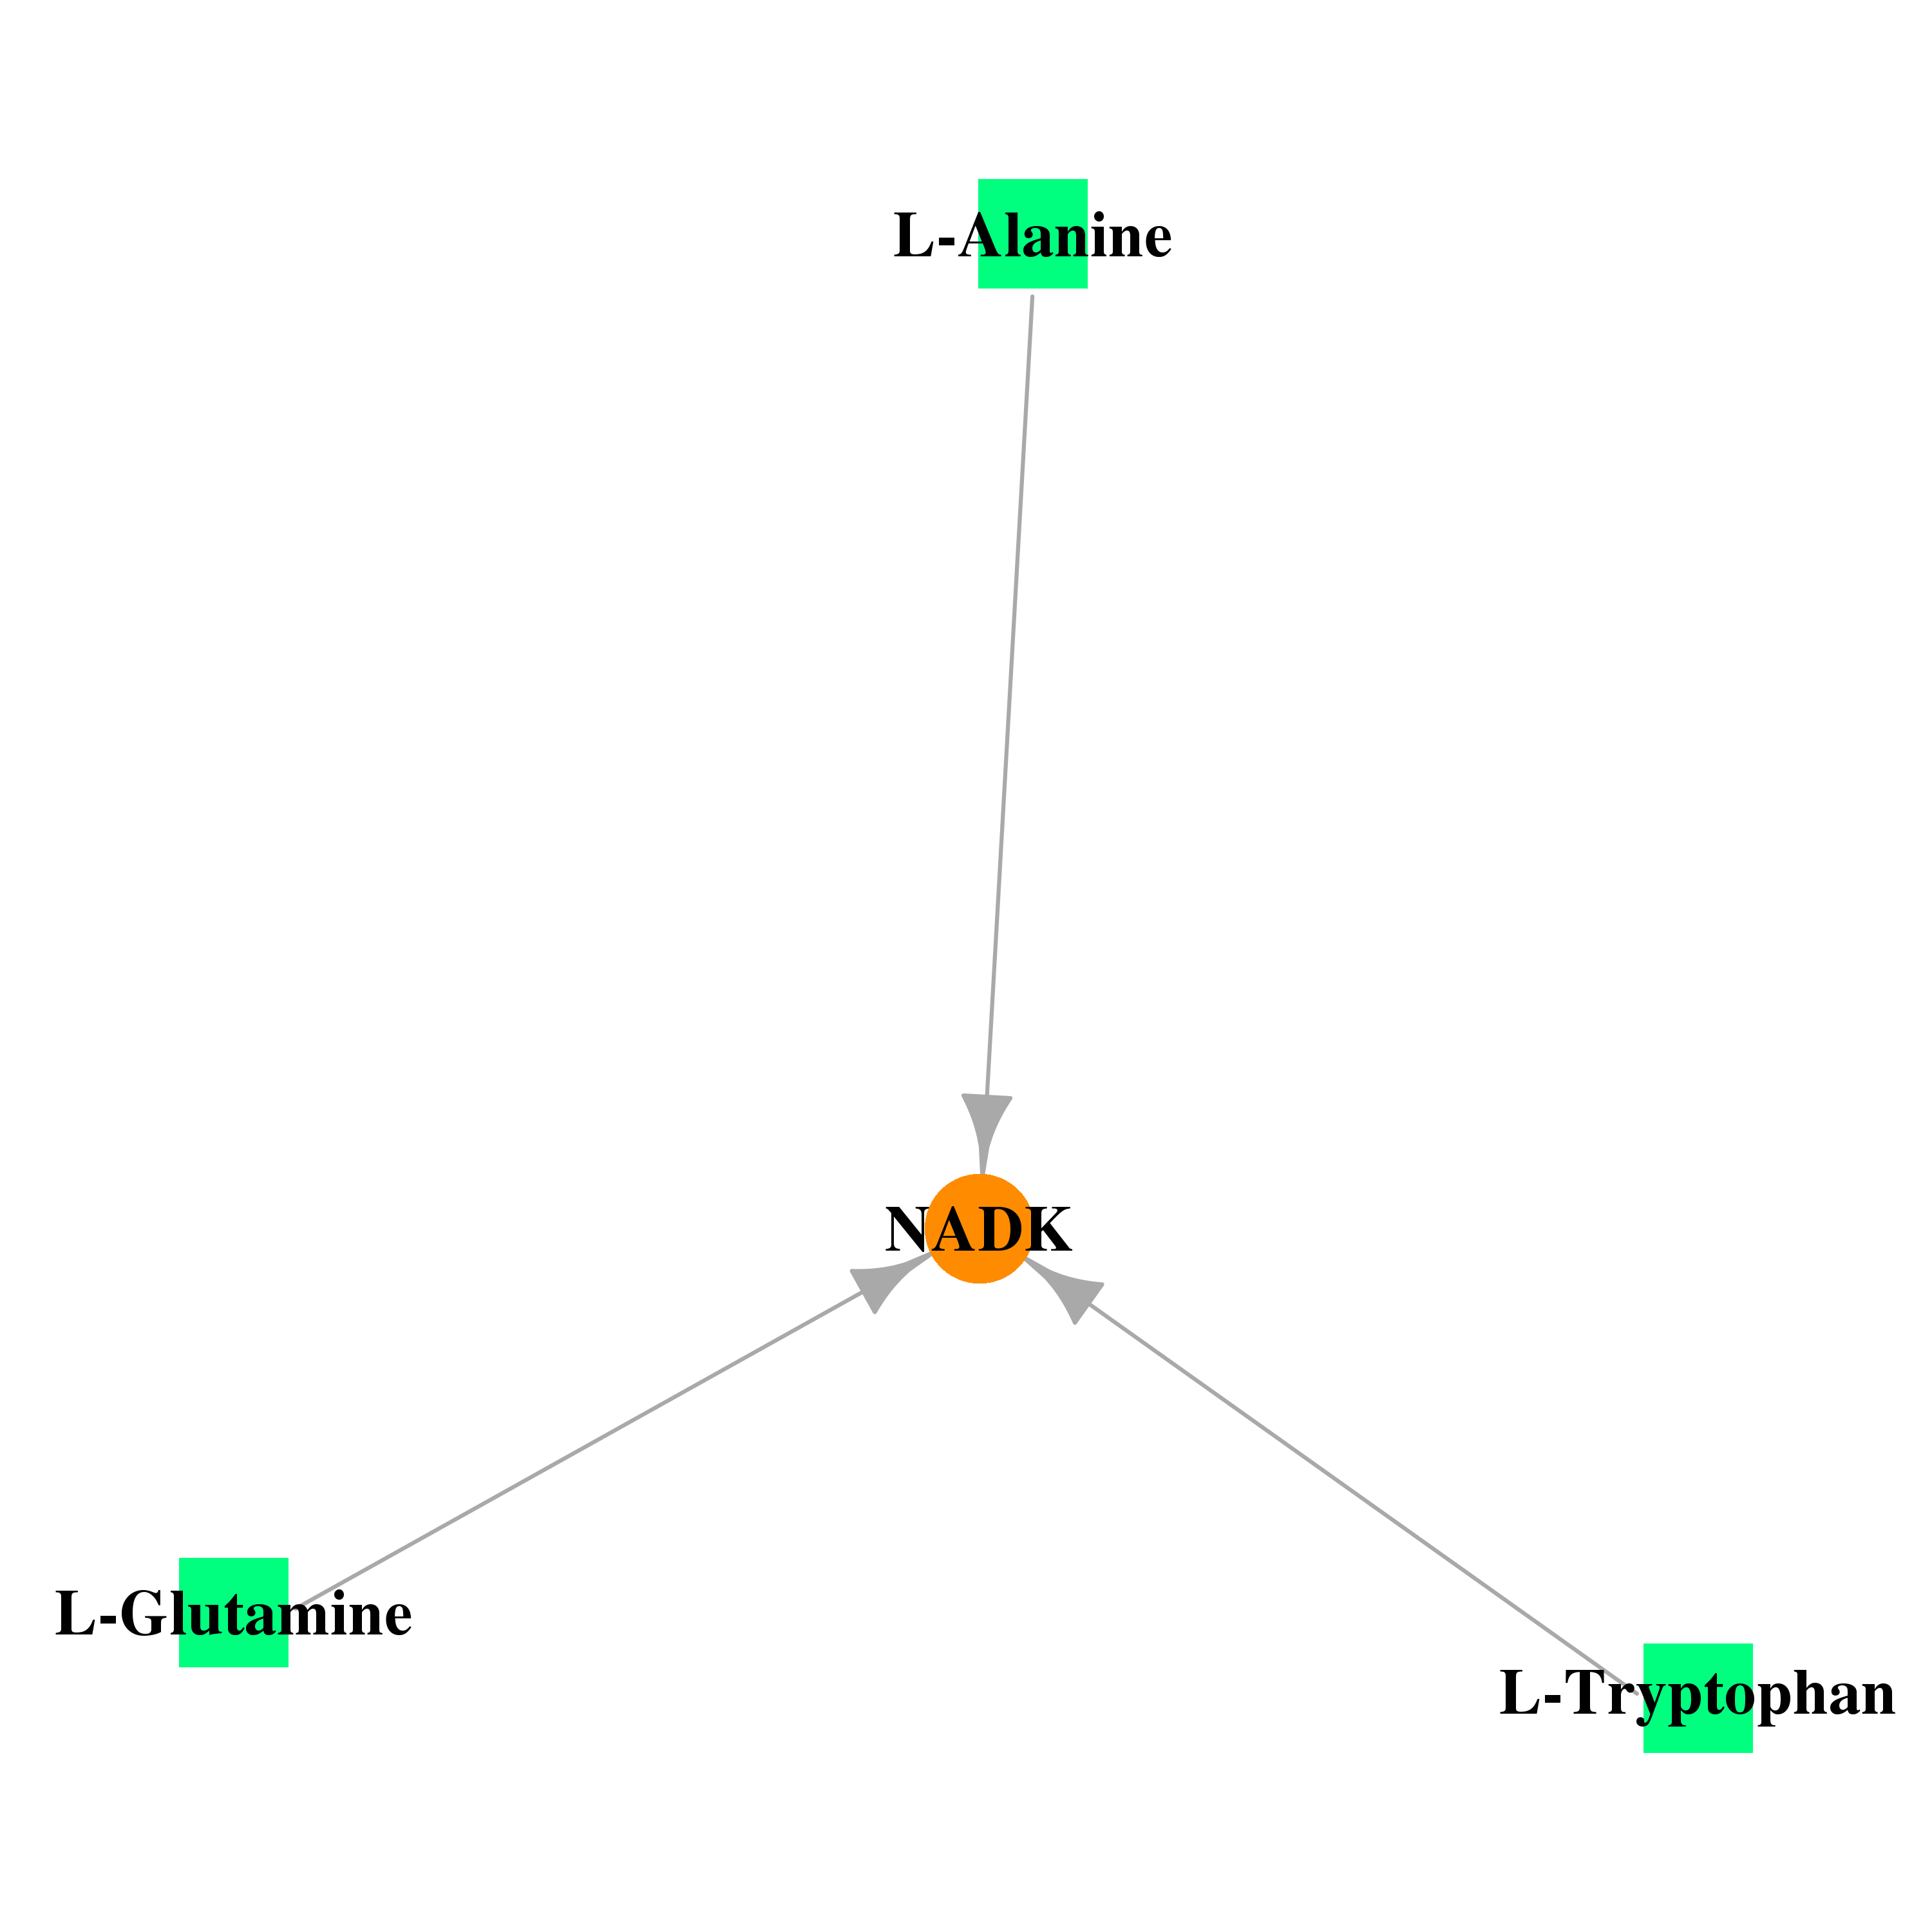 |
| * Drug Centered Interaction Network. |
| DrugBank ID | Target Name | Drug Groups | Generic Name | Drug Centered Network | Drug Structure |
| DB00160 | NAD kinase | approved; nutraceutical | L-Alanine |  | 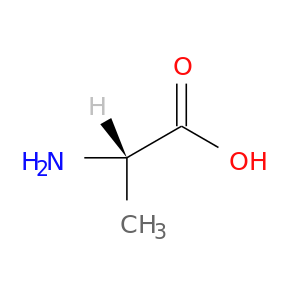 |
| DB00130 | NAD kinase | approved; nutraceutical; investigational | L-Glutamine |  |  |
| DB00150 | NAD kinase | approved; nutraceutical | L-Tryptophan | 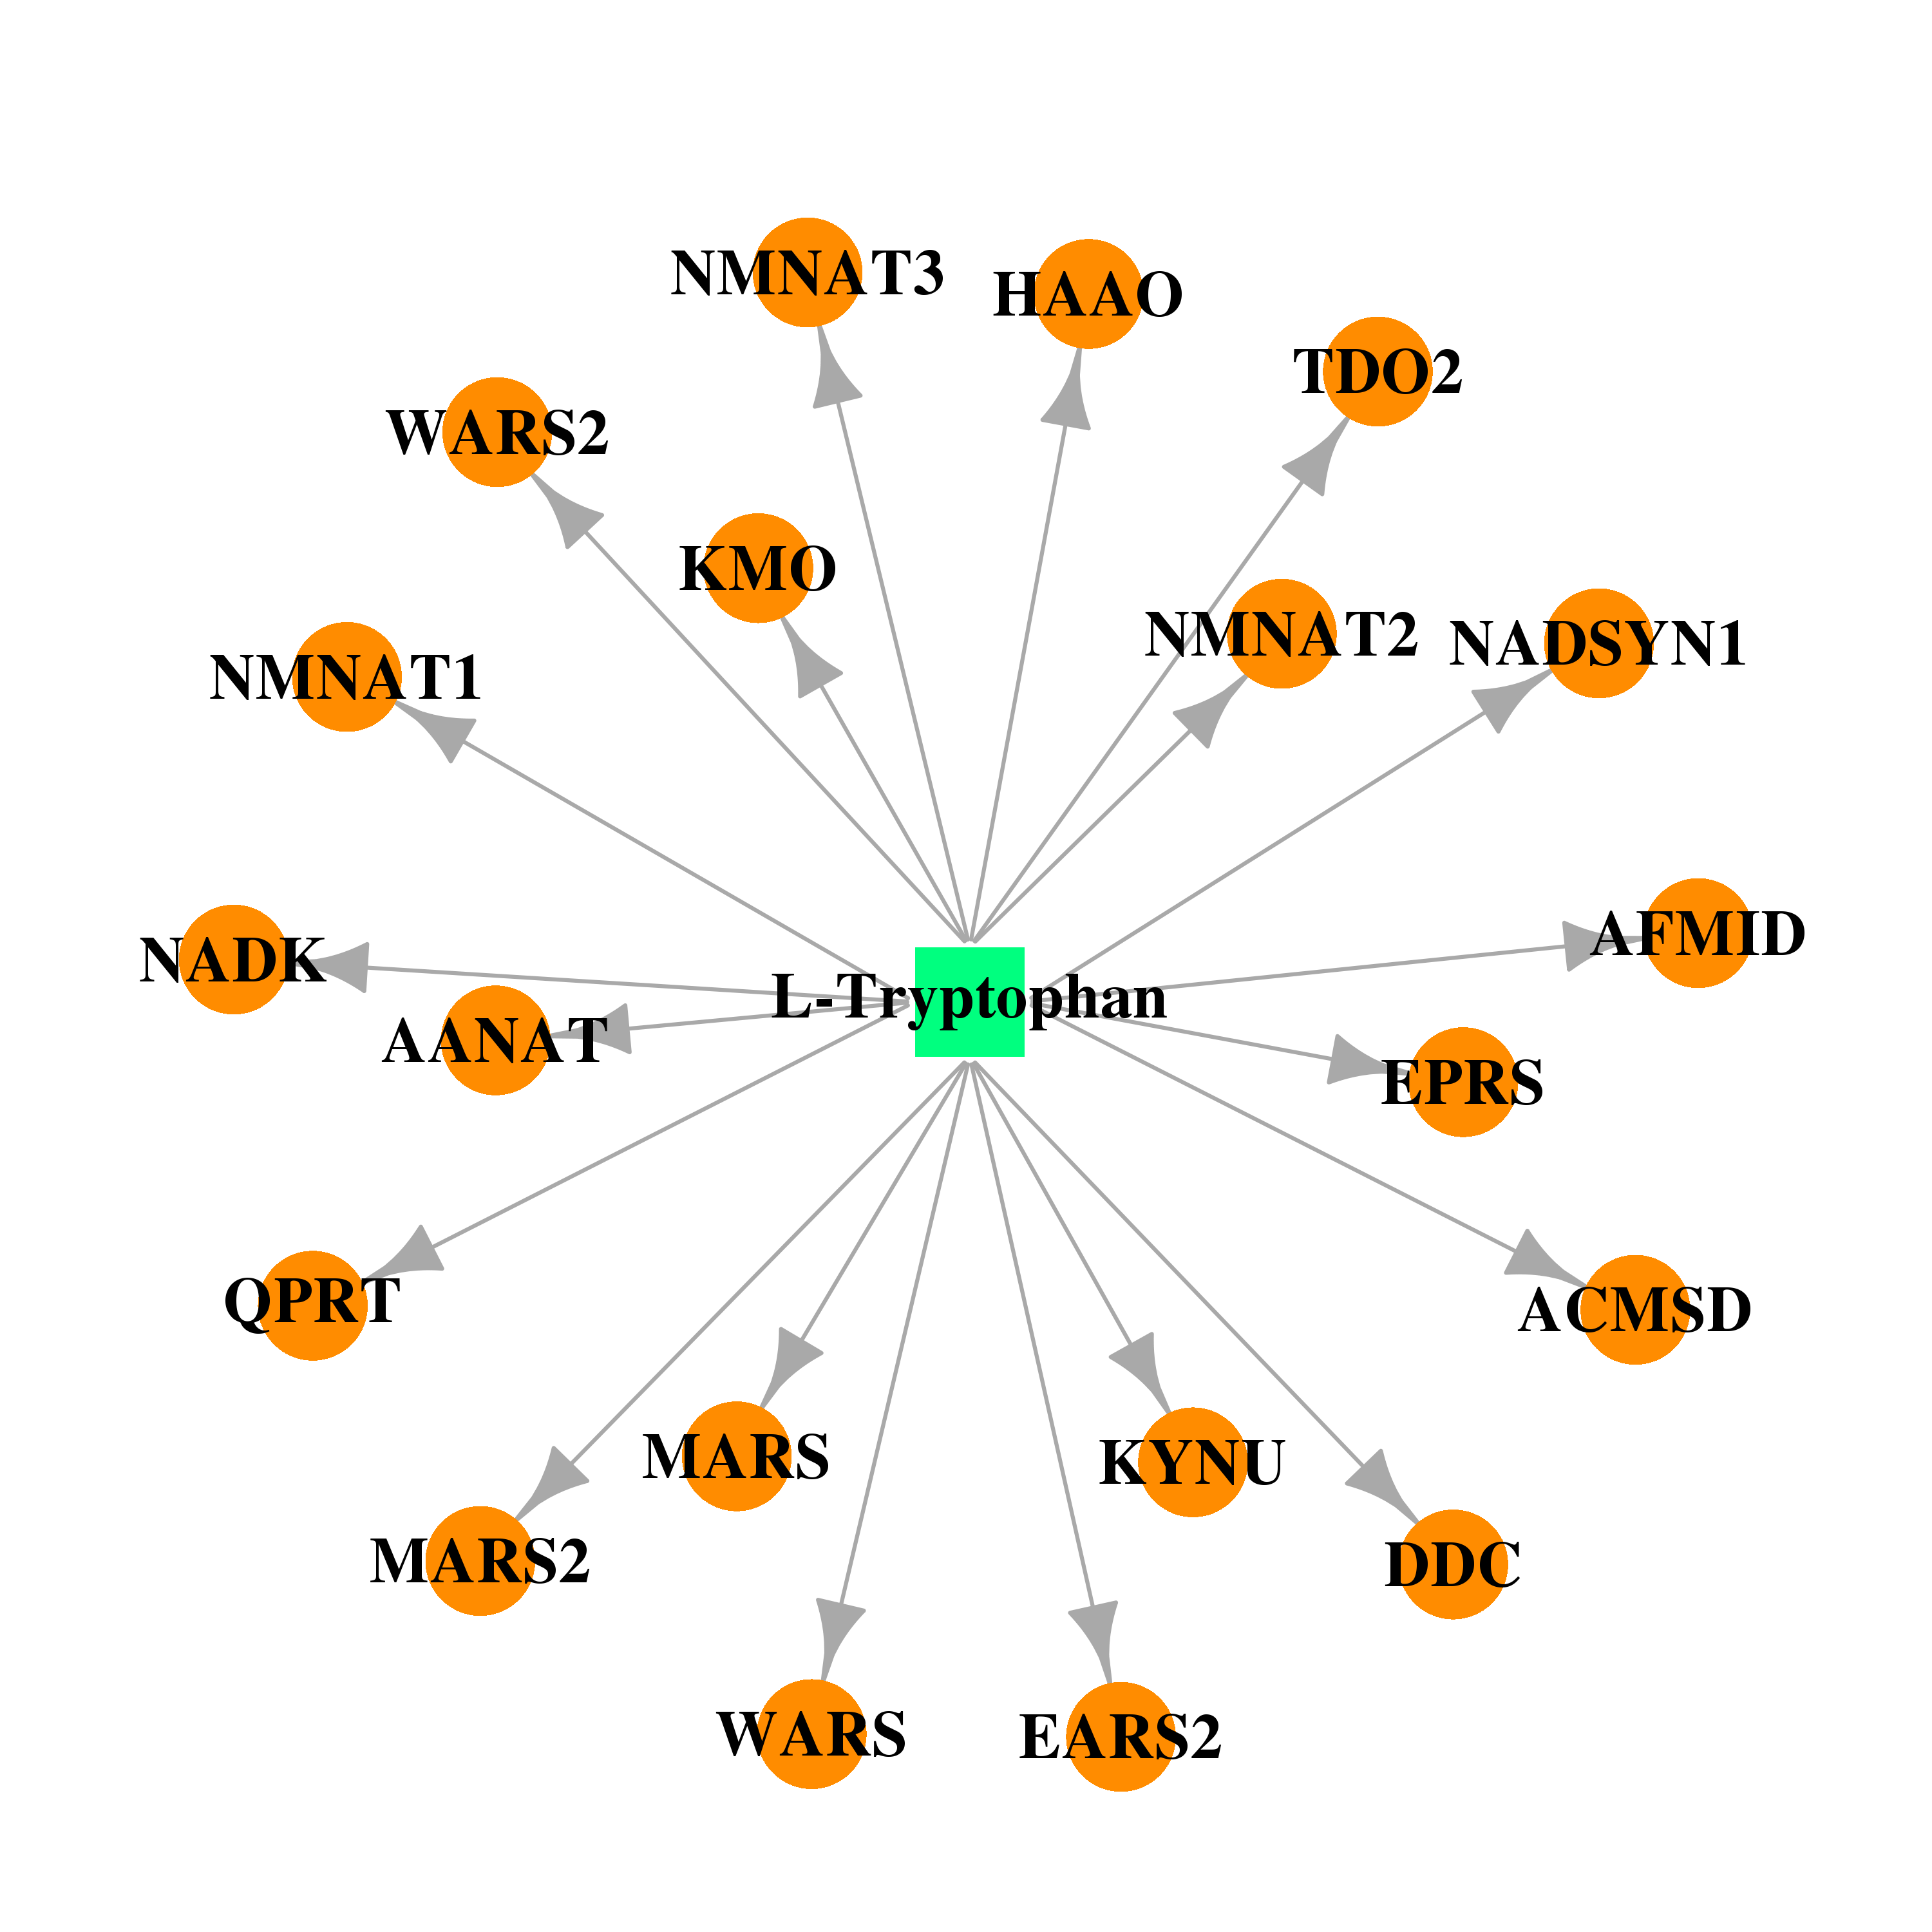 | 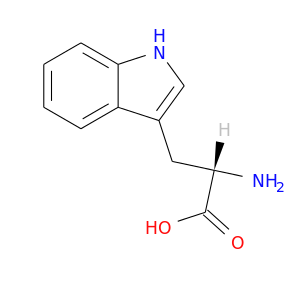 |
| Top |
| Cross referenced IDs for NADK |
| * We obtained these cross-references from Uniprot database. It covers 150 different DBs, 18 categories. http://www.uniprot.org/help/cross_references_section |
: Open all cross reference information
|
Copyright © 2016-Present - The Univsersity of Texas Health Science Center at Houston @ |