|
|||||||||||||||||||||||||||||||||||||||||||||||||||||||||||||||||||||||||||||||||||||||||||||||||||||||||||||||||||||||||||||||||||||||||||||||||||||||||||||||||||||||||||||||||||||||||||||||||||||||||||||||||||||||||||||||||||||||||||||||||||||||||||||||||||||||||||||||||||||||||||||||||||||||||||||||||||||||||||||||||||||||||||||||||||||||||||||||
| |
| Phenotypic Information (metabolism pathway, cancer, disease, phenome) |
| |
| |
| Gene-Gene Network Information: Co-Expression Network, Interacting Genes & KEGG |
| |
|


| Gene Summary for SLC9A1 |
| Basic gene info. | Gene symbol | SLC9A1 |
| Gene name | solute carrier family 9, subfamily A (NHE1, cation proton antiporter 1), member 1 | |
| Synonyms | APNH|NHE-1|NHE1|PPP1R143 | |
| Cytomap | UCSC genome browser: 1p36.1-p35 | |
| Genomic location | chr1 :27425299-27481621 | |
| Type of gene | protein-coding | |
| RefGenes | NM_003047.4, NR_046474.1, | |
| Ensembl id | ENSG00000090020 | |
| Description | Na(+)/H(+) exchanger 1Na-Li countertransporterprotein phosphatase 1, regulatory subunit 143sodium/hydrogen exchanger 1solute carrier family 9 (sodium/hydrogen exchanger), isoform 1 (antiporter, Na+/H+, amiloride sensitive)solute carrier family 9 (sod | |
| Modification date | 20141207 | |
| dbXrefs | MIM : 107310 | |
| HGNC : HGNC | ||
| Ensembl : ENSG00000090020 | ||
| HPRD : 00123 | ||
| Vega : OTTHUMG00000004271 | ||
| Protein | UniProt: P19634 go to UniProt's Cross Reference DB Table | |
| Expression | CleanEX: HS_SLC9A1 | |
| BioGPS: 6548 | ||
| Gene Expression Atlas: ENSG00000090020 | ||
| The Human Protein Atlas: ENSG00000090020 | ||
| Pathway | NCI Pathway Interaction Database: SLC9A1 | |
| KEGG: SLC9A1 | ||
| REACTOME: SLC9A1 | ||
| ConsensusPathDB | ||
| Pathway Commons: SLC9A1 | ||
| Metabolism | MetaCyc: SLC9A1 | |
| HUMANCyc: SLC9A1 | ||
| Regulation | Ensembl's Regulation: ENSG00000090020 | |
| miRBase: chr1 :27,425,299-27,481,621 | ||
| TargetScan: NM_003047 | ||
| cisRED: ENSG00000090020 | ||
| Context | iHOP: SLC9A1 | |
| cancer metabolism search in PubMed: SLC9A1 | ||
| UCL Cancer Institute: SLC9A1 | ||
| Assigned class in ccmGDB | B - This gene belongs to cancer gene. | |
| Top |
| Phenotypic Information for SLC9A1(metabolism pathway, cancer, disease, phenome) |
| Cancer | CGAP: SLC9A1 |
| Familial Cancer Database: SLC9A1 | |
| * This gene is included in those cancer gene databases. |
|
|
|
|
|
| . | |||||||||||||||||||||||||||||||||||||||||||||||||||||||||||||||||||||||||||||||||||||||||||||||||||||||||||||||||||||||||||||||||||||||||||||||||||||||||||||||||||||||||||||||||||||||||||||||||||||||||||||||||||||||||||||||||||||||||||||||||||||||||||||||||||||||||||||||||||||||||||||||||||||||||||||||||||||||||||||||||||||||||||||||||||||||||
Oncogene 1 | Significant driver gene in | ||||||||||||||||||||||||||||||||||||||||||||||||||||||||||||||||||||||||||||||||||||||||||||||||||||||||||||||||||||||||||||||||||||||||||||||||||||||||||||||||||||||||||||||||||||||||||||||||||||||||||||||||||||||||||||||||||||||||||||||||||||||||||||||||||||||||||||||||||||||||||||||||||||||||||||||||||||||||||||||||||||||||||||||||||||||||||||||
| cf) number; DB name 1 Oncogene; http://nar.oxfordjournals.org/content/35/suppl_1/D721.long, 2 Tumor Suppressor gene; https://bioinfo.uth.edu/TSGene/, 3 Cancer Gene Census; http://www.nature.com/nrc/journal/v4/n3/abs/nrc1299.html, 4 CancerGenes; http://nar.oxfordjournals.org/content/35/suppl_1/D721.long, 5 Network of Cancer Gene; http://ncg.kcl.ac.uk/index.php, 1Therapeutic Vulnerabilities in Cancer; http://cbio.mskcc.org/cancergenomics/statius/ |
| REACTOME_HYALURONAN_METABOLISM REACTOME_METABOLISM_OF_CARBOHYDRATES | |
| OMIM | 107310; gene. |
| Orphanet | |
| Disease | KEGG Disease: SLC9A1 |
| MedGen: SLC9A1 (Human Medical Genetics with Condition) | |
| ClinVar: SLC9A1 | |
| Phenotype | MGI: SLC9A1 (International Mouse Phenotyping Consortium) |
| PhenomicDB: SLC9A1 | |
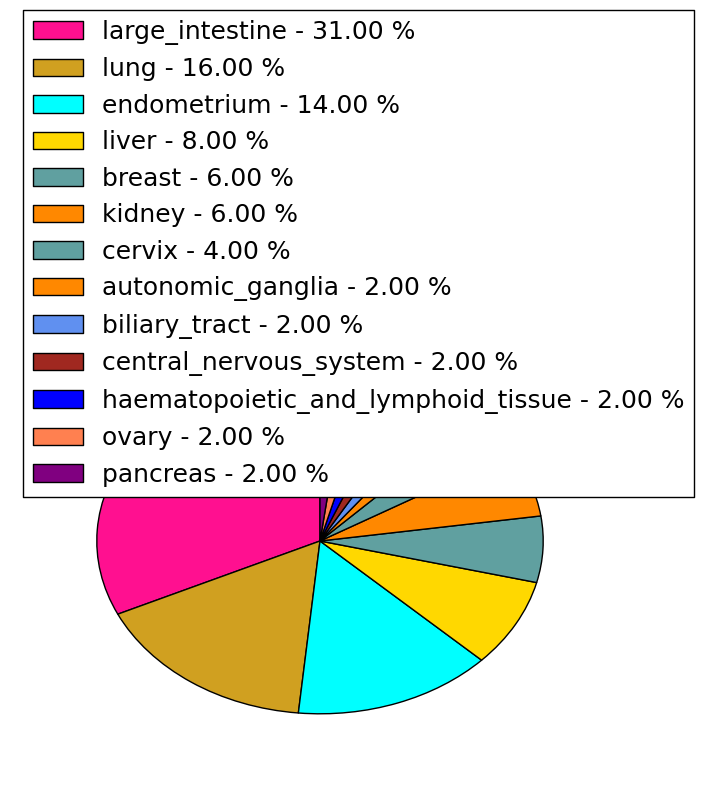
| Mutations for SLC9A1 |
| * Under tables are showing count per each tissue to give us broad intuition about tissue specific mutation patterns.You can go to the detailed page for each mutation database's web site. |
| - Statistics for Tissue and Mutation type | Top |
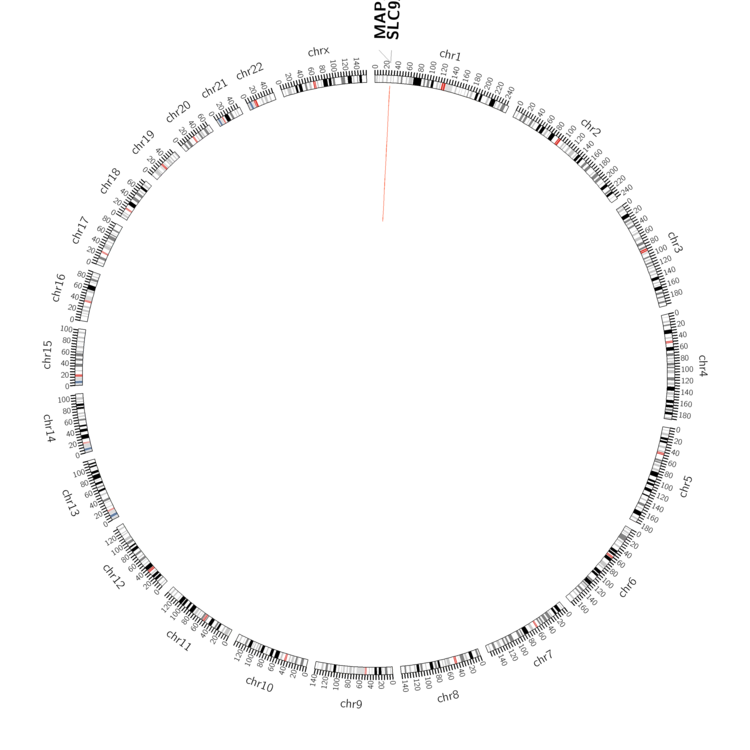 |
| - For Inter-chromosomal Variations |
| There's no inter-chromosomal structural variation. |
| - For Intra-chromosomal Variations |
| * Intra-chromosomal variantions includes 'intrachromosomal amplicon to amplicon', 'intrachromosomal amplicon to non-amplified dna', 'intrachromosomal deletion', 'intrachromosomal fold-back inversion', 'intrachromosomal inversion', 'intrachromosomal tandem duplication', 'Intrachromosomal unknown type', 'intrachromosomal with inverted orientation', 'intrachromosomal with non-inverted orientation'. |
 |
| Sample | Symbol_a | Chr_a | Start_a | End_a | Symbol_b | Chr_b | Start_b | End_b |
| pancreas | SLC9A1 | chr1 | 27462218 | 27462238 | MAP3K6 | chr1 | 27693218 | 27693238 |
| cf) Tissue number; Tissue name (1;Breast, 2;Central_nervous_system, 3;Haematopoietic_and_lymphoid_tissue, 4;Large_intestine, 5;Liver, 6;Lung, 7;Ovary, 8;Pancreas, 9;Prostate, 10;Skin, 11;Soft_tissue, 12;Upper_aerodigestive_tract) |
| * From mRNA Sanger sequences, Chitars2.0 arranged chimeric transcripts. This table shows SLC9A1 related fusion information. |
| ID | Head Gene | Tail Gene | Accession | Gene_a | qStart_a | qEnd_a | Chromosome_a | tStart_a | tEnd_a | Gene_a | qStart_a | qEnd_a | Chromosome_a | tStart_a | tEnd_a |
| AI992338 | SLC9A1 | 12 | 122 | 1 | 27425307 | 27425417 | COL4A1 | 118 | 315 | 13 | 110861195 | 110862531 | |
| BQ369217 | PLOD3 | 13 | 121 | 7 | 100853705 | 100853900 | SLC9A1 | 103 | 359 | 1 | 27434292 | 27436212 | |
| BQ369038 | PLOD3 | 13 | 121 | 7 | 100853705 | 100853900 | SLC9A1 | 103 | 359 | 1 | 27434292 | 27436212 | |
| BF996876 | BCAT1 | 21 | 260 | 12 | 24968749 | 24968990 | SLC9A1 | 255 | 482 | 1 | 27429218 | 27432495 | |
| Top |
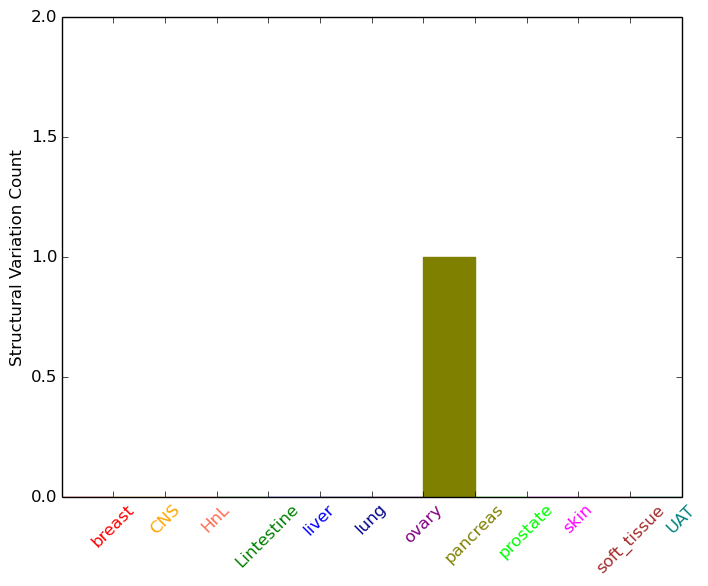
| Mutation type/ Tissue ID | brca | cns | cerv | endome | haematopo | kidn | Lintest | liver | lung | ns | ovary | pancre | prost | skin | stoma | thyro | urina | |||
| Total # sample | 1 | |||||||||||||||||||
| GAIN (# sample) | ||||||||||||||||||||
| LOSS (# sample) | 1 |
| cf) Tissue ID; Tissue type (1; Breast, 2; Central_nervous_system, 3; Cervix, 4; Endometrium, 5; Haematopoietic_and_lymphoid_tissue, 6; Kidney, 7; Large_intestine, 8; Liver, 9; Lung, 10; NS, 11; Ovary, 12; Pancreas, 13; Prostate, 14; Skin, 15; Stomach, 16; Thyroid, 17; Urinary_tract) |
| Top |
|
 |
| Top |
| Stat. for Non-Synonymous SNVs (# total SNVs=48) | (# total SNVs=25) |
 | 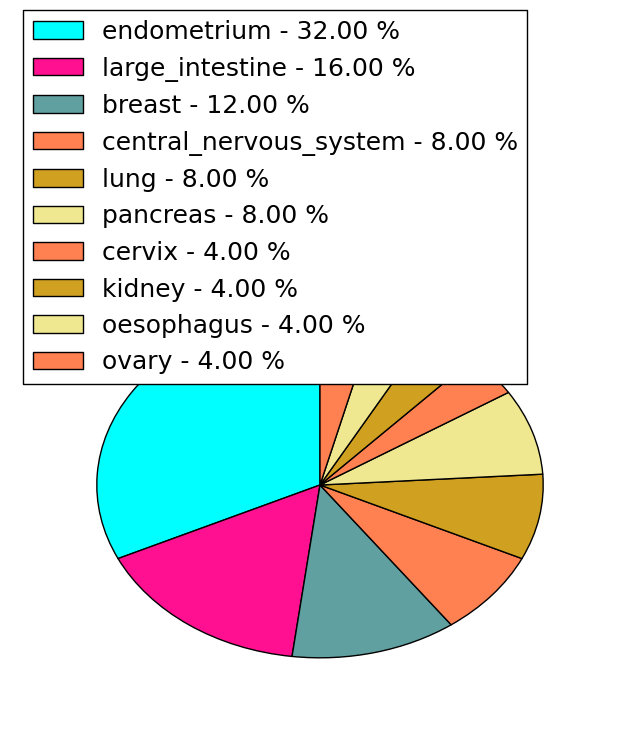 |
(# total SNVs=3) | (# total SNVs=1) |
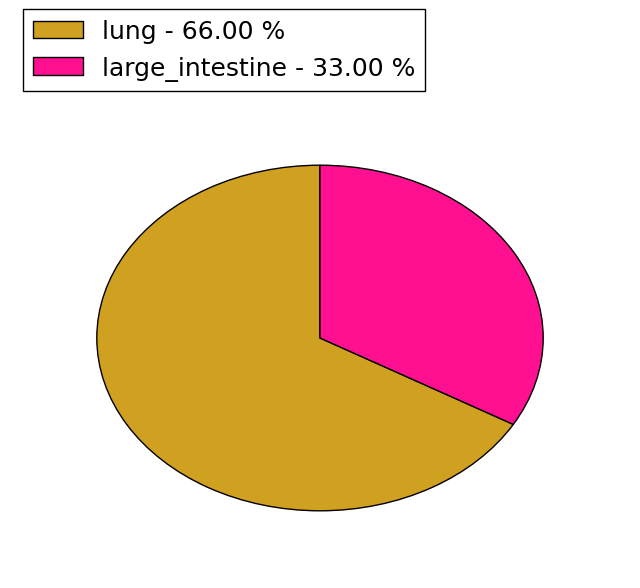 | 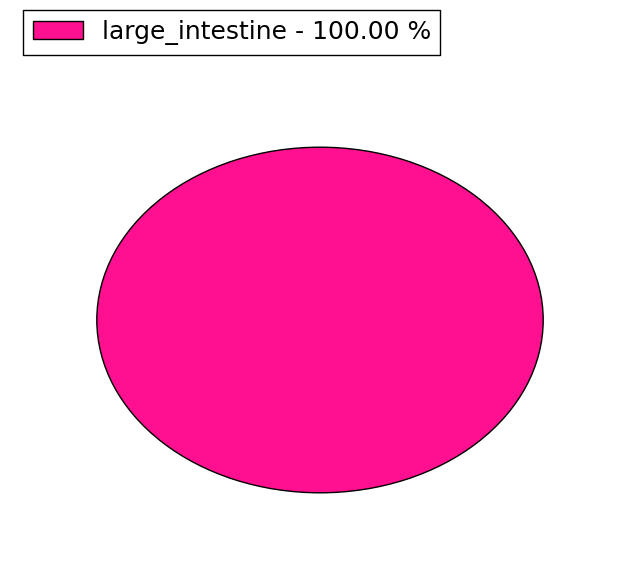 |
| Top |
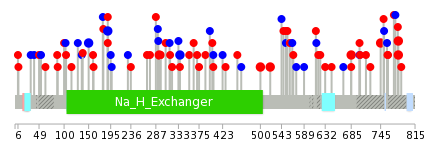
| * When you move the cursor on each content, you can see more deailed mutation information on the Tooltip. Those are primary_site,primary_histology,mutation(aa),pubmedID. |
| GRCh37 position | Mutation(aa) | Unique sampleID count |
| chr1:27427750-27427750 | p.T685M | 3 |
| chr1:27440563-27440563 | p.I189M | 3 |
| chr1:27429791-27429791 | p.R500W | 2 |
| chr1:27440753-27440753 | p.S126* | 2 |
| chr1:27428206-27428206 | p.? | 2 |
| chr1:27436202-27436202 | p.G294S | 2 |
| chr1:27426904-27426904 | p.A781V | 2 |
| chr1:27427012-27427012 | p.S745I | 2 |
| chr1:27436074-27436074 | p.L336L | 2 |
| chr1:27426905-27426905 | p.A781T | 2 |
| Top |
|
 |
| Point Mutation/ Tissue ID | 1 | 2 | 3 | 4 | 5 | 6 | 7 | 8 | 9 | 10 | 11 | 12 | 13 | 14 | 15 | 16 | 17 | 18 | 19 | 20 |
| # sample | 1 | 3 | 2 | 8 | 1 | 1 | 1 | 3 | 3 | 2 | 1 | 9 | 10 | 15 | ||||||
| # mutation | 1 | 3 | 2 | 8 | 1 | 1 | 1 | 3 | 3 | 2 | 1 | 9 | 10 | 15 | ||||||
| nonsynonymous SNV | 1 | 1 | 1 | 6 | 1 | 1 | 1 | 3 | 1 | 4 | 7 | 7 | ||||||||
| synonymous SNV | 2 | 1 | 2 | 1 | 2 | 2 | 5 | 3 | 8 |
| cf) Tissue ID; Tissue type (1; BLCA[Bladder Urothelial Carcinoma], 2; BRCA[Breast invasive carcinoma], 3; CESC[Cervical squamous cell carcinoma and endocervical adenocarcinoma], 4; COAD[Colon adenocarcinoma], 5; GBM[Glioblastoma multiforme], 6; Glioma Low Grade, 7; HNSC[Head and Neck squamous cell carcinoma], 8; KICH[Kidney Chromophobe], 9; KIRC[Kidney renal clear cell carcinoma], 10; KIRP[Kidney renal papillary cell carcinoma], 11; LAML[Acute Myeloid Leukemia], 12; LUAD[Lung adenocarcinoma], 13; LUSC[Lung squamous cell carcinoma], 14; OV[Ovarian serous cystadenocarcinoma ], 15; PAAD[Pancreatic adenocarcinoma], 16; PRAD[Prostate adenocarcinoma], 17; SKCM[Skin Cutaneous Melanoma], 18:STAD[Stomach adenocarcinoma], 19:THCA[Thyroid carcinoma], 20:UCEC[Uterine Corpus Endometrial Carcinoma]) |
| Top |
| * We represented just top 10 SNVs. When you move the cursor on each content, you can see more deailed mutation information on the Tooltip. Those are primary_site, primary_histology, mutation(aa), pubmedID. |
| Genomic Position | Mutation(aa) | Unique sampleID count |
| chr1:27440680 | p.T685K | 2 |
| chr1:27436202 | p.G150G | 2 |
| chr1:27427750 | p.L336L | 2 |
| chr1:27436074 | p.G294S | 2 |
| chr1:27428977 | p.T62I | 1 |
| chr1:27432547 | p.G702G | 1 |
| chr1:27427075 | p.H543H | 1 |
| chr1:27428997 | p.F292L | 1 |
| chr1:27440722 | p.S49A | 1 |
| chr1:27434230 | p.G702S | 1 |
| * Copy number data were extracted from TCGA using R package TCGA-Assembler. The URLs of all public data files on TCGA DCC data server were gathered on Jan-05-2015. Function ProcessCNAData in TCGA-Assembler package was used to obtain gene-level copy number value which is calculated as the average copy number of the genomic region of a gene. |
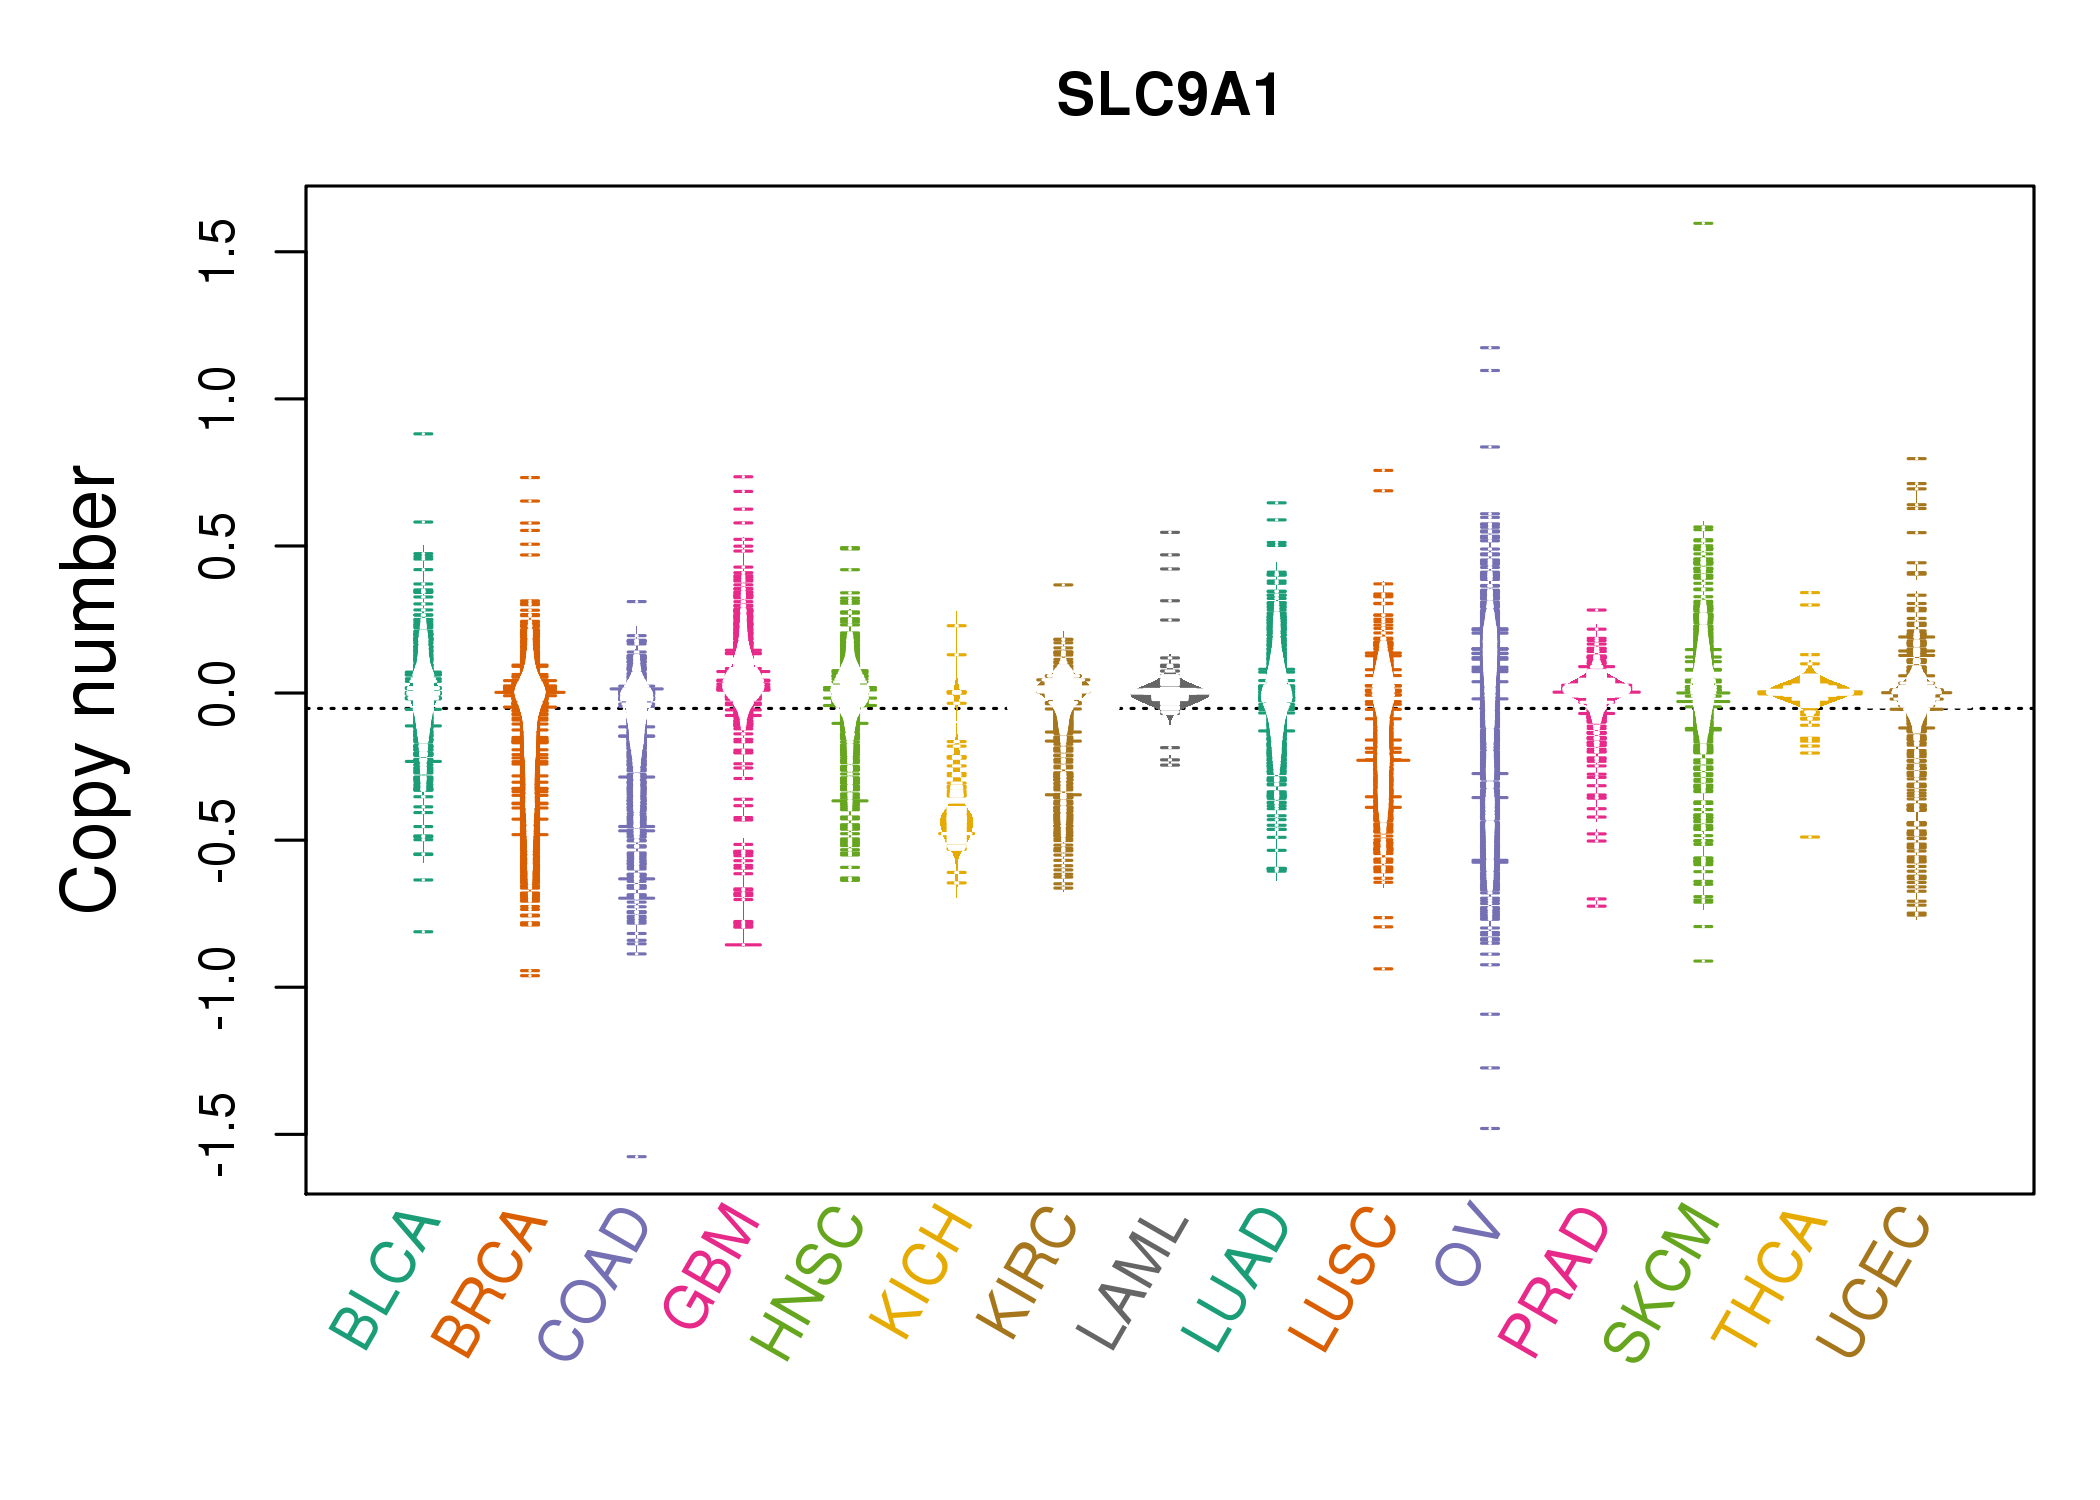 |
| cf) Tissue ID[Tissue type]: BLCA[Bladder Urothelial Carcinoma], BRCA[Breast invasive carcinoma], CESC[Cervical squamous cell carcinoma and endocervical adenocarcinoma], COAD[Colon adenocarcinoma], GBM[Glioblastoma multiforme], Glioma Low Grade, HNSC[Head and Neck squamous cell carcinoma], KICH[Kidney Chromophobe], KIRC[Kidney renal clear cell carcinoma], KIRP[Kidney renal papillary cell carcinoma], LAML[Acute Myeloid Leukemia], LUAD[Lung adenocarcinoma], LUSC[Lung squamous cell carcinoma], OV[Ovarian serous cystadenocarcinoma ], PAAD[Pancreatic adenocarcinoma], PRAD[Prostate adenocarcinoma], SKCM[Skin Cutaneous Melanoma], STAD[Stomach adenocarcinoma], THCA[Thyroid carcinoma], UCEC[Uterine Corpus Endometrial Carcinoma] |
| Top |
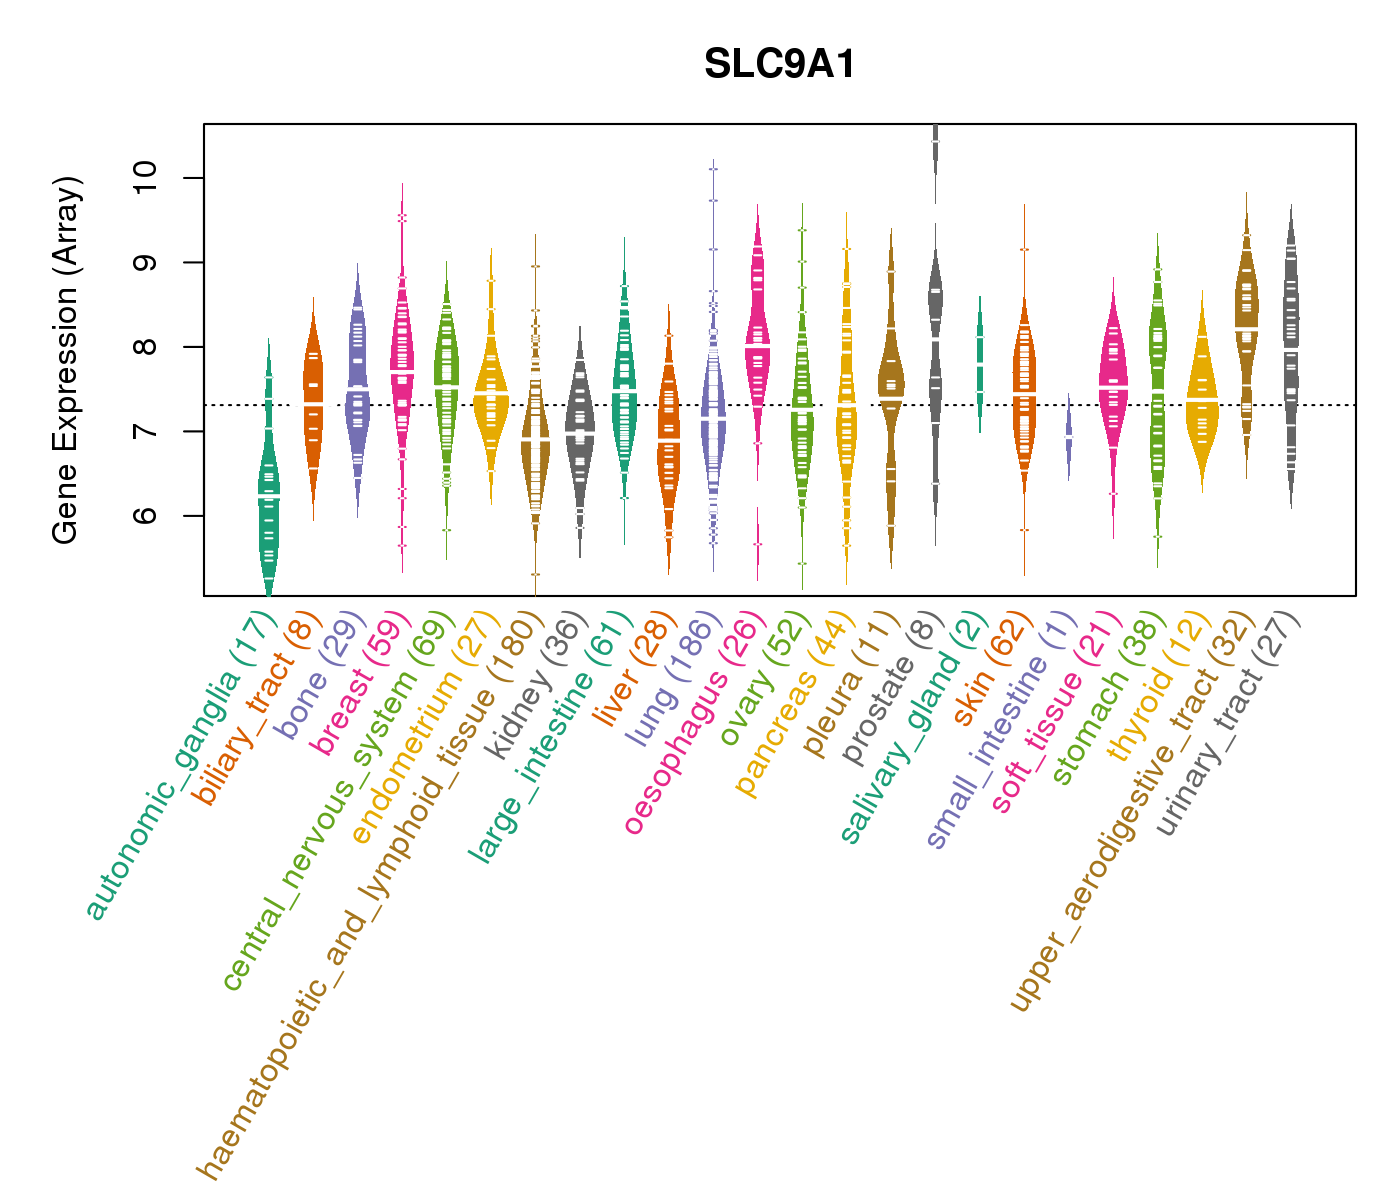
| Gene Expression for SLC9A1 |
| * CCLE gene expression data were extracted from CCLE_Expression_Entrez_2012-10-18.res: Gene-centric RMA-normalized mRNA expression data. |
 |
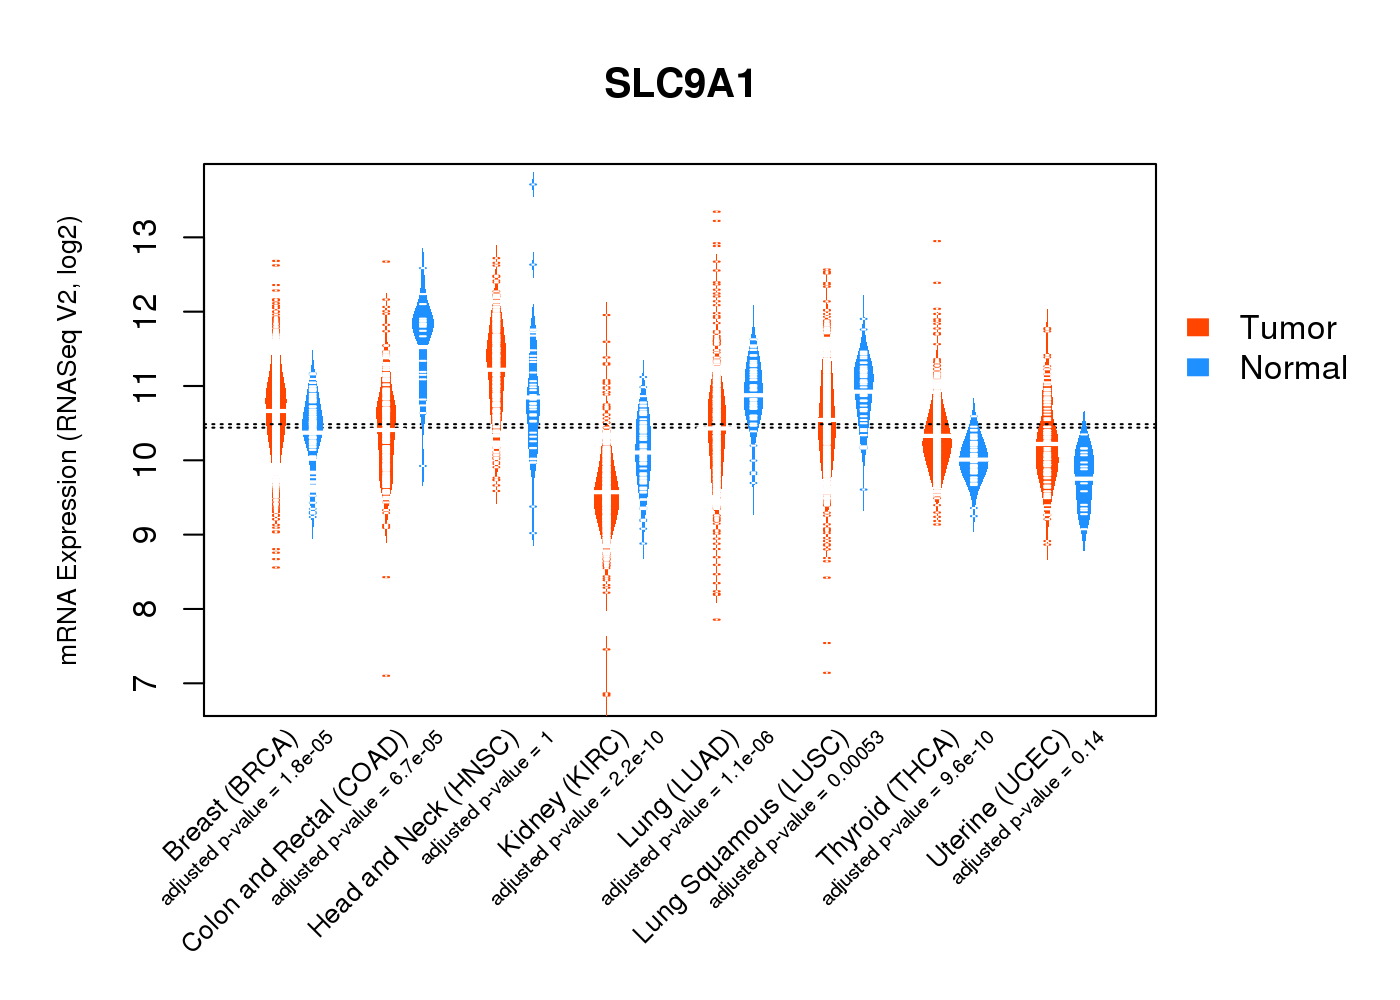
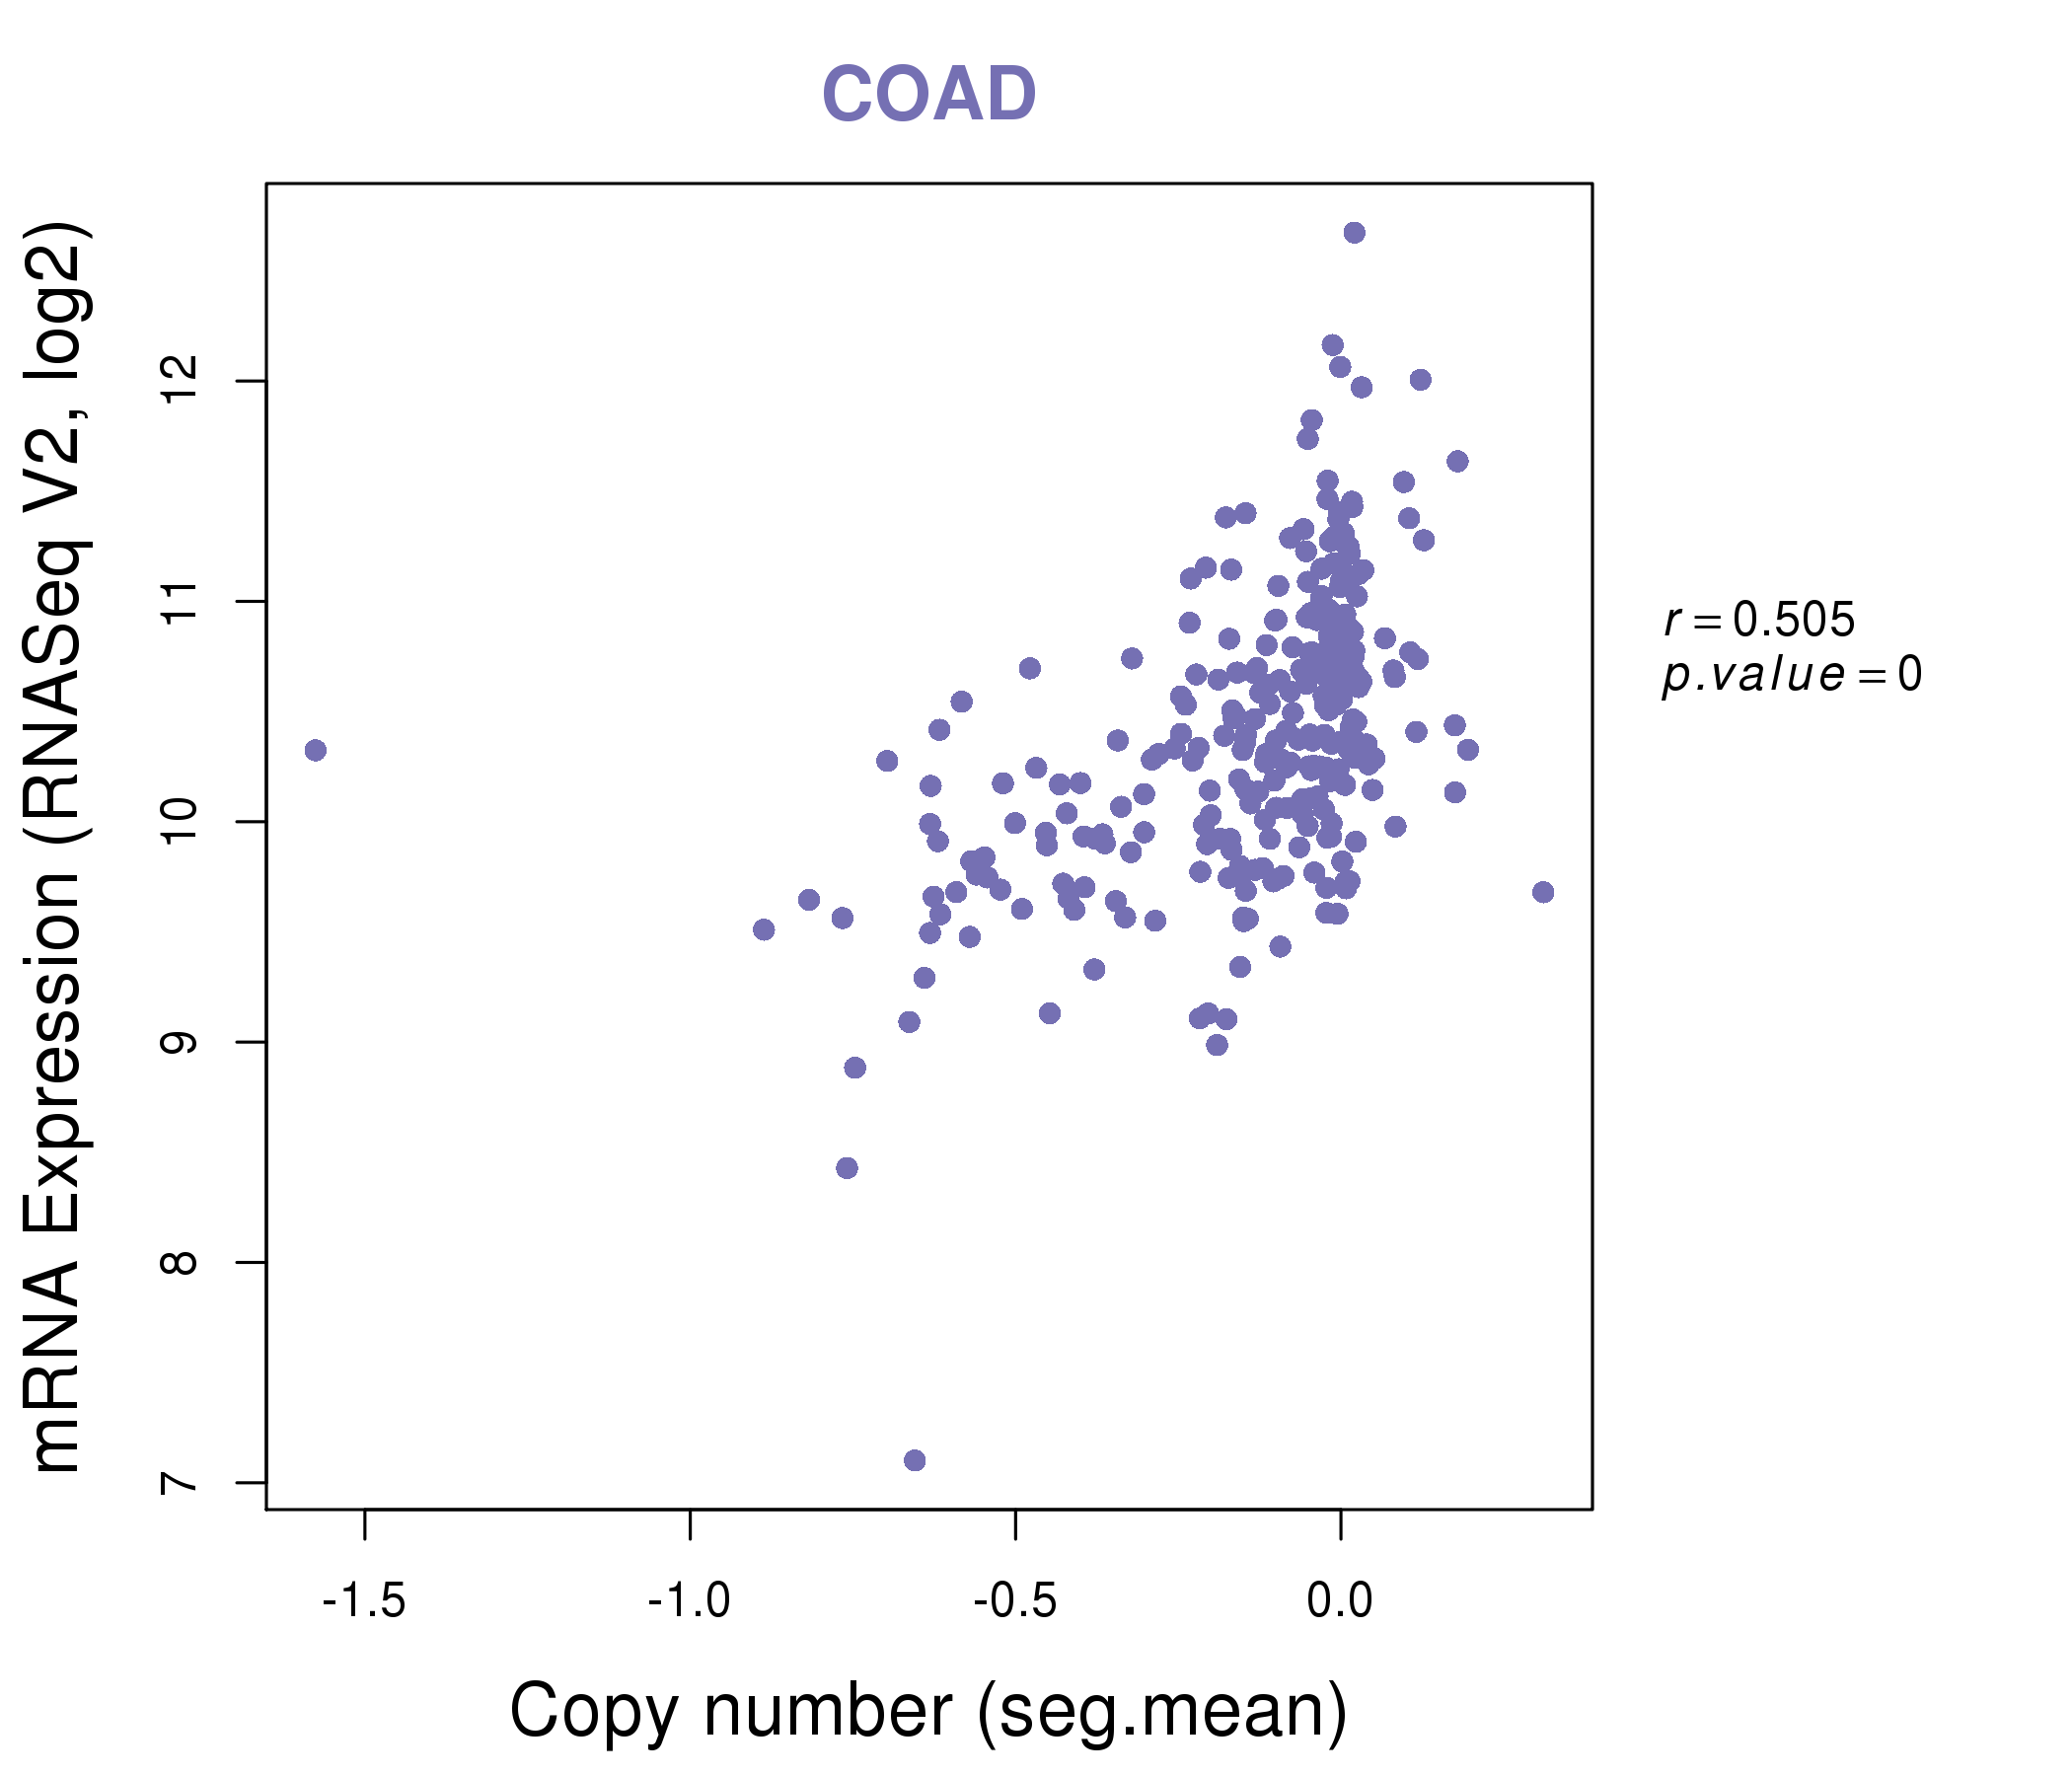
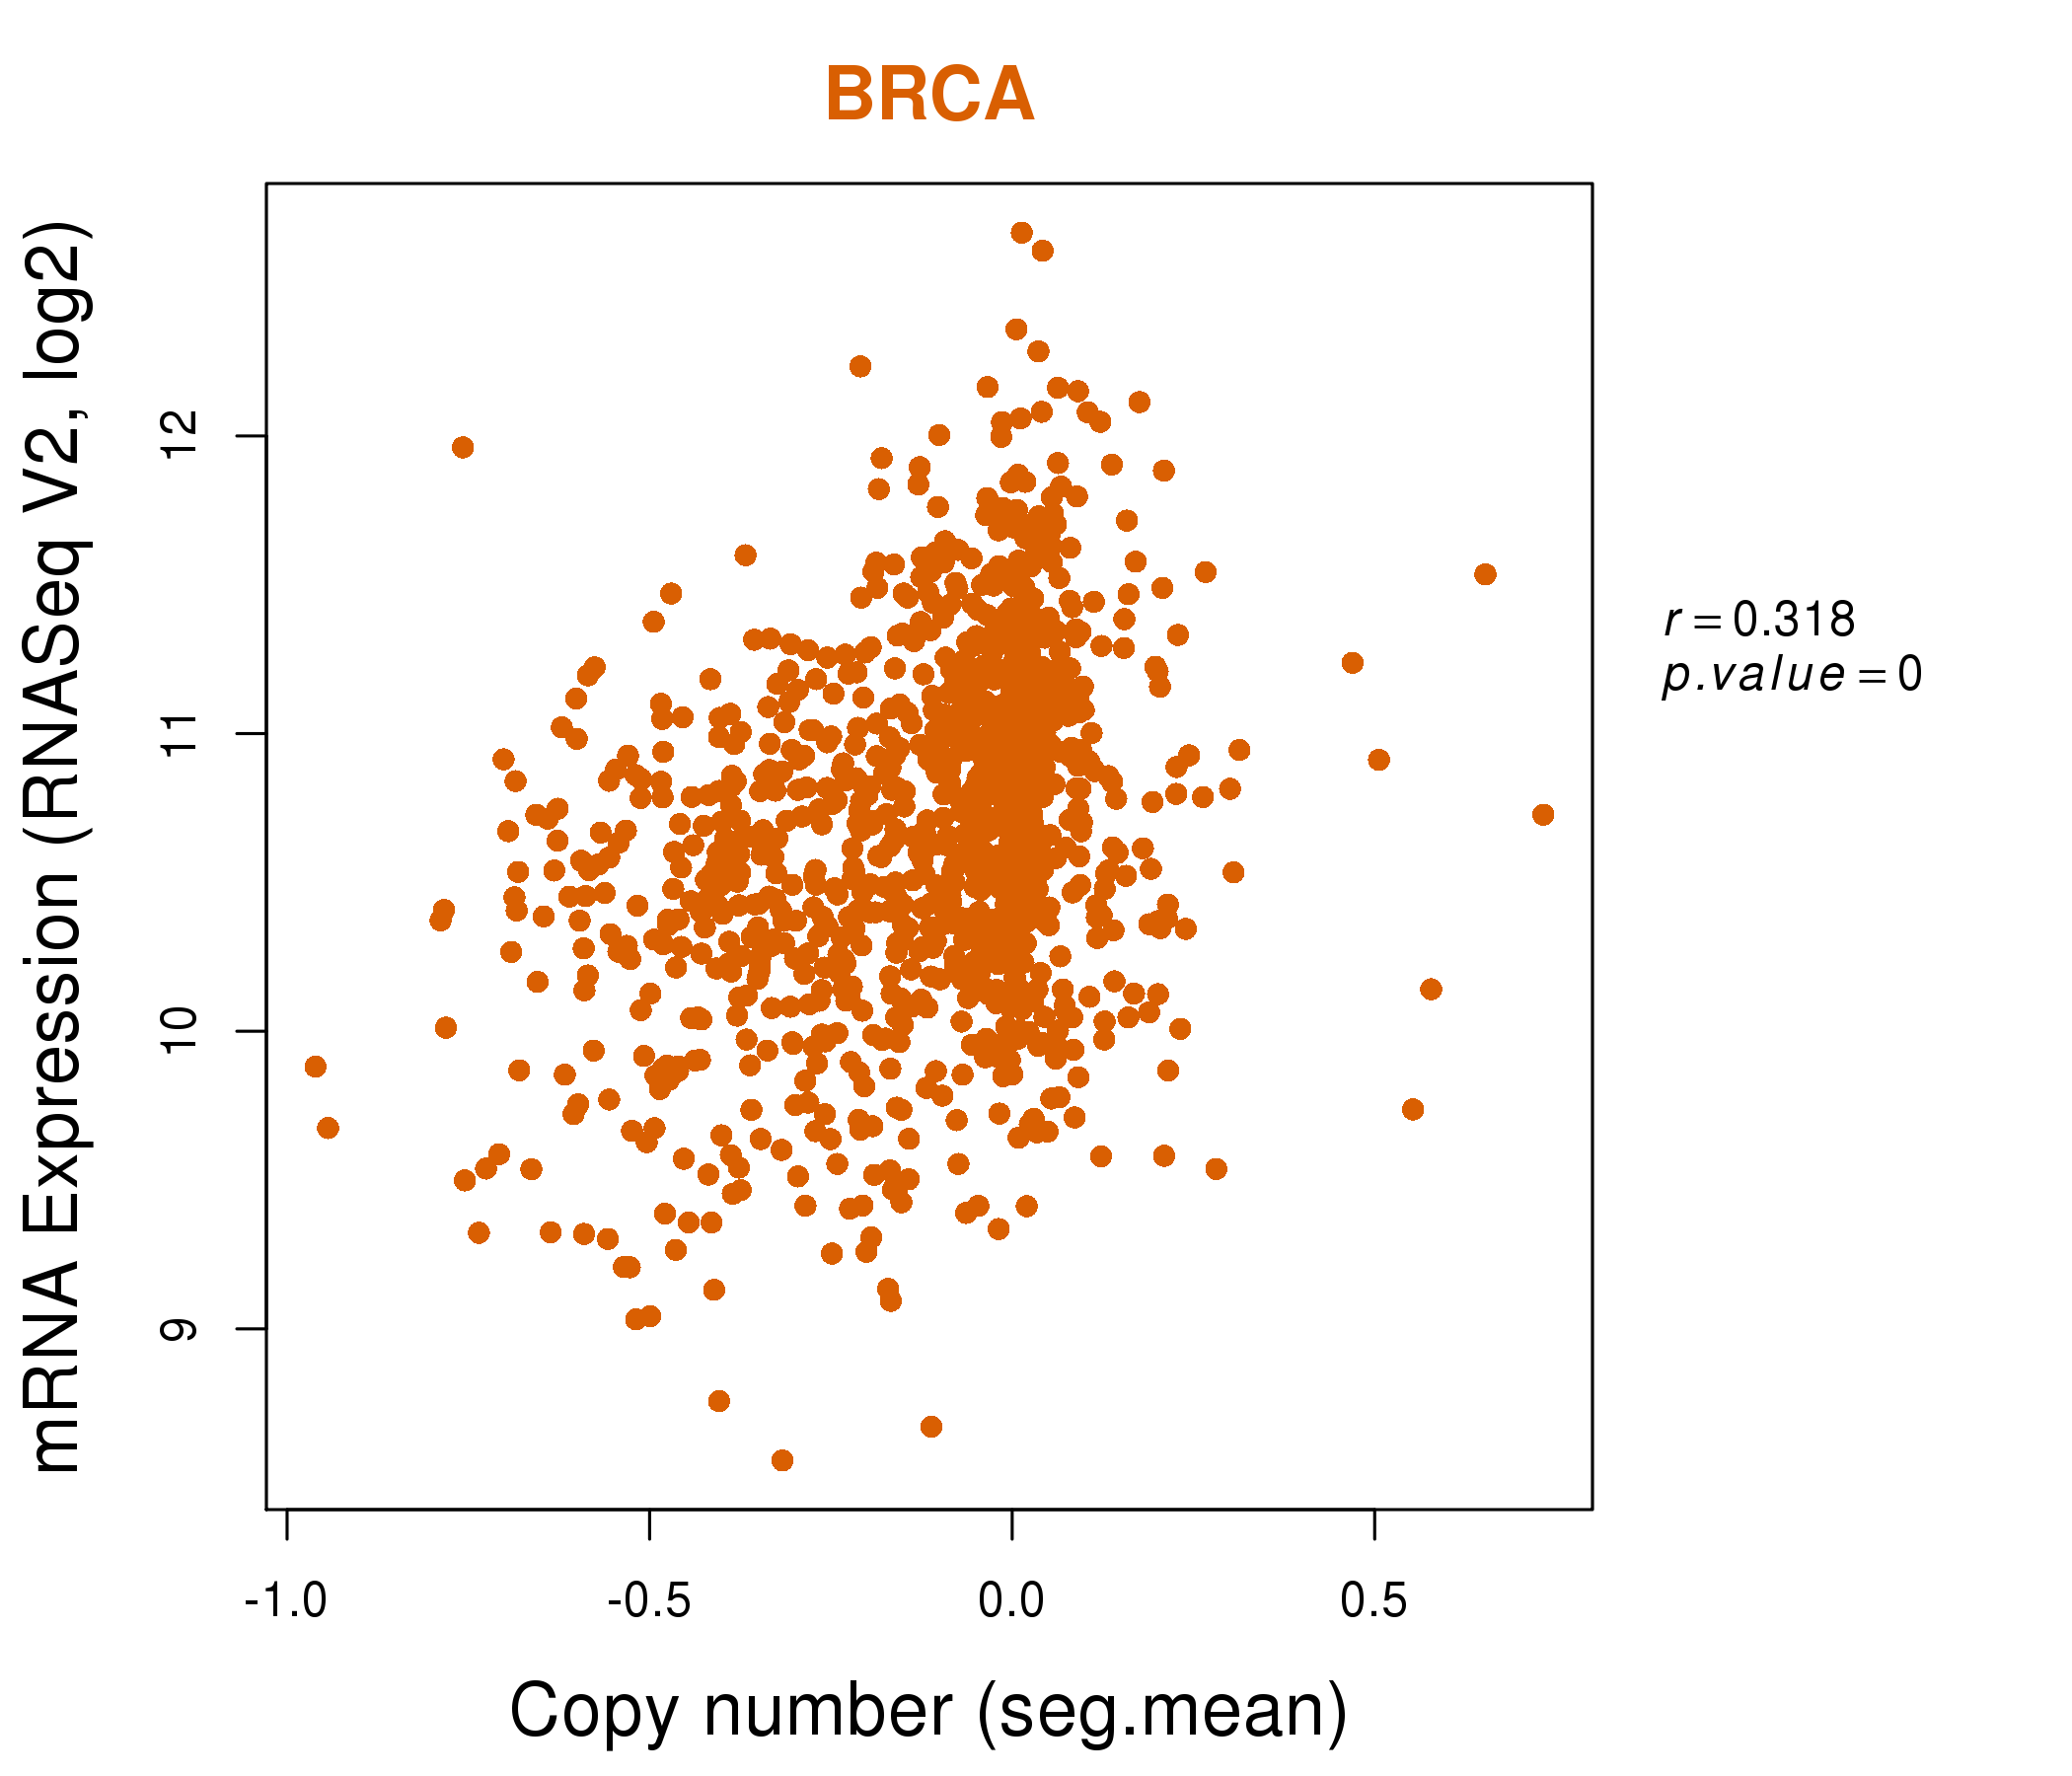
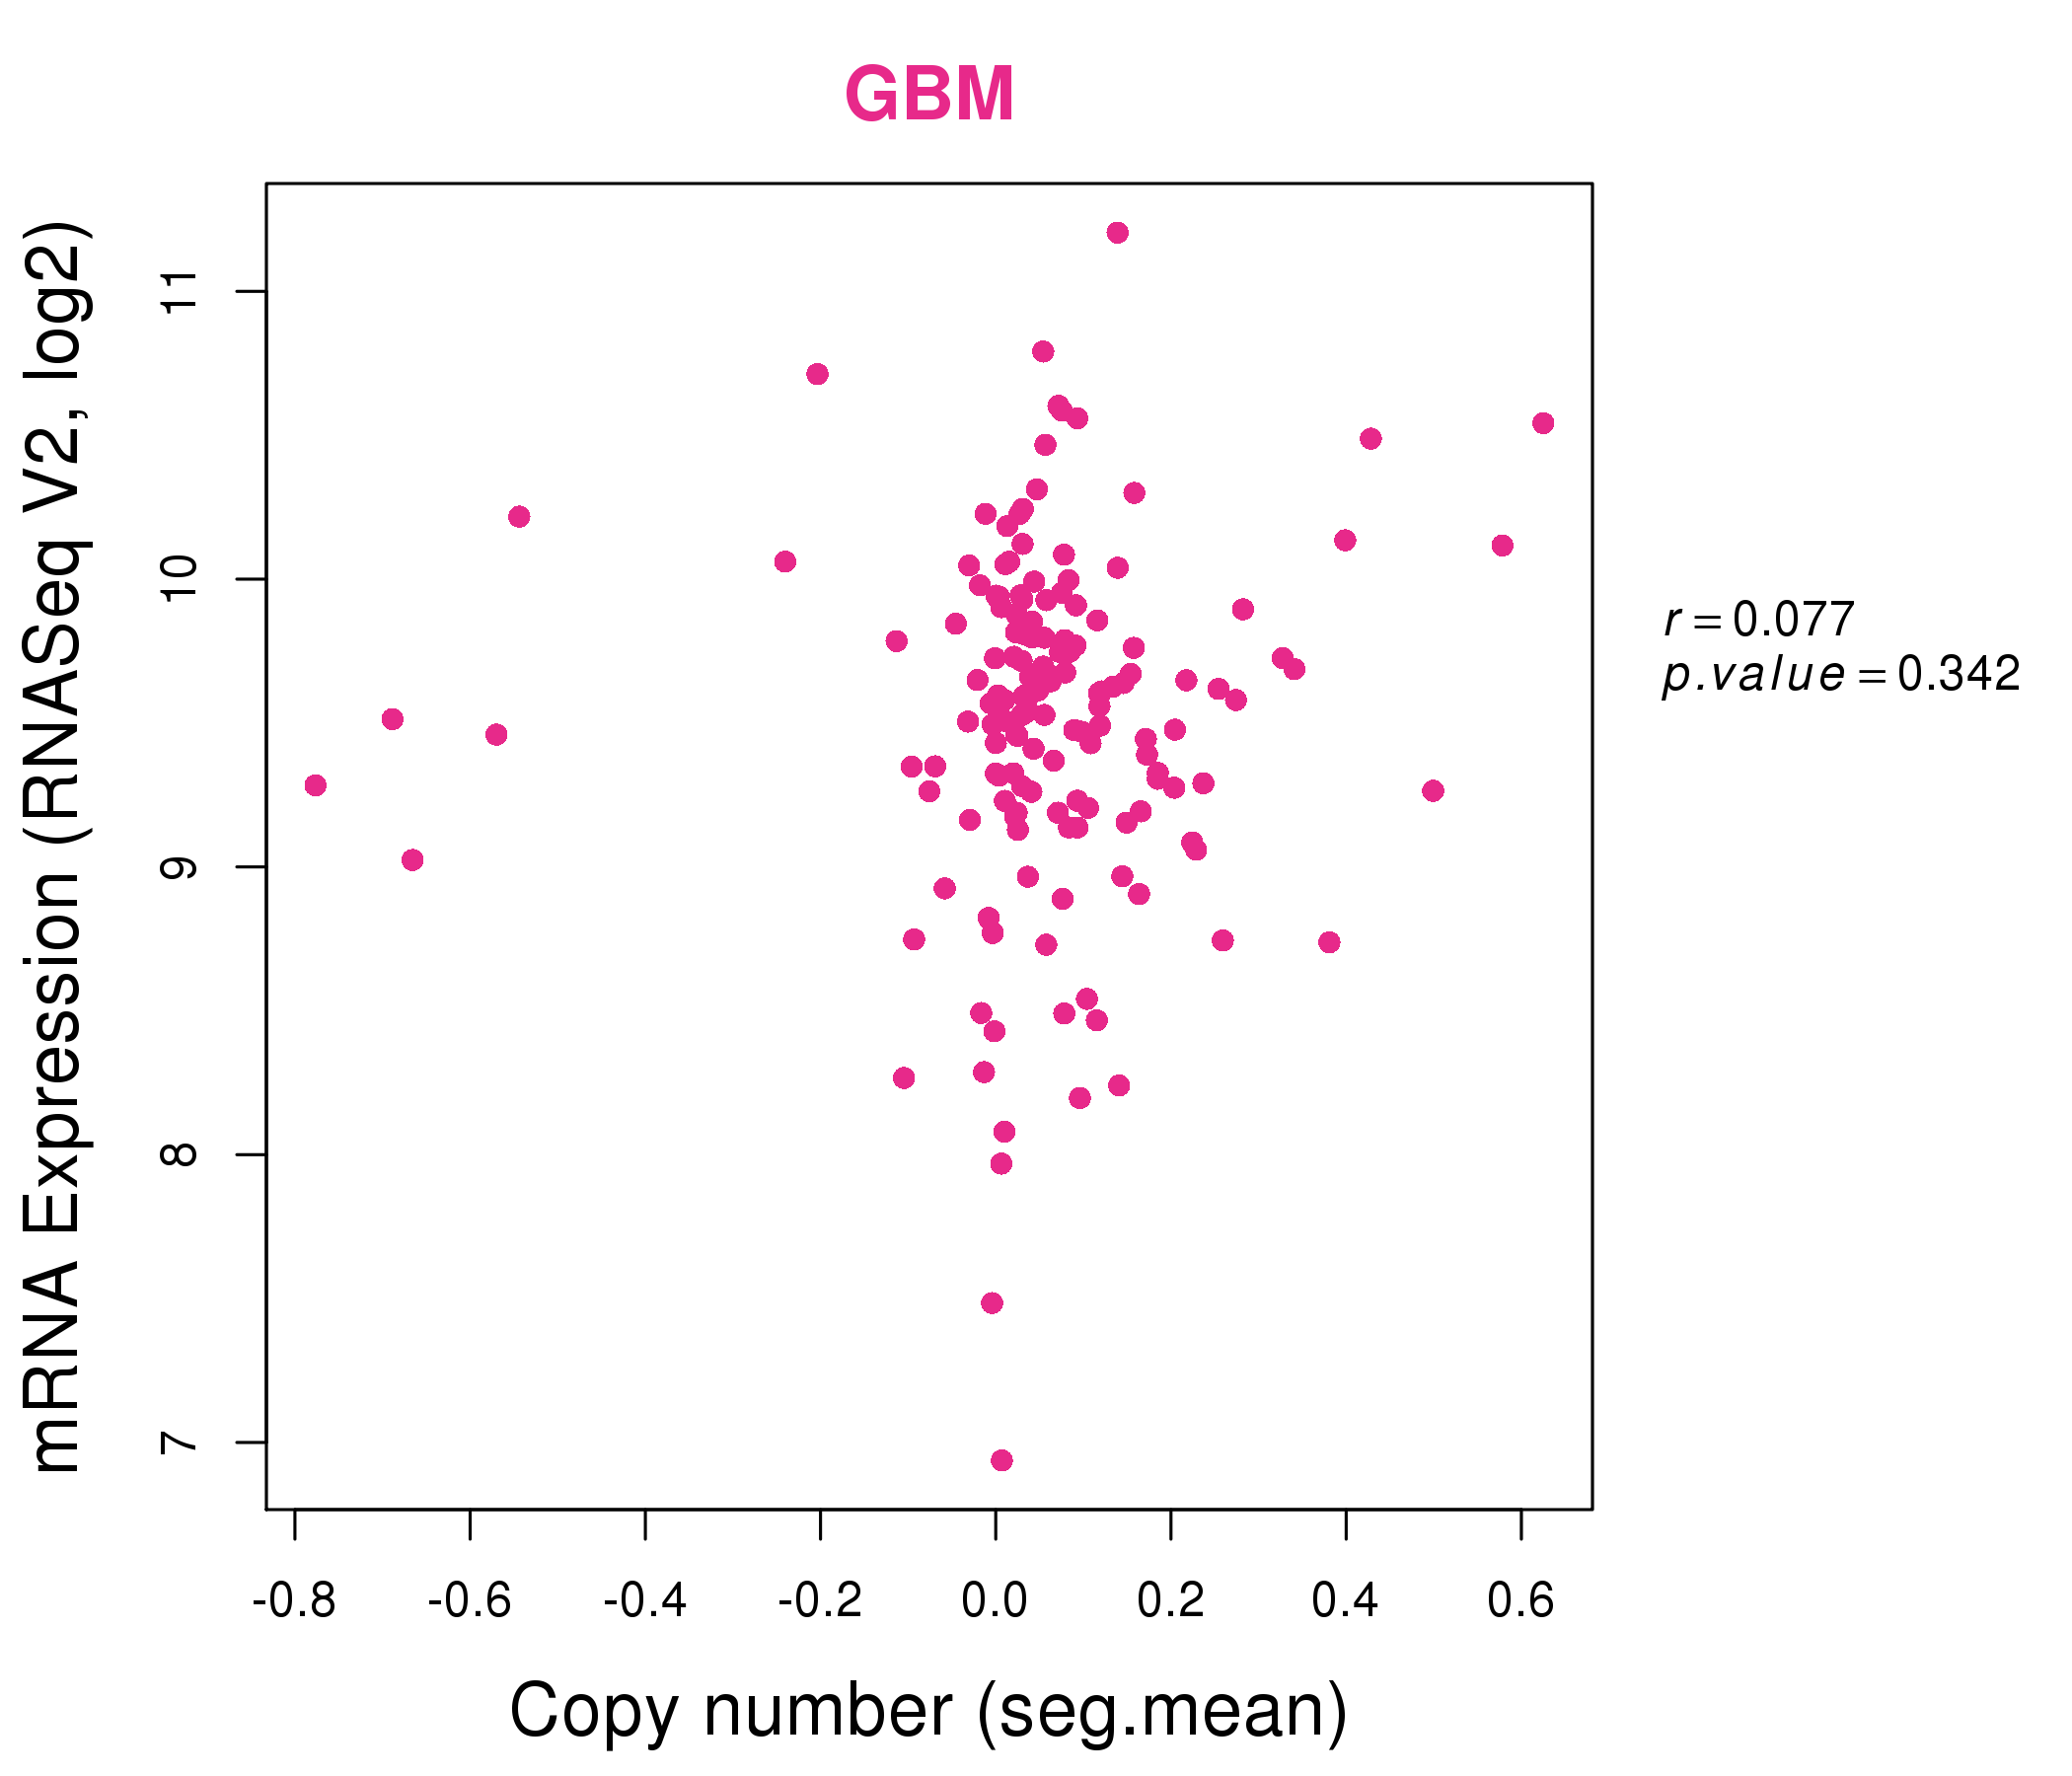
| * Normalized gene expression data of RNASeqV2 was extracted from TCGA using R package TCGA-Assembler. The URLs of all public data files on TCGA DCC data server were gathered at Jan-05-2015. Only eight cancer types have enough normal control samples for differential expression analysis. (t test, adjusted p<0.05 (using Benjamini-Hochberg FDR)) |
 |
| Top |
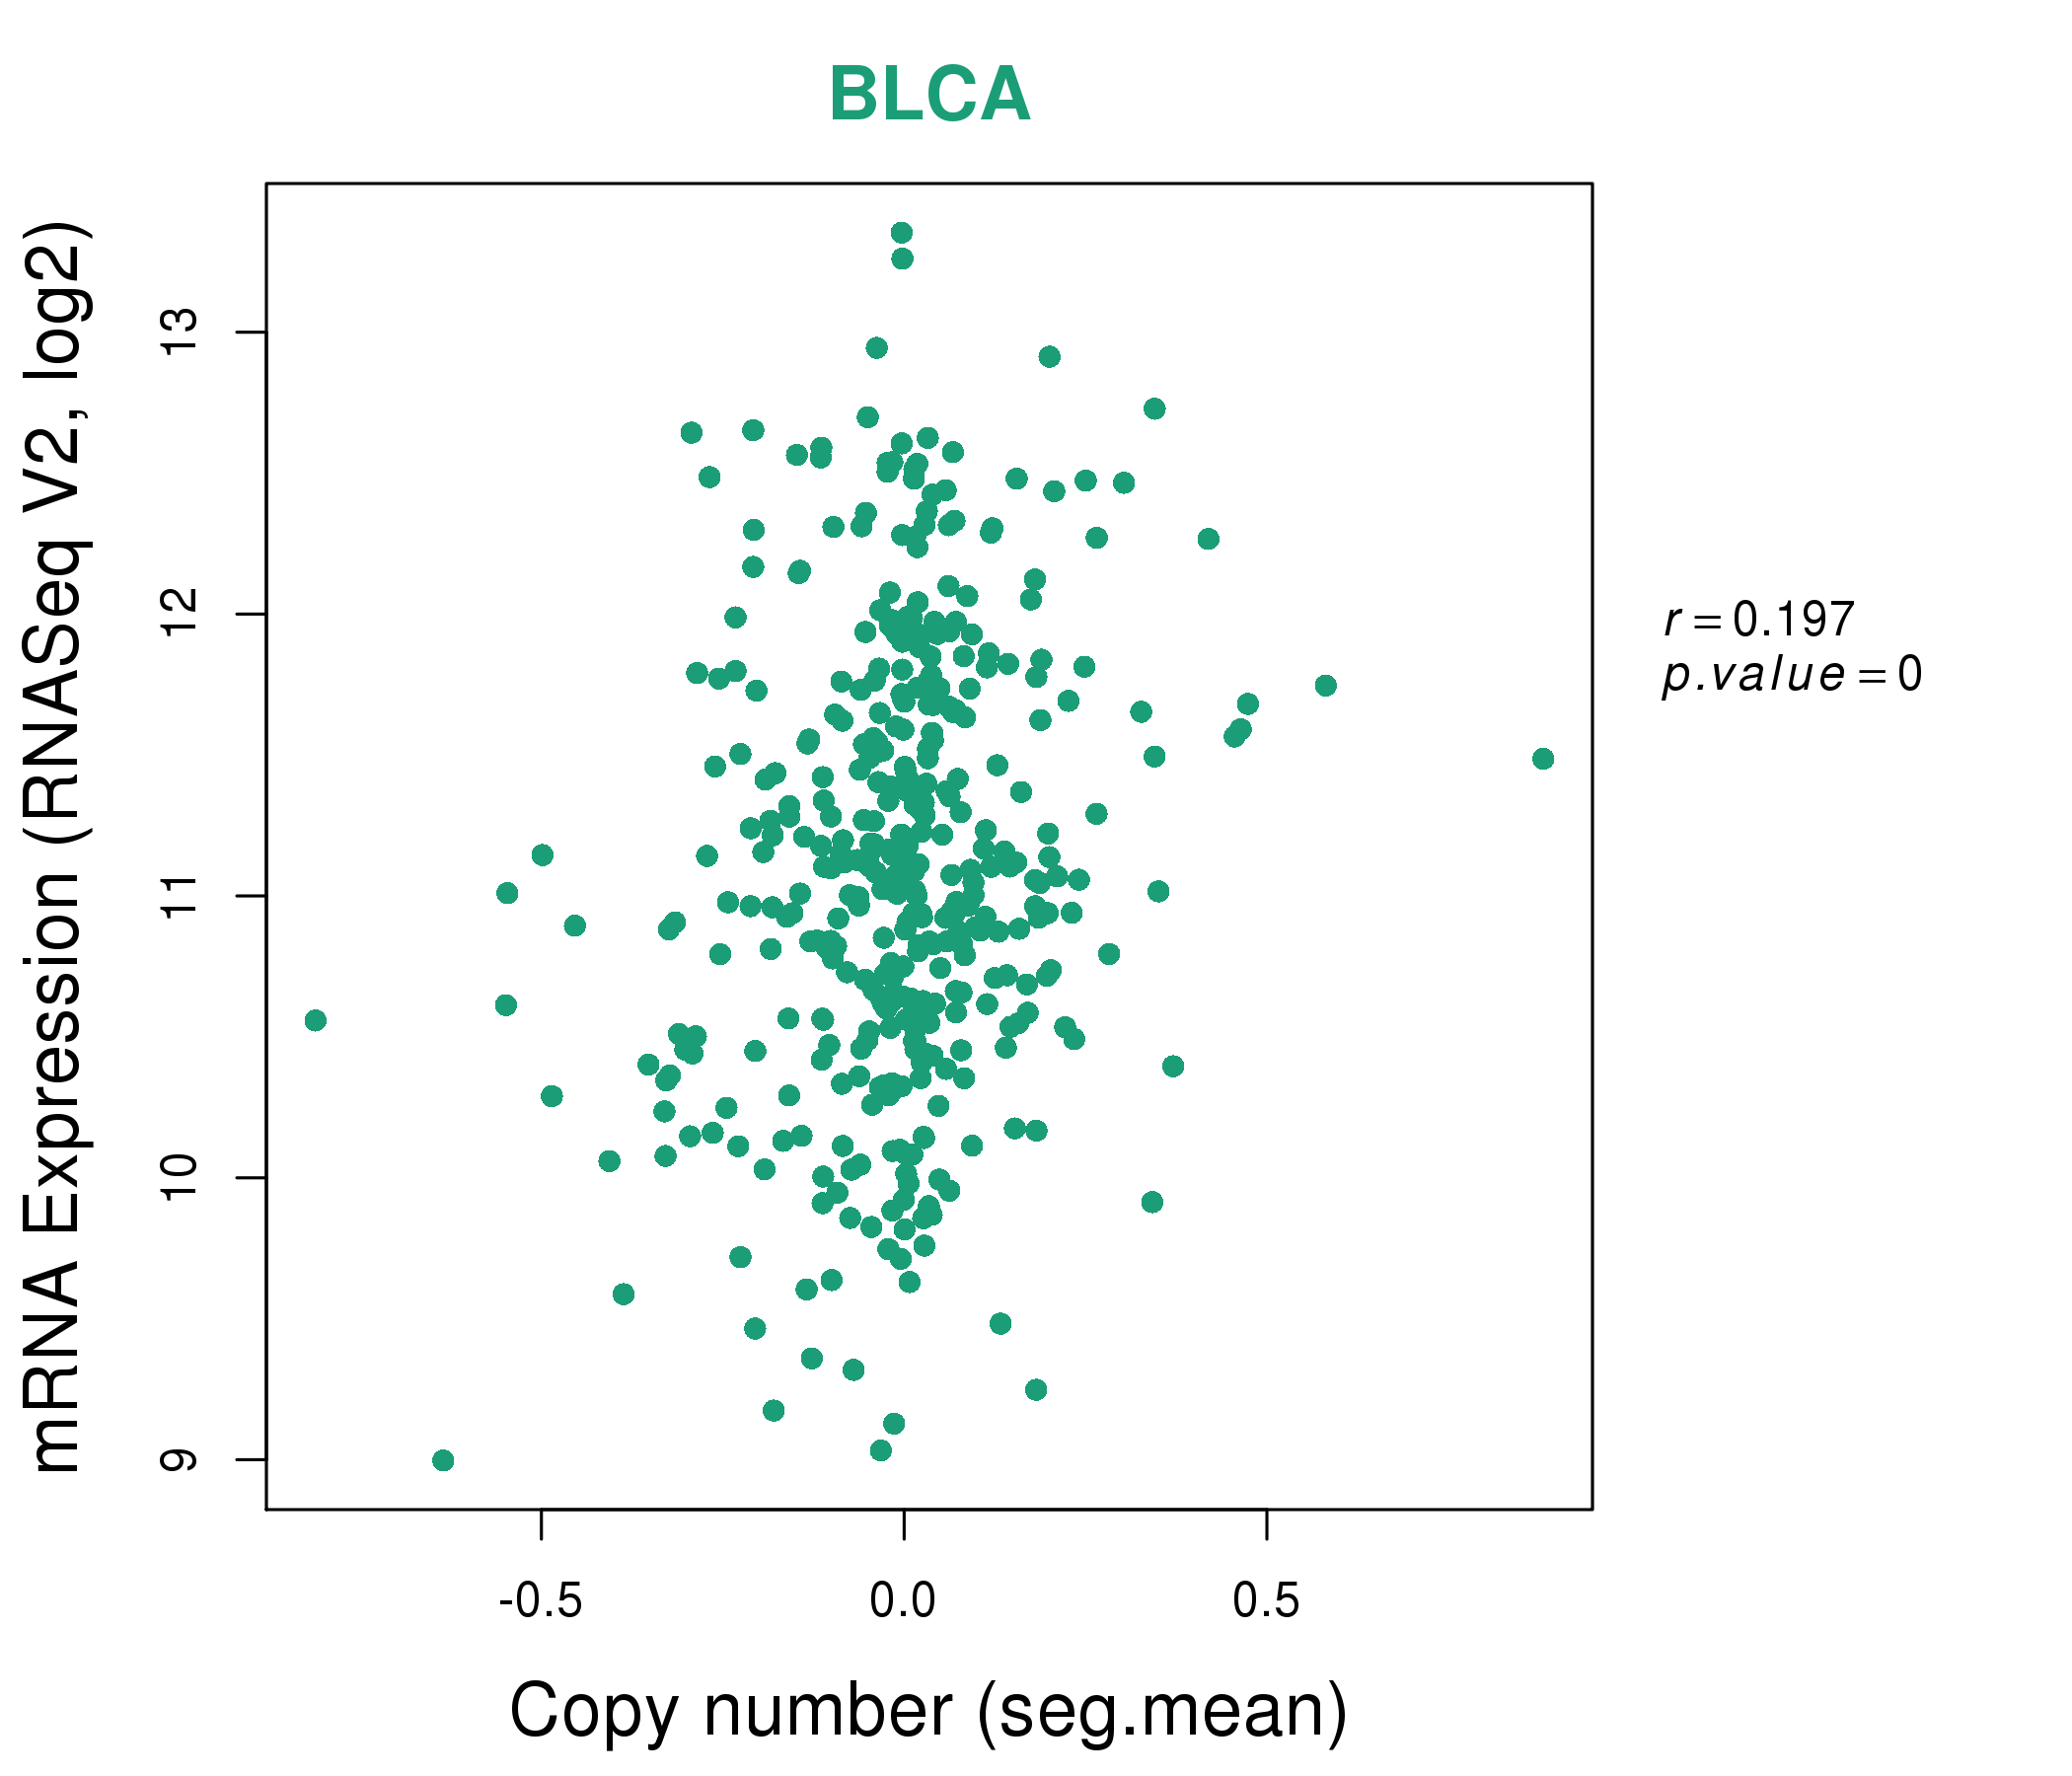
| * This plots show the correlation between CNV and gene expression. |
: Open all plots for all cancer types
 |
|
 |
|
| Top |
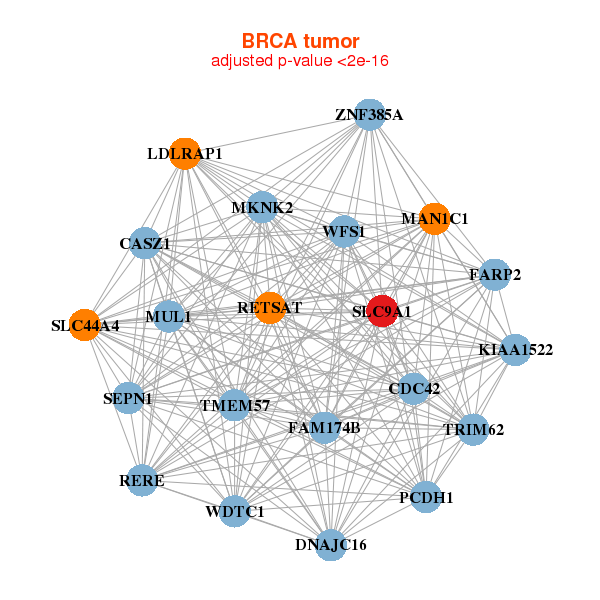
| Gene-Gene Network Information |
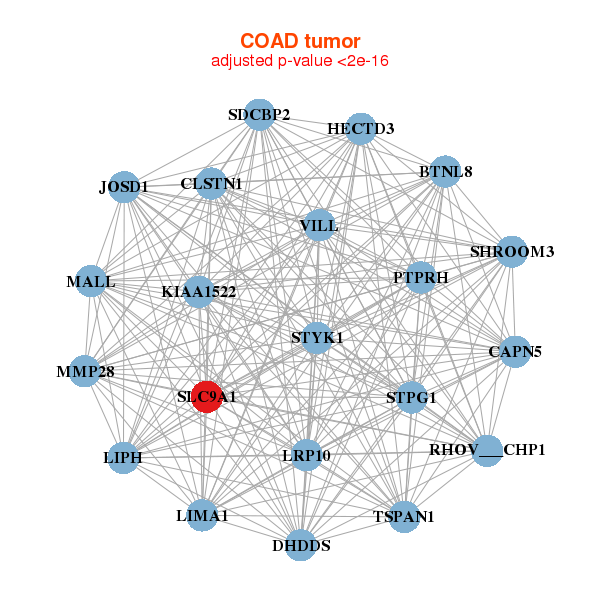
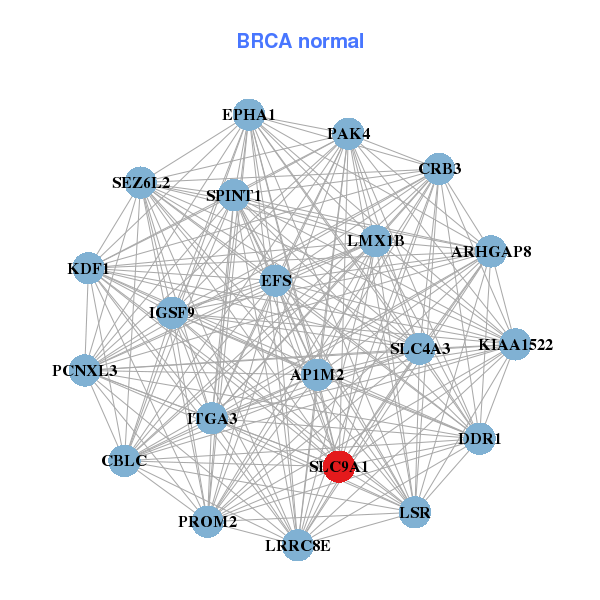
| * Co-Expression network figures were drawn using R package igraph. Only the top 20 genes with the highest correlations were shown. Red circle: input gene, orange circle: cell metabolism gene, sky circle: other gene |
: Open all plots for all cancer types
 |
| ||||
| CASZ1,CDC42,DNAJC16,FAM174B,FARP2,KIAA1522,LDLRAP1, MAN1C1,MKNK2,MUL1,PCDH1,RERE,RETSAT,SEPN1, SLC44A4,SLC9A1,TMEM57,TRIM62,WDTC1,WFS1,ZNF385A | AP1M2,ARHGAP8,KDF1,CBLC,CRB3,DDR1,EFS, EPHA1,IGSF9,ITGA3,KIAA1522,LMX1B,LRRC8E,LSR, PAK4,PCNXL3,PROM2,SEZ6L2,SLC4A3,SLC9A1,SPINT1 | ||||
 |
| ||||
| BTNL8,STPG1,CAPN5,RHOV___CHP1,CLSTN1,DHDDS,HECTD3, JOSD1,KIAA1522,LIMA1,LIPH,LRP10,MALL,MMP28, PTPRH,SDCBP2,SHROOM3,SLC9A1,STYK1,TSPAN1,VILL | ARHGAP17,BTBD9,CDH1,CGN,CLSTN1,CNNM4,ELF4, JUP,KIAA1671,KIF13B,MARK2,MGLL,MYH14,PCDH1, RUNDC1,SLC9A1,TMEM127,TMEM164,TMEM63B,WIPF2,WWP2 |
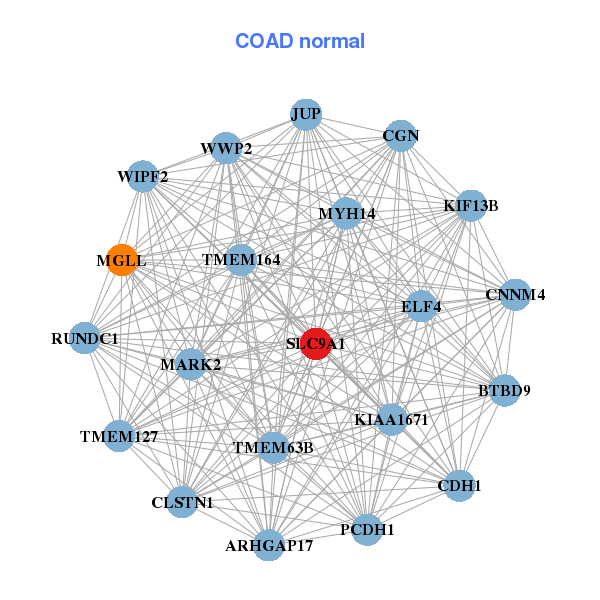
| * Co-Expression network figures were drawn using R package igraph. Only the top 20 genes with the highest correlations were shown. Red circle: input gene, orange circle: cell metabolism gene, sky circle: other gene |
: Open all plots for all cancer types
| Top |
: Open all interacting genes' information including KEGG pathway for all interacting genes from DAVID
| Top |
| Pharmacological Information for SLC9A1 |
| DB Category | DB Name | DB's ID and Url link |
| Chemistry | BindingDB | P19634; -. |
| Chemistry | ChEMBL | CHEMBL2781; -. |
| Organism-specific databases | PharmGKB | PA35928; -. |
| Organism-specific databases | CTD | 6548; -. |
| * Gene Centered Interaction Network. |
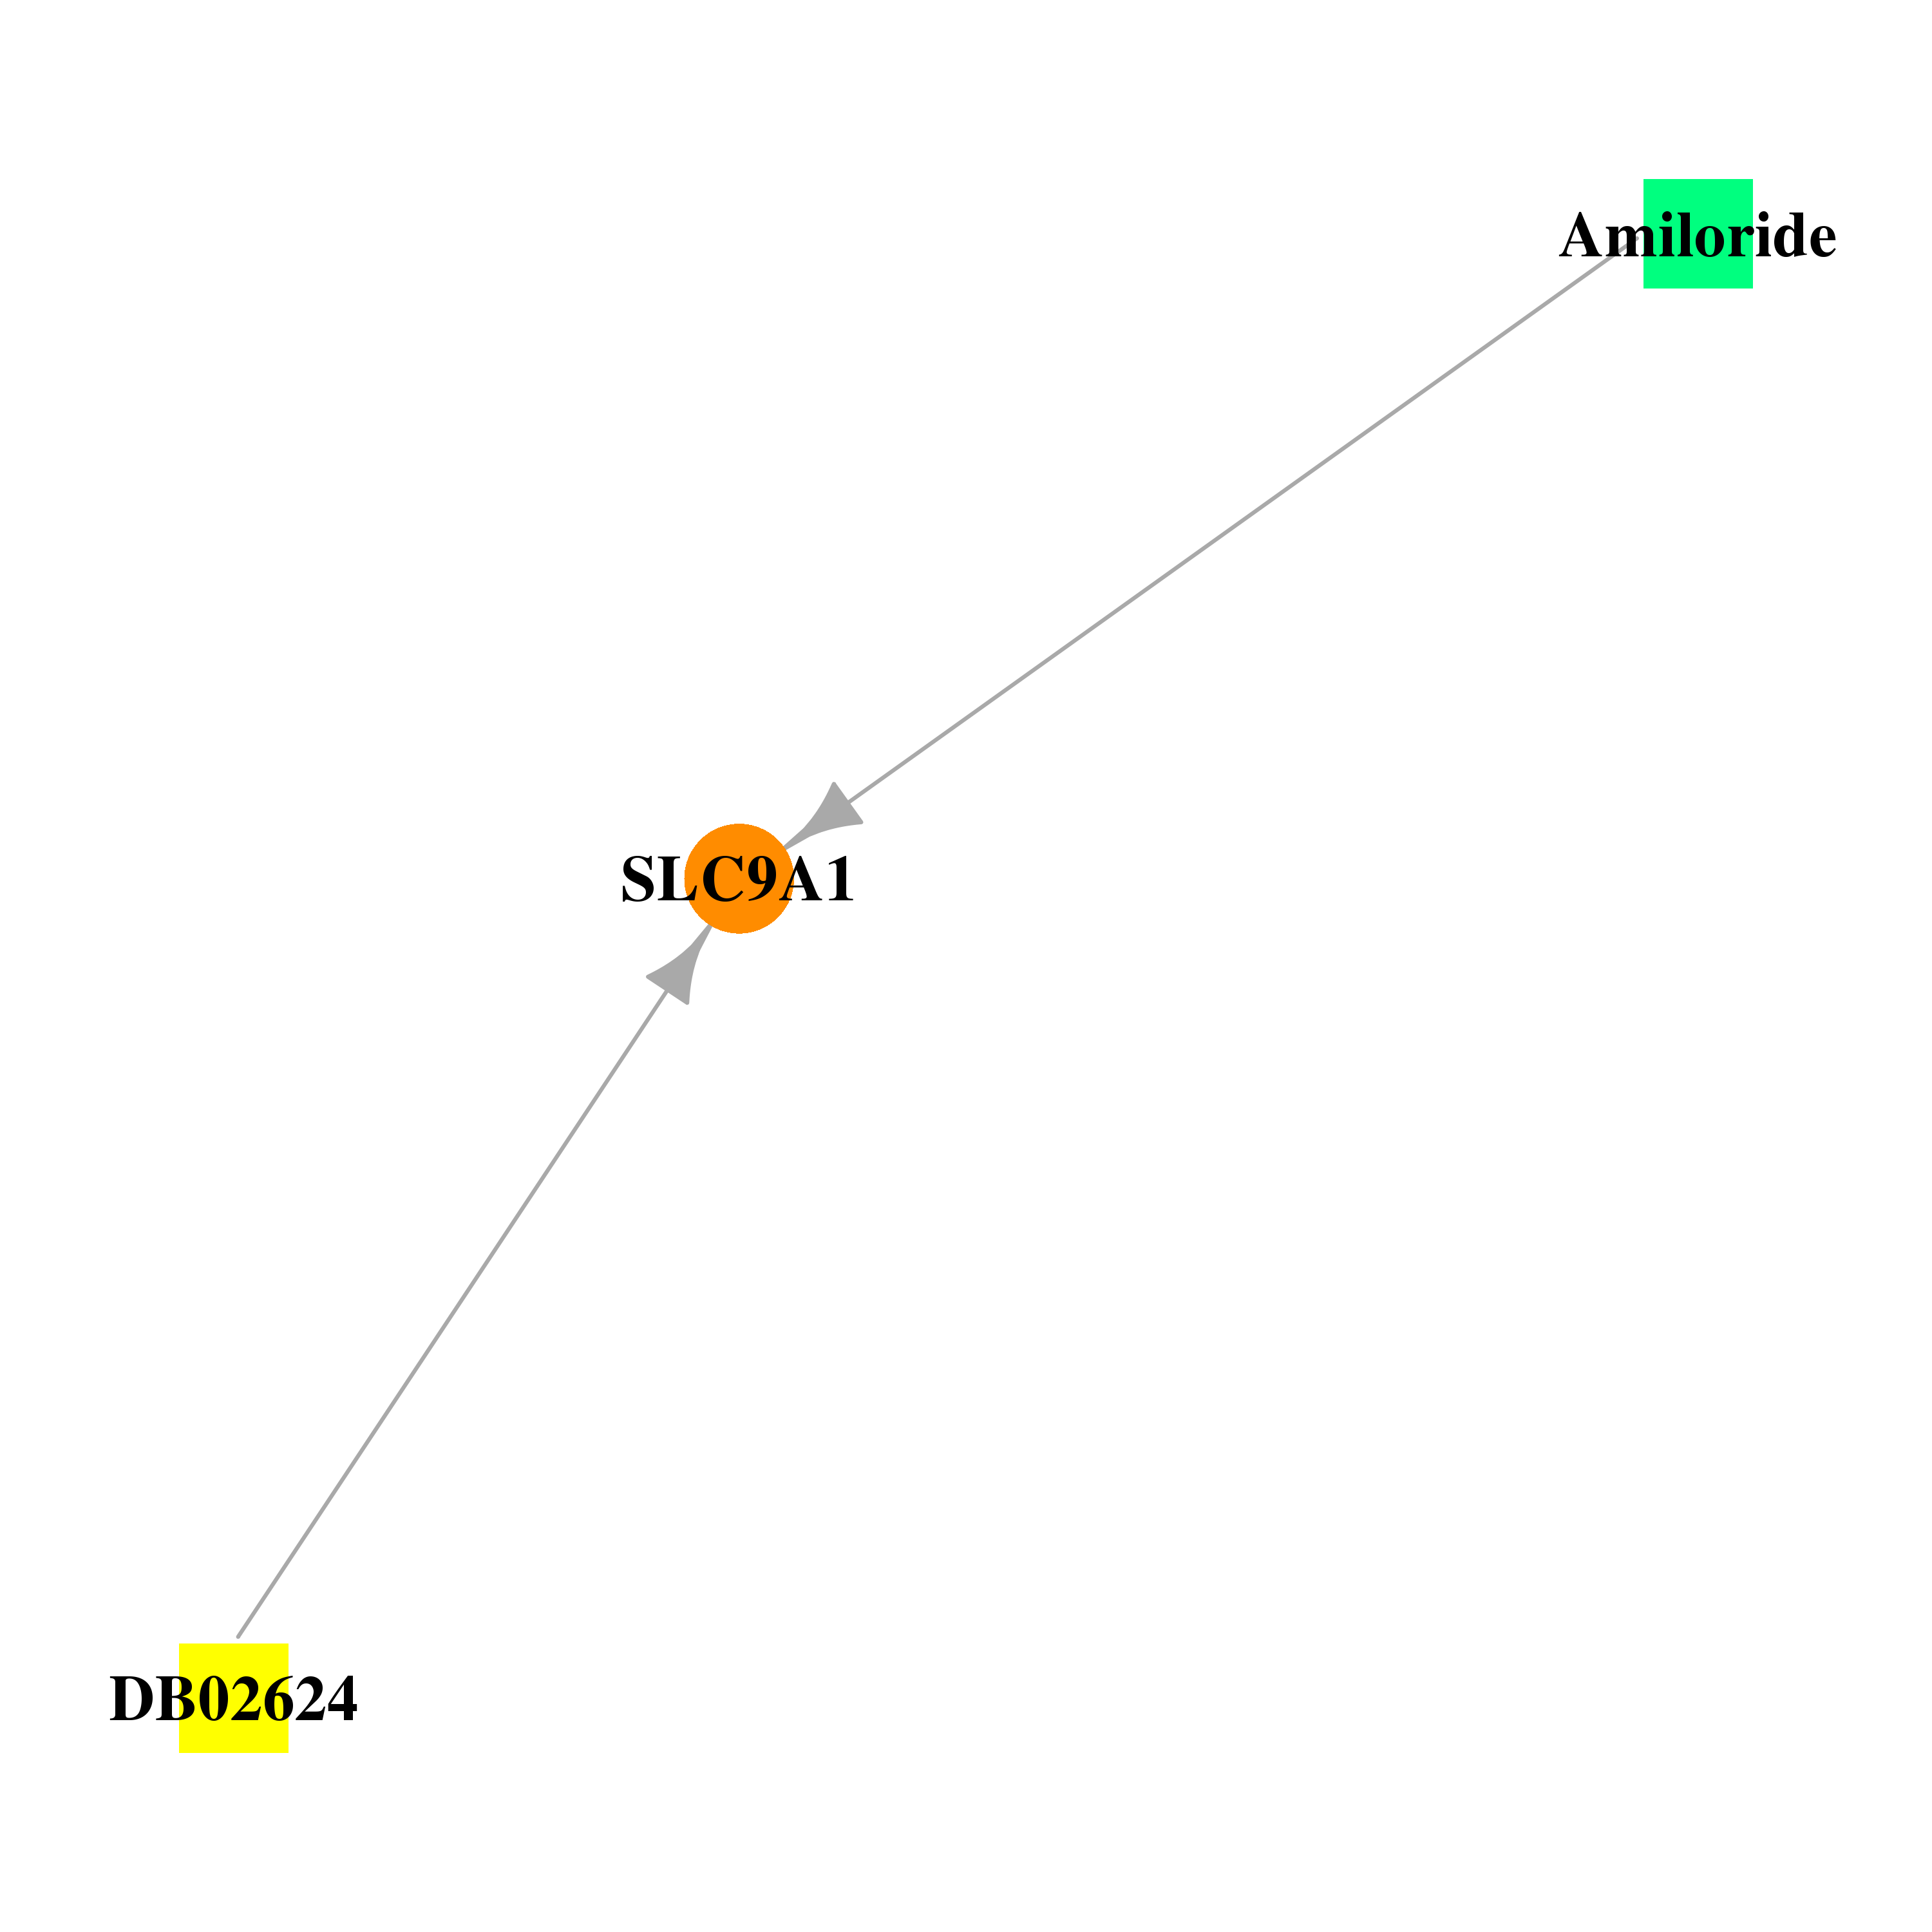 |
| * Drug Centered Interaction Network. |
| DrugBank ID | Target Name | Drug Groups | Generic Name | Drug Centered Network | Drug Structure |
| DB00594 | solute carrier family 9, subfamily A (NHE1, cation proton antiporter 1), member 1 | approved | Amiloride |  | 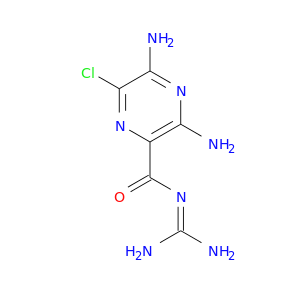 |
| DB02624 | solute carrier family 9, subfamily A (NHE1, cation proton antiporter 1), member 1 | experimental | Homoserine Lactone |  | 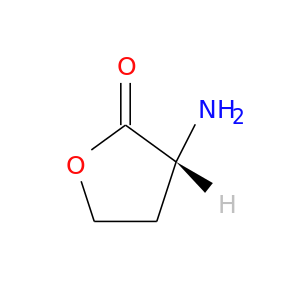 |
| Top |
| Cross referenced IDs for SLC9A1 |
| * We obtained these cross-references from Uniprot database. It covers 150 different DBs, 18 categories. http://www.uniprot.org/help/cross_references_section |
: Open all cross reference information
|
Copyright © 2016-Present - The Univsersity of Texas Health Science Center at Houston @ |