|
|||||||||||||||||||||||||||||||||||||||||||||||||||||||||||||||||||||||||||||||||||||||||||||||||||||||||||||||||||||||||||||||||||||||||||||||||||||||||||||||||||||||||||||||||||||||||||||||||||||||||||||||||||||||||||||||||||||||||||||||||||||||||||||||||||||||||||||||||||||||||||||||||||||||||||||||||||||||||||||||||||||||||||||||||||||||||
| |
| Phenotypic Information (metabolism pathway, cancer, disease, phenome) |
| |
| |
| Gene-Gene Network Information: Co-Expression Network, Interacting Genes & KEGG |
| |
|


| Gene Summary for SLC16A1 |
| Basic gene info. | Gene symbol | SLC16A1 |
| Gene name | solute carrier family 16 (monocarboxylate transporter), member 1 | |
| Synonyms | HHF7|MCT|MCT1|MCT1D | |
| Cytomap | UCSC genome browser: 1p12 | |
| Genomic location | chr1 :113454469-113498685 | |
| Type of gene | protein-coding | |
| RefGenes | NM_001166496.1, NM_003051.3, | |
| Ensembl id | ENSG00000155380 | |
| Description | MCT 1monocarboxylate transporter 1solute carrier family 16 (monocarboxylic acid transporters), member 1solute carrier family 16, member 1 (monocarboxylic acid transporter 1) | |
| Modification date | 20141207 | |
| dbXrefs | MIM : 600682 | |
| HGNC : HGNC | ||
| Ensembl : ENSG00000155380 | ||
| HPRD : 02816 | ||
| Vega : OTTHUMG00000012129 | ||
| Protein | UniProt: P53985 go to UniProt's Cross Reference DB Table | |
| Expression | CleanEX: HS_SLC16A1 | |
| BioGPS: 6566 | ||
| Gene Expression Atlas: ENSG00000155380 | ||
| The Human Protein Atlas: ENSG00000155380 | ||
| Pathway | NCI Pathway Interaction Database: SLC16A1 | |
| KEGG: SLC16A1 | ||
| REACTOME: SLC16A1 | ||
| ConsensusPathDB | ||
| Pathway Commons: SLC16A1 | ||
| Metabolism | MetaCyc: SLC16A1 | |
| HUMANCyc: SLC16A1 | ||
| Regulation | Ensembl's Regulation: ENSG00000155380 | |
| miRBase: chr1 :113,454,469-113,498,685 | ||
| TargetScan: NM_001166496 | ||
| cisRED: ENSG00000155380 | ||
| Context | iHOP: SLC16A1 | |
| cancer metabolism search in PubMed: SLC16A1 | ||
| UCL Cancer Institute: SLC16A1 | ||
| Assigned class in ccmGDB | A - This gene has a literature evidence and it belongs to cancer gene. | |
| References showing role of SLC16A1 in cancer cell metabolism | 1. Sanders E, Diehl S (2015) Analysis and interpretation of transcriptomic data obtained from extended Warburg effect genes in patients with clear cell renal cell carcinoma. Oncoscience 2: 151. go to article | |
| Top |
| Phenotypic Information for SLC16A1(metabolism pathway, cancer, disease, phenome) |
| Cancer | CGAP: SLC16A1 |
| Familial Cancer Database: SLC16A1 | |
| * This gene is included in those cancer gene databases. |
|
|
|
|
|
|
| |||||||||||||||||||||||||||||||||||||||||||||||||||||||||||||||||||||||||||||||||||||||||||||||||||||||||||||||||||||||||||||||||||||||||||||||||||||||||||||||||||||||||||||||||||||||||||||||||||||||||||||||||||||||||||||||||||||||||||||||||||||||||||||||||||||||||||||||||||||||||||||||||||||||||||||||||||||||||||||||||||||||||||||||||||
Oncogene 1 | Significant driver gene in | ||||||||||||||||||||||||||||||||||||||||||||||||||||||||||||||||||||||||||||||||||||||||||||||||||||||||||||||||||||||||||||||||||||||||||||||||||||||||||||||||||||||||||||||||||||||||||||||||||||||||||||||||||||||||||||||||||||||||||||||||||||||||||||||||||||||||||||||||||||||||||||||||||||||||||||||||||||||||||||||||||||||||||||||||||||||||
| cf) number; DB name 1 Oncogene; http://nar.oxfordjournals.org/content/35/suppl_1/D721.long, 2 Tumor Suppressor gene; https://bioinfo.uth.edu/TSGene/, 3 Cancer Gene Census; http://www.nature.com/nrc/journal/v4/n3/abs/nrc1299.html, 4 CancerGenes; http://nar.oxfordjournals.org/content/35/suppl_1/D721.long, 5 Network of Cancer Gene; http://ncg.kcl.ac.uk/index.php, 1Therapeutic Vulnerabilities in Cancer; http://cbio.mskcc.org/cancergenomics/statius/ |
| REACTOME_PYRUVATE_METABOLISM_AND_CITRIC_ACID_TCA_CYCLE REACTOME_PYRUVATE_METABOLISM | |
| OMIM | 245340; phenotype. 600682; gene. 610021; phenotype. |
| Orphanet | 165991; Exercise-induced hyperinsulinism. 171690; Metabolic myopathy due to lactate transporter defect. |
| Disease | KEGG Disease: SLC16A1 |
| MedGen: SLC16A1 (Human Medical Genetics with Condition) | |
| ClinVar: SLC16A1 | |
| Phenotype | MGI: SLC16A1 (International Mouse Phenotyping Consortium) |
| PhenomicDB: SLC16A1 | |
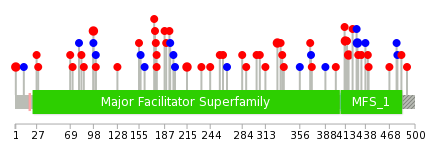
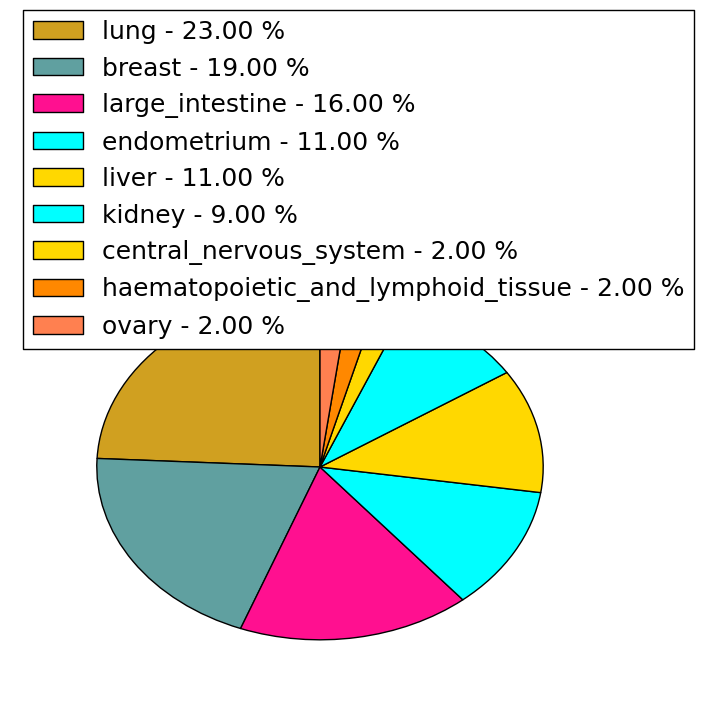
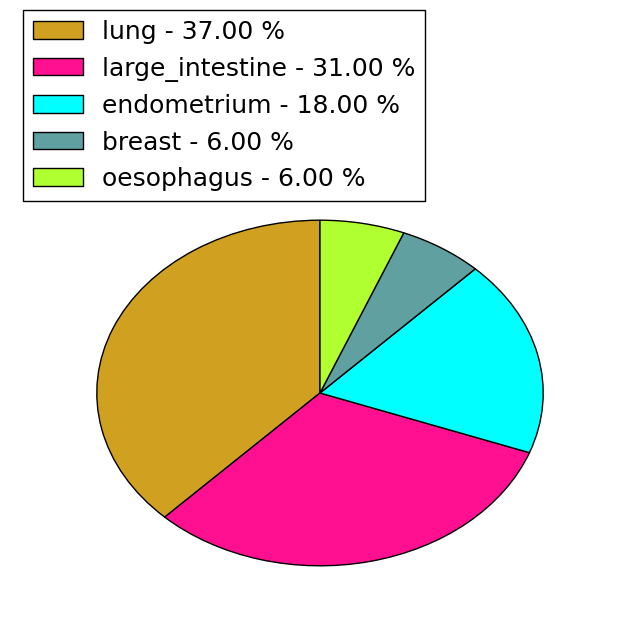
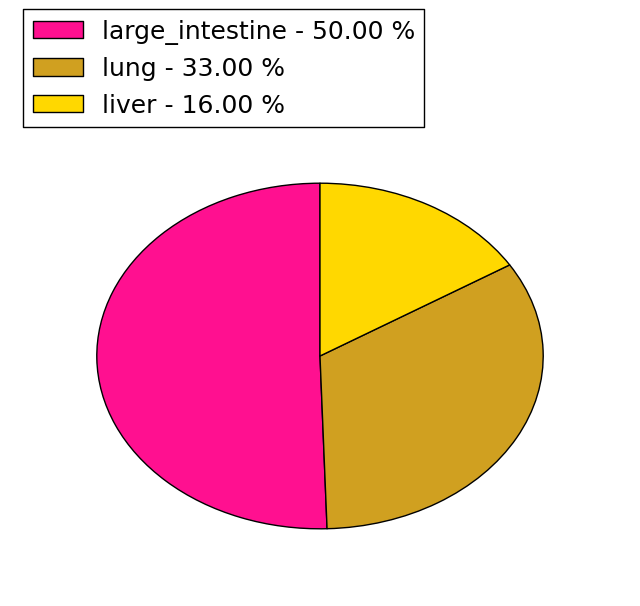
| Mutations for SLC16A1 |
| * Under tables are showing count per each tissue to give us broad intuition about tissue specific mutation patterns.You can go to the detailed page for each mutation database's web site. |
| There's no structural variation information in COSMIC data for this gene. |
| * From mRNA Sanger sequences, Chitars2.0 arranged chimeric transcripts. This table shows SLC16A1 related fusion information. |
| ID | Head Gene | Tail Gene | Accession | Gene_a | qStart_a | qEnd_a | Chromosome_a | tStart_a | tEnd_a | Gene_a | qStart_a | qEnd_a | Chromosome_a | tStart_a | tEnd_a |
| BP239062 | SLC16A1 | 1 | 251 | 1 | 113456386 | 113456634 | UGT2B10 | 252 | 596 | 4 | 69681713 | 69688006 | |
| BI335919 | SLC16A1 | 1 | 384 | 1 | 113455988 | 113456371 | SLC16A1 | 385 | 587 | 1 | 113456372 | 113456574 | |
| BI050753 | FBXW4 | 6 | 212 | 10 | 103387379 | 103387585 | SLC16A1 | 208 | 319 | 1 | 113489160 | 113489319 | |
| Top |
| Mutation type/ Tissue ID | brca | cns | cerv | endome | haematopo | kidn | Lintest | liver | lung | ns | ovary | pancre | prost | skin | stoma | thyro | urina | |||
| Total # sample | 1 | |||||||||||||||||||
| GAIN (# sample) | ||||||||||||||||||||
| LOSS (# sample) | 1 |
| cf) Tissue ID; Tissue type (1; Breast, 2; Central_nervous_system, 3; Cervix, 4; Endometrium, 5; Haematopoietic_and_lymphoid_tissue, 6; Kidney, 7; Large_intestine, 8; Liver, 9; Lung, 10; NS, 11; Ovary, 12; Pancreas, 13; Prostate, 14; Skin, 15; Stomach, 16; Thyroid, 17; Urinary_tract) |
| Top |
|
 |
| Top |
| Stat. for Non-Synonymous SNVs (# total SNVs=42) | (# total SNVs=16) |
 |  |
(# total SNVs=6) | (# total SNVs=1) |
 |  |
| Top |
| * When you move the cursor on each content, you can see more deailed mutation information on the Tooltip. Those are primary_site,primary_histology,mutation(aa),pubmedID. |
| GRCh37 position | Mutation(aa) | Unique sampleID count |
| chr1:113460498-113460498 | p.S177I | 2 |
| chr1:113464681-113464681 | p.C98R | 2 |
| chr1:113471930-113471930 | p.M1V | 2 |
| chr1:113460506-113460506 | p.W174* | 2 |
| chr1:113456732-113456732 | p.V428V | 2 |
| chr1:113460385-113460385 | p.E215Q | 2 |
| chr1:113460203-113460203 | p.F275fs*37 | 2 |
| chr1:113456751-113456756 | p.T422_Y423delTY | 2 |
| chr1:113456766-113456766 | p.G417E | 2 |
| chr1:113471890-113471890 | p.P14fs*10 | 2 |
| Top |
|
 |
| Point Mutation/ Tissue ID | 1 | 2 | 3 | 4 | 5 | 6 | 7 | 8 | 9 | 10 | 11 | 12 | 13 | 14 | 15 | 16 | 17 | 18 | 19 | 20 |
| # sample | 4 | 4 | 1 | 11 | 1 | 1 | 3 | 1 | 7 | 1 | 1 | 5 | 2 | 5 | ||||||
| # mutation | 4 | 3 | 1 | 10 | 1 | 1 | 3 | 1 | 7 | 1 | 1 | 5 | 2 | 5 | ||||||
| nonsynonymous SNV | 1 | 3 | 6 | 1 | 1 | 3 | 1 | 4 | 1 | 1 | 5 | 1 | 3 | |||||||
| synonymous SNV | 3 | 1 | 4 | 3 | 1 | 2 |
| cf) Tissue ID; Tissue type (1; BLCA[Bladder Urothelial Carcinoma], 2; BRCA[Breast invasive carcinoma], 3; CESC[Cervical squamous cell carcinoma and endocervical adenocarcinoma], 4; COAD[Colon adenocarcinoma], 5; GBM[Glioblastoma multiforme], 6; Glioma Low Grade, 7; HNSC[Head and Neck squamous cell carcinoma], 8; KICH[Kidney Chromophobe], 9; KIRC[Kidney renal clear cell carcinoma], 10; KIRP[Kidney renal papillary cell carcinoma], 11; LAML[Acute Myeloid Leukemia], 12; LUAD[Lung adenocarcinoma], 13; LUSC[Lung squamous cell carcinoma], 14; OV[Ovarian serous cystadenocarcinoma ], 15; PAAD[Pancreatic adenocarcinoma], 16; PRAD[Prostate adenocarcinoma], 17; SKCM[Skin Cutaneous Melanoma], 18:STAD[Stomach adenocarcinoma], 19:THCA[Thyroid carcinoma], 20:UCEC[Uterine Corpus Endometrial Carcinoma]) |
| Top |
| * We represented just top 10 SNVs. When you move the cursor on each content, you can see more deailed mutation information on the Tooltip. Those are primary_site, primary_histology, mutation(aa), pubmedID. |
| Genomic Position | Mutation(aa) | Unique sampleID count |
| chr1:113464681 | p.R328Q,SLC16A1 | 3 |
| chr1:113460045 | p.C98R,SLC16A1 | 3 |
| chr1:113460498 | p.V428V,SLC16A1 | 2 |
| chr1:113456732 | p.G417E,SLC16A1 | 2 |
| chr1:113456766 | p.S177I,SLC16A1 | 2 |
| chr1:113460112 | p.F356F,SLC16A1 | 1 |
| chr1:113460590 | p.P155T,SLC16A1 | 1 |
| chr1:113456771 | p.A334V,SLC16A1 | 1 |
| chr1:113471850 | p.A146A,SLC16A1 | 1 |
| chr1:113460124 | p.F332L,SLC16A1 | 1 |
| * Copy number data were extracted from TCGA using R package TCGA-Assembler. The URLs of all public data files on TCGA DCC data server were gathered on Jan-05-2015. Function ProcessCNAData in TCGA-Assembler package was used to obtain gene-level copy number value which is calculated as the average copy number of the genomic region of a gene. |
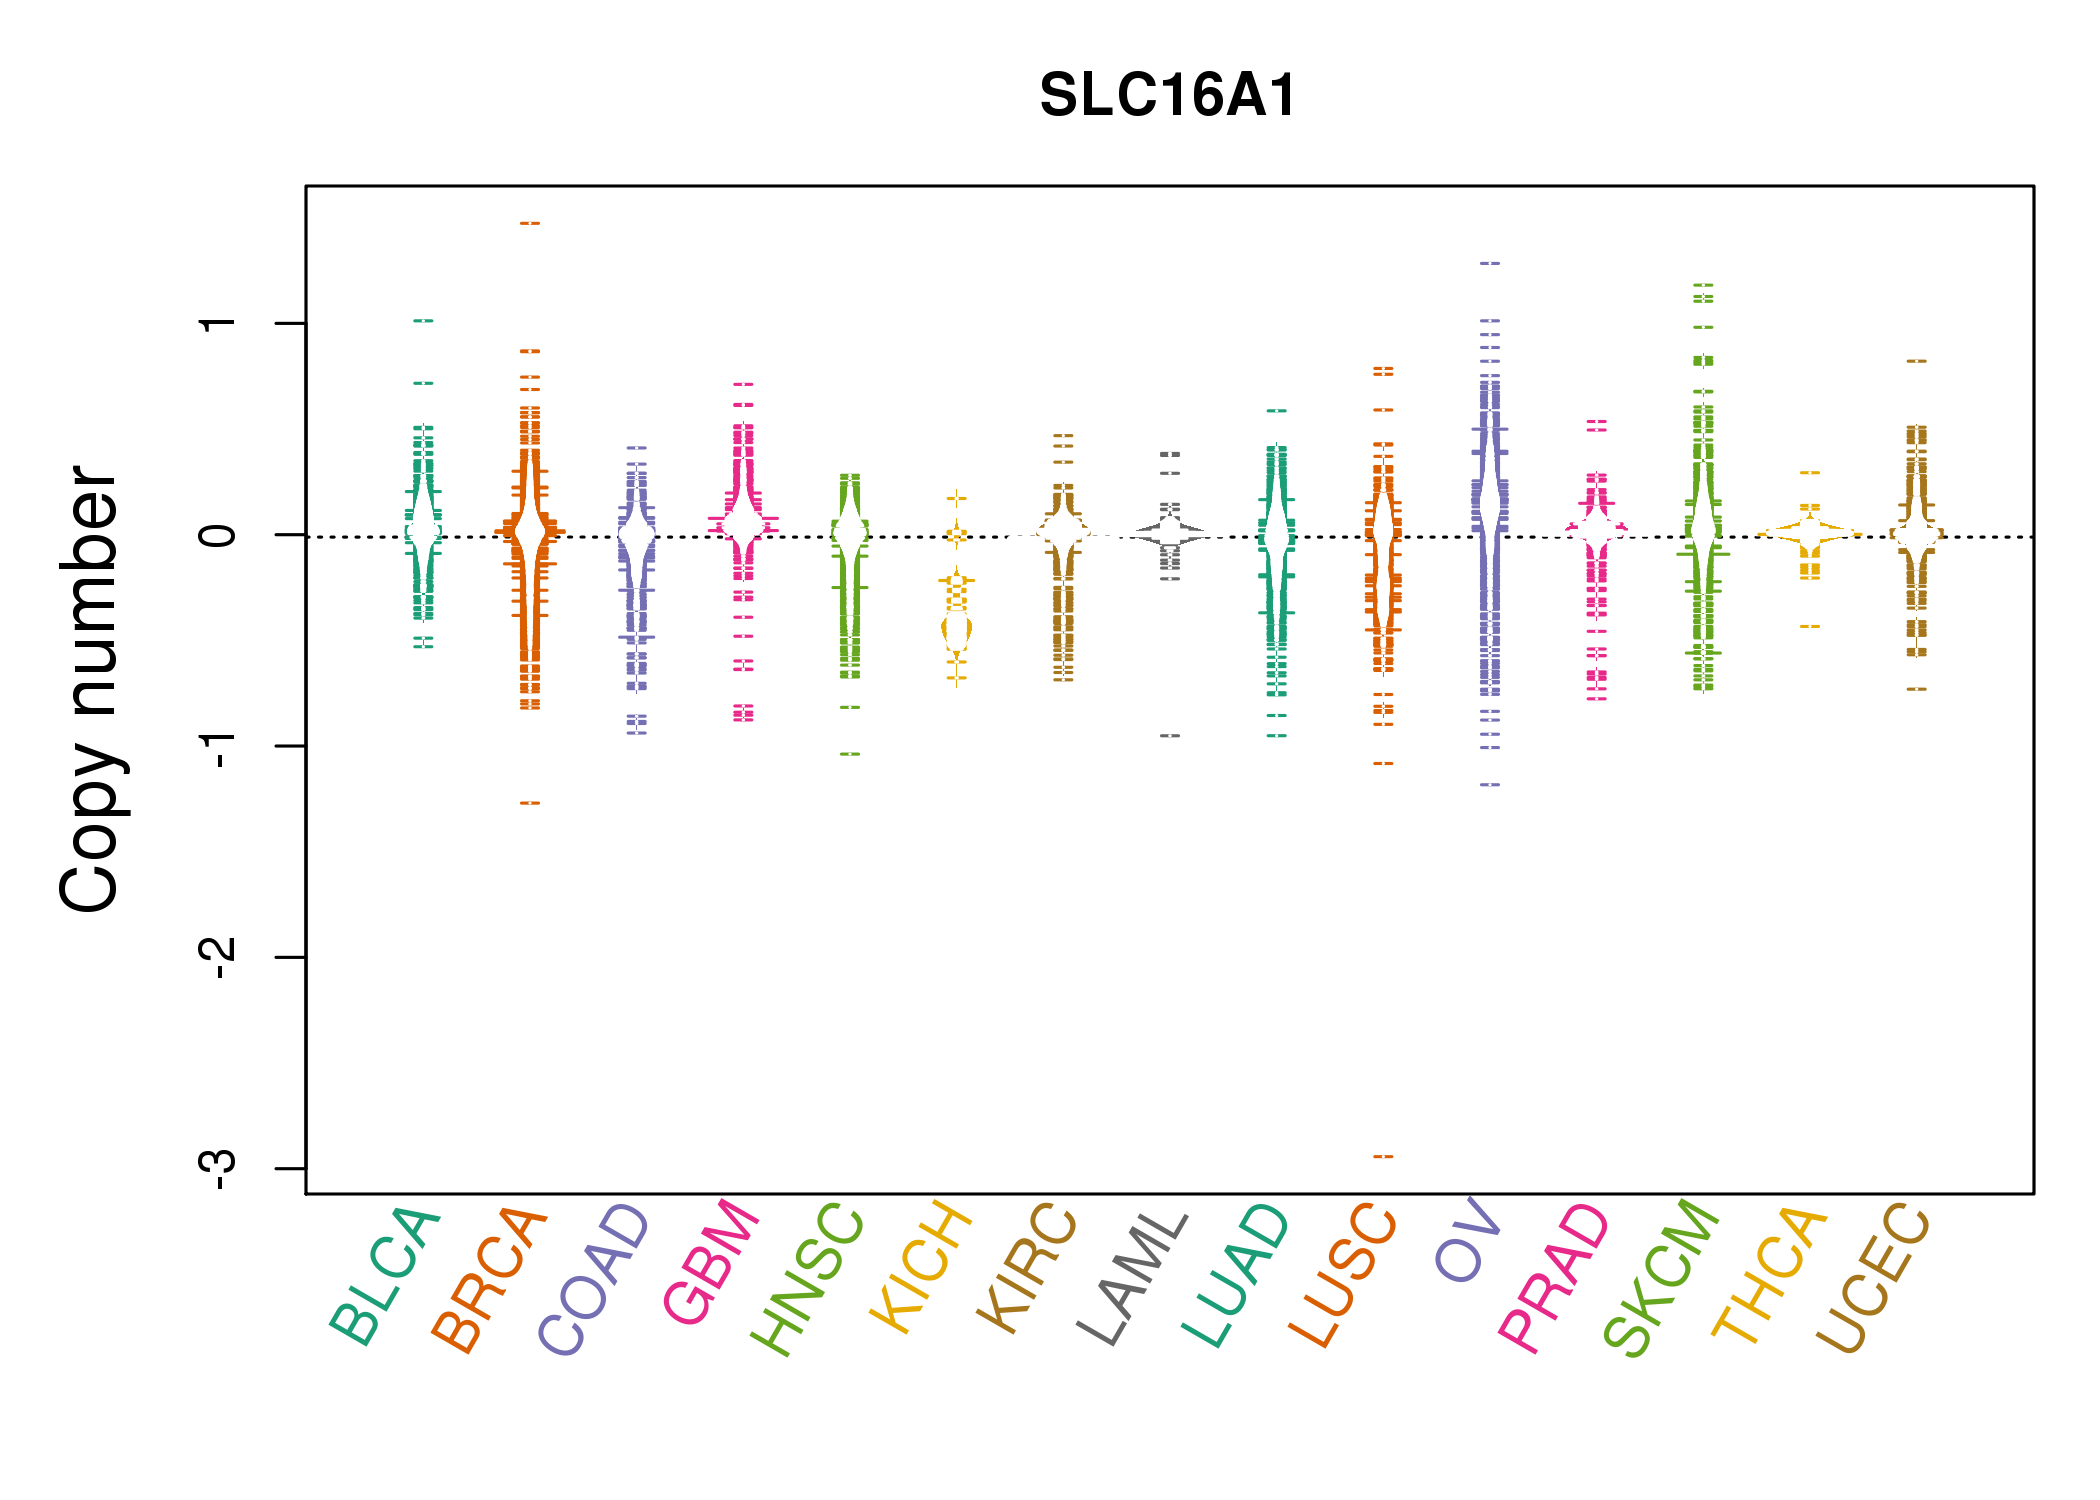 |
| cf) Tissue ID[Tissue type]: BLCA[Bladder Urothelial Carcinoma], BRCA[Breast invasive carcinoma], CESC[Cervical squamous cell carcinoma and endocervical adenocarcinoma], COAD[Colon adenocarcinoma], GBM[Glioblastoma multiforme], Glioma Low Grade, HNSC[Head and Neck squamous cell carcinoma], KICH[Kidney Chromophobe], KIRC[Kidney renal clear cell carcinoma], KIRP[Kidney renal papillary cell carcinoma], LAML[Acute Myeloid Leukemia], LUAD[Lung adenocarcinoma], LUSC[Lung squamous cell carcinoma], OV[Ovarian serous cystadenocarcinoma ], PAAD[Pancreatic adenocarcinoma], PRAD[Prostate adenocarcinoma], SKCM[Skin Cutaneous Melanoma], STAD[Stomach adenocarcinoma], THCA[Thyroid carcinoma], UCEC[Uterine Corpus Endometrial Carcinoma] |
| Top |
| Gene Expression for SLC16A1 |
| * CCLE gene expression data were extracted from CCLE_Expression_Entrez_2012-10-18.res: Gene-centric RMA-normalized mRNA expression data. |
 |
| * Normalized gene expression data of RNASeqV2 was extracted from TCGA using R package TCGA-Assembler. The URLs of all public data files on TCGA DCC data server were gathered at Jan-05-2015. Only eight cancer types have enough normal control samples for differential expression analysis. (t test, adjusted p<0.05 (using Benjamini-Hochberg FDR)) |
 |
| Top |
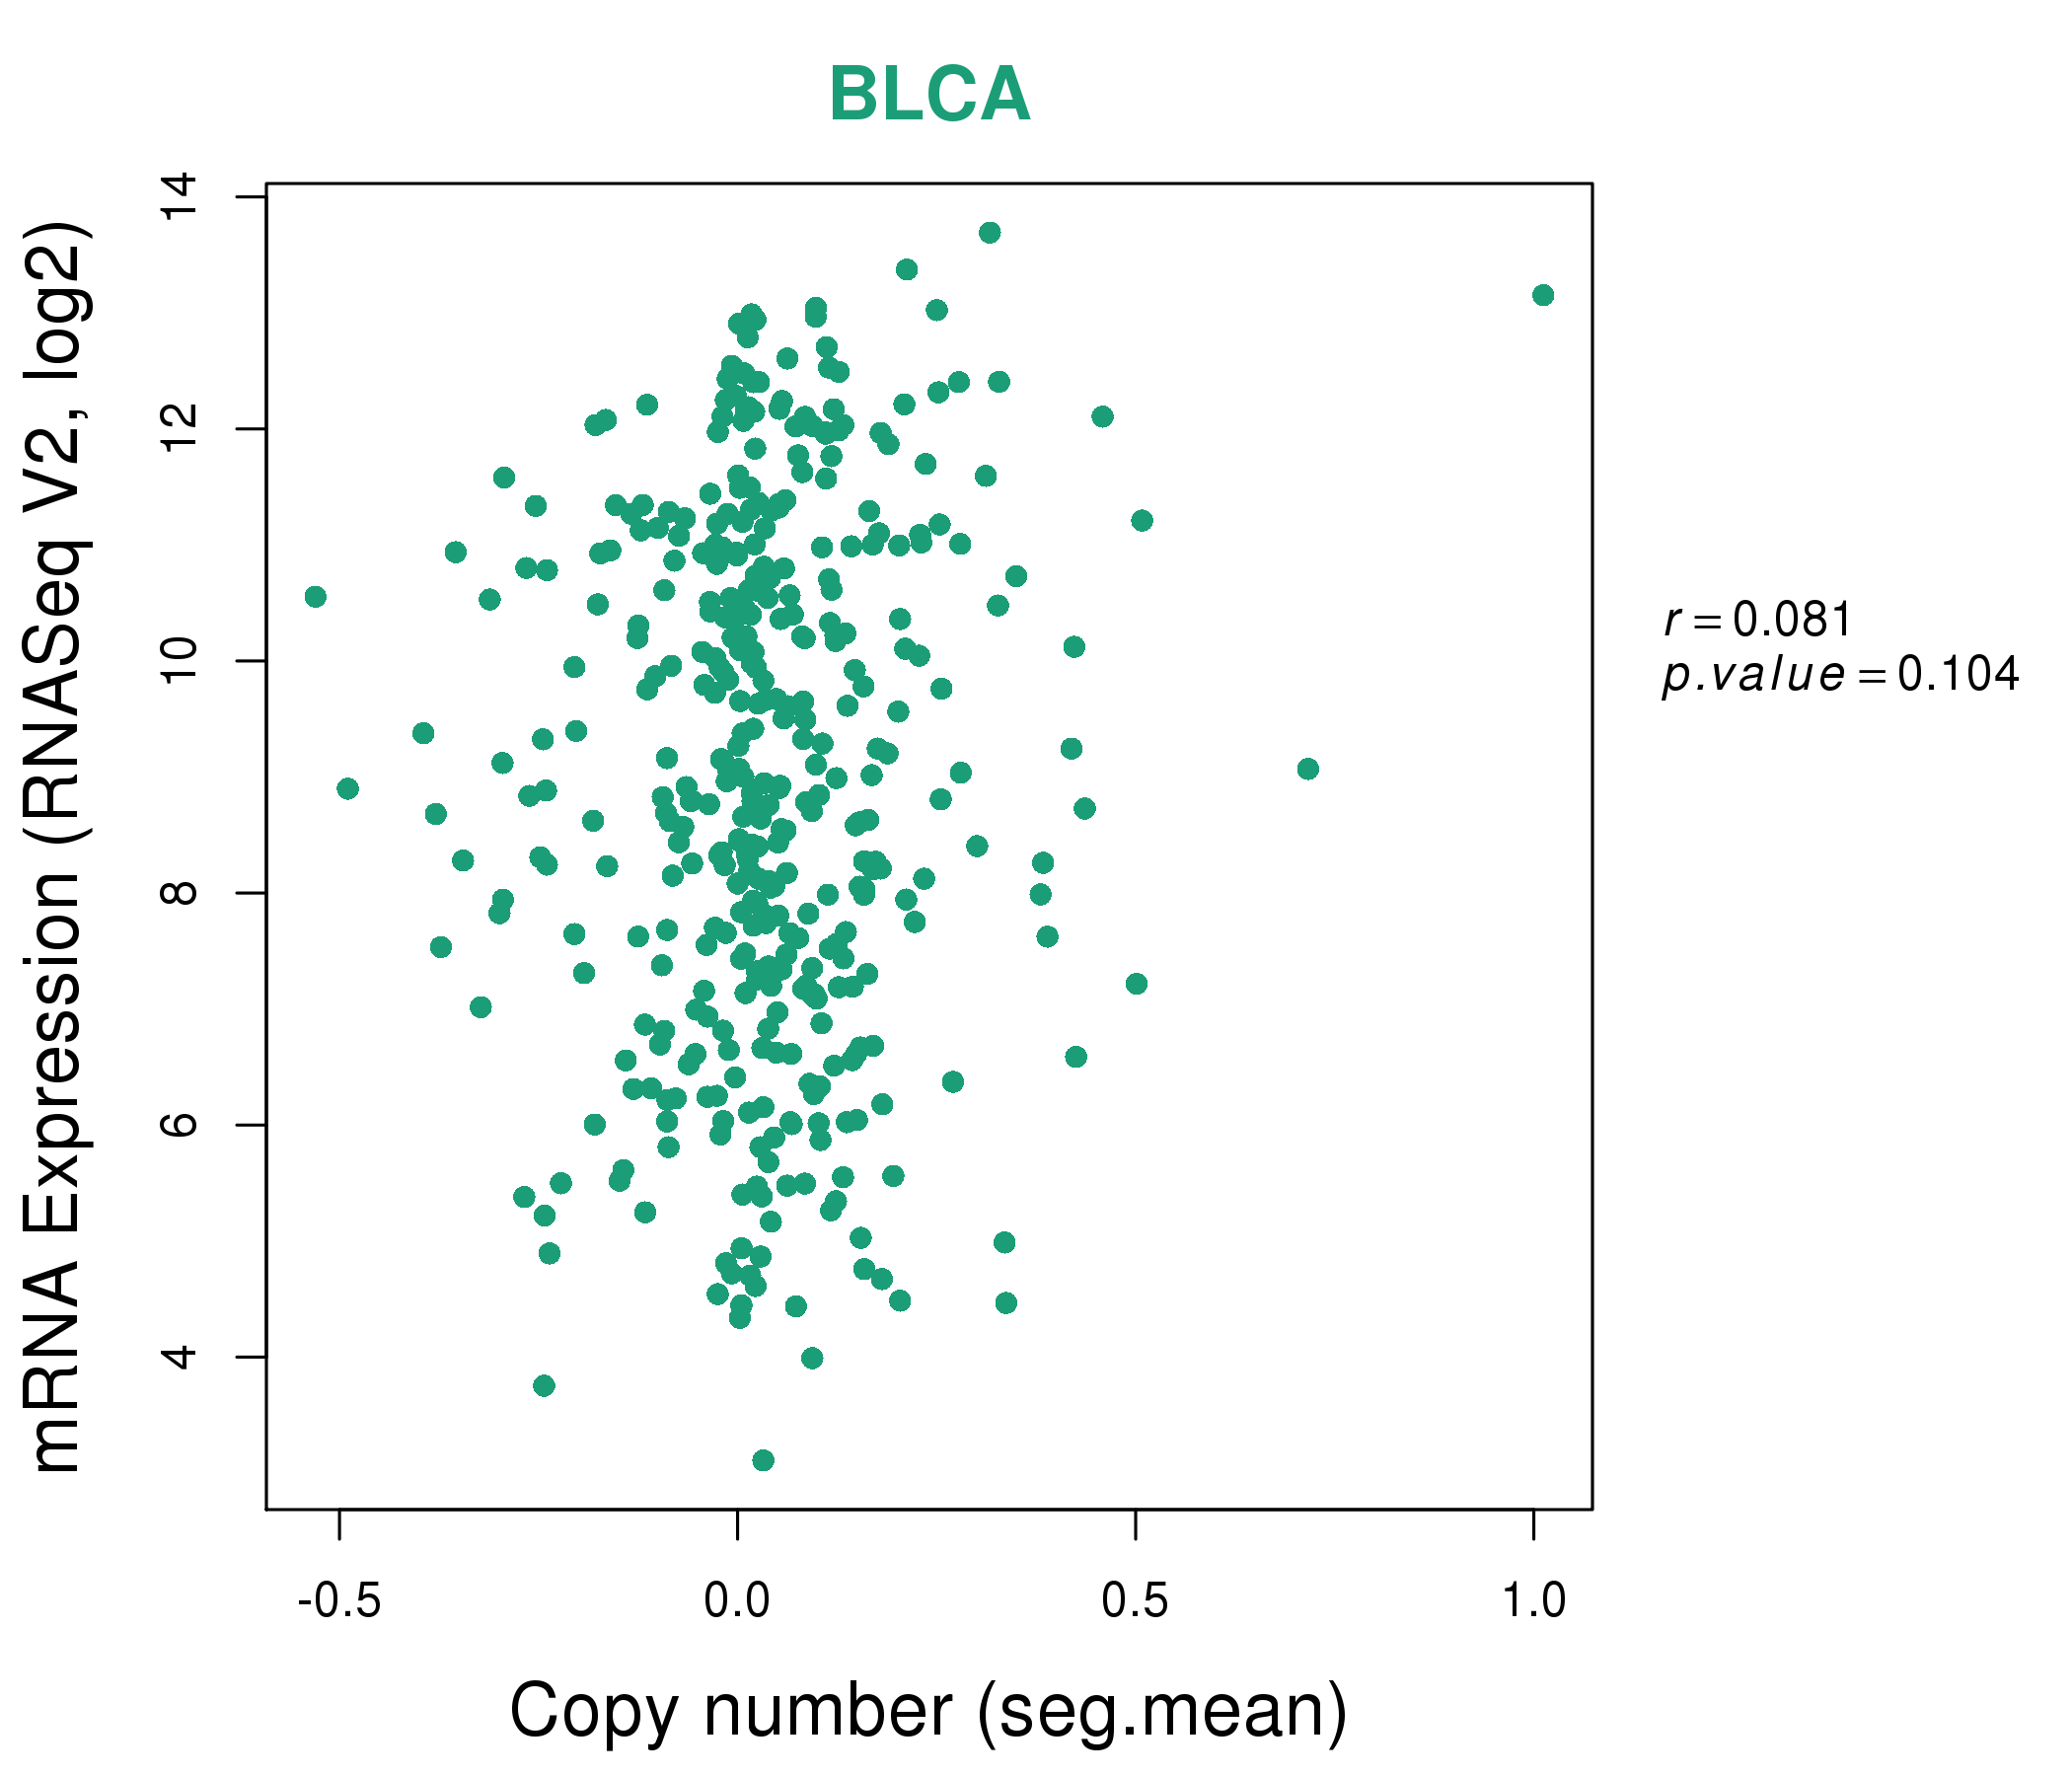
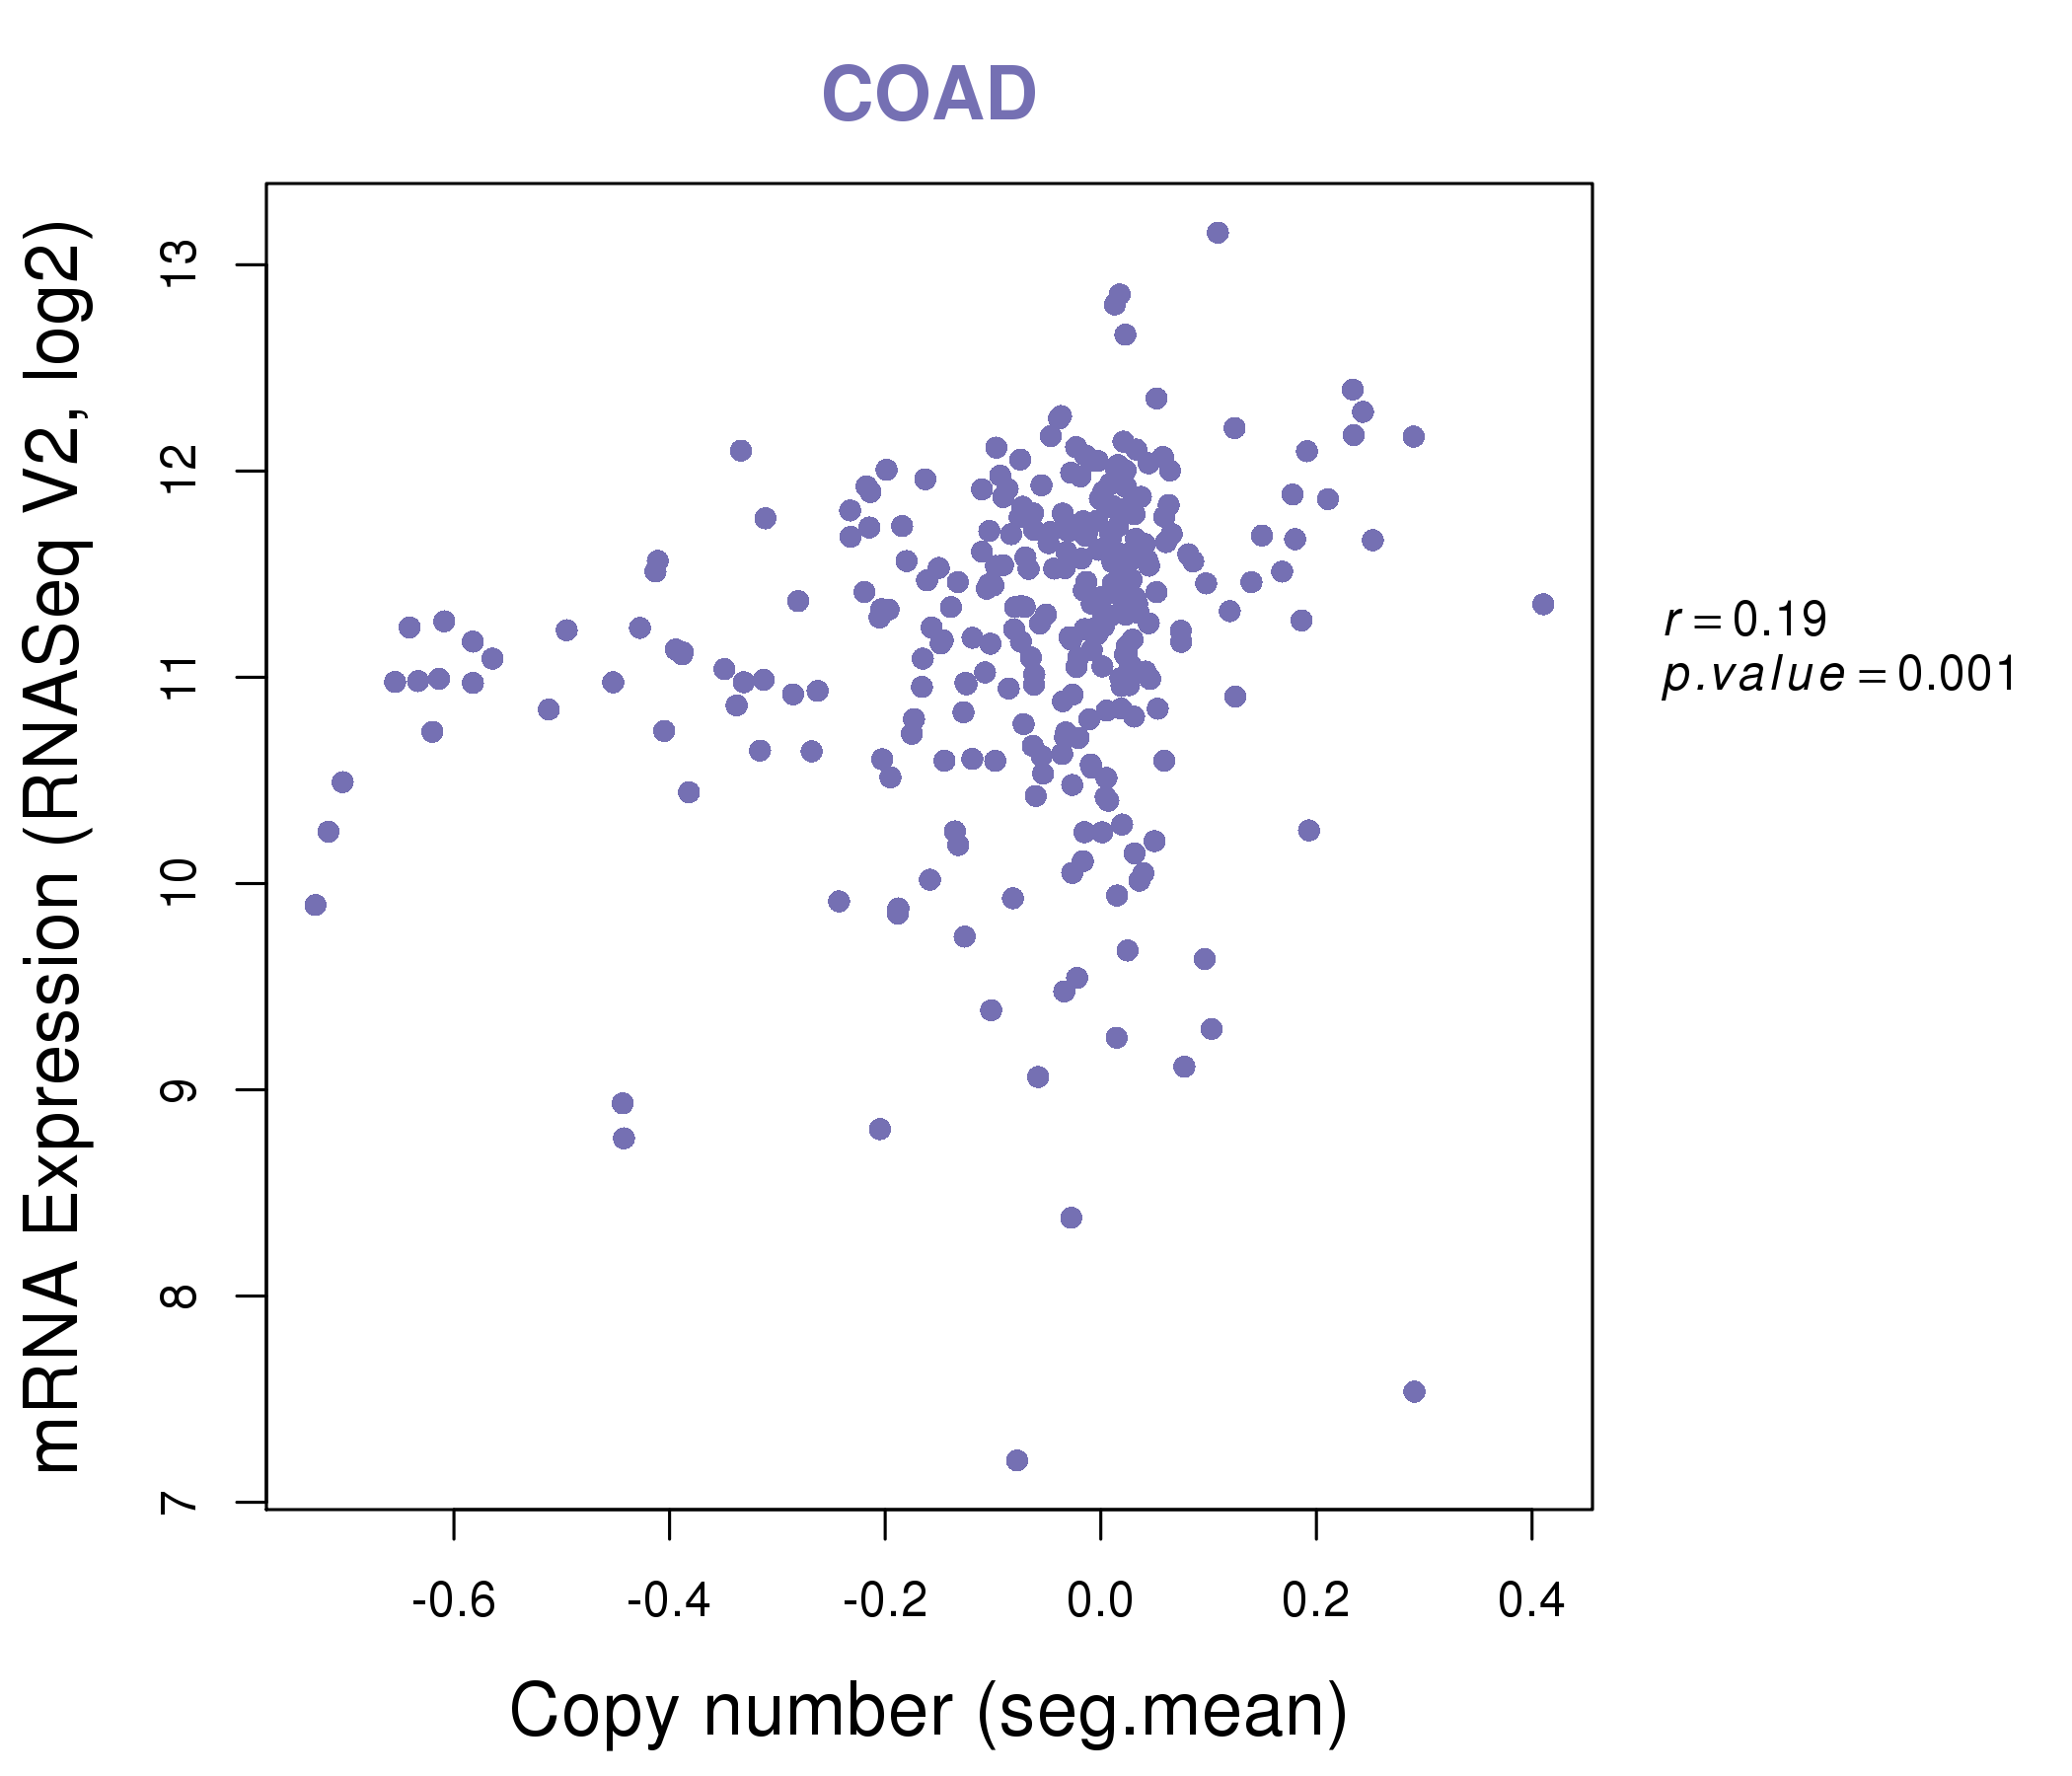
| * This plots show the correlation between CNV and gene expression. |
: Open all plots for all cancer types
 |
|
 |
|


| Top |
| Gene-Gene Network Information |
| * Co-Expression network figures were drawn using R package igraph. Only the top 20 genes with the highest correlations were shown. Red circle: input gene, orange circle: cell metabolism gene, sky circle: other gene |
: Open all plots for all cancer types
 |
| ||||
| B3GNT5,MSANTD3,CORO1C,YBX3,CSRP2,FERMT1,GPN1, IGF2BP2,KIAA1804,LDHB,MPP6,NIP7,ODC1,ORC1, SERBP1,SLC16A1,TAF4B,TEX10,WDR43,YEATS2,ZNF462 | BTBD1,MCU,CLCN4,COQ2,EPM2A,EYA4,FHL1, FILIP1,KIAA1161,KLHL31,KPNA3,KPNA4,LOC653653,NNT, NRD1,PRPH2,RHOBTB1,SLC16A1,TTL,WSB2,ZNF106 | ||||
 |
| ||||
| ALG6,CDH17,DPP4,EIF4E,FARSB,GNAI3,HSPA9, HSPD1,KDM1B,KRT26,LRRC8D,LYAR,LYZL1,MTFR1, SLC16A1,SLC35F2,SOD1,TMEM33,TOP1,UBE2V2,WDR3 | ACOX1,ADRA2A,AGFG2,AQP8,BTBD3,CEACAM7,RHOV___CHP1, NETO2,OPN3,PLOD2,PPARG,PTPRA,RTN3,SFXN1, SLC16A1,SLC26A2,STK38,TMEM65,UGT1A10,UGT1A8,WDR78 |


| * Co-Expression network figures were drawn using R package igraph. Only the top 20 genes with the highest correlations were shown. Red circle: input gene, orange circle: cell metabolism gene, sky circle: other gene |
: Open all plots for all cancer types
| Top |
: Open all interacting genes' information including KEGG pathway for all interacting genes from DAVID
| Top |
| Pharmacological Information for SLC16A1 |
| DB Category | DB Name | DB's ID and Url link |
| Chemistry | BindingDB | P53985; -. |
| Chemistry | ChEMBL | CHEMBL4360; -. |
| Organism-specific databases | PharmGKB | PA35813; -. |
| Organism-specific databases | CTD | 6566; -. |
| * Gene Centered Interaction Network. |
 |
| * Drug Centered Interaction Network. |
| DrugBank ID | Target Name | Drug Groups | Generic Name | Drug Centered Network | Drug Structure |
| DB00119 | solute carrier family 16, member 1 (monocarboxylic acid transporter 1) | approved; nutraceutical | Pyruvic acid | 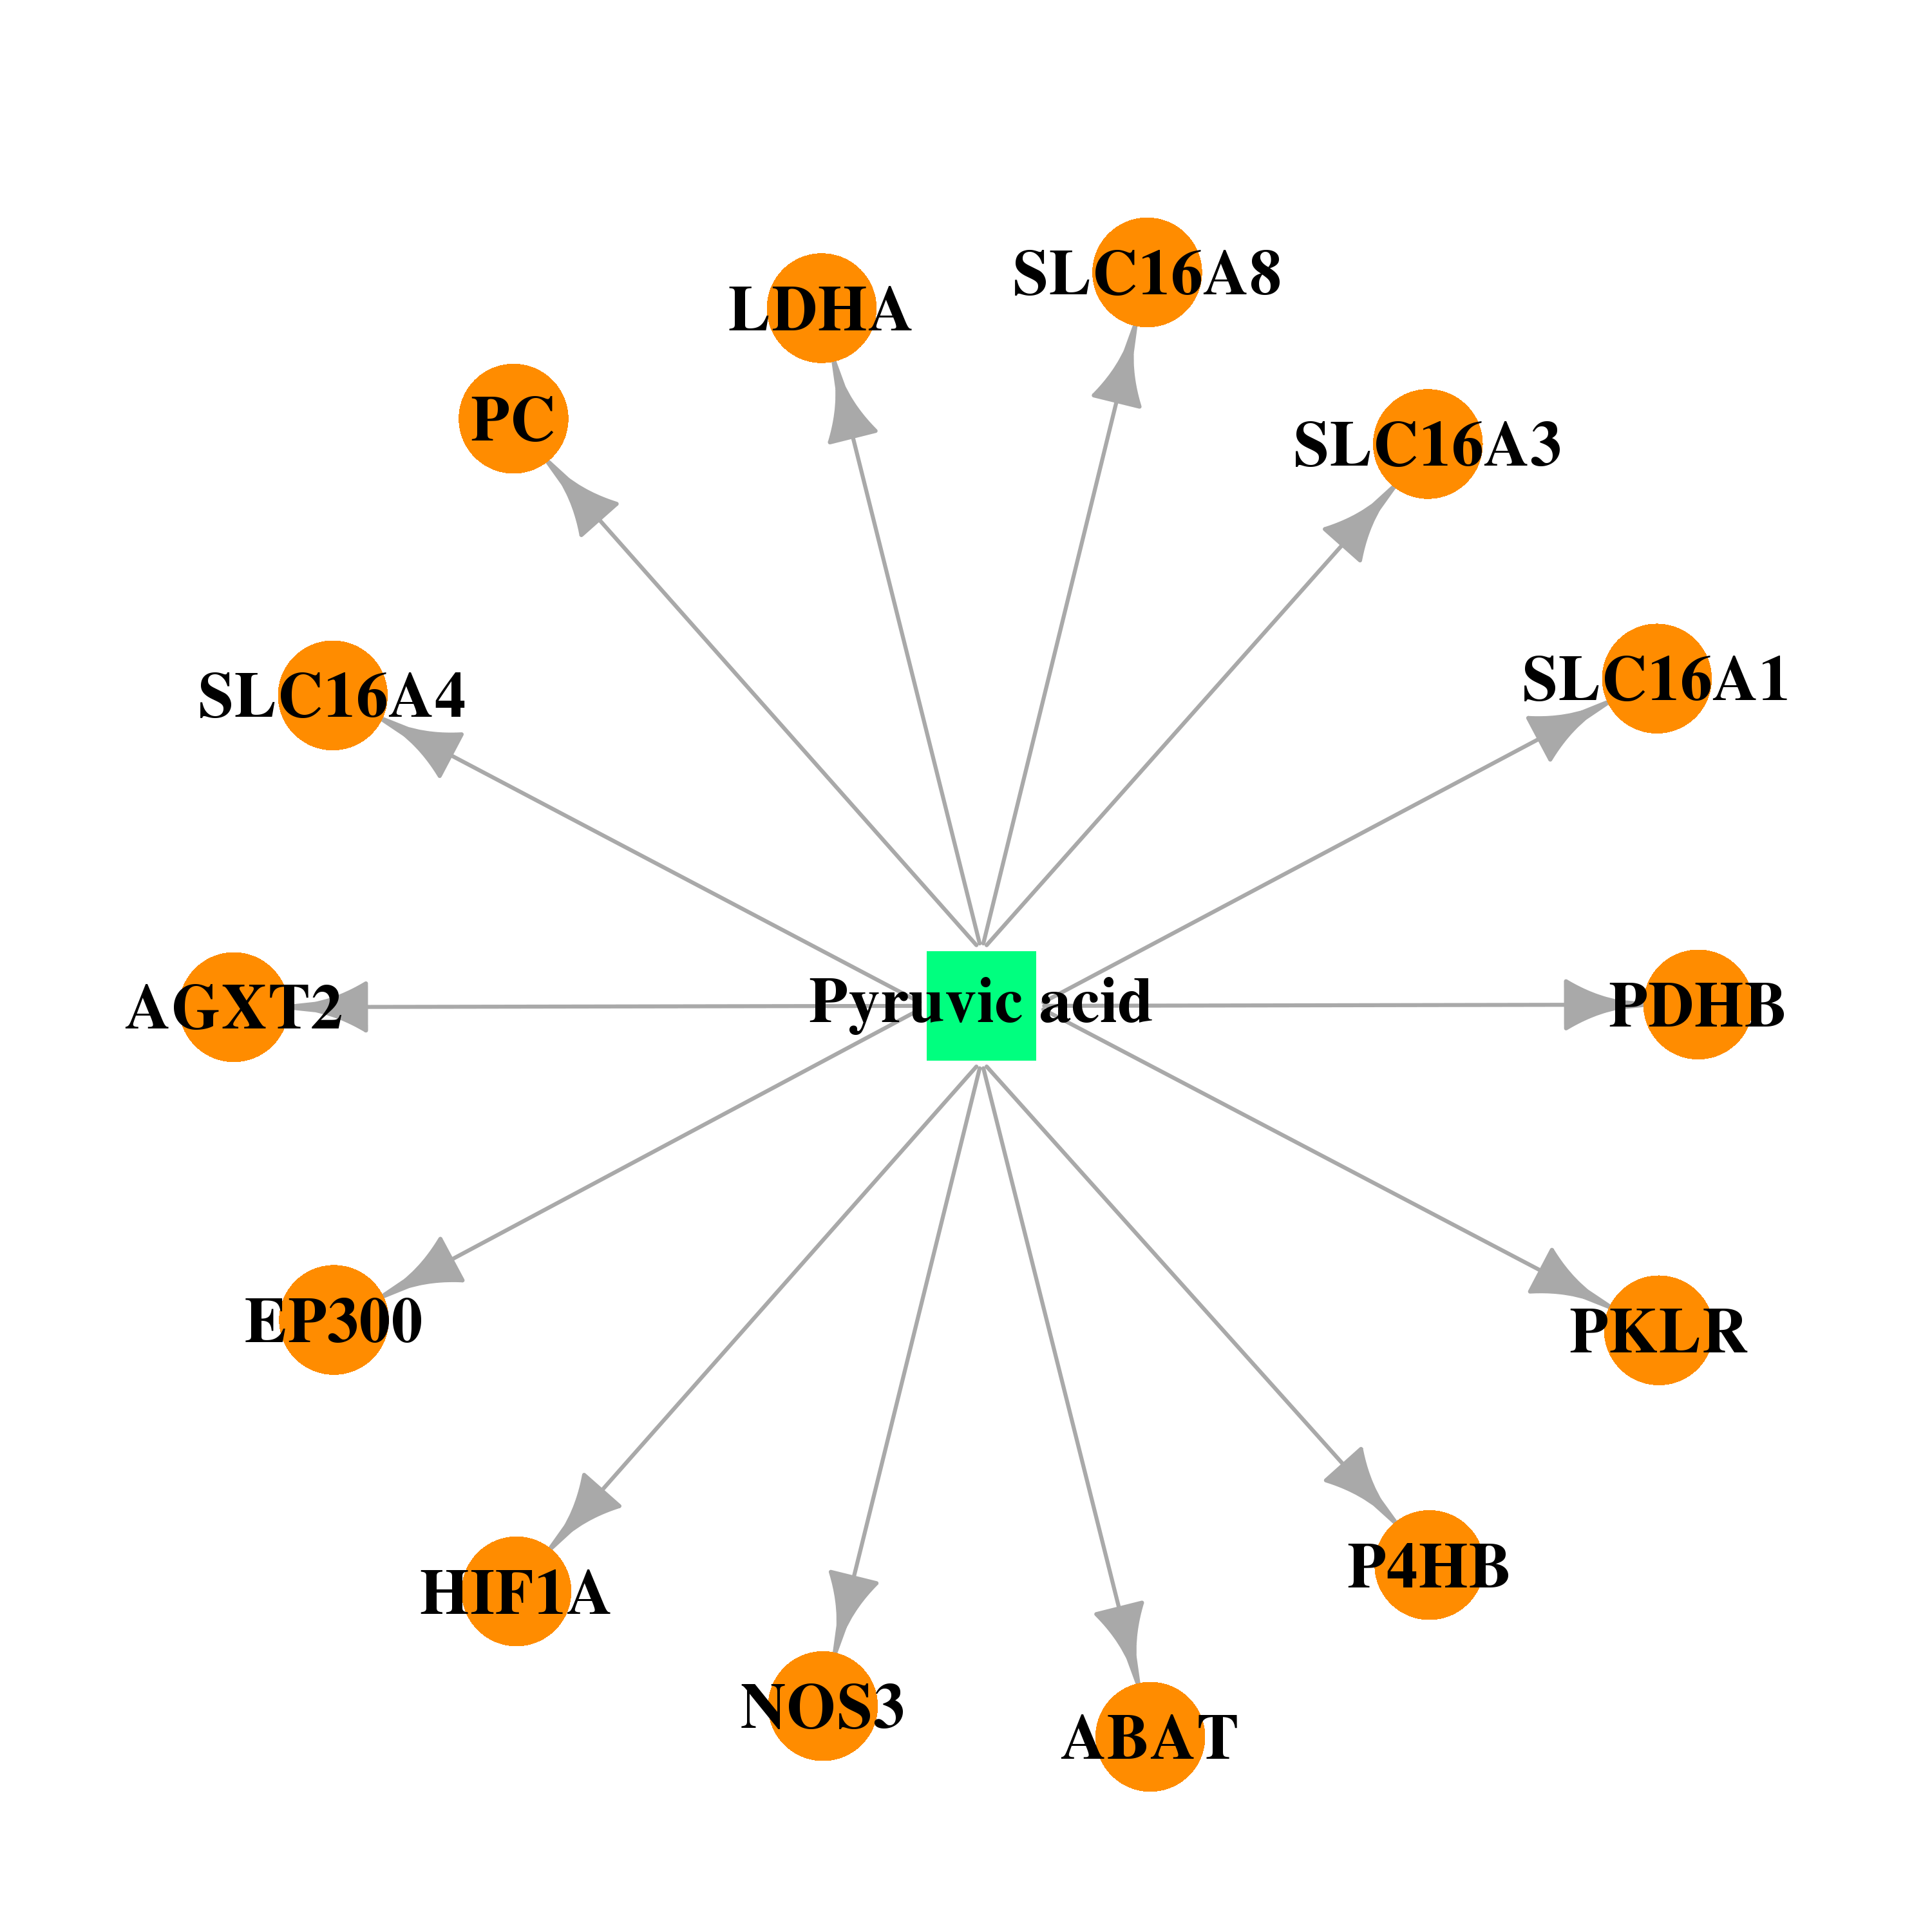 | 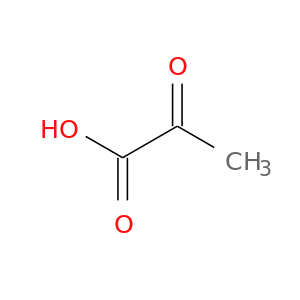 |
| Top |
| Cross referenced IDs for SLC16A1 |
| * We obtained these cross-references from Uniprot database. It covers 150 different DBs, 18 categories. http://www.uniprot.org/help/cross_references_section |
: Open all cross reference information
|
Copyright © 2016-Present - The Univsersity of Texas Health Science Center at Houston @ |