|
||||||||||||||||||||
| |
| Phenotypic Information (metabolism pathway, cancer, disease, phenome) |
| |
| |
| Gene-Gene Network Information: Co-Expression Network, Interacting Genes & KEGG |
| |
|


| Gene Summary for SLC25A1 |
| Basic gene info. | Gene symbol | SLC25A1 |
| Gene name | solute carrier family 25 (mitochondrial carrier; citrate transporter), member 1 | |
| Synonyms | CTP|D2L2AD|SEA|SLC20A3 | |
| Cytomap | UCSC genome browser: 22q11.21 | |
| Genomic location | chr22 :19163087-19166338 | |
| Type of gene | protein-coding | |
| RefGenes | NM_001256534.1, NM_001287387.1,NM_005984.4,NR_046298.2, | |
| Ensembl id | ENSG00000268928 | |
| Description | citrate transport proteinsolute carrier family 20 (mitochondrial citrate transporter), member 3tricarboxylate carrier proteintricarboxylate transport protein, mitochondrial | |
| Modification date | 20141207 | |
| dbXrefs | MIM : 190315 | |
| HGNC : HGNC | ||
| Ensembl : ENSG00000100075 | ||
| HPRD : 01832 | ||
| Vega : OTTHUMG00000150123 | ||
| Protein | UniProt: go to UniProt's Cross Reference DB Table | |
| Expression | CleanEX: HS_SLC25A1 | |
| BioGPS: 6576 | ||
| Gene Expression Atlas: ENSG00000268928 | ||
| The Human Protein Atlas: ENSG00000268928 | ||
| Pathway | NCI Pathway Interaction Database: SLC25A1 | |
| KEGG: SLC25A1 | ||
| REACTOME: SLC25A1 | ||
| ConsensusPathDB | ||
| Pathway Commons: SLC25A1 | ||
| Metabolism | MetaCyc: SLC25A1 | |
| HUMANCyc: SLC25A1 | ||
| Regulation | Ensembl's Regulation: ENSG00000268928 | |
| miRBase: chr22 :19,163,087-19,166,338 | ||
| TargetScan: NM_001256534 | ||
| cisRED: ENSG00000268928 | ||
| Context | iHOP: SLC25A1 | |
| cancer metabolism search in PubMed: SLC25A1 | ||
| UCL Cancer Institute: SLC25A1 | ||
| Assigned class in ccmGDB | C | |
| Top |
| Phenotypic Information for SLC25A1(metabolism pathway, cancer, disease, phenome) |
| Cancer | CGAP: SLC25A1 |
| Familial Cancer Database: SLC25A1 | |
| * This gene is included in those cancer gene databases. |
|
|
|
|
|
| . | ||||||||||||||
Oncogene 1 | Significant driver gene in | |||||||||||||||||||
| cf) number; DB name 1 Oncogene; http://nar.oxfordjournals.org/content/35/suppl_1/D721.long, 2 Tumor Suppressor gene; https://bioinfo.uth.edu/TSGene/, 3 Cancer Gene Census; http://www.nature.com/nrc/journal/v4/n3/abs/nrc1299.html, 4 CancerGenes; http://nar.oxfordjournals.org/content/35/suppl_1/D721.long, 5 Network of Cancer Gene; http://ncg.kcl.ac.uk/index.php, 1Therapeutic Vulnerabilities in Cancer; http://cbio.mskcc.org/cancergenomics/statius/ |
| REACTOME_METABOLISM_OF_LIPIDS_AND_LIPOPROTEINS REACTOME_METABOLISM_OF_CARBOHYDRATES REACTOME_GLUCOSE_METABOLISM | |
| Mutations for SLC25A1 |
| * Under tables are showing count per each tissue to give us broad intuition about tissue specific mutation patterns.You can go to the detailed page for each mutation database's web site. |
| There's no structural variation information in COSMIC data for this gene. |
| * From mRNA Sanger sequences, Chitars2.0 arranged chimeric transcripts. This table shows SLC25A1 related fusion information. |
| ID | Head Gene | Tail Gene | Accession | Gene_a | qStart_a | qEnd_a | Chromosome_a | tStart_a | tEnd_a | Gene_a | qStart_a | qEnd_a | Chromosome_a | tStart_a | tEnd_a |
| D16945 | SLC25A1 | 1 | 162 | 22 | 19164171 | 19164653 | HSPA13 | 159 | 405 | 21 | 15743529 | 15743768 | |
| CD614306 | JUN | 14 | 431 | 1 | 59249297 | 59249716 | SLC25A1 | 428 | 639 | 22 | 19164999 | 19165212 | |
| CD614310 | SLC25A1 | 1 | 347 | 22 | 19164999 | 19165347 | JUN | 344 | 691 | 1 | 59249365 | 59249716 | |
| CD614312 | JUN | 16 | 435 | 1 | 59249297 | 59249716 | SLC25A1 | 432 | 696 | 22 | 19164999 | 19165266 | |
| CD614307 | JUN | 15 | 434 | 1 | 59249297 | 59249716 | SLC25A1 | 431 | 714 | 22 | 19164999 | 19165289 | |
| BC016877 | CBL | 11 | 2128 | 11 | 119175363 | 119177480 | SLC25A1 | 2128 | 3100 | 22 | 19163094 | 19164441 | |
| CD614308 | SLC25A1 | 1 | 339 | 22 | 19164999 | 19165339 | JUN | 336 | 659 | 1 | 59249388 | 59249716 | |
| AA086119 | PLXNB1 | 29 | 168 | 3 | 48445291 | 48445430 | SLC25A1 | 169 | 472 | 22 | 19163746 | 19164455 | |
| CD614309 | JUN | 15 | 434 | 1 | 59249297 | 59249716 | SLC25A1 | 431 | 719 | 22 | 19164999 | 19165289 | |
| AI394736 | SLC25A1 | 10 | 129 | 22 | 19163094 | 19163213 | FMNL3 | 126 | 427 | 12 | 50069340 | 50069641 | |
| CD614314 | JUN | 13 | 433 | 1 | 59249297 | 59249716 | SLC25A1 | 430 | 654 | 22 | 19164999 | 19165288 | |
| CD614313 | SLC25A1 | 1 | 348 | 22 | 19164999 | 19165347 | JUN | 345 | 612 | 1 | 59249452 | 59249716 | |
| CA427923 | SLC25A1 | 40 | 280 | 22 | 19163483 | 19163722 | SLC25A1 | 273 | 587 | 22 | 19164105 | 19165262 | |
| Top |
| There's no copy number variation information in COSMIC data for this gene. |
| Top |
|
 |
| Top |
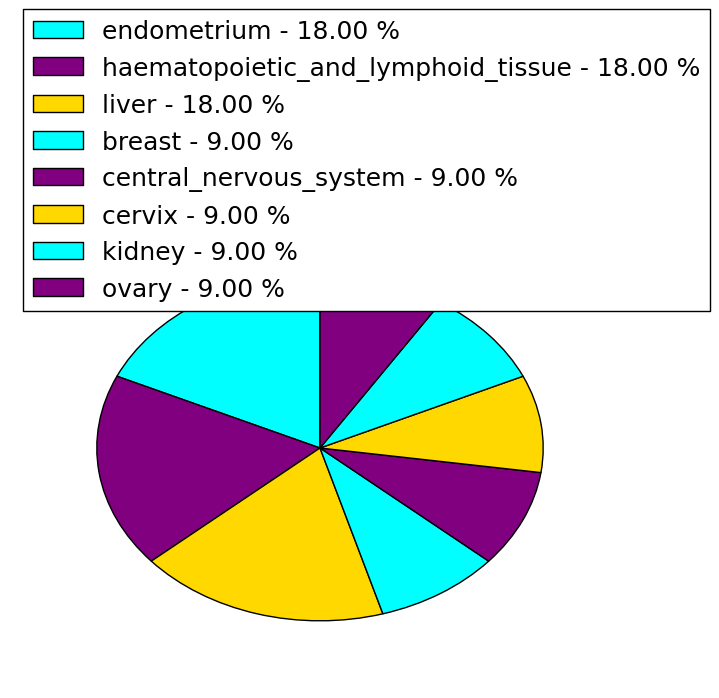
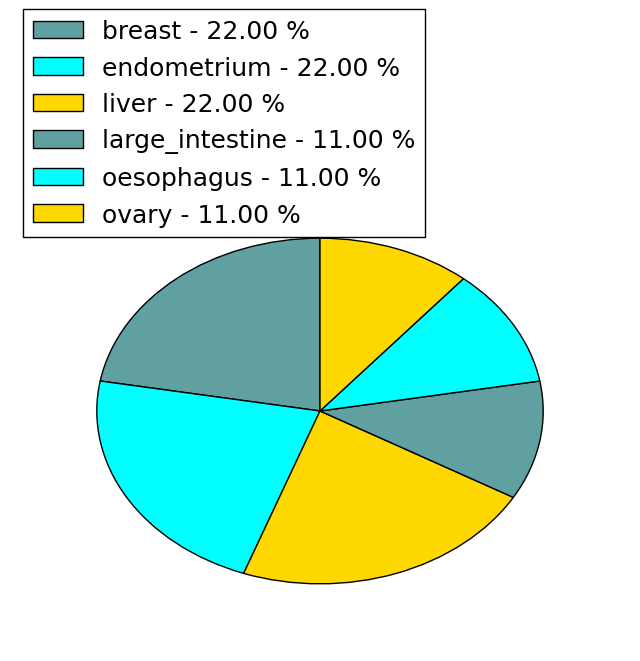
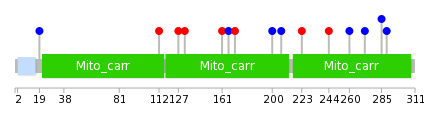
| Stat. for Non-Synonymous SNVs (# total SNVs=11) | (# total SNVs=9) |
 |  |
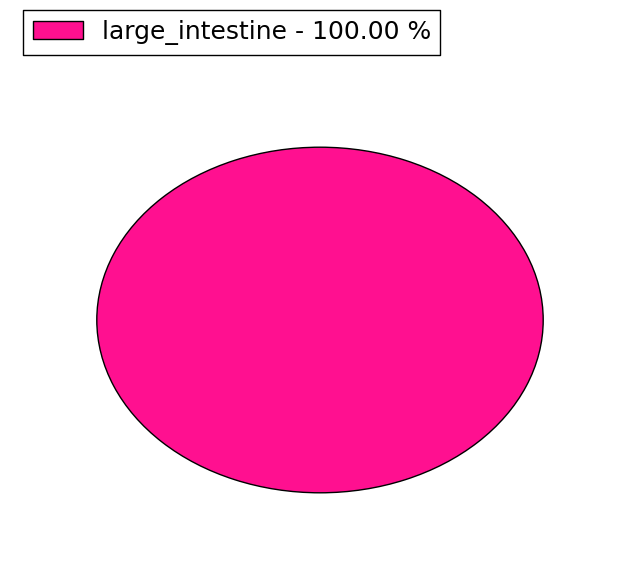
(# total SNVs=1) | (# total SNVs=0) |
 |
| Top |
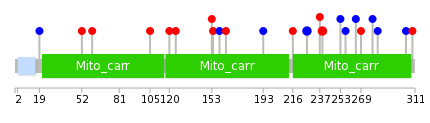
| * When you move the cursor on each content, you can see more deailed mutation information on the Tooltip. Those are primary_site,primary_histology,mutation(aa),pubmedID. |
| GRCh37 position | Mutation(aa) | Unique sampleID count |
| chr22:19164123-19164123 | p.T239S | 2 |
| chr22:19164157-19164157 | p.G227G | 2 |
| chr22:19163996-19163996 | p.A253A | 1 |
| chr22:19165323-19165323 | p.D120N | 1 |
| chr22:19165368-19165368 | p.F105L | 1 |
| chr22:19164129-19164129 | p.G237R | 1 |
| chr22:19165669-19165669 | p.H60P | 1 |
| chr22:19165692-19165692 | p.Q52H | 1 |
| chr22:19163654-19163654 | p.K309E | 1 |
| chr22:19164192-19164192 | p.K216Q | 1 |
| Top |
|
 |
| Point Mutation/ Tissue ID | 1 | 2 | 3 | 4 | 5 | 6 | 7 | 8 | 9 | 10 | 11 | 12 | 13 | 14 | 15 | 16 | 17 | 18 | 19 | 20 |
| # sample | 1 | 1 | 1 | 1 | 1 | 1 | 1 | 2 | 4 | |||||||||||
| # mutation | 1 | 2 | 1 | 1 | 1 | 1 | 1 | 2 | 4 | |||||||||||
| nonsynonymous SNV | 1 | 1 | 1 | 1 | 2 | |||||||||||||||
| synonymous SNV | 1 | 1 | 1 | 1 | 1 | 1 | 2 |
| cf) Tissue ID; Tissue type (1; BLCA[Bladder Urothelial Carcinoma], 2; BRCA[Breast invasive carcinoma], 3; CESC[Cervical squamous cell carcinoma and endocervical adenocarcinoma], 4; COAD[Colon adenocarcinoma], 5; GBM[Glioblastoma multiforme], 6; Glioma Low Grade, 7; HNSC[Head and Neck squamous cell carcinoma], 8; KICH[Kidney Chromophobe], 9; KIRC[Kidney renal clear cell carcinoma], 10; KIRP[Kidney renal papillary cell carcinoma], 11; LAML[Acute Myeloid Leukemia], 12; LUAD[Lung adenocarcinoma], 13; LUSC[Lung squamous cell carcinoma], 14; OV[Ovarian serous cystadenocarcinoma ], 15; PAAD[Pancreatic adenocarcinoma], 16; PRAD[Prostate adenocarcinoma], 17; SKCM[Skin Cutaneous Melanoma], 18:STAD[Stomach adenocarcinoma], 19:THCA[Thyroid carcinoma], 20:UCEC[Uterine Corpus Endometrial Carcinoma]) |
| Top |
| * We represented just top 10 SNVs. When you move the cursor on each content, you can see more deailed mutation information on the Tooltip. Those are primary_site, primary_histology, mutation(aa), pubmedID. |
| Genomic Position | Mutation(aa) | Unique sampleID count |
| chr22:19164411 | p.A260A,SLC25A1 | 1 |
| chr22:19164667 | p.G244R,SLC25A1 | 1 |
| chr22:19164682 | p.K223Q,SLC25A1 | 1 |
| chr22:19164697 | p.F207F,SLC25A1 | 1 |
| chr22:19163733 | p.S200S,SLC25A1 | 1 |
| chr22:19165307 | p.F171L,SLC25A1 | 1 |
| chr22:19163745 | p.P166P,SLC25A1 | 1 |
| chr22:19165323 | p.Q161H,SLC25A1 | 1 |
| chr22:19163960 | p.L132P,SLC25A1 | 1 |
| chr22:19165368 | p.D127N,SLC25A1 | 1 |
| * Copy number data were extracted from TCGA using R package TCGA-Assembler. The URLs of all public data files on TCGA DCC data server were gathered on Jan-05-2015. Function ProcessCNAData in TCGA-Assembler package was used to obtain gene-level copy number value which is calculated as the average copy number of the genomic region of a gene. |
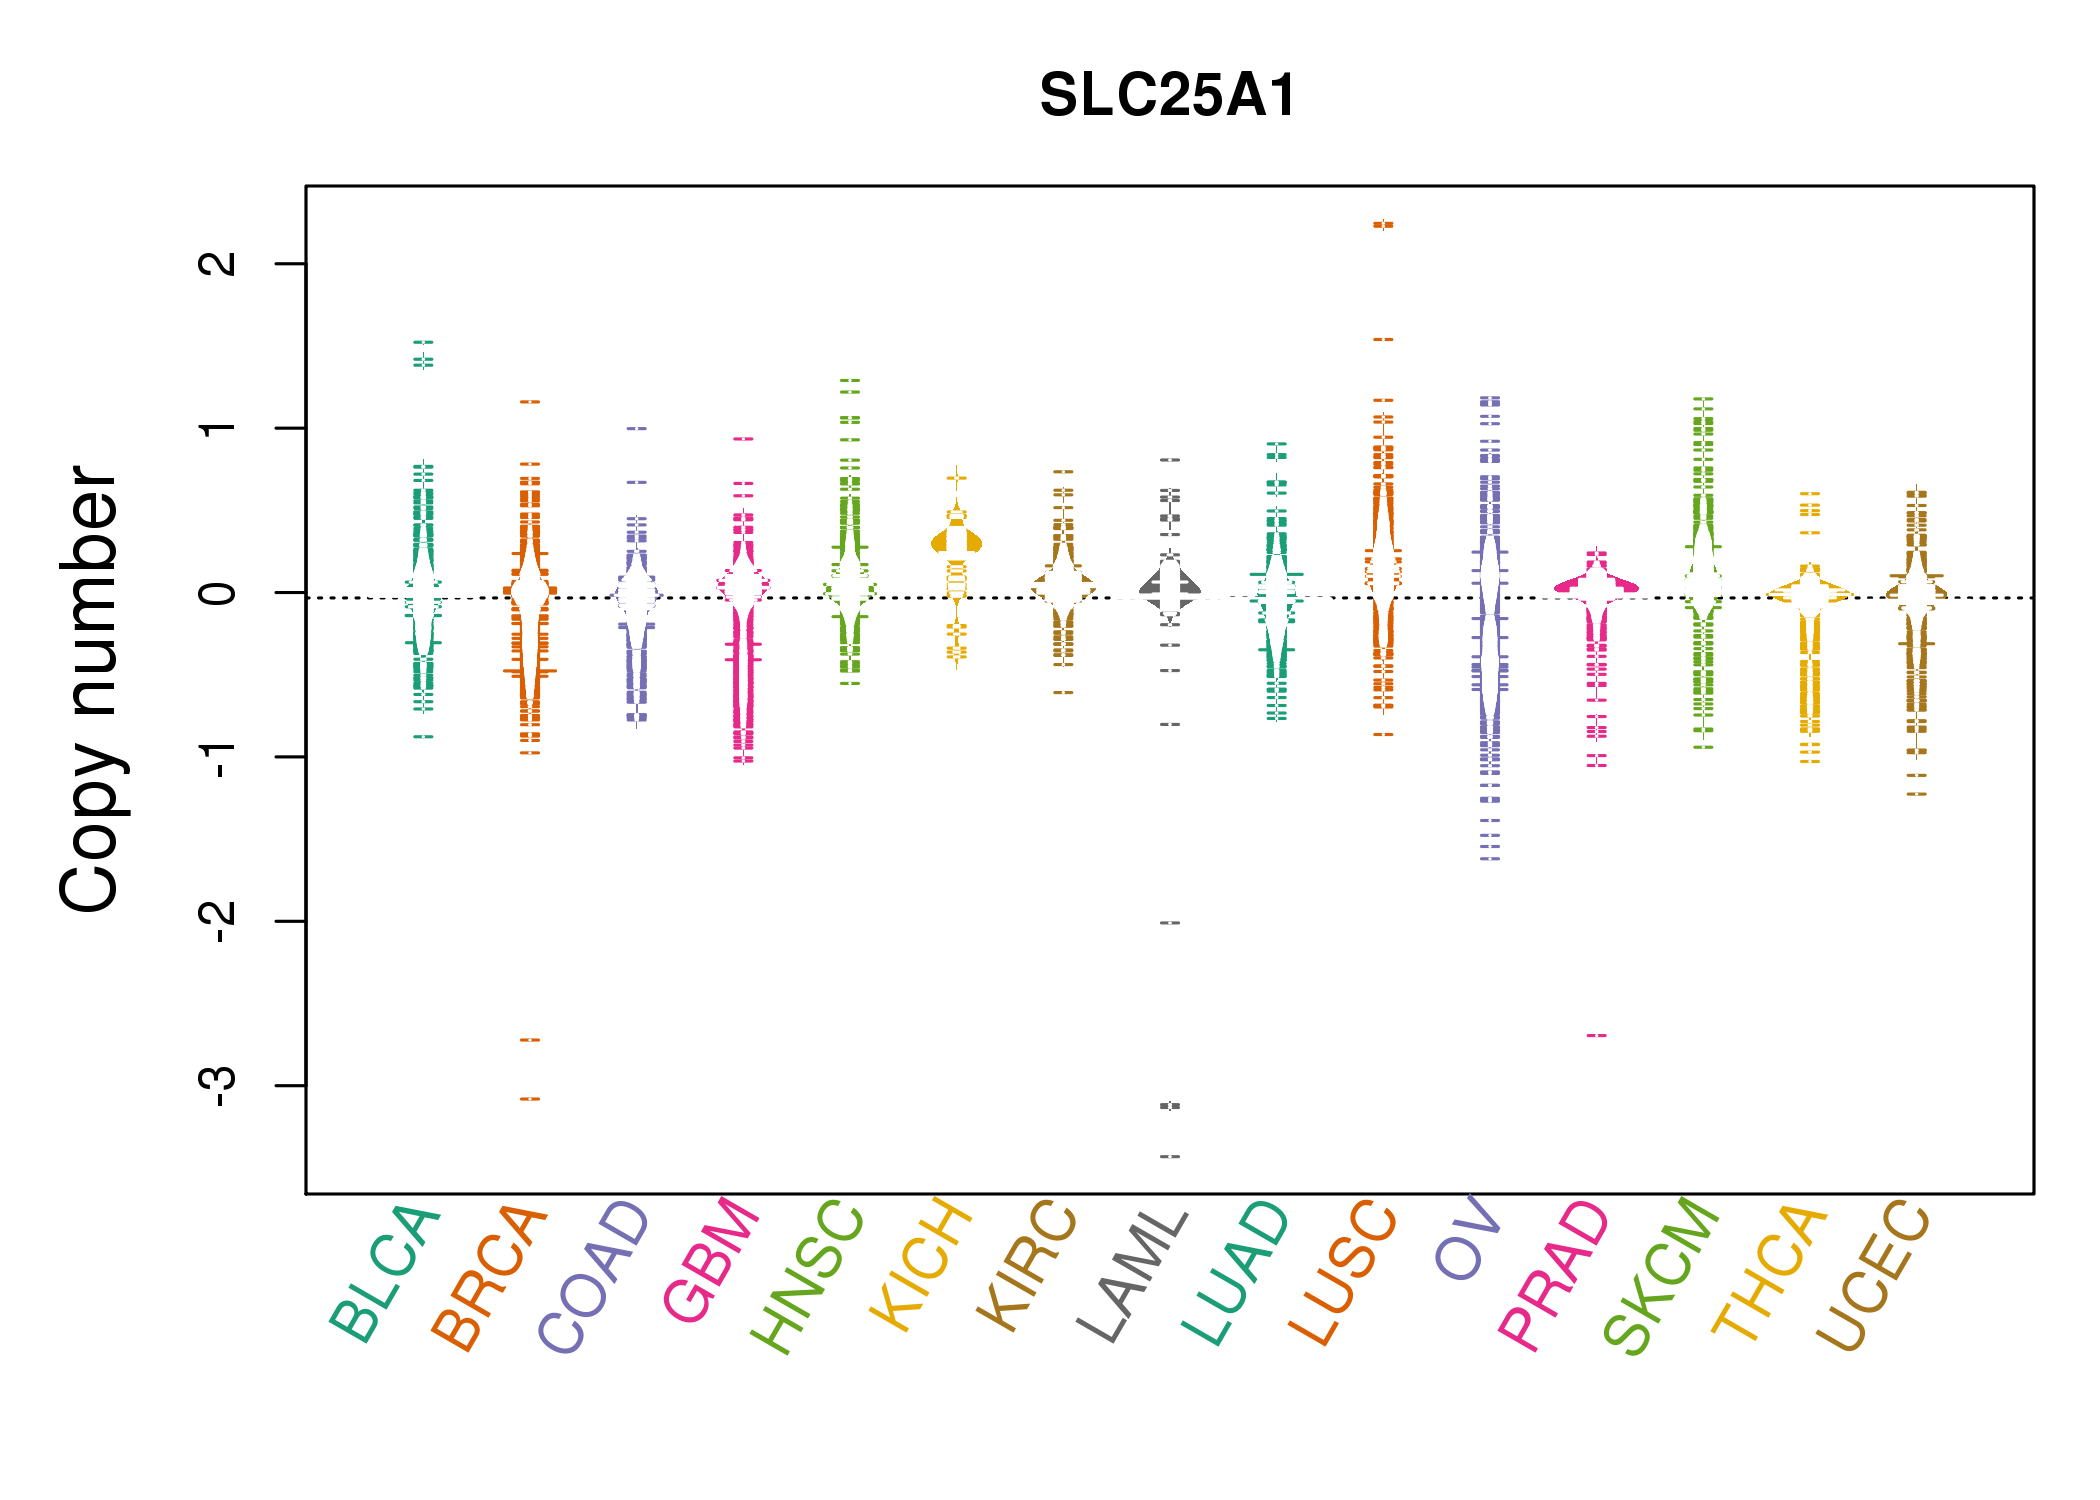 |
| cf) Tissue ID[Tissue type]: BLCA[Bladder Urothelial Carcinoma], BRCA[Breast invasive carcinoma], CESC[Cervical squamous cell carcinoma and endocervical adenocarcinoma], COAD[Colon adenocarcinoma], GBM[Glioblastoma multiforme], Glioma Low Grade, HNSC[Head and Neck squamous cell carcinoma], KICH[Kidney Chromophobe], KIRC[Kidney renal clear cell carcinoma], KIRP[Kidney renal papillary cell carcinoma], LAML[Acute Myeloid Leukemia], LUAD[Lung adenocarcinoma], LUSC[Lung squamous cell carcinoma], OV[Ovarian serous cystadenocarcinoma ], PAAD[Pancreatic adenocarcinoma], PRAD[Prostate adenocarcinoma], SKCM[Skin Cutaneous Melanoma], STAD[Stomach adenocarcinoma], THCA[Thyroid carcinoma], UCEC[Uterine Corpus Endometrial Carcinoma] |
| Top |
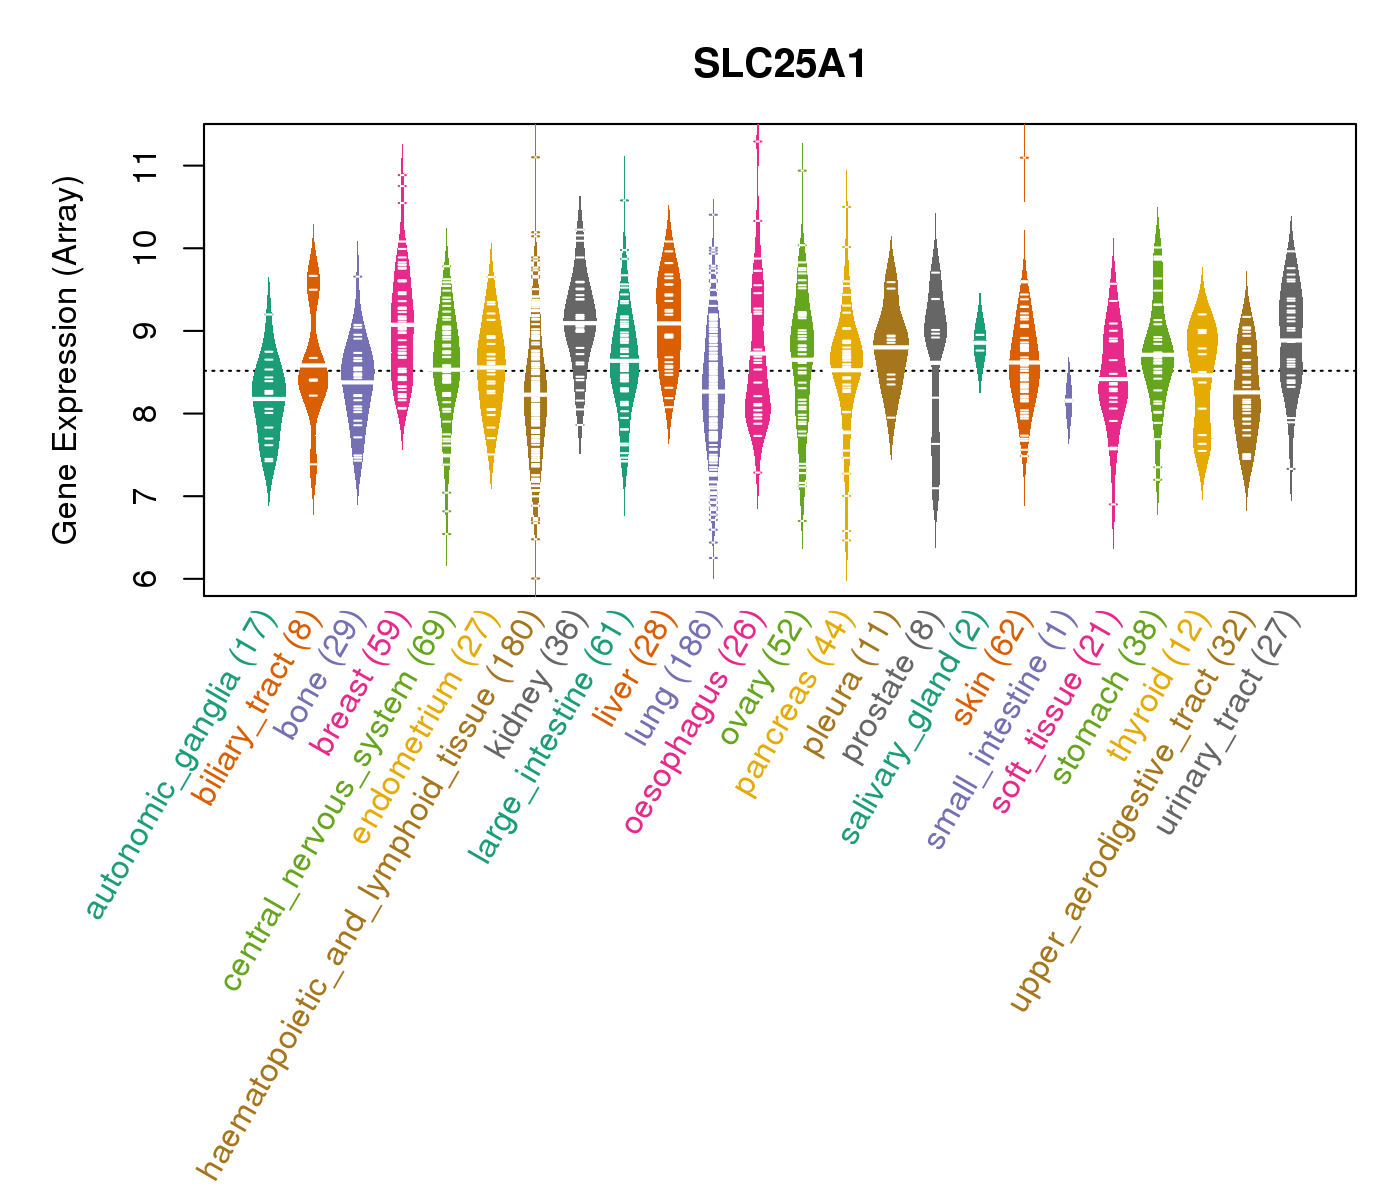
| Gene Expression for SLC25A1 |
| * CCLE gene expression data were extracted from CCLE_Expression_Entrez_2012-10-18.res: Gene-centric RMA-normalized mRNA expression data. |
 |
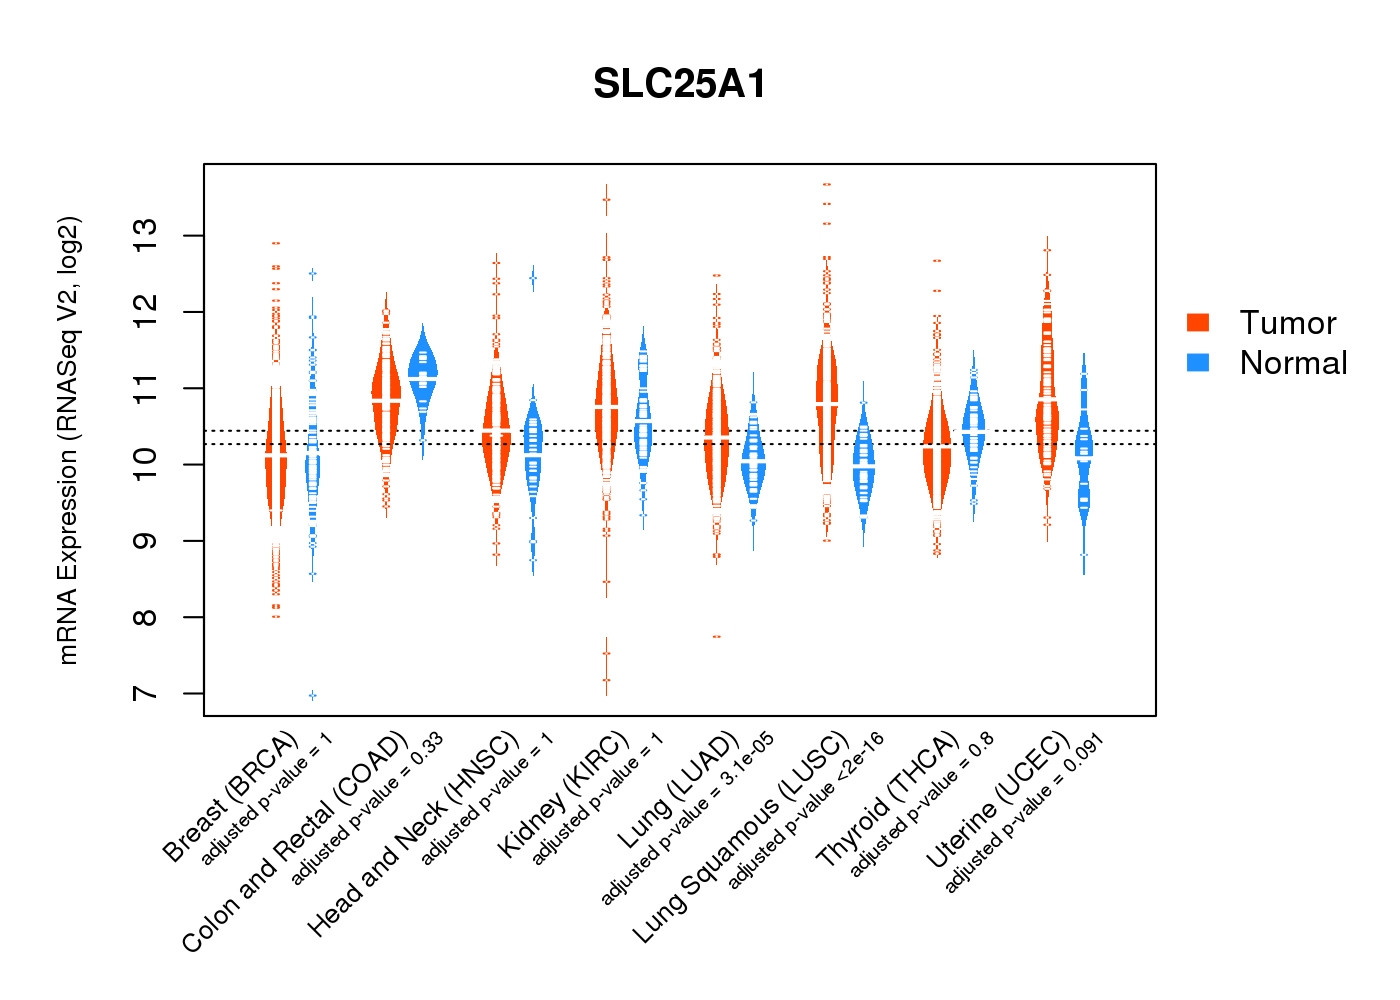
| * Normalized gene expression data of RNASeqV2 was extracted from TCGA using R package TCGA-Assembler. The URLs of all public data files on TCGA DCC data server were gathered at Jan-05-2015. Only eight cancer types have enough normal control samples for differential expression analysis. (t test, adjusted p<0.05 (using Benjamini-Hochberg FDR)) |
 |
| Top |
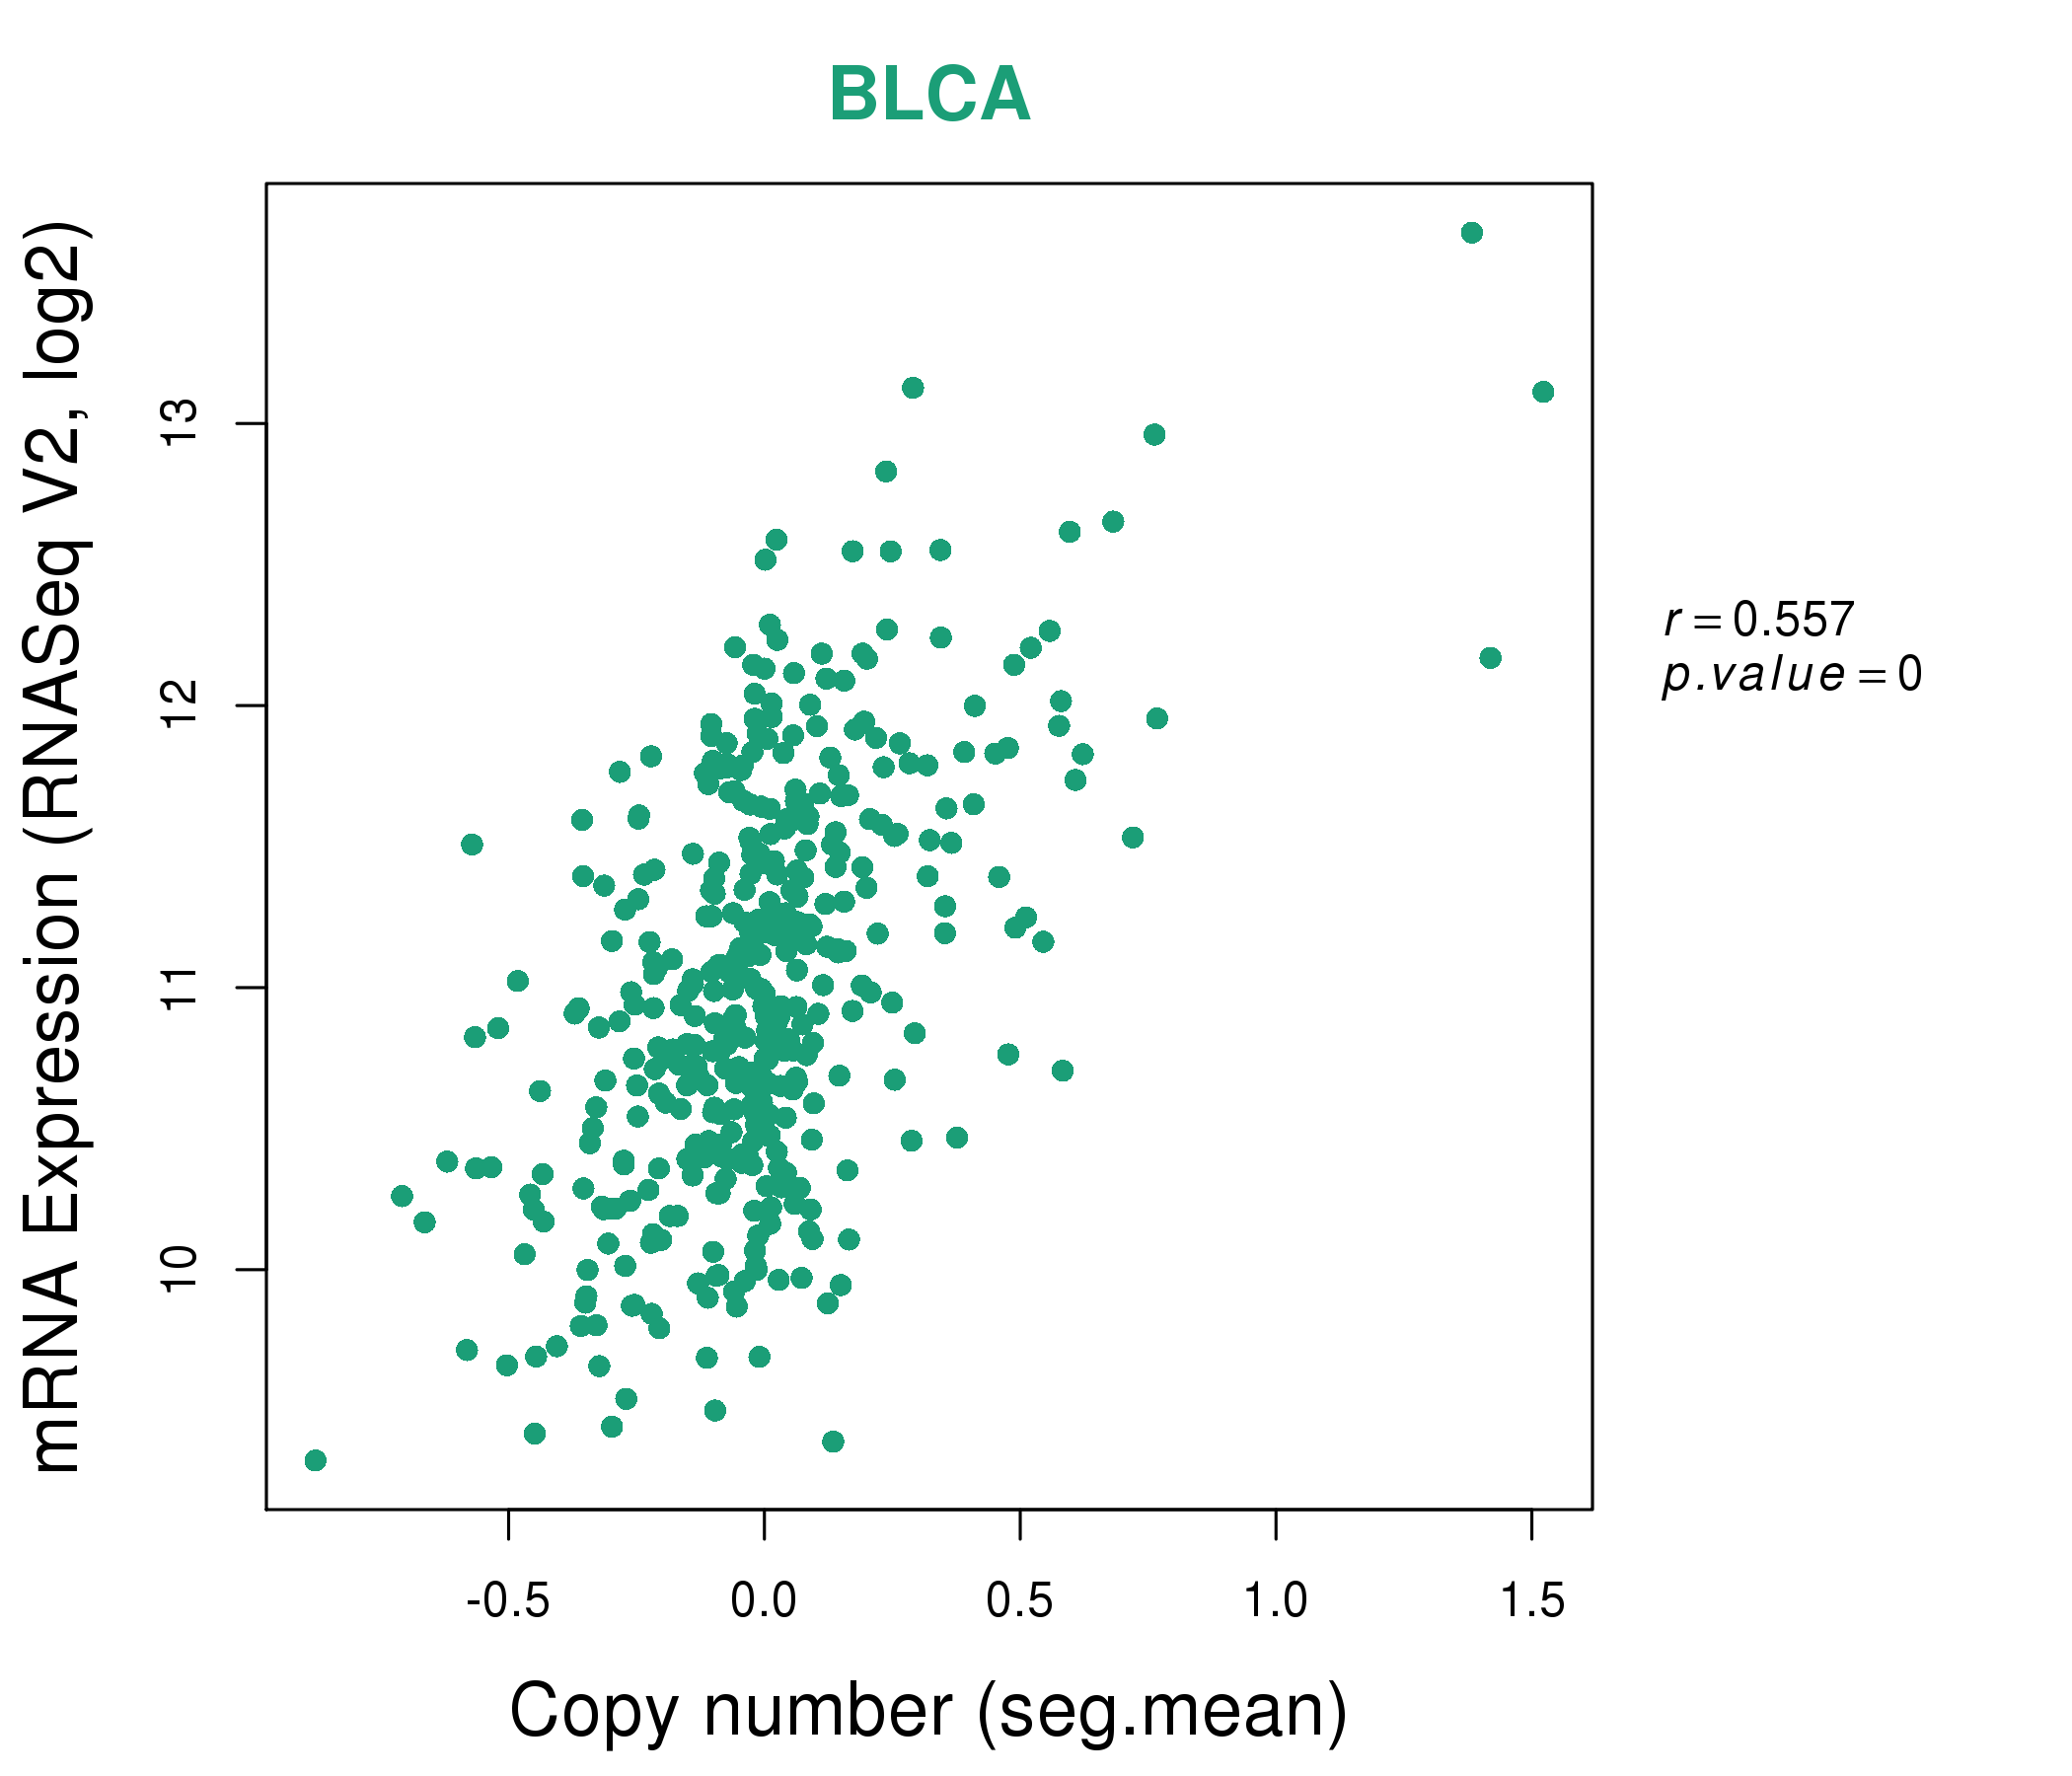
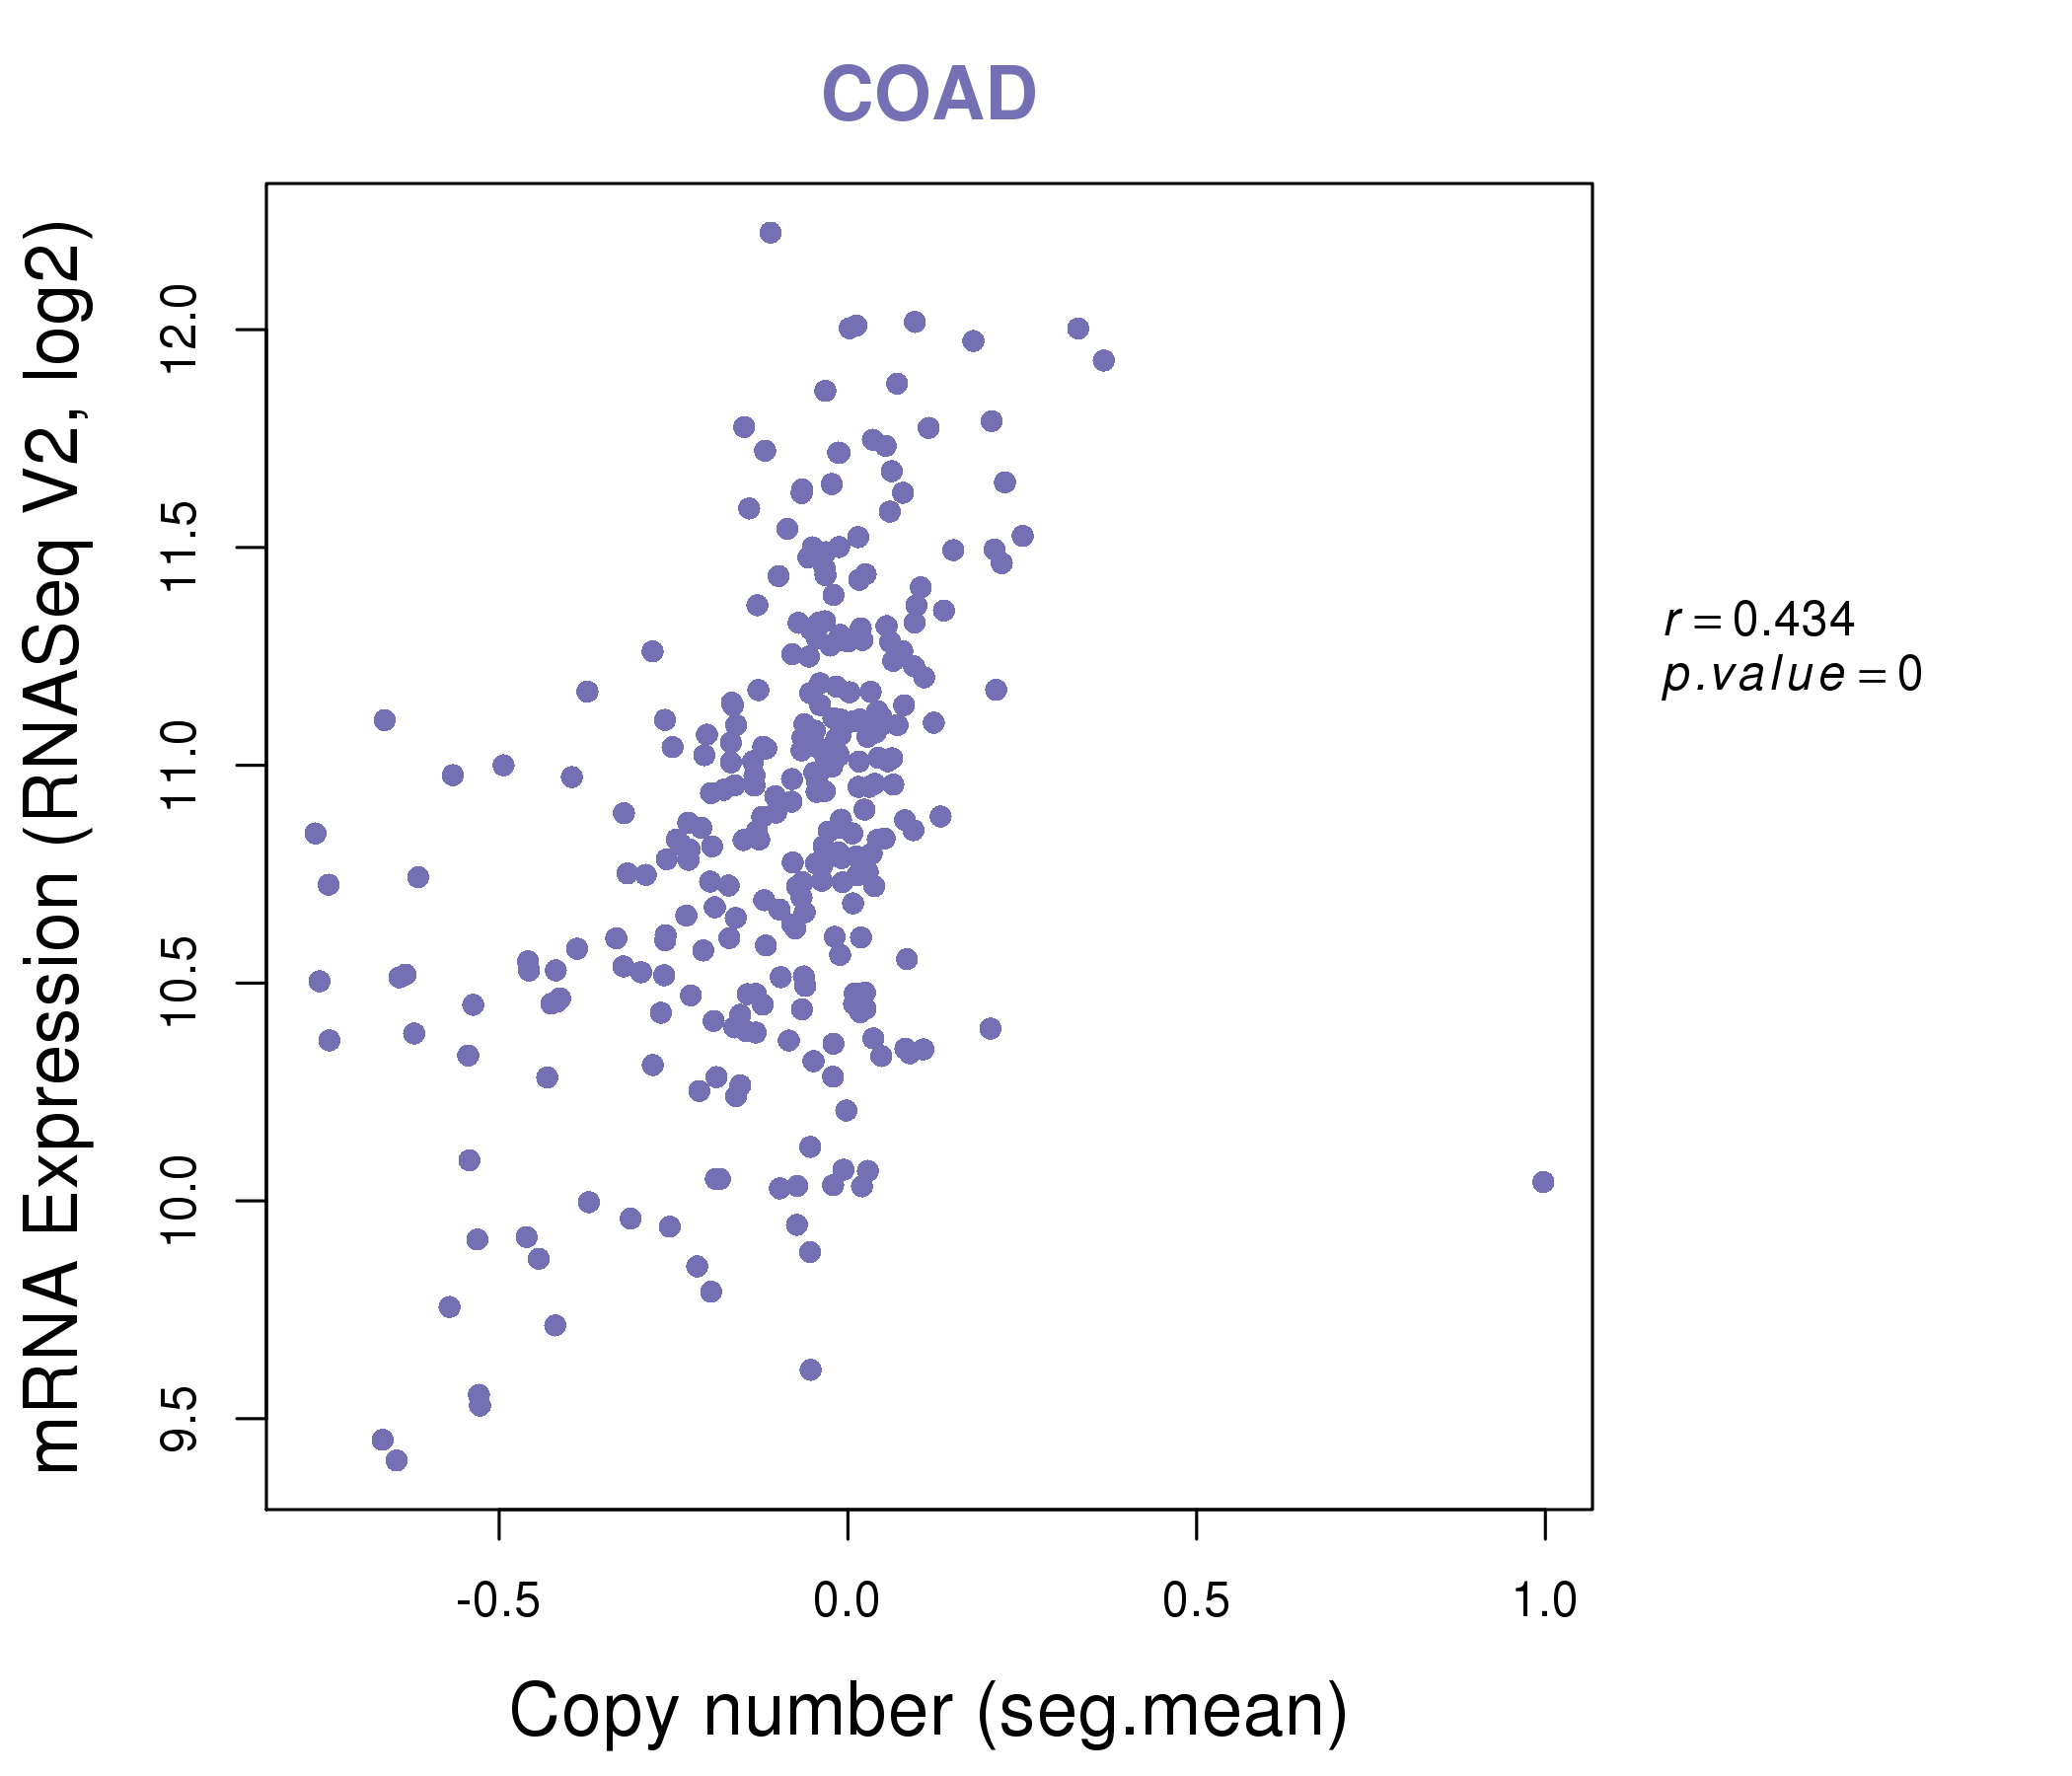
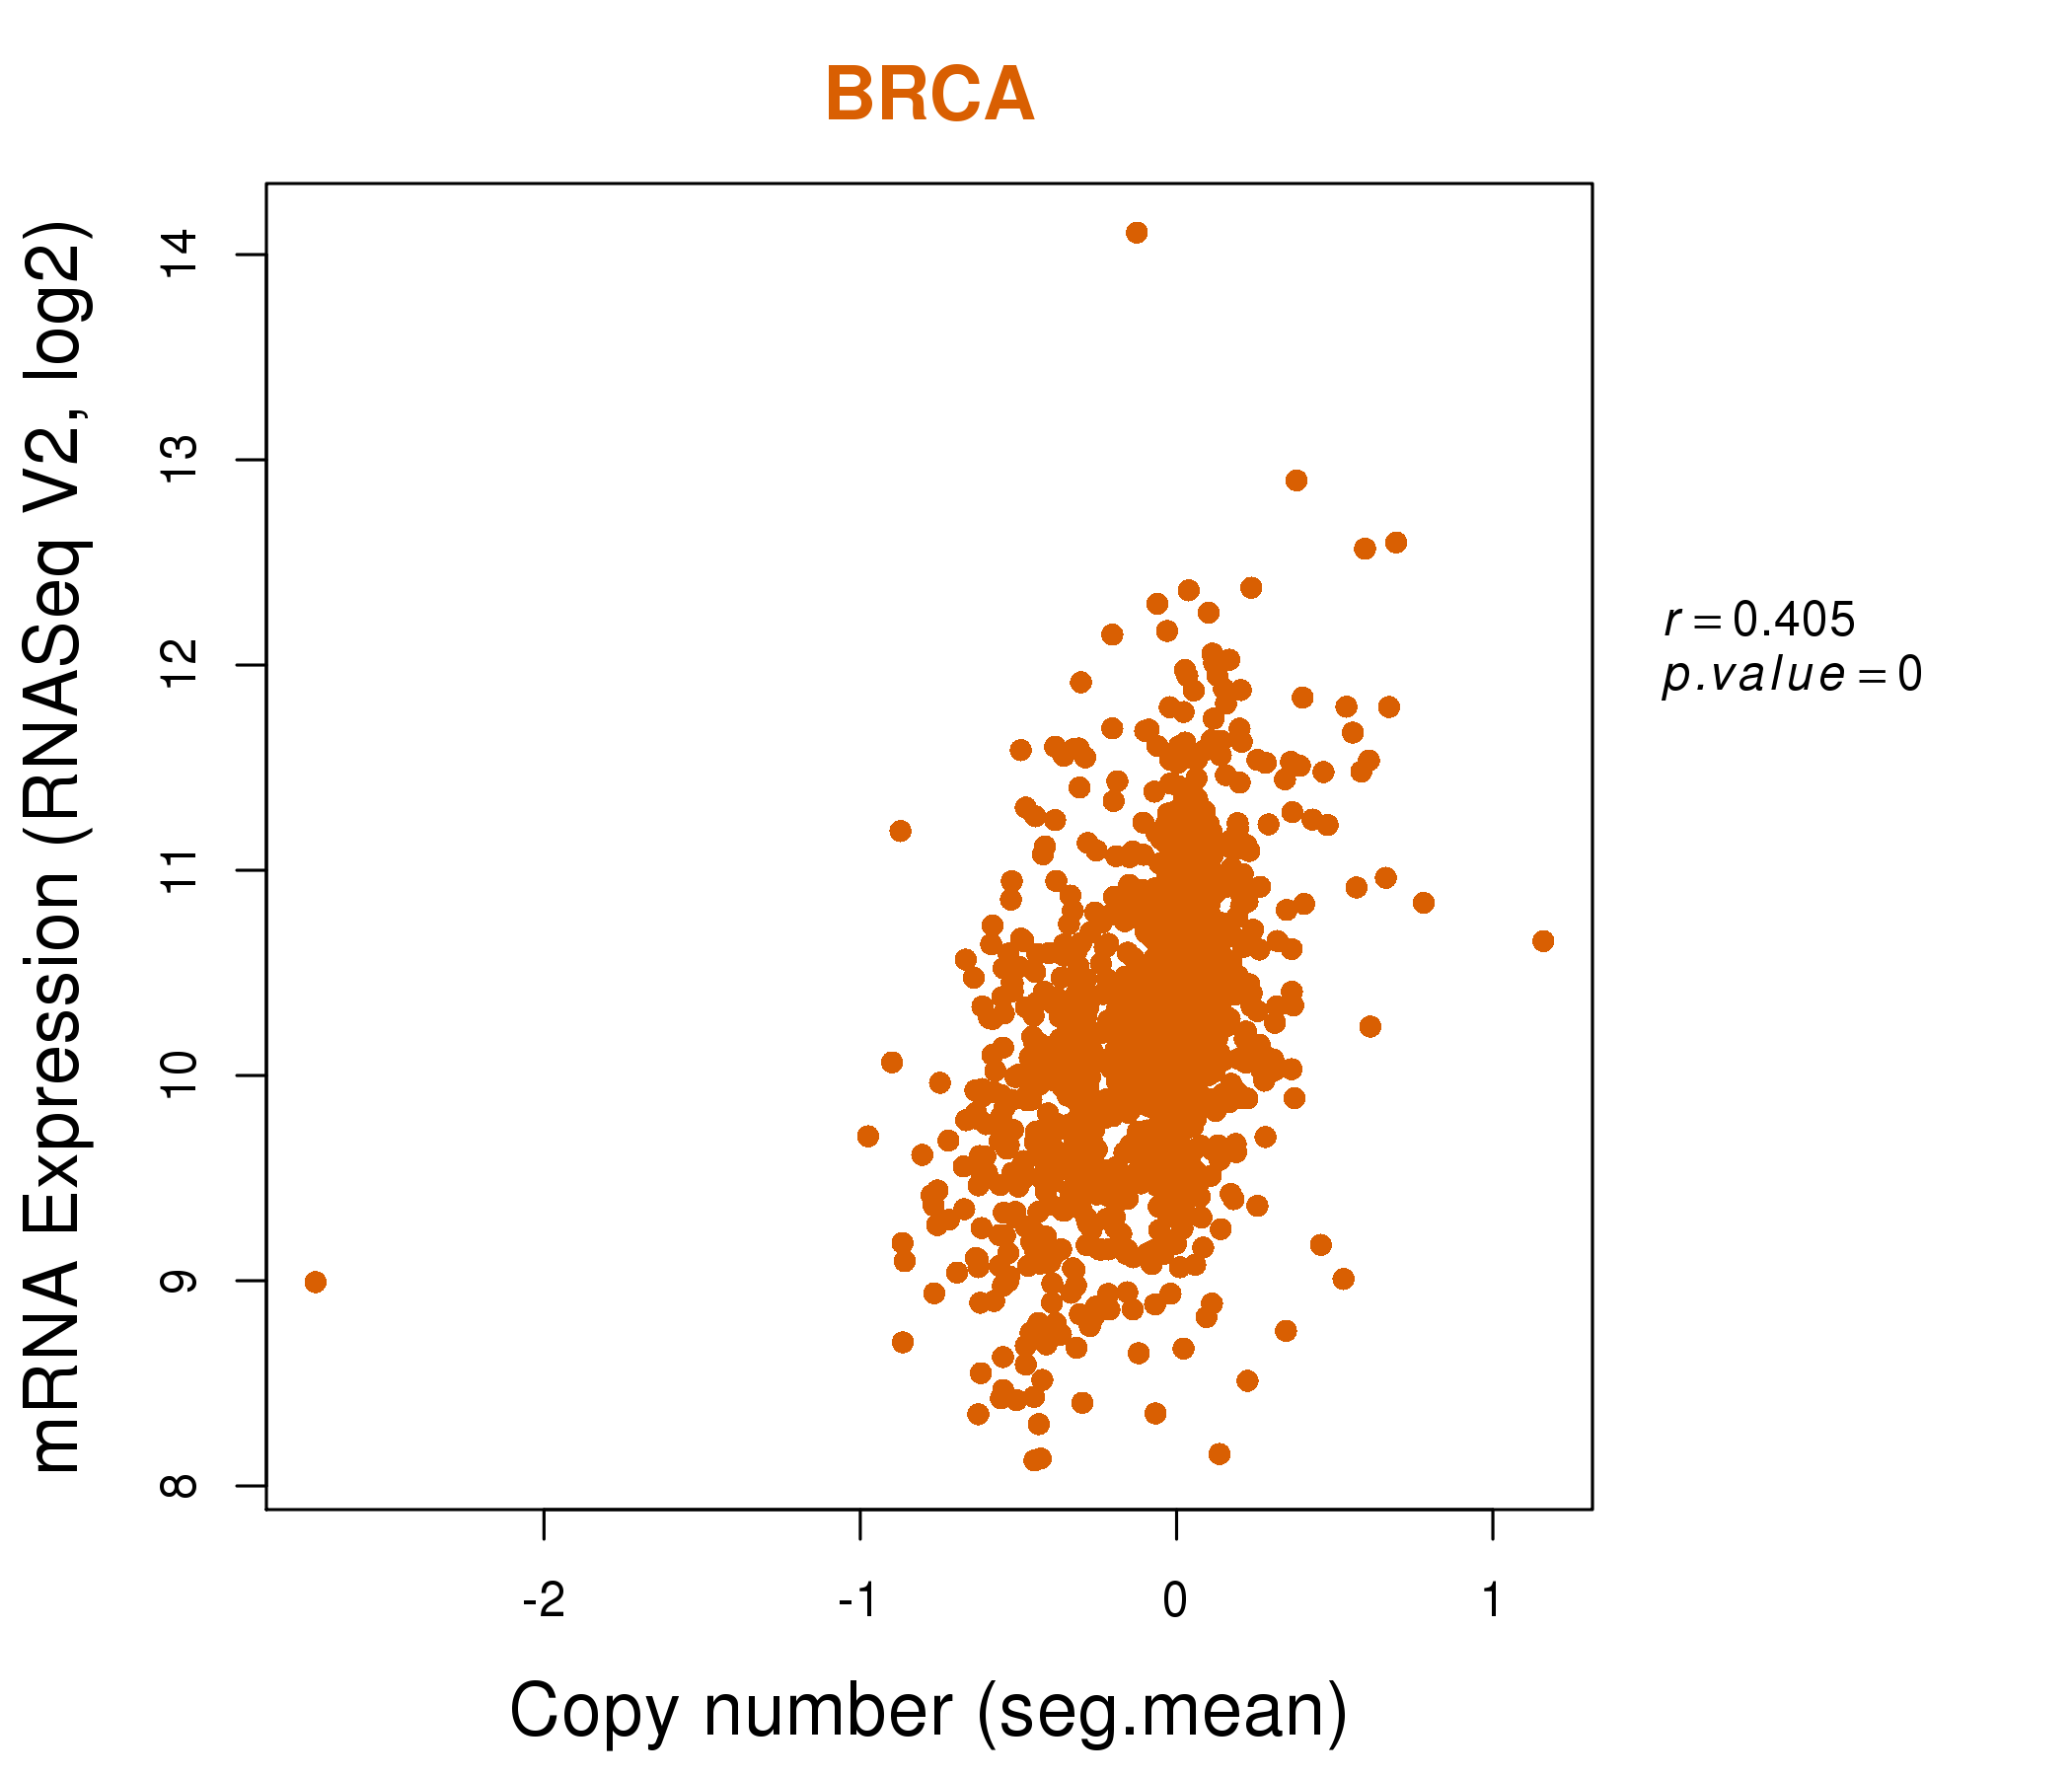
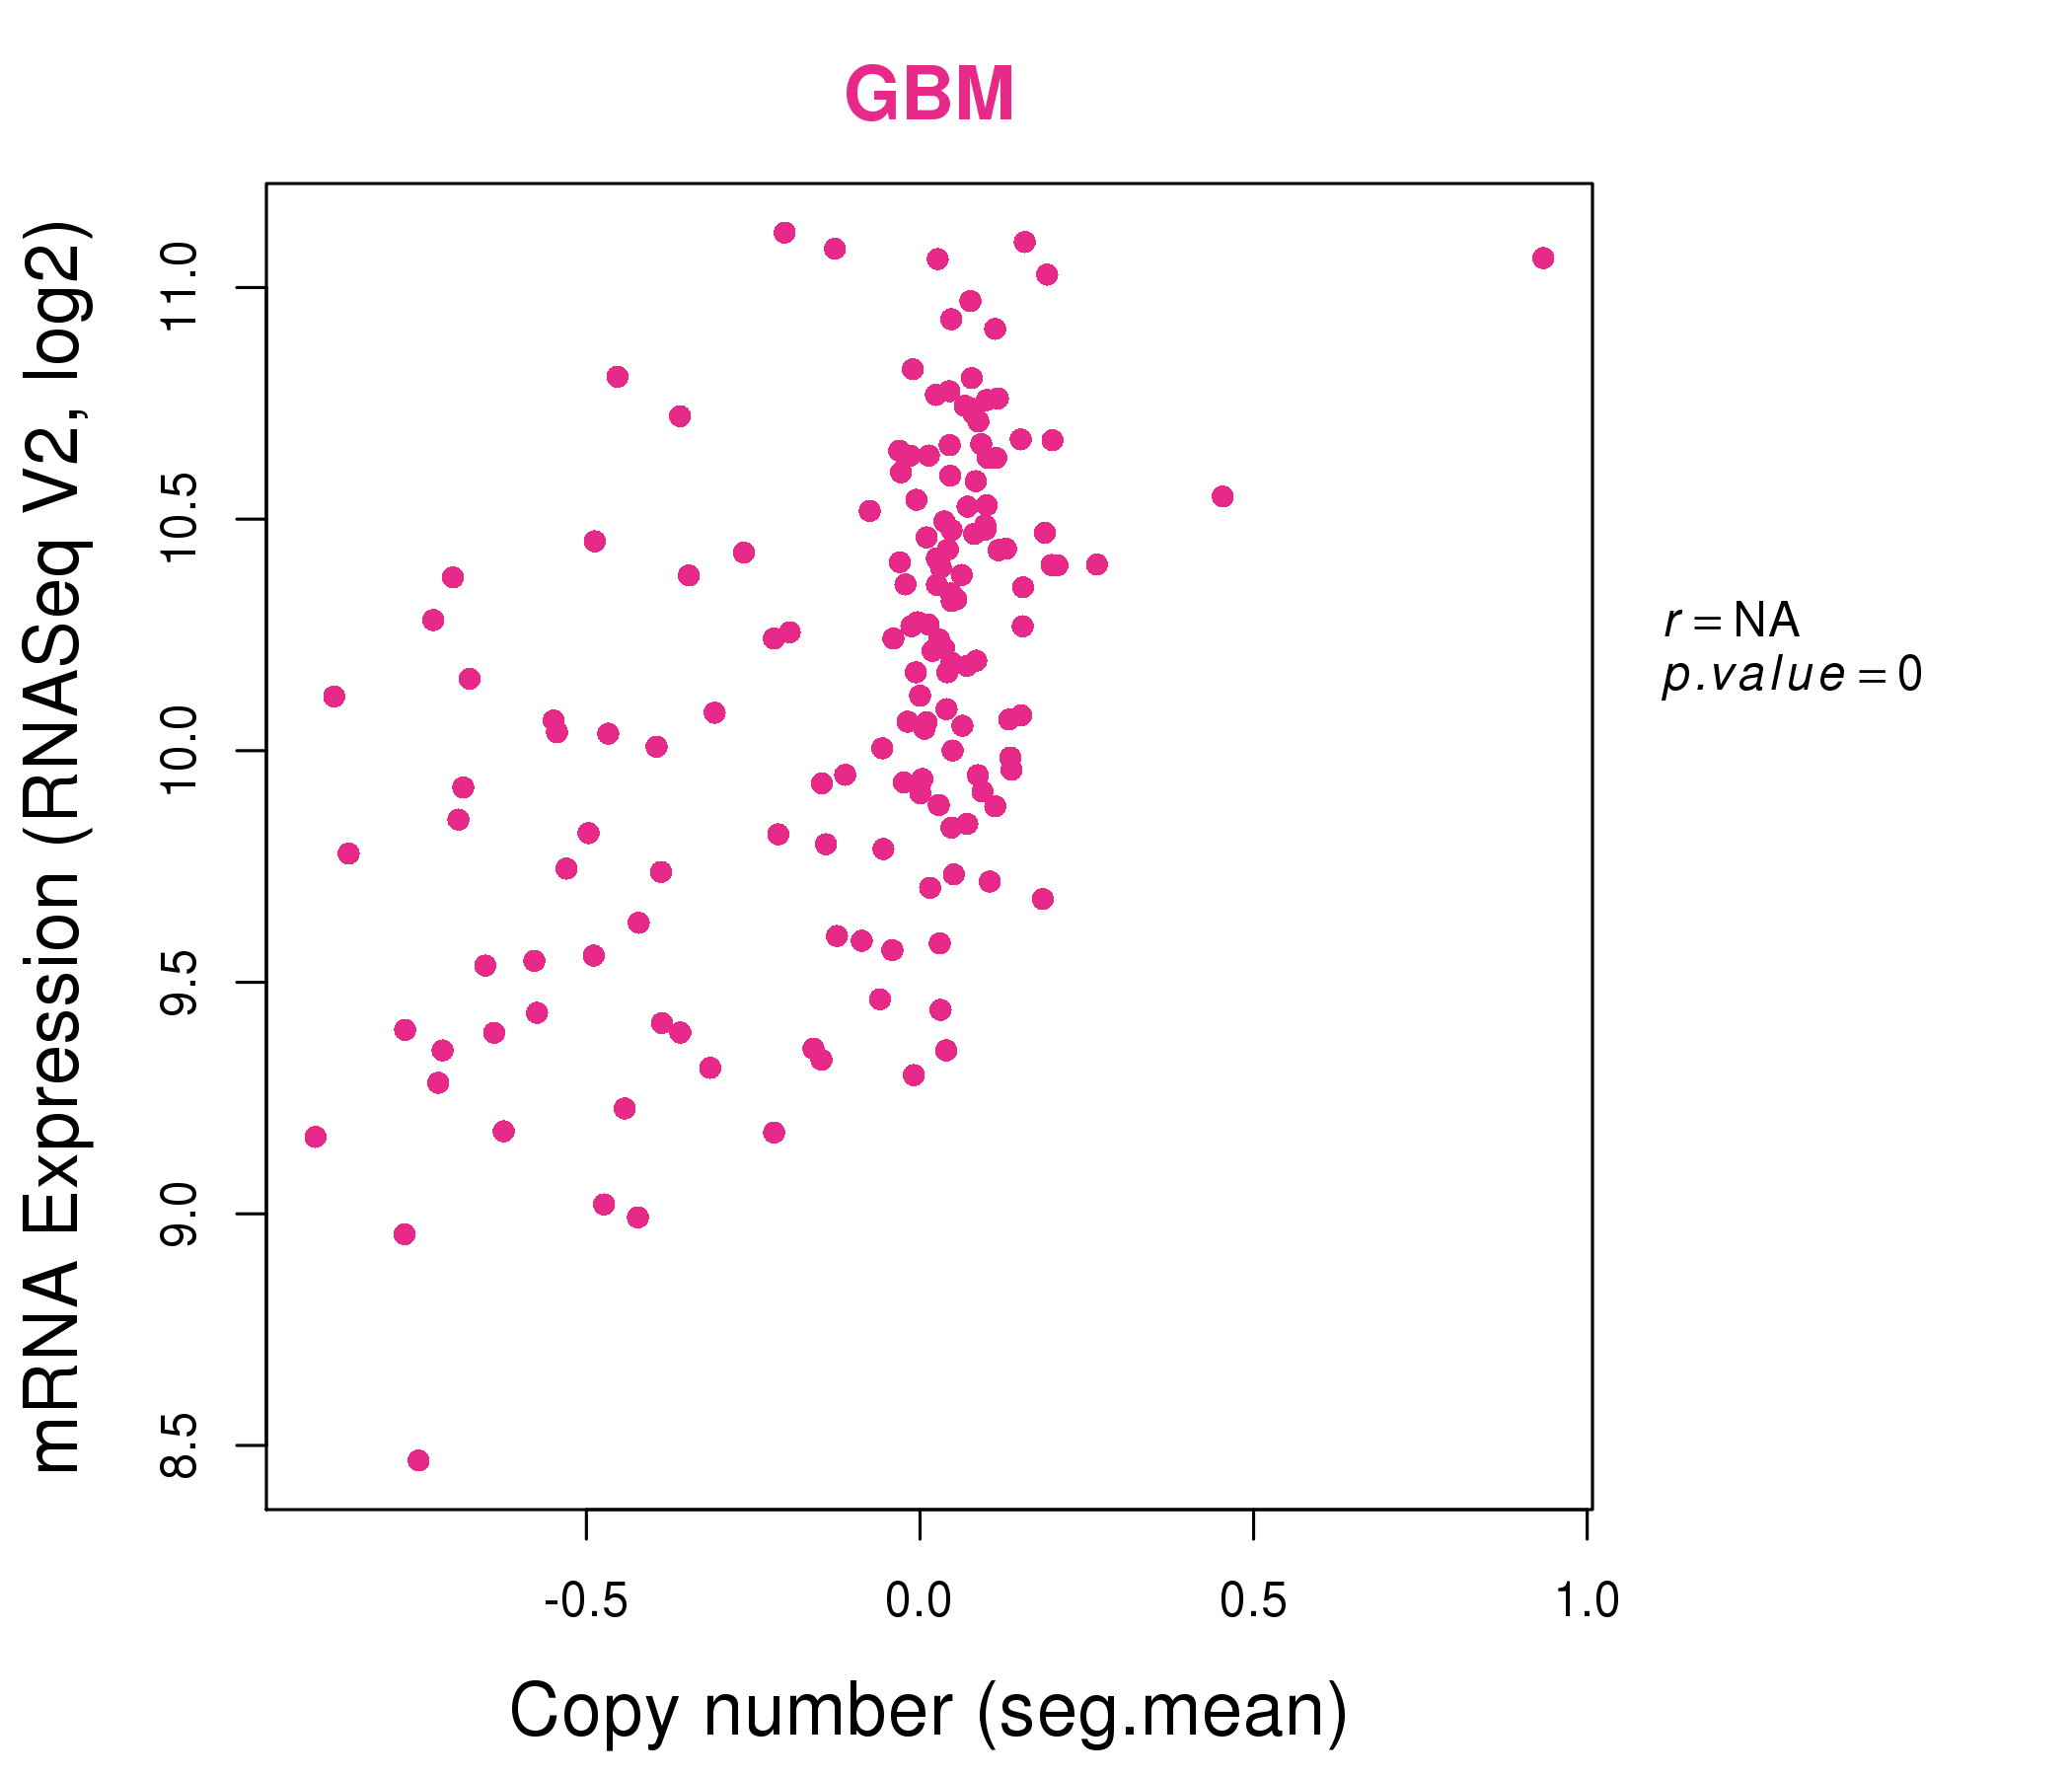
| * This plots show the correlation between CNV and gene expression. |
: Open all plots for all cancer types
 |
|
 |
|
| Top |
| Gene-Gene Network Information |
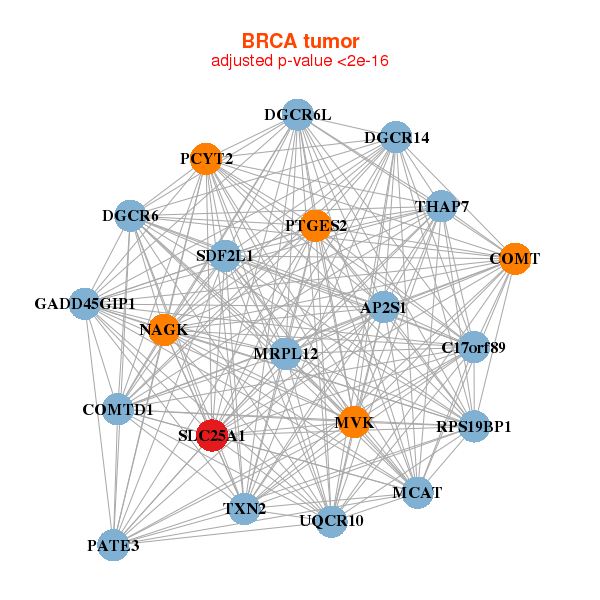
| * Co-Expression network figures were drawn using R package igraph. Only the top 20 genes with the highest correlations were shown. Red circle: input gene, orange circle: cell metabolism gene, sky circle: other gene |
: Open all plots for all cancer types
 |
| ||||
| ACO2,ATXN10,BCL2L13,DRG1,ST13P4,FOXRED2,L3MBTL2, MRPL40,NDUFA6,NHP2L1,NUP50,PHF5A,RNF185,SAMM50, SLC25A17,SNAP29,ST13,SYNGR1,TOMM22,XPNPEP3,XRCC6 | AGA,BUB3,C14orf1,TMEM241,C3orf14,CYP2R1,CYP51A1, HSD17B7,HSPB11,MYCBP,PEX3,PIP4K2C,PPA2,PPAPDC2, PTPLAD1,RNF103,SERP1,SLC25A17,TMEM33,SARAF,TMEM87B | ||||
 |
| ||||
| ADSL,BID,CDC45,CENPM,DGCR6L,DRG1,MRPL40, NDUFA6,NHP2L1,PHF5A,POLR2F,RANBP1,RBX1,SLC25A17, SNRPD3,TOMM22,TXN2,UBE2L3,UFD1L,UQCR10,XRCC6 | DTD2,CMC2,TEFM,CCDC58,CHAC2,COX18,DCAF13, HSPA14,MEMO1,MRPL1,MRPL42,MRPS35,PTRH2,TRMT10C, RINT1,SLC25A17,SRPRB,TAF9,TOMM22,UTP18,WDR12 |

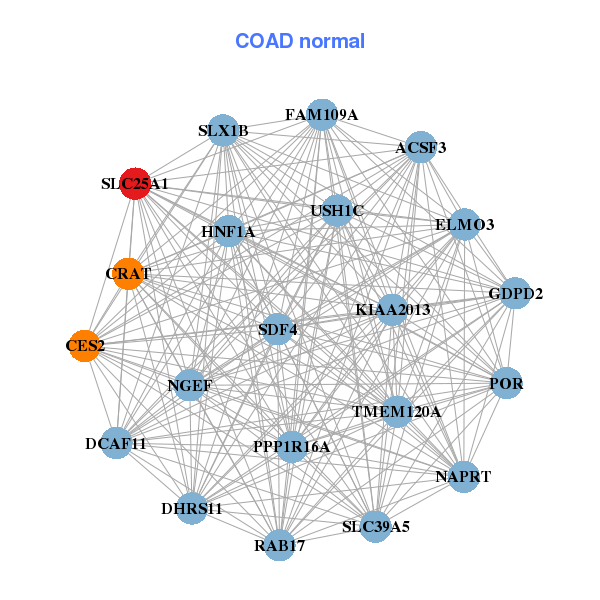
| * Co-Expression network figures were drawn using R package igraph. Only the top 20 genes with the highest correlations were shown. Red circle: input gene, orange circle: cell metabolism gene, sky circle: other gene |
: Open all plots for all cancer types
| Top |
: Open all interacting genes' information including KEGG pathway for all interacting genes from DAVID
| Top |
| Pharmacological Information for SLC25A1 |
| DB Category | DB Name | DB's ID and Url link |
| * Gene Centered Interaction Network. |
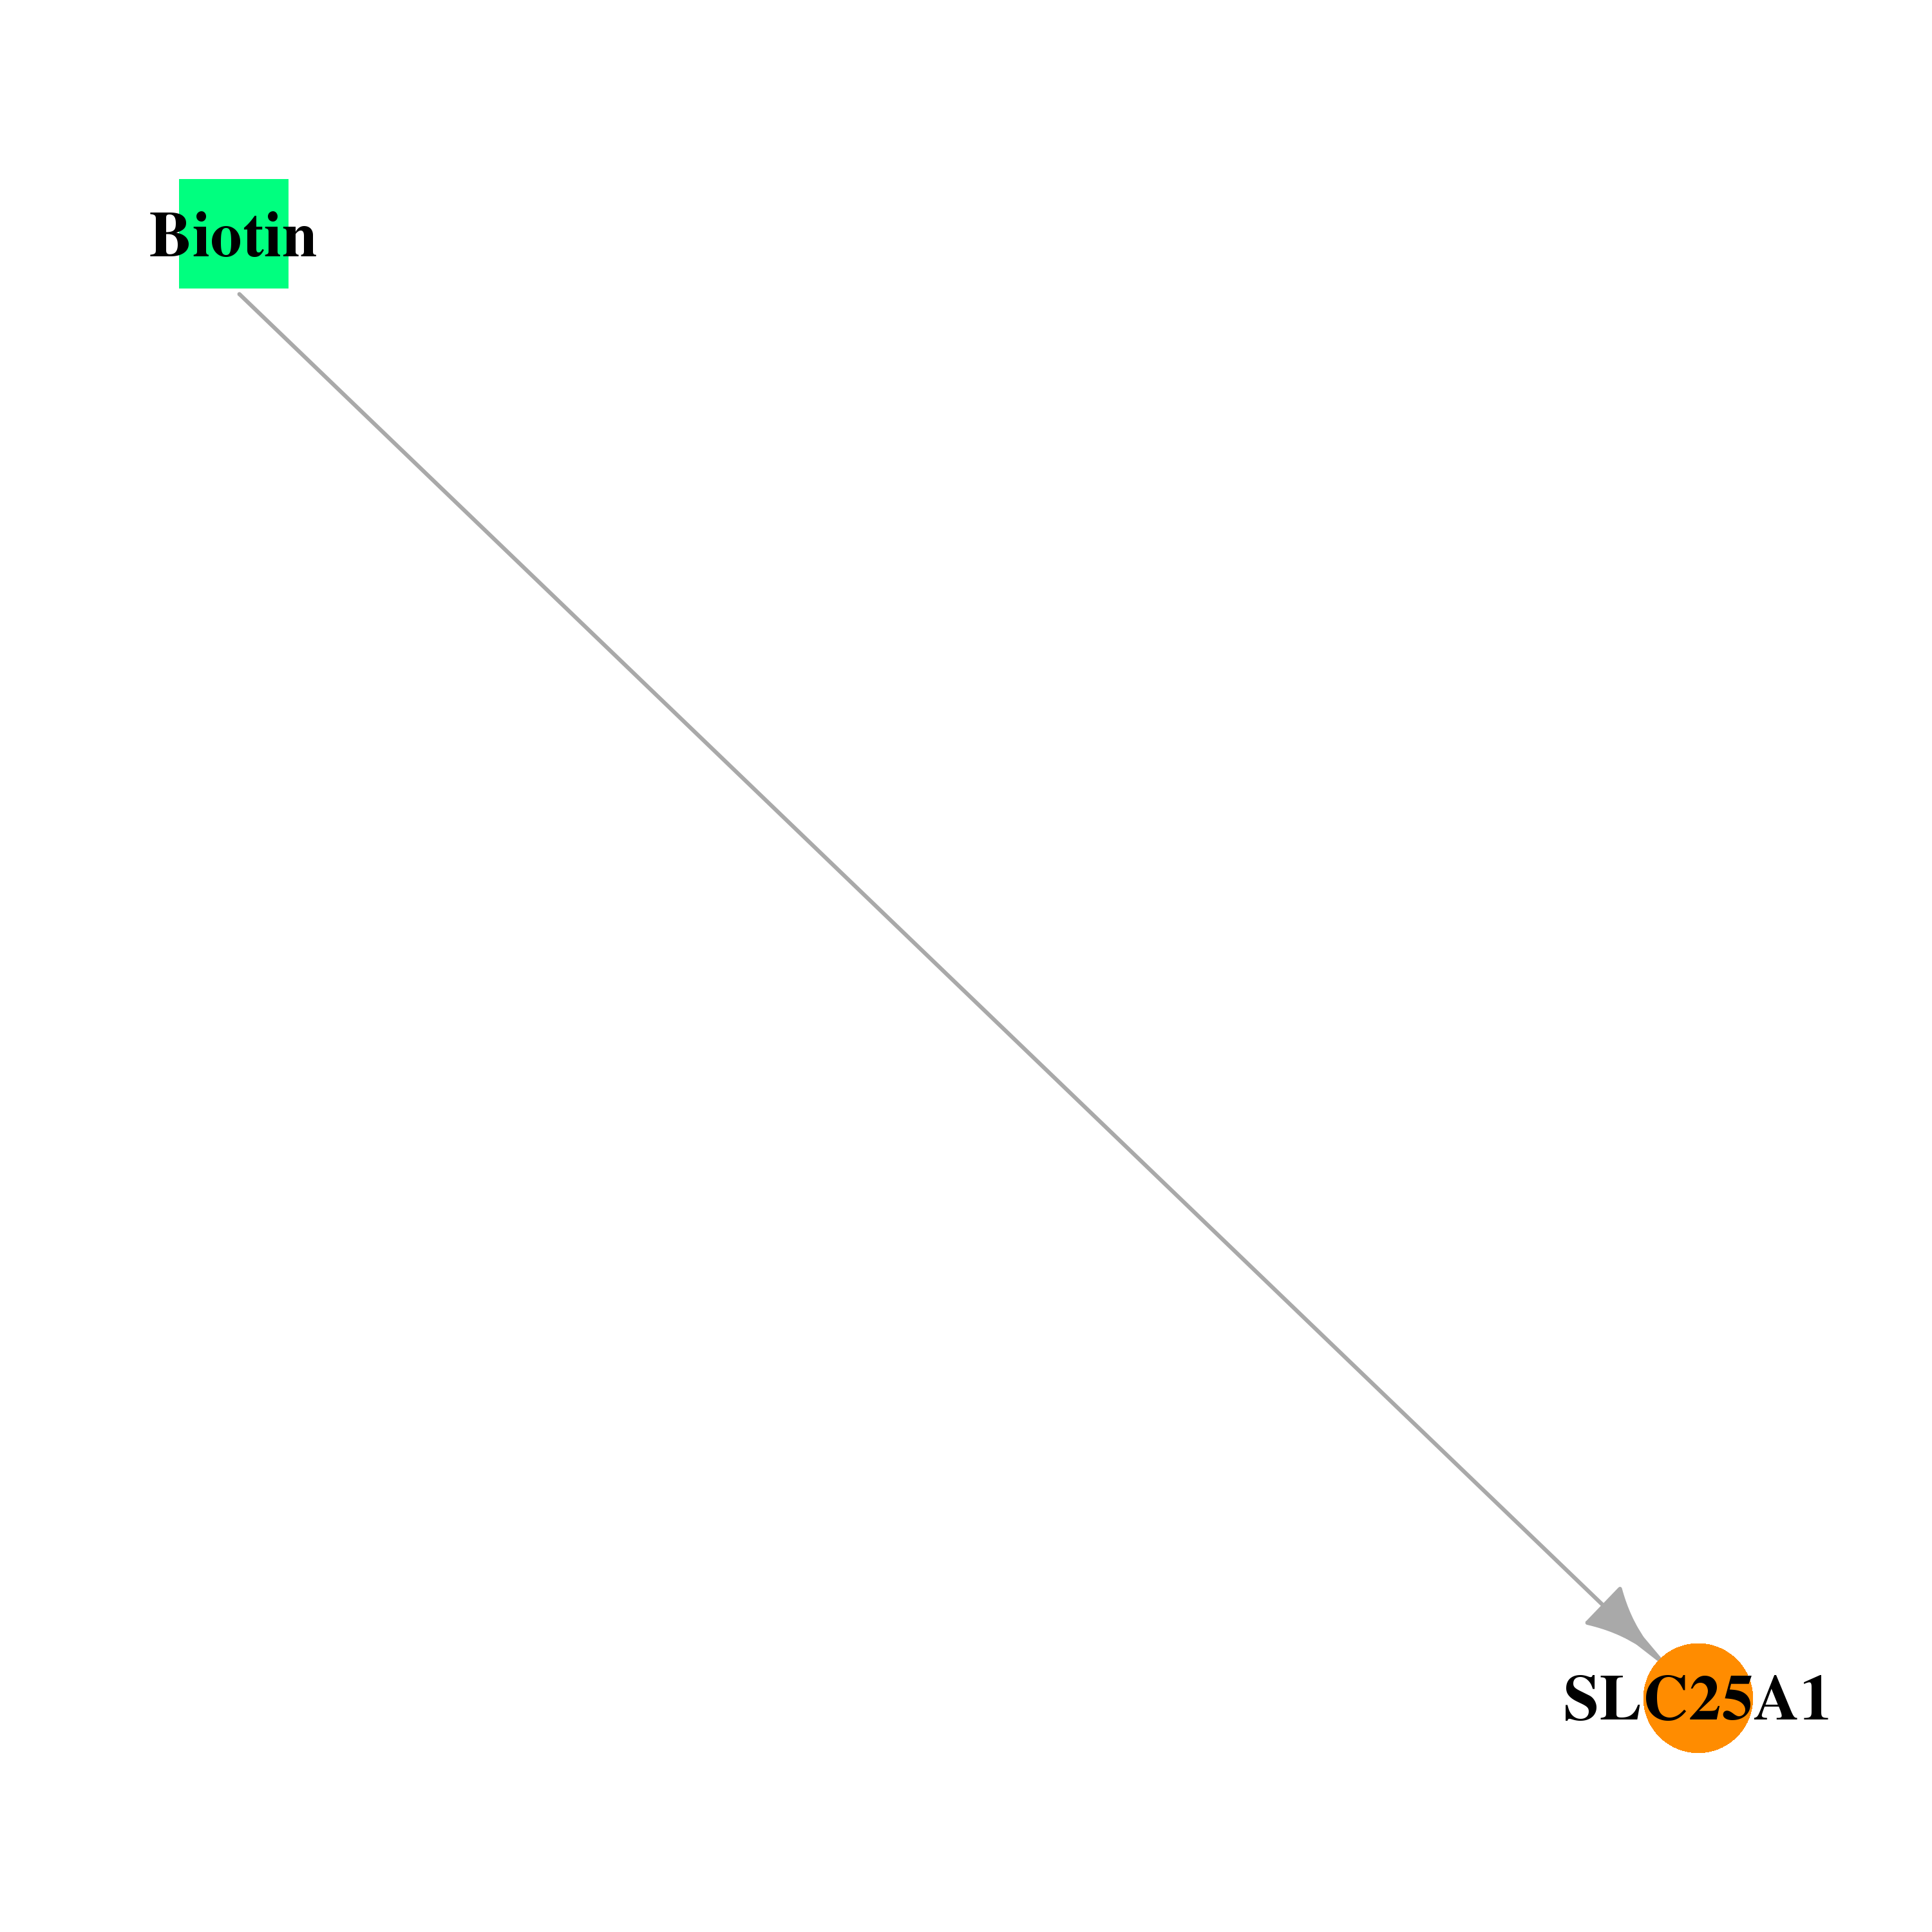 |
| * Drug Centered Interaction Network. |
| DrugBank ID | Target Name | Drug Groups | Generic Name | Drug Centered Network | Drug Structure |
| DB00121 | solute carrier family 25 (mitochondrial carrier; citrate transporter), member 1 | approved; nutraceutical | Biotin | 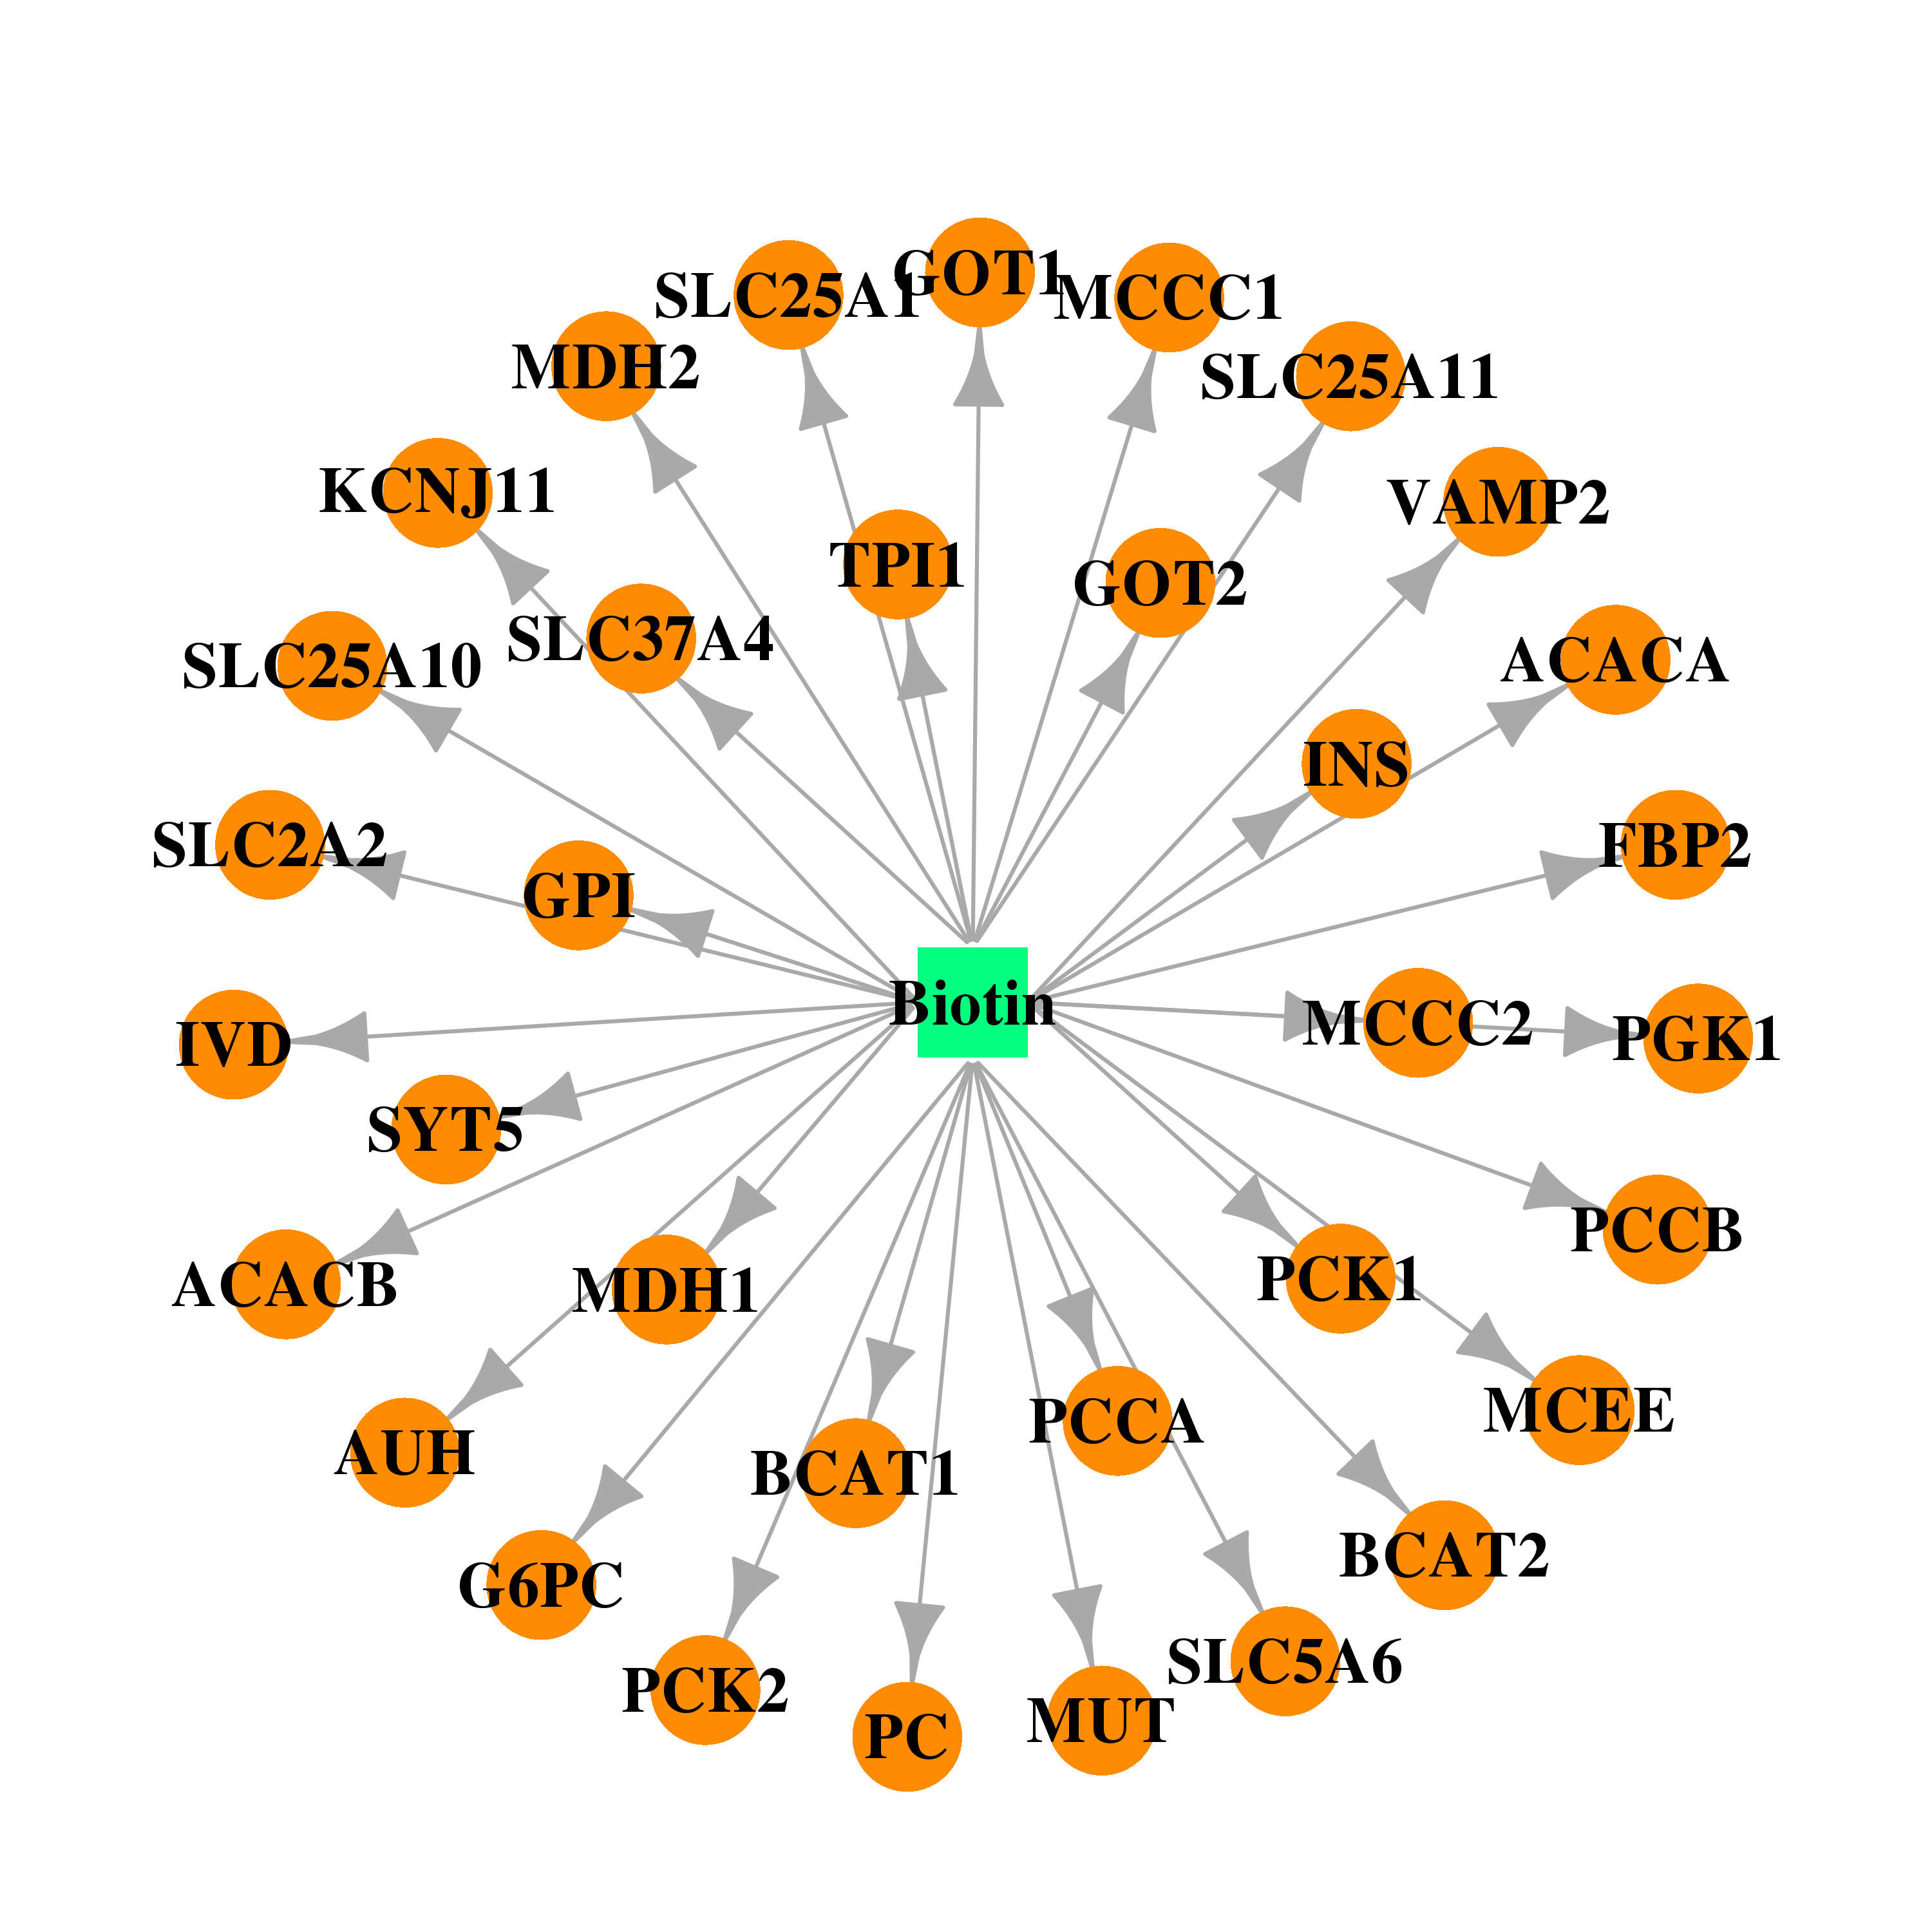 | 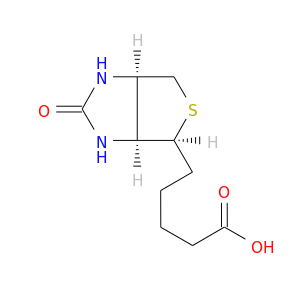 |
| Top |
| Cross referenced IDs for SLC25A1 |
| * We obtained these cross-references from Uniprot database. It covers 150 different DBs, 18 categories. http://www.uniprot.org/help/cross_references_section |
: Open all cross reference information
|
Copyright © 2016-Present - The Univsersity of Texas Health Science Center at Houston @ |