|
|||||||||||||||||||||||||||||||||||||||||||||||||||||||||||||||||||||||||||||||||||||||||||||||||||||||||||||||||||||||||||||||||||||||||||||||||||||||||||||||||||||||||||||||||||||||||||||||||||||||||||||||||||||||||||||||||||||||||||||||||||||||||||||||||||||||||||||||||||||||||||||||||||||||||||||||||||||||||||||||||||||||||||||||||||||||||||||||||||||
| |
| Phenotypic Information (metabolism pathway, cancer, disease, phenome) |
| |
| |
| Gene-Gene Network Information: Co-Expression Network, Interacting Genes & KEGG |
| |
|


| Gene Summary for SLC22A3 |
| Basic gene info. | Gene symbol | SLC22A3 |
| Gene name | solute carrier family 22 (organic cation transporter), member 3 | |
| Synonyms | EMT|EMTH|OCT3 | |
| Cytomap | UCSC genome browser: 6q25.3 | |
| Genomic location | chr6 :160769424-160876014 | |
| Type of gene | protein-coding | |
| RefGenes | NM_021977.3, | |
| Ensembl id | ENSG00000146477 | |
| Description | EMT organic cation transporter 3extraneuronal monoamine transporterorganic cation transporter 3solute carrier family 22 (extraneuronal monoamine transporter), member 3solute carrier family 22 member 3 | |
| Modification date | 20141207 | |
| dbXrefs | MIM : 604842 | |
| HGNC : HGNC | ||
| Ensembl : ENSG00000146477 | ||
| HPRD : 05328 | ||
| Vega : OTTHUMG00000015953 | ||
| Protein | UniProt: go to UniProt's Cross Reference DB Table | |
| Expression | CleanEX: HS_SLC22A3 | |
| BioGPS: 6581 | ||
| Gene Expression Atlas: ENSG00000146477 | ||
| The Human Protein Atlas: ENSG00000146477 | ||
| Pathway | NCI Pathway Interaction Database: SLC22A3 | |
| KEGG: SLC22A3 | ||
| REACTOME: SLC22A3 | ||
| ConsensusPathDB | ||
| Pathway Commons: SLC22A3 | ||
| Metabolism | MetaCyc: SLC22A3 | |
| HUMANCyc: SLC22A3 | ||
| Regulation | Ensembl's Regulation: ENSG00000146477 | |
| miRBase: chr6 :160,769,424-160,876,014 | ||
| TargetScan: NM_021977 | ||
| cisRED: ENSG00000146477 | ||
| Context | iHOP: SLC22A3 | |
| cancer metabolism search in PubMed: SLC22A3 | ||
| UCL Cancer Institute: SLC22A3 | ||
| Assigned class in ccmGDB | C | |
| Top |
| Phenotypic Information for SLC22A3(metabolism pathway, cancer, disease, phenome) |
| Cancer | CGAP: SLC22A3 |
| Familial Cancer Database: SLC22A3 | |
| * This gene is included in those cancer gene databases. |
|
|
|
|
|
|
| |||||||||||||||||||||||||||||||||||||||||||||||||||||||||||||||||||||||||||||||||||||||||||||||||||||||||||||||||||||||||||||||||||||||||||||||||||||||||||||||||||||||||||||||||||||||||||||||||||||||||||||||||||||||||||||||||||||||||||||||||||||||||||||||||||||||||||||||||||||||||||||||||||||||||||||||||||||||||||||||||||||||||||||||||||||||||||||||
Oncogene 1 | Significant driver gene in | ||||||||||||||||||||||||||||||||||||||||||||||||||||||||||||||||||||||||||||||||||||||||||||||||||||||||||||||||||||||||||||||||||||||||||||||||||||||||||||||||||||||||||||||||||||||||||||||||||||||||||||||||||||||||||||||||||||||||||||||||||||||||||||||||||||||||||||||||||||||||||||||||||||||||||||||||||||||||||||||||||||||||||||||||||||||||||||||||||||
| cf) number; DB name 1 Oncogene; http://nar.oxfordjournals.org/content/35/suppl_1/D721.long, 2 Tumor Suppressor gene; https://bioinfo.uth.edu/TSGene/, 3 Cancer Gene Census; http://www.nature.com/nrc/journal/v4/n3/abs/nrc1299.html, 4 CancerGenes; http://nar.oxfordjournals.org/content/35/suppl_1/D721.long, 5 Network of Cancer Gene; http://ncg.kcl.ac.uk/index.php, 1Therapeutic Vulnerabilities in Cancer; http://cbio.mskcc.org/cancergenomics/statius/ |
| REACTOME_ABACAVIR_TRANSPORT_AND_METABOLISM | |
| Mutations for SLC22A3 |
| * Under tables are showing count per each tissue to give us broad intuition about tissue specific mutation patterns.You can go to the detailed page for each mutation database's web site. |
| - Statistics for Tissue and Mutation type | Top |
 |
| - For Inter-chromosomal Variations |
| There's no inter-chromosomal structural variation. |
| - For Intra-chromosomal Variations |
| * Intra-chromosomal variantions includes 'intrachromosomal amplicon to amplicon', 'intrachromosomal amplicon to non-amplified dna', 'intrachromosomal deletion', 'intrachromosomal fold-back inversion', 'intrachromosomal inversion', 'intrachromosomal tandem duplication', 'Intrachromosomal unknown type', 'intrachromosomal with inverted orientation', 'intrachromosomal with non-inverted orientation'. |
 |
| Sample | Symbol_a | Chr_a | Start_a | End_a | Symbol_b | Chr_b | Start_b | End_b |
| prostate | SLC22A3 | chr6 | 160799740 | 160799740 | AGPAT4 | chr6 | 161676369 | 161676369 |
| cf) Tissue number; Tissue name (1;Breast, 2;Central_nervous_system, 3;Haematopoietic_and_lymphoid_tissue, 4;Large_intestine, 5;Liver, 6;Lung, 7;Ovary, 8;Pancreas, 9;Prostate, 10;Skin, 11;Soft_tissue, 12;Upper_aerodigestive_tract) |
| * From mRNA Sanger sequences, Chitars2.0 arranged chimeric transcripts. This table shows SLC22A3 related fusion information. |
| ID | Head Gene | Tail Gene | Accession | Gene_a | qStart_a | qEnd_a | Chromosome_a | tStart_a | tEnd_a | Gene_a | qStart_a | qEnd_a | Chromosome_a | tStart_a | tEnd_a |
| BG568915 | TXNL4B | 2 | 145 | 16 | 72088525 | 72090457 | SLC22A3 | 141 | 423 | 6 | 160872867 | 160873149 | |
| BC070300 | TXNL4B | 1 | 144 | 16 | 72088525 | 72090457 | SLC22A3 | 140 | 730 | 6 | 160872867 | 160873457 | |
| Top |
| Mutation type/ Tissue ID | brca | cns | cerv | endome | haematopo | kidn | Lintest | liver | lung | ns | ovary | pancre | prost | skin | stoma | thyro | urina | |||
| Total # sample | 1 | 1 | 2 | |||||||||||||||||
| GAIN (# sample) | 1 | |||||||||||||||||||
| LOSS (# sample) | 1 | 1 | 1 |
| cf) Tissue ID; Tissue type (1; Breast, 2; Central_nervous_system, 3; Cervix, 4; Endometrium, 5; Haematopoietic_and_lymphoid_tissue, 6; Kidney, 7; Large_intestine, 8; Liver, 9; Lung, 10; NS, 11; Ovary, 12; Pancreas, 13; Prostate, 14; Skin, 15; Stomach, 16; Thyroid, 17; Urinary_tract) |
| Top |
|
 |
| Top |
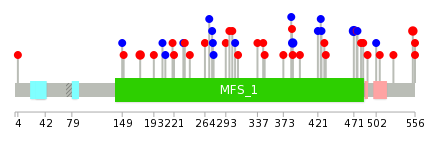
| Stat. for Non-Synonymous SNVs (# total SNVs=40) | (# total SNVs=21) |
 |  |
(# total SNVs=0) | (# total SNVs=0) |
| Top |
| * When you move the cursor on each content, you can see more deailed mutation information on the Tooltip. Those are primary_site,primary_histology,mutation(aa),pubmedID. |
| GRCh37 position | Mutation(aa) | Unique sampleID count |
| chr6:160769811-160769811 | p.R120R | 11 |
| chr6:160864677-160864677 | p.S471S | 3 |
| chr6:160858027-160858027 | p.? | 3 |
| chr6:160872075-160872075 | p.R553H | 3 |
| chr6:160819102-160819102 | p.Y174C | 3 |
| chr6:160857846-160857846 | p.S337C | 2 |
| chr6:160831780-160831780 | p.R293C | 2 |
| chr6:160858117-160858117 | p.V388M | 2 |
| chr6:160829790-160829790 | p.E232K | 2 |
| chr6:160829803-160829803 | p.S236L | 2 |
| Top |
|
 |
| Point Mutation/ Tissue ID | 1 | 2 | 3 | 4 | 5 | 6 | 7 | 8 | 9 | 10 | 11 | 12 | 13 | 14 | 15 | 16 | 17 | 18 | 19 | 20 |
| # sample | 1 | 3 | 8 | 2 | 1 | 1 | 6 | 2 | 1 | 12 | 3 | 6 | ||||||||
| # mutation | 1 | 3 | 7 | 2 | 2 | 1 | 6 | 2 | 1 | 15 | 3 | 6 | ||||||||
| nonsynonymous SNV | 1 | 5 | 2 | 1 | 1 | 3 | 2 | 9 | 2 | 5 | ||||||||||
| synonymous SNV | 3 | 2 | 1 | 3 | 1 | 6 | 1 | 1 |
| cf) Tissue ID; Tissue type (1; BLCA[Bladder Urothelial Carcinoma], 2; BRCA[Breast invasive carcinoma], 3; CESC[Cervical squamous cell carcinoma and endocervical adenocarcinoma], 4; COAD[Colon adenocarcinoma], 5; GBM[Glioblastoma multiforme], 6; Glioma Low Grade, 7; HNSC[Head and Neck squamous cell carcinoma], 8; KICH[Kidney Chromophobe], 9; KIRC[Kidney renal clear cell carcinoma], 10; KIRP[Kidney renal papillary cell carcinoma], 11; LAML[Acute Myeloid Leukemia], 12; LUAD[Lung adenocarcinoma], 13; LUSC[Lung squamous cell carcinoma], 14; OV[Ovarian serous cystadenocarcinoma ], 15; PAAD[Pancreatic adenocarcinoma], 16; PRAD[Prostate adenocarcinoma], 17; SKCM[Skin Cutaneous Melanoma], 18:STAD[Stomach adenocarcinoma], 19:THCA[Thyroid carcinoma], 20:UCEC[Uterine Corpus Endometrial Carcinoma]) |
| Top |
| * We represented just top 10 SNVs. When you move the cursor on each content, you can see more deailed mutation information on the Tooltip. Those are primary_site, primary_histology, mutation(aa), pubmedID. |
| Genomic Position | Mutation(aa) | Unique sampleID count |
| chr6:160864677 | p.S471S | 3 |
| chr6:160872075 | p.Y174C | 2 |
| chr6:160819102 | p.R553H | 2 |
| chr6:160858113 | p.S386S | 2 |
| chr6:160769463 | p.C421C | 1 |
| chr6:160858230 | p.L556H | 1 |
| chr6:160829824 | p.T275T | 1 |
| chr6:160868759 | p.A425A | 1 |
| chr6:160857846 | p.F4L | 1 |
| chr6:160819028 | p.L276L | 1 |
| * Copy number data were extracted from TCGA using R package TCGA-Assembler. The URLs of all public data files on TCGA DCC data server were gathered on Jan-05-2015. Function ProcessCNAData in TCGA-Assembler package was used to obtain gene-level copy number value which is calculated as the average copy number of the genomic region of a gene. |
 |
| cf) Tissue ID[Tissue type]: BLCA[Bladder Urothelial Carcinoma], BRCA[Breast invasive carcinoma], CESC[Cervical squamous cell carcinoma and endocervical adenocarcinoma], COAD[Colon adenocarcinoma], GBM[Glioblastoma multiforme], Glioma Low Grade, HNSC[Head and Neck squamous cell carcinoma], KICH[Kidney Chromophobe], KIRC[Kidney renal clear cell carcinoma], KIRP[Kidney renal papillary cell carcinoma], LAML[Acute Myeloid Leukemia], LUAD[Lung adenocarcinoma], LUSC[Lung squamous cell carcinoma], OV[Ovarian serous cystadenocarcinoma ], PAAD[Pancreatic adenocarcinoma], PRAD[Prostate adenocarcinoma], SKCM[Skin Cutaneous Melanoma], STAD[Stomach adenocarcinoma], THCA[Thyroid carcinoma], UCEC[Uterine Corpus Endometrial Carcinoma] |
| Top |
| Gene Expression for SLC22A3 |
| * CCLE gene expression data were extracted from CCLE_Expression_Entrez_2012-10-18.res: Gene-centric RMA-normalized mRNA expression data. |
 |
| * Normalized gene expression data of RNASeqV2 was extracted from TCGA using R package TCGA-Assembler. The URLs of all public data files on TCGA DCC data server were gathered at Jan-05-2015. Only eight cancer types have enough normal control samples for differential expression analysis. (t test, adjusted p<0.05 (using Benjamini-Hochberg FDR)) |
 |
| Top |
| * This plots show the correlation between CNV and gene expression. |
: Open all plots for all cancer types
 |
|
 |
|


| Top |
| Gene-Gene Network Information |
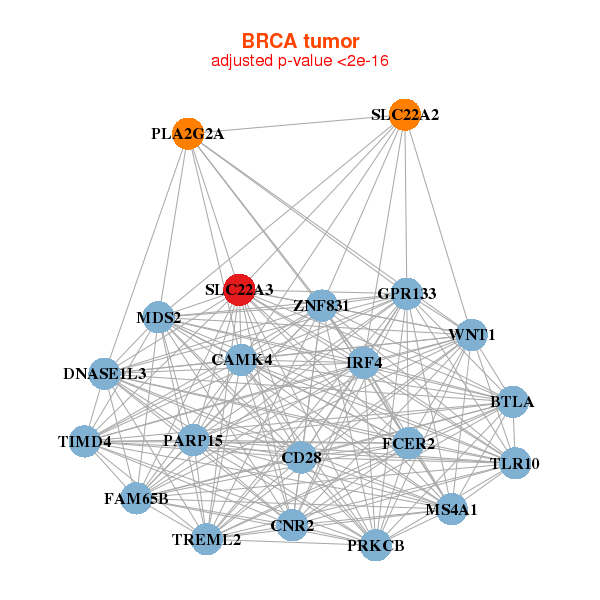
| * Co-Expression network figures were drawn using R package igraph. Only the top 20 genes with the highest correlations were shown. Red circle: input gene, orange circle: cell metabolism gene, sky circle: other gene |
: Open all plots for all cancer types
 |
| ||||
| BTLA,CAMK4,CD28,CNR2,DNASE1L3,FAM65B,FCER2, GPR133,IRF4,MDS2,MS4A1,PARP15,PLA2G2A,PRKCB, SLC22A2,SLC22A3,TIMD4,TLR10,TREML2,WNT1,ZNF831 | ABCD2,ABHD15,ACAA2,ADIPOQ,ADRBK2,AQP7,AQPEP, VSTM4,GYG2,HRASLS5,KCNIP2,MGC45800,MARC1,MTHFD1, OXCT1,PDE3B,PECR,PEX19,SIK2,SLC22A3,SORT1 | ||||
 |
| ||||
| CHMP4B,CUX1,GTF2IRD1,HECA,IRF2BP2,LOC100190939,LOC647979, LRRC36,MTIF3,NEK3,PAN3,POLR1D,RBM39,SHROOM4, SLC22A3,STK38,THSD1P1,TMC7,TMEM63A,TSC22D1,USPL1 | ABCC9,ATP2B3,NPR3,CD99L2,CLASP2,CNGA3,FRMD6, GFRA1,GLRB,HLF,KCNAB1,LGI2,MAGI2,MARK1, OSGIN2,PBX1,RHOJ,SCD5,SLC22A3,SOCS5,YAP1 |


| * Co-Expression network figures were drawn using R package igraph. Only the top 20 genes with the highest correlations were shown. Red circle: input gene, orange circle: cell metabolism gene, sky circle: other gene |
: Open all plots for all cancer types
| Top |
: Open all interacting genes' information including KEGG pathway for all interacting genes from DAVID
| Top |
| Pharmacological Information for SLC22A3 |
| DB Category | DB Name | DB's ID and Url link |
| * Gene Centered Interaction Network. |
 |
| * Drug Centered Interaction Network. |
| DrugBank ID | Target Name | Drug Groups | Generic Name | Drug Centered Network | Drug Structure |
| DB00331 | solute carrier family 22 (extraneuronal monoamine transporter), member 3 | approved | Metformin |  | 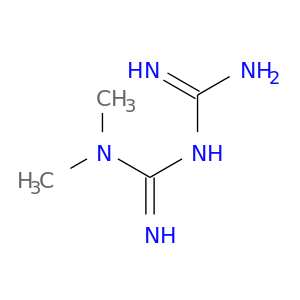 |
| DB00368 | solute carrier family 22 (extraneuronal monoamine transporter), member 3 | approved | Norepinephrine | 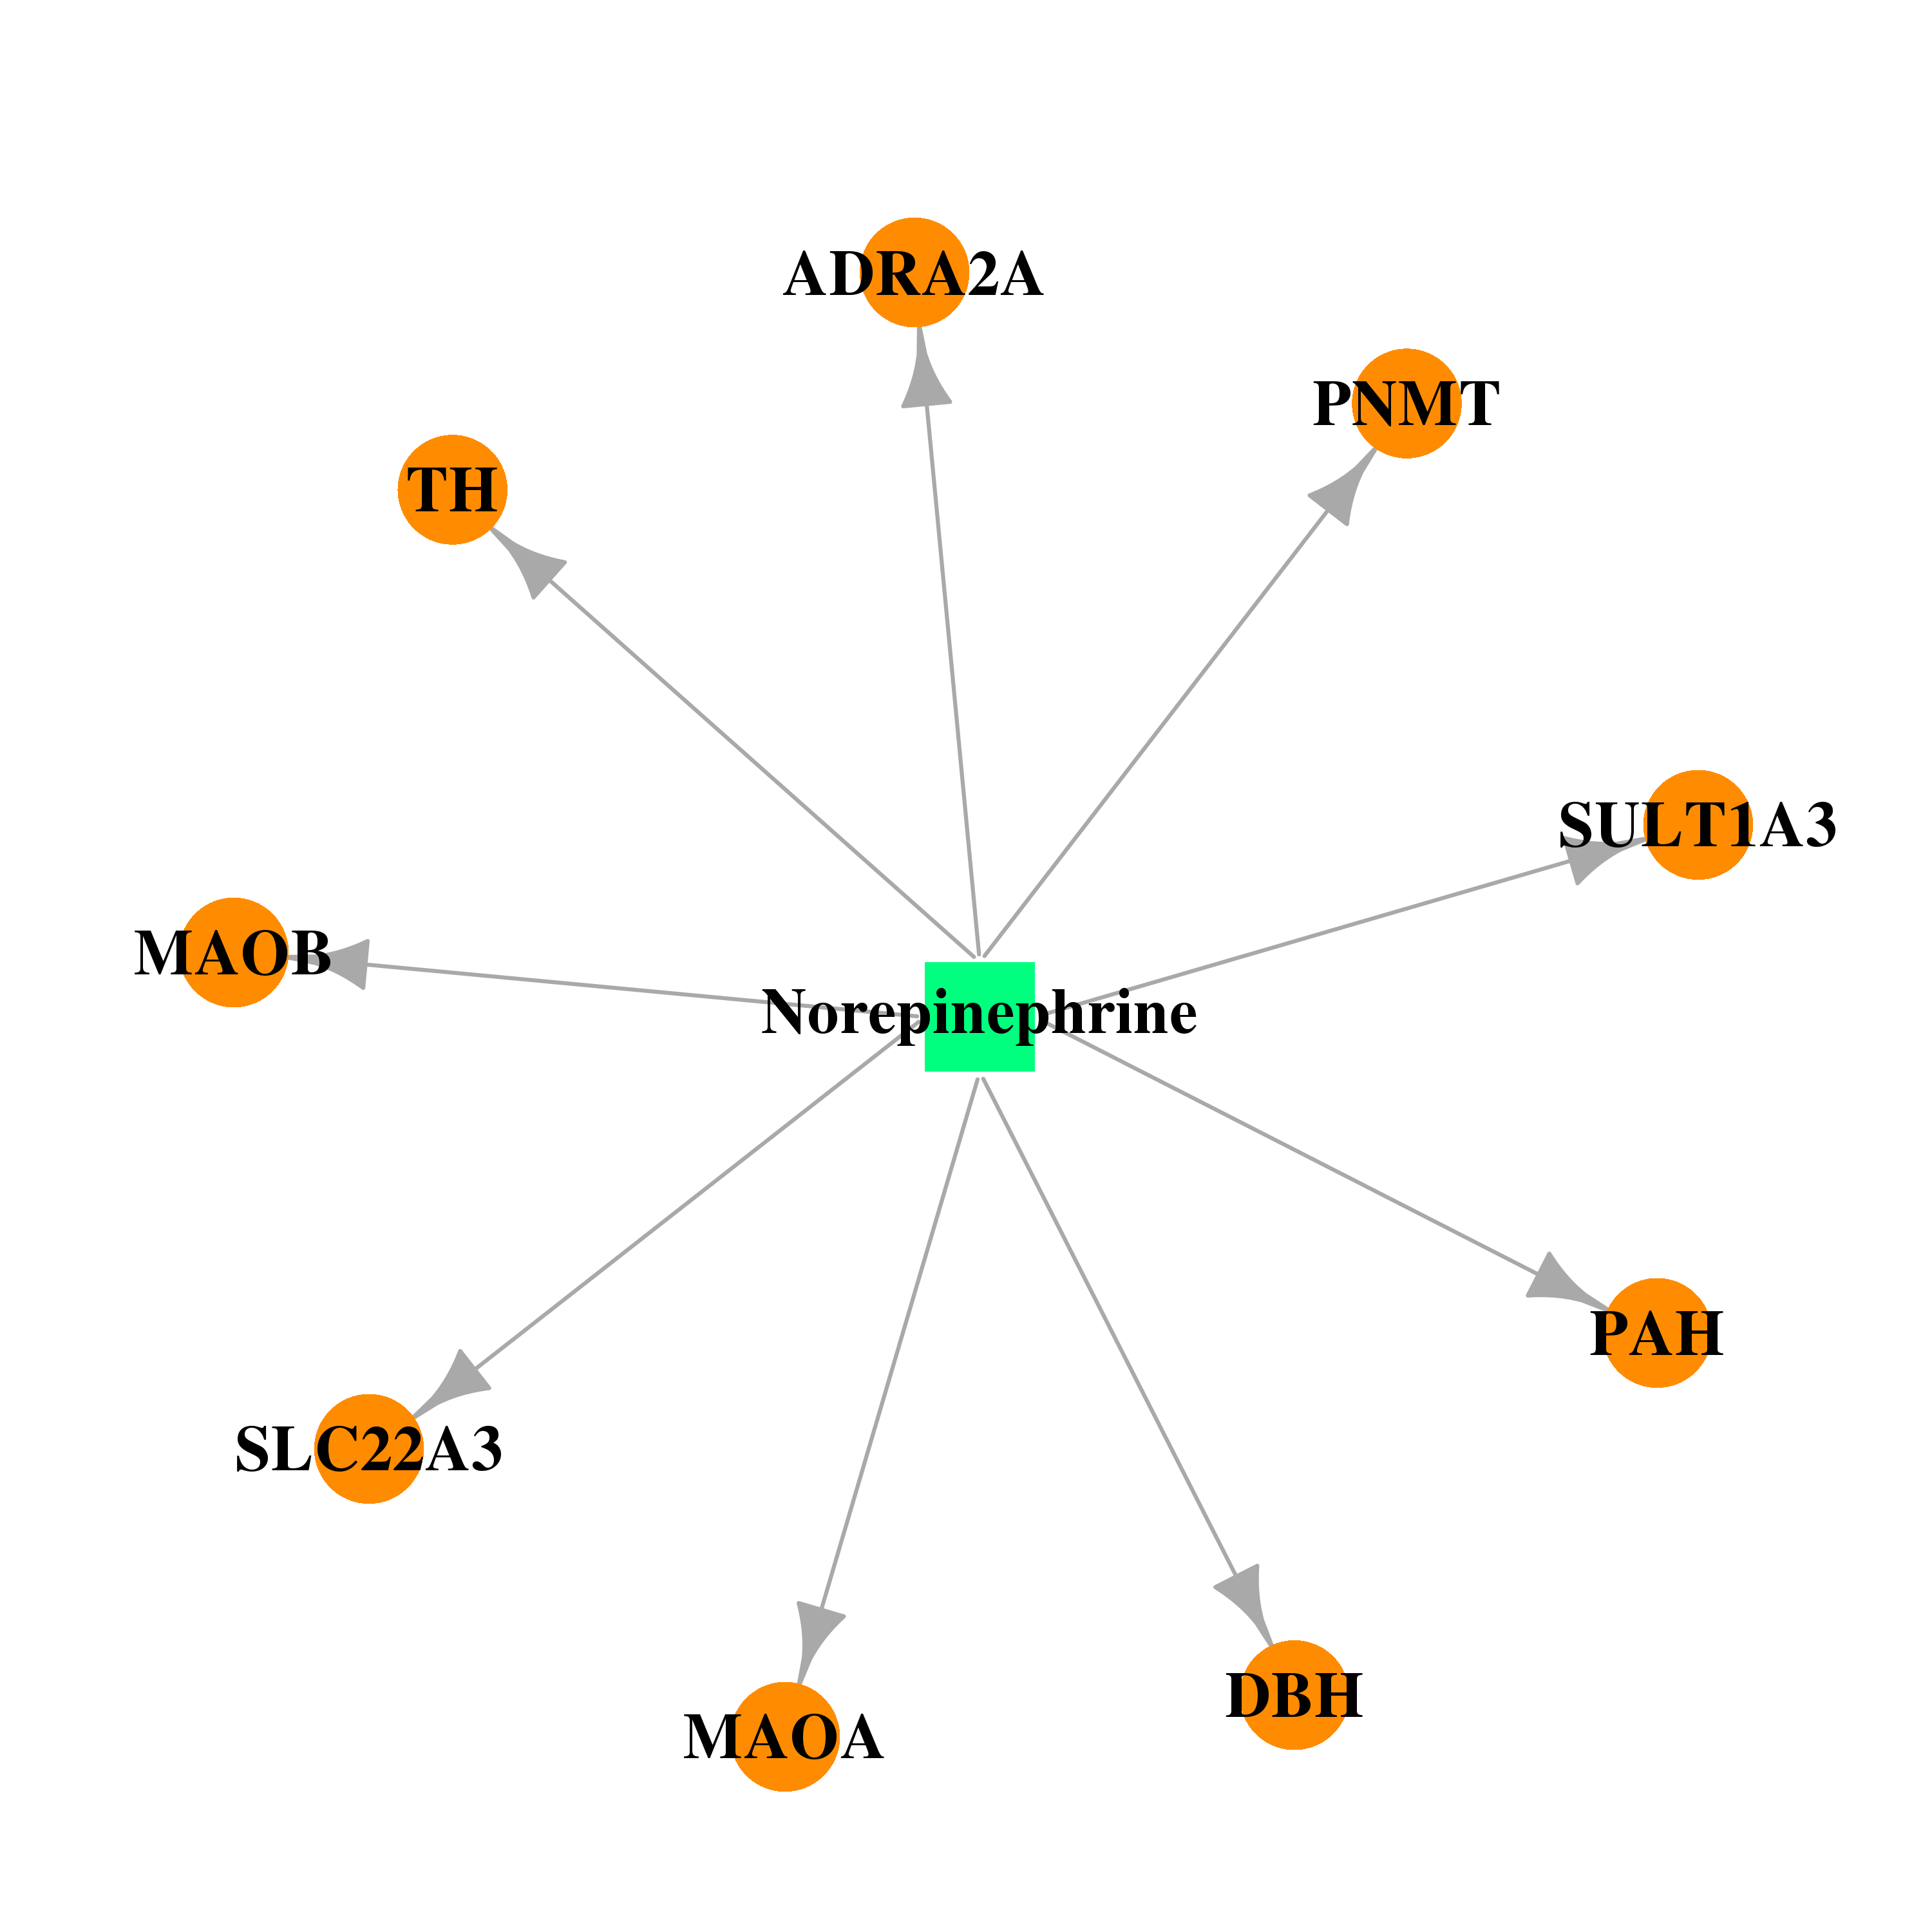 |  |
| DB00879 | solute carrier family 22 (extraneuronal monoamine transporter), member 3 | approved; investigational | Emtricitabine | 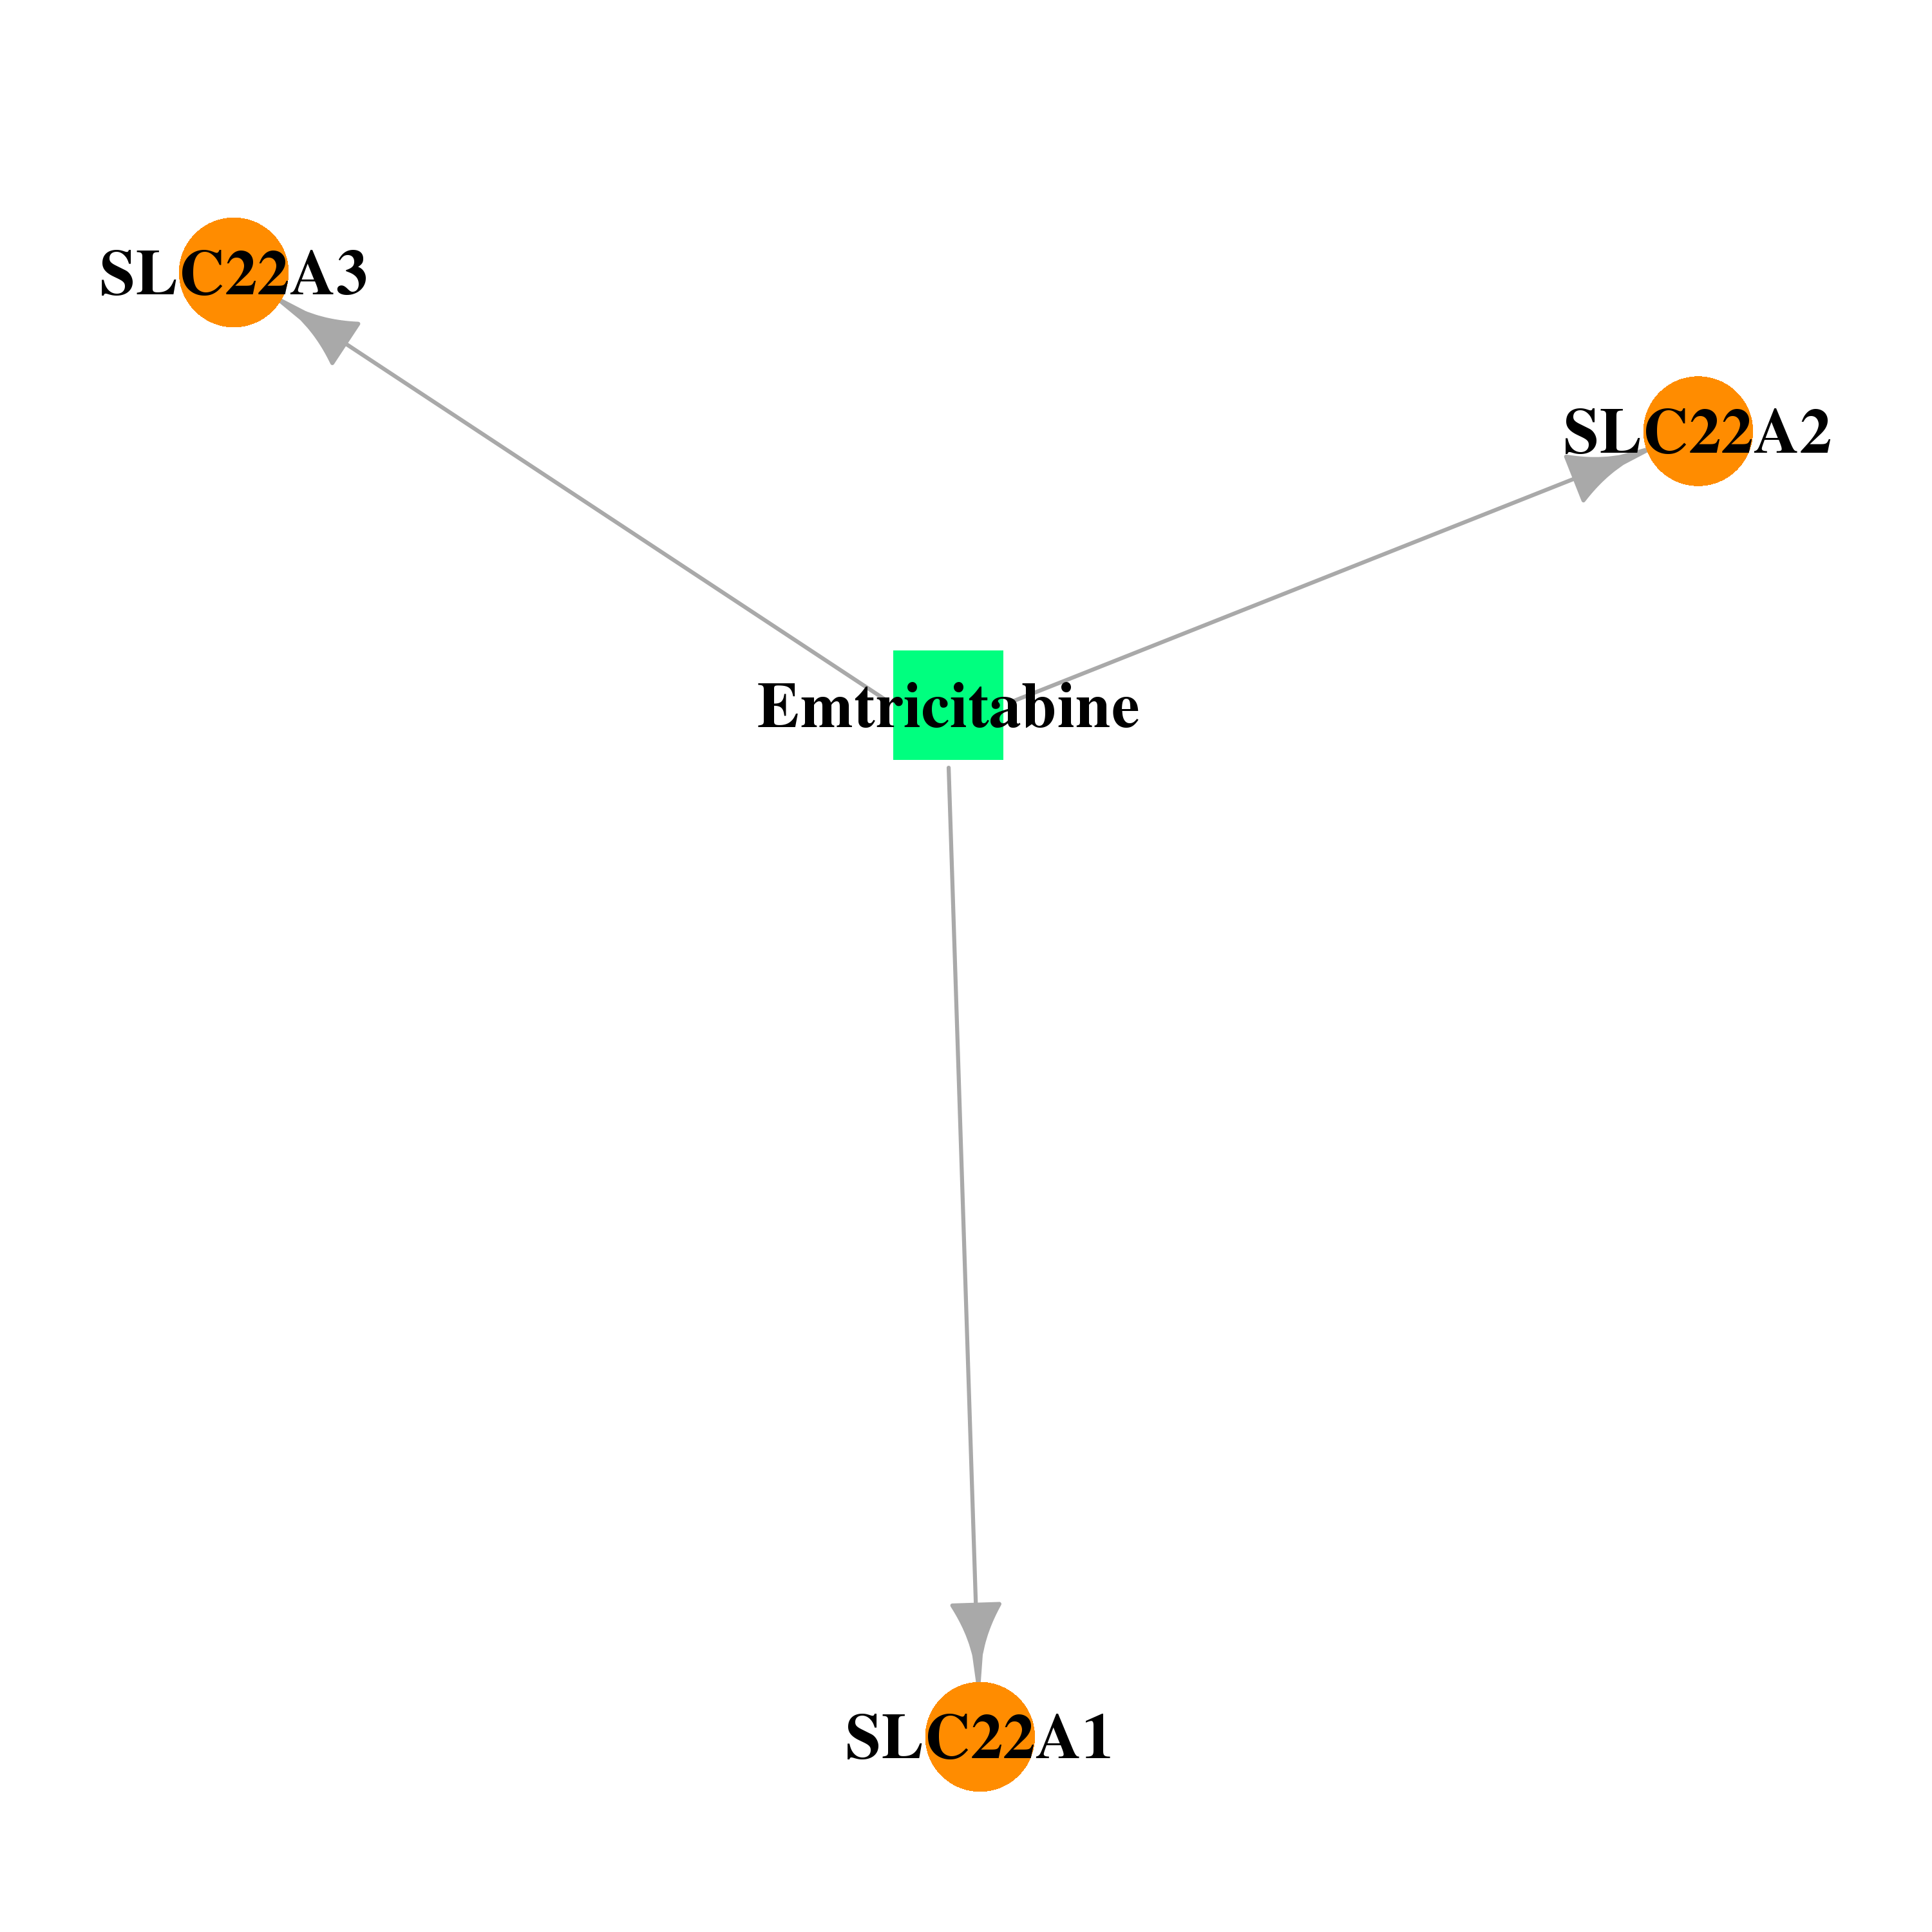 | 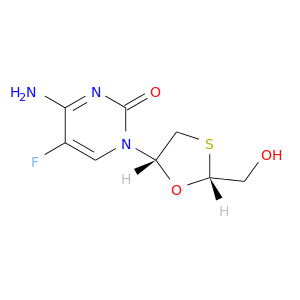 |
| DB00709 | solute carrier family 22 (extraneuronal monoamine transporter), member 3 | approved; investigational | Lamivudine |  | 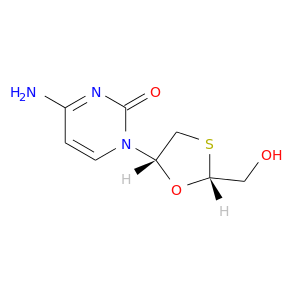 |
| DB00495 | solute carrier family 22 (extraneuronal monoamine transporter), member 3 | approved | Zidovudine | 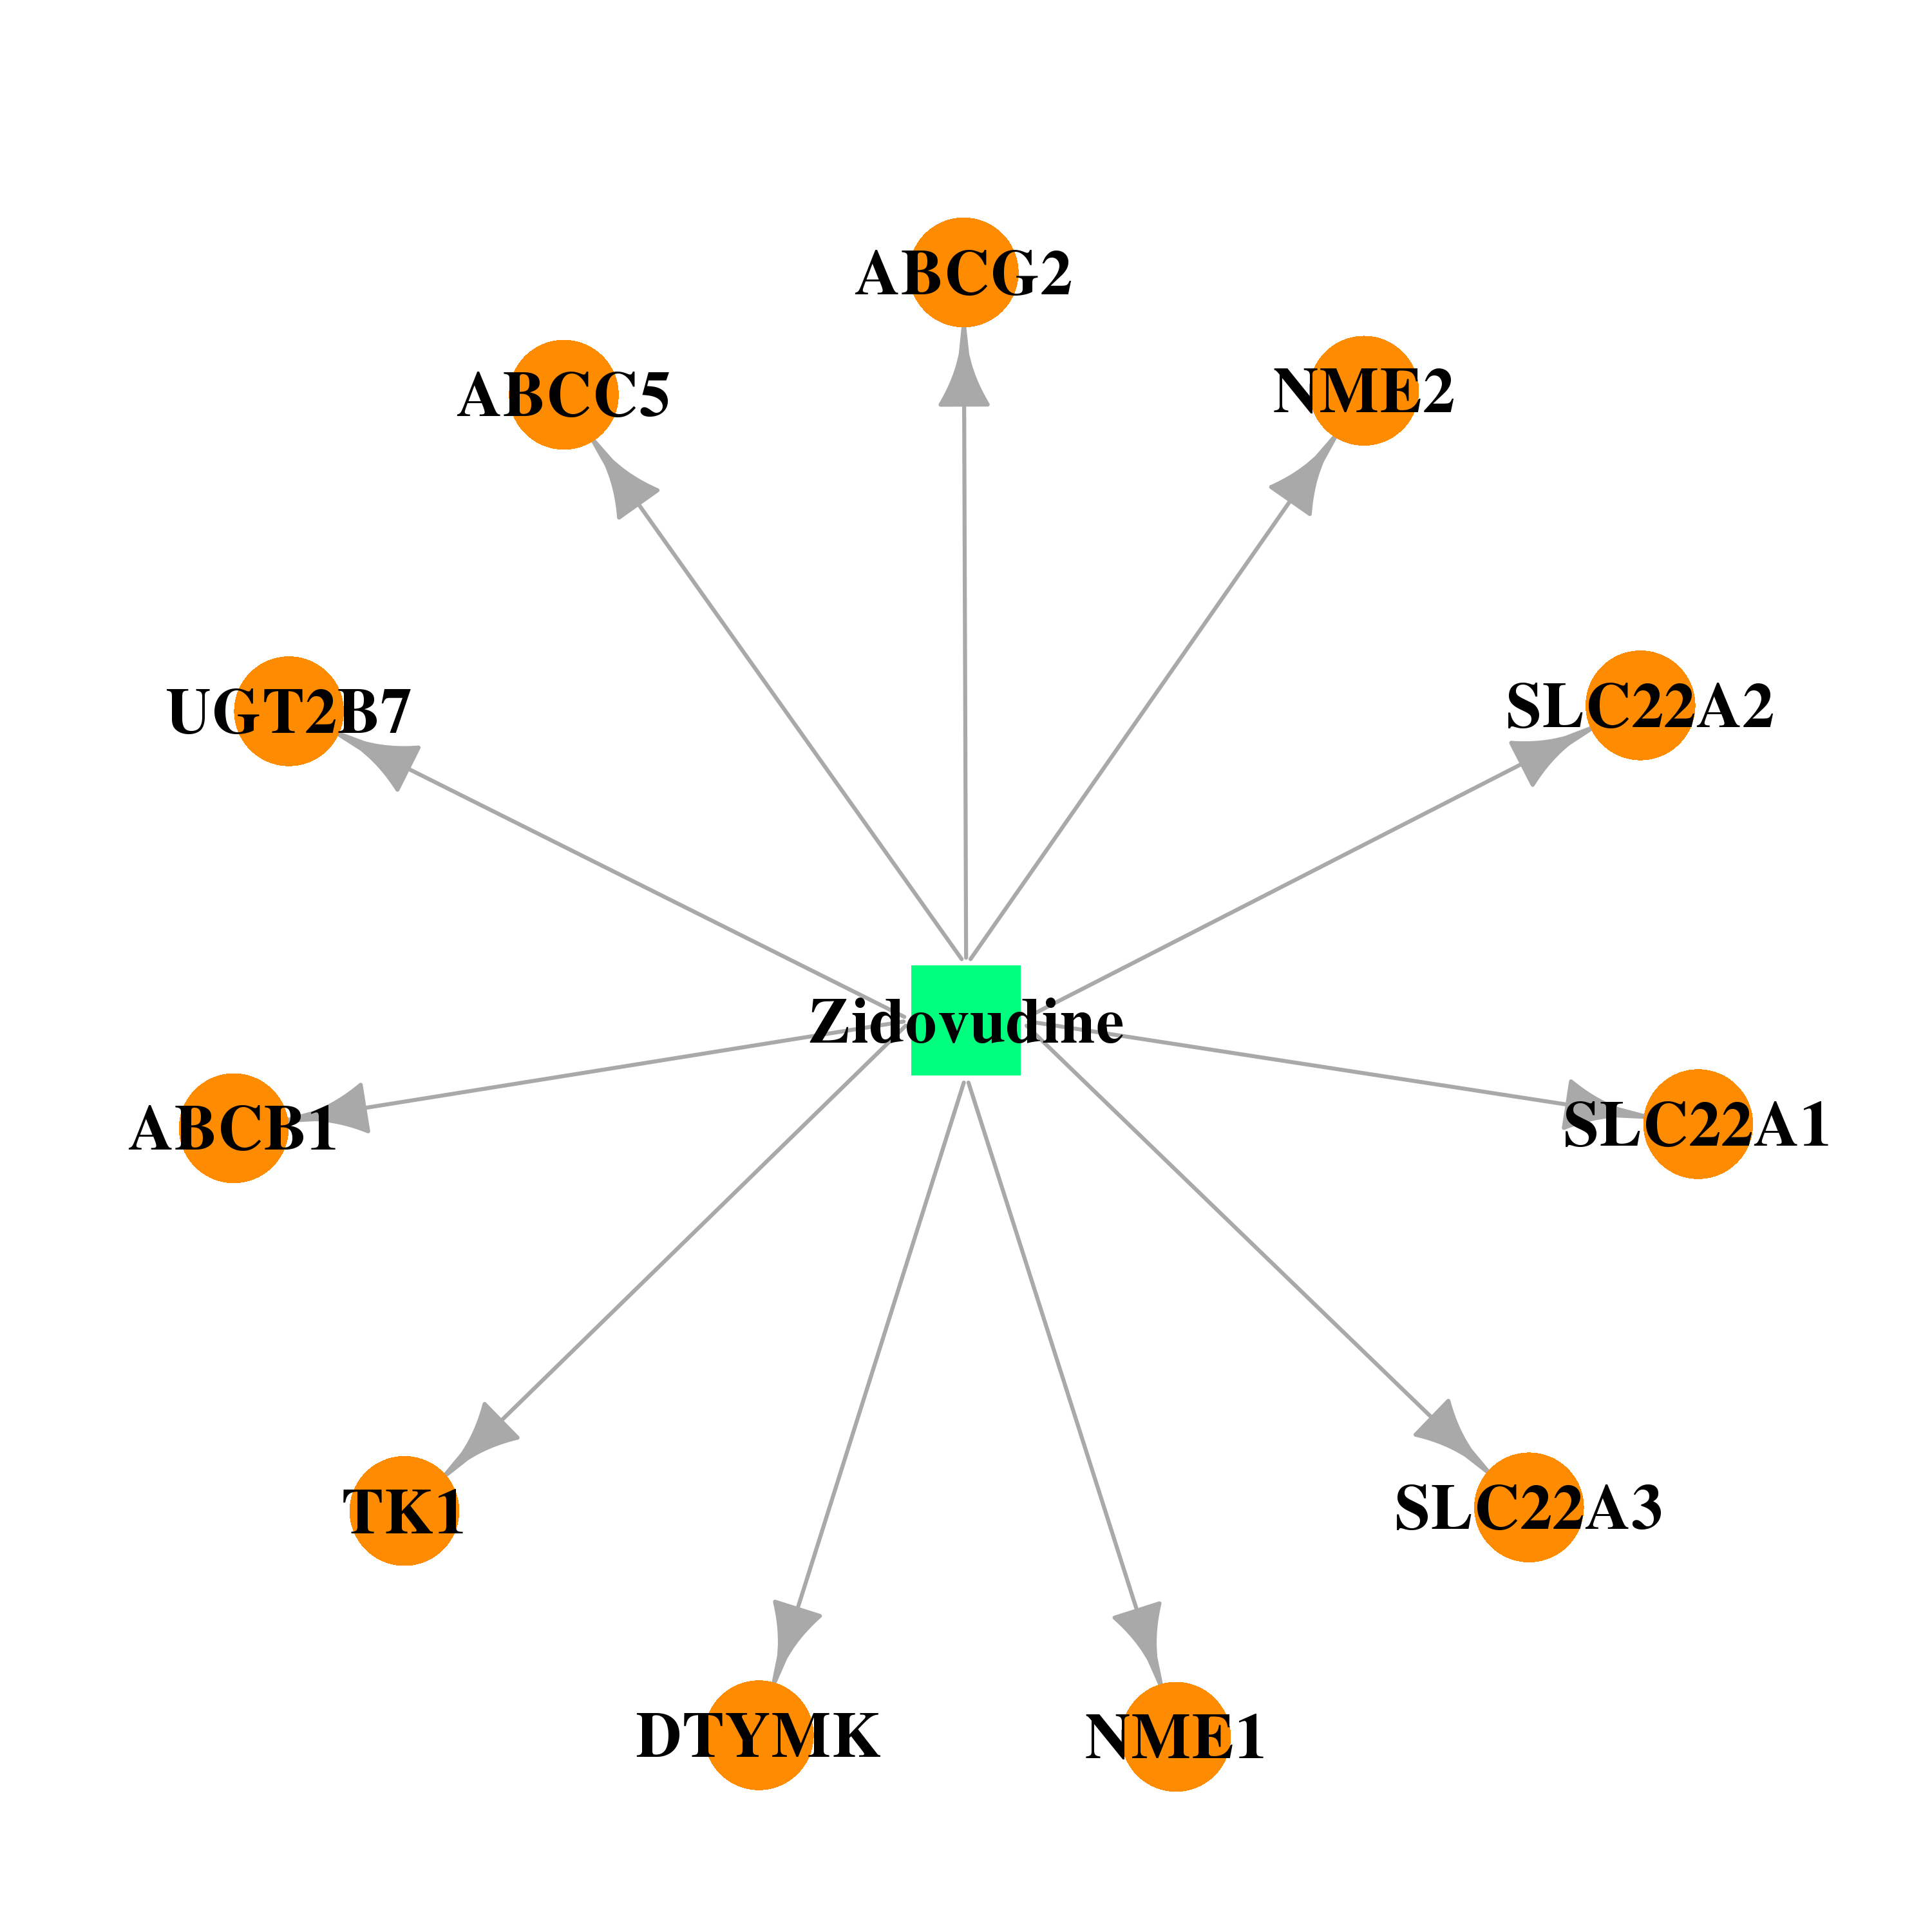 |  |
| Top |
| Cross referenced IDs for SLC22A3 |
| * We obtained these cross-references from Uniprot database. It covers 150 different DBs, 18 categories. http://www.uniprot.org/help/cross_references_section |
: Open all cross reference information
|
Copyright © 2016-Present - The Univsersity of Texas Health Science Center at Houston @ |