|
||||||||||||||||||||||||||||||||||||||||||||||||||||||||||||||||||||||||||||||||||||||||||||||||||||||||||||||||||||||||||||||||||||||||||||||||||||||||||||||||||||||||||||||||||||||||||||||||||||||||||||||||||||||||||||||||||||||||||||||||||||||||||||||||||||||||||||||||||||||||||||||||||||||||||||||||||||||||||
| |
| Phenotypic Information (metabolism pathway, cancer, disease, phenome) |
| |
| |
| Gene-Gene Network Information: Co-Expression Network, Interacting Genes & KEGG |
| |
|


| Gene Summary for AACS |
| Basic gene info. | Gene symbol | AACS |
| Gene name | acetoacetyl-CoA synthetase | |
| Synonyms | ACSF1|SUR-5 | |
| Cytomap | UCSC genome browser: 12q24.31 | |
| Genomic location | chr12 :125549924-125627871 | |
| Type of gene | protein-coding | |
| RefGenes | NM_023928.3, | |
| Ensembl id | ENSG00000081760 | |
| Description | acetoacetate-CoA ligaseacyl-CoA synthetase family member 1homolog of C. elegans supressor of ras 5 (sur-5)protein sur-5 homolog | |
| Modification date | 20141207 | |
| dbXrefs | MIM : 614364 | |
| HGNC : HGNC | ||
| Ensembl : ENSG00000081760 | ||
| HPRD : 12391 | ||
| Vega : OTTHUMG00000168550 | ||
| Protein | UniProt: Q86V21 go to UniProt's Cross Reference DB Table | |
| Expression | CleanEX: HS_AACS | |
| BioGPS: 65985 | ||
| Gene Expression Atlas: ENSG00000081760 | ||
| The Human Protein Atlas: ENSG00000081760 | ||
| Pathway | NCI Pathway Interaction Database: AACS | |
| KEGG: AACS | ||
| REACTOME: AACS | ||
| ConsensusPathDB | ||
| Pathway Commons: AACS | ||
| Metabolism | MetaCyc: AACS | |
| HUMANCyc: AACS | ||
| Regulation | Ensembl's Regulation: ENSG00000081760 | |
| miRBase: chr12 :125,549,924-125,627,871 | ||
| TargetScan: NM_023928 | ||
| cisRED: ENSG00000081760 | ||
| Context | iHOP: AACS | |
| cancer metabolism search in PubMed: AACS | ||
| UCL Cancer Institute: AACS | ||
| Assigned class in ccmGDB | B - This gene belongs to cancer gene. | |
| Top |
| Phenotypic Information for AACS(metabolism pathway, cancer, disease, phenome) |
| Cancer | CGAP: AACS |
| Familial Cancer Database: AACS | |
| * This gene is included in those cancer gene databases. |
|
|
|
|
|
| . | ||||||||||||||||||||||||||||||||||||||||||||||||||||||||||||||||||||||||||||||||||||||||||||||||||||||||||||||||||||||||||||||||||||||||||||||||||||||||||||||||||||||||||||||||||||||||||||||||||||||||||||||||||||||||||||||||||||||||||||||||||||||||||||||||||||||||||||||||||||||||||||||||||||||||||||||||||||
Oncogene 1 | Significant driver gene in | |||||||||||||||||||||||||||||||||||||||||||||||||||||||||||||||||||||||||||||||||||||||||||||||||||||||||||||||||||||||||||||||||||||||||||||||||||||||||||||||||||||||||||||||||||||||||||||||||||||||||||||||||||||||||||||||||||||||||||||||||||||||||||||||||||||||||||||||||||||||||||||||||||||||||||||||||||||||||
| cf) number; DB name 1 Oncogene; http://nar.oxfordjournals.org/content/35/suppl_1/D721.long, 2 Tumor Suppressor gene; https://bioinfo.uth.edu/TSGene/, 3 Cancer Gene Census; http://www.nature.com/nrc/journal/v4/n3/abs/nrc1299.html, 4 CancerGenes; http://nar.oxfordjournals.org/content/35/suppl_1/D721.long, 5 Network of Cancer Gene; http://ncg.kcl.ac.uk/index.php, 1Therapeutic Vulnerabilities in Cancer; http://cbio.mskcc.org/cancergenomics/statius/ |
| KEGG_BUTANOATE_METABOLISM | |
| OMIM | 614364; gene. 614364; gene. |
| Orphanet | |
| Disease | KEGG Disease: AACS |
| MedGen: AACS (Human Medical Genetics with Condition) | |
| ClinVar: AACS | |
| Phenotype | MGI: AACS (International Mouse Phenotyping Consortium) |
| PhenomicDB: AACS | |
| Mutations for AACS |
| * Under tables are showing count per each tissue to give us broad intuition about tissue specific mutation patterns.You can go to the detailed page for each mutation database's web site. |
| - Statistics for Tissue and Mutation type | Top |
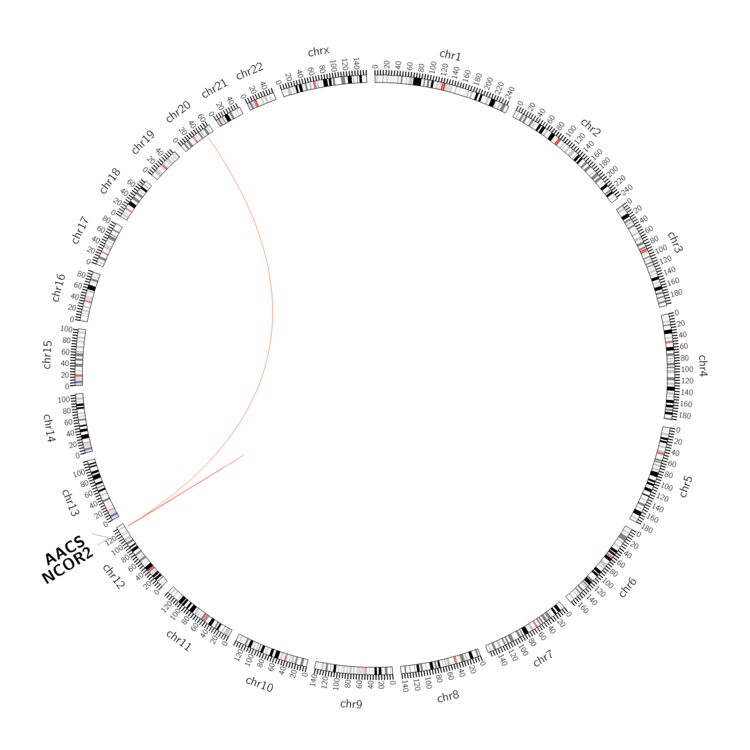 |
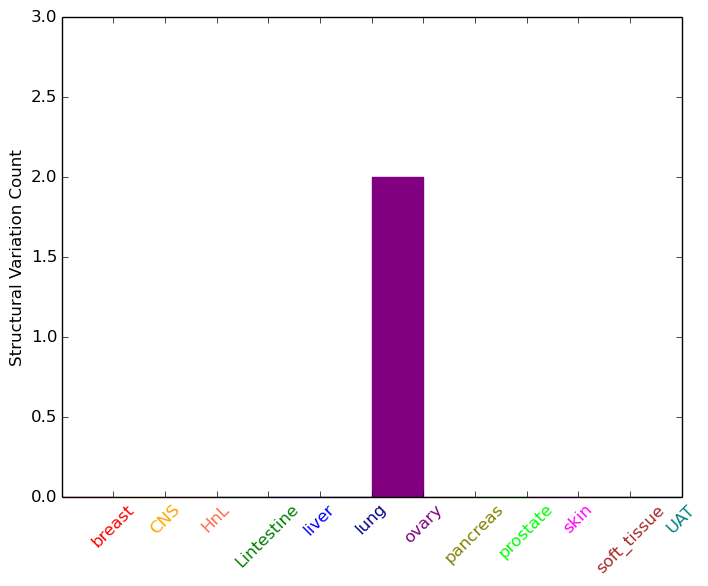
| - For Inter-chromosomal Variations |
| * Inter-chromosomal variantions includes 'interchromosomal amplicon to amplicon', 'interchromosomal amplicon to non-amplified dna', 'interchromosomal insertion', 'Interchromosomal unknown type'. |
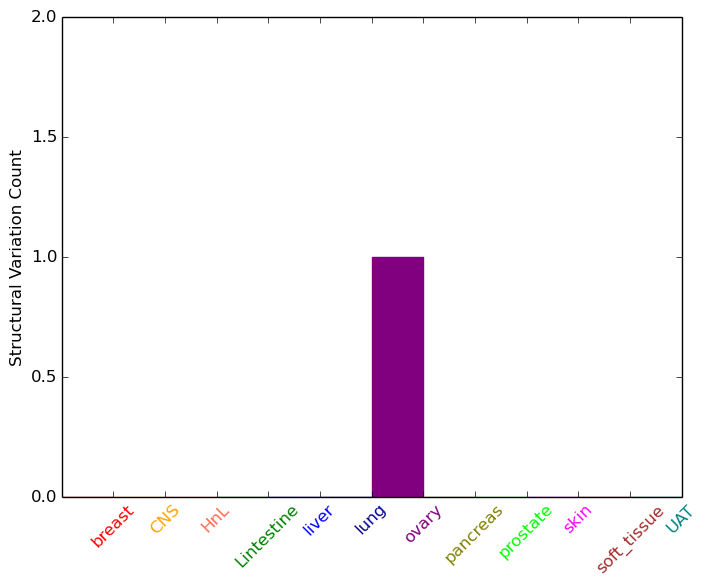 |
| - For Intra-chromosomal Variations |
| * Intra-chromosomal variantions includes 'intrachromosomal amplicon to amplicon', 'intrachromosomal amplicon to non-amplified dna', 'intrachromosomal deletion', 'intrachromosomal fold-back inversion', 'intrachromosomal inversion', 'intrachromosomal tandem duplication', 'Intrachromosomal unknown type', 'intrachromosomal with inverted orientation', 'intrachromosomal with non-inverted orientation'. |
 |
| Sample | Symbol_a | Chr_a | Start_a | End_a | Symbol_b | Chr_b | Start_b | End_b |
| ovary | AACS | chr12 | 125579304 | 125579324 | chr20 | 48683506 | 48683526 | |
| ovary | AACS | chr12 | 125604718 | 125604738 | NCOR2 | chr12 | 124898815 | 124898835 |
| cf) Tissue number; Tissue name (1;Breast, 2;Central_nervous_system, 3;Haematopoietic_and_lymphoid_tissue, 4;Large_intestine, 5;Liver, 6;Lung, 7;Ovary, 8;Pancreas, 9;Prostate, 10;Skin, 11;Soft_tissue, 12;Upper_aerodigestive_tract) |
| * From mRNA Sanger sequences, Chitars2.0 arranged chimeric transcripts. This table shows AACS related fusion information. |
| ID | Head Gene | Tail Gene | Accession | Gene_a | qStart_a | qEnd_a | Chromosome_a | tStart_a | tEnd_a | Gene_a | qStart_a | qEnd_a | Chromosome_a | tStart_a | tEnd_a |
| AI962214 | PLXND1 | 15 | 272 | 3 | 129274057 | 129274314 | AACS | 267 | 332 | 12 | 125549997 | 125550062 | |
| BF993118 | AACS | 5 | 184 | 12 | 125591570 | 125591751 | FBN1 | 181 | 277 | 15 | 48807741 | 48807837 | |
| Top |
| Mutation type/ Tissue ID | brca | cns | cerv | endome | haematopo | kidn | Lintest | liver | lung | ns | ovary | pancre | prost | skin | stoma | thyro | urina | |||
| Total # sample | 2 | 1 | ||||||||||||||||||
| GAIN (# sample) | 2 | 1 | ||||||||||||||||||
| LOSS (# sample) |
| cf) Tissue ID; Tissue type (1; Breast, 2; Central_nervous_system, 3; Cervix, 4; Endometrium, 5; Haematopoietic_and_lymphoid_tissue, 6; Kidney, 7; Large_intestine, 8; Liver, 9; Lung, 10; NS, 11; Ovary, 12; Pancreas, 13; Prostate, 14; Skin, 15; Stomach, 16; Thyroid, 17; Urinary_tract) |
| Top |
|
 |
| Top |
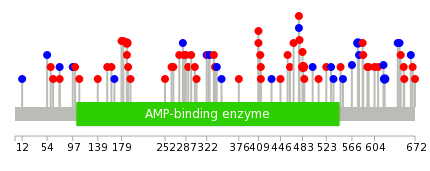
| Stat. for Non-Synonymous SNVs (# total SNVs=45) | (# total SNVs=16) |
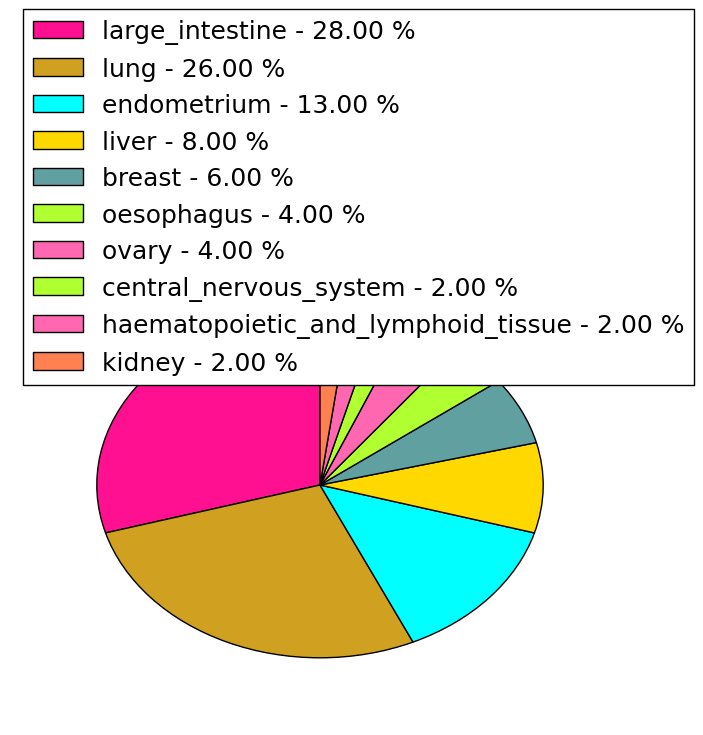 | 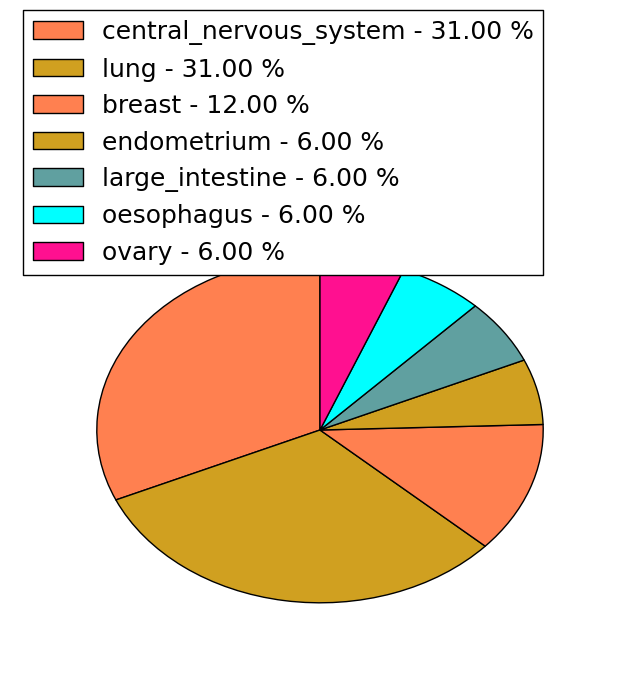 |
(# total SNVs=2) | (# total SNVs=0) |
 |
| Top |
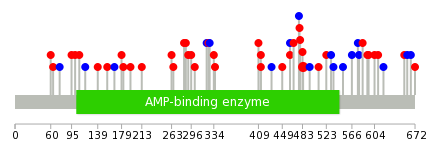
| * When you move the cursor on each content, you can see more deailed mutation information on the Tooltip. Those are primary_site,primary_histology,mutation(aa),pubmedID. |
| GRCh37 position | Mutation(aa) | Unique sampleID count |
| chr12:125613907-125613907 | p.E484K | 3 |
| chr12:125576062-125576062 | p.G188V | 2 |
| chr12:125558421-125558421 | p.? | 2 |
| chr12:125609487-125609487 | p.S409F | 2 |
| chr12:125609498-125609498 | p.P413S | 2 |
| chr12:125621392-125621392 | p.L621L | 2 |
| chr12:125621257-125621257 | p.N576N | 2 |
| chr12:125613986-125613986 | p.A510V | 1 |
| chr12:125591750-125591750 | p.P284Q | 1 |
| chr12:125603207-125603207 | p.N339N | 1 |
| Top |
|
 |
| Point Mutation/ Tissue ID | 1 | 2 | 3 | 4 | 5 | 6 | 7 | 8 | 9 | 10 | 11 | 12 | 13 | 14 | 15 | 16 | 17 | 18 | 19 | 20 |
| # sample | 2 | 7 | 3 | 1 | 12 | 3 | 1 | 9 | 7 | 6 | ||||||||||
| # mutation | 2 | 7 | 3 | 1 | 13 | 3 | 1 | 12 | 9 | 6 | ||||||||||
| nonsynonymous SNV | 2 | 6 | 1 | 1 | 8 | 2 | 1 | 6 | 8 | 5 | ||||||||||
| synonymous SNV | 1 | 2 | 6 | 1 | 6 | 1 | 1 |
| cf) Tissue ID; Tissue type (1; BLCA[Bladder Urothelial Carcinoma], 2; BRCA[Breast invasive carcinoma], 3; CESC[Cervical squamous cell carcinoma and endocervical adenocarcinoma], 4; COAD[Colon adenocarcinoma], 5; GBM[Glioblastoma multiforme], 6; Glioma Low Grade, 7; HNSC[Head and Neck squamous cell carcinoma], 8; KICH[Kidney Chromophobe], 9; KIRC[Kidney renal clear cell carcinoma], 10; KIRP[Kidney renal papillary cell carcinoma], 11; LAML[Acute Myeloid Leukemia], 12; LUAD[Lung adenocarcinoma], 13; LUSC[Lung squamous cell carcinoma], 14; OV[Ovarian serous cystadenocarcinoma ], 15; PAAD[Pancreatic adenocarcinoma], 16; PRAD[Prostate adenocarcinoma], 17; SKCM[Skin Cutaneous Melanoma], 18:STAD[Stomach adenocarcinoma], 19:THCA[Thyroid carcinoma], 20:UCEC[Uterine Corpus Endometrial Carcinoma]) |
| Top |
| * We represented just top 10 SNVs. When you move the cursor on each content, you can see more deailed mutation information on the Tooltip. Those are primary_site, primary_histology, mutation(aa), pubmedID. |
| Genomic Position | Mutation(aa) | Unique sampleID count |
| chr12:125613907 | p.E484K | 3 |
| chr12:125612781 | p.P413T | 2 |
| chr12:125609498 | p.R462R | 2 |
| chr12:125609554 | p.S409F | 1 |
| chr12:125618566 | p.F551F | 1 |
| chr12:125570932 | p.I179M | 1 |
| chr12:125621357 | p.V566V | 1 |
| chr12:125591771 | p.S182T | 1 |
| chr12:125612743 | p.L431L | 1 |
| chr12:125618592 | p.N576N | 1 |
| * Copy number data were extracted from TCGA using R package TCGA-Assembler. The URLs of all public data files on TCGA DCC data server were gathered on Jan-05-2015. Function ProcessCNAData in TCGA-Assembler package was used to obtain gene-level copy number value which is calculated as the average copy number of the genomic region of a gene. |
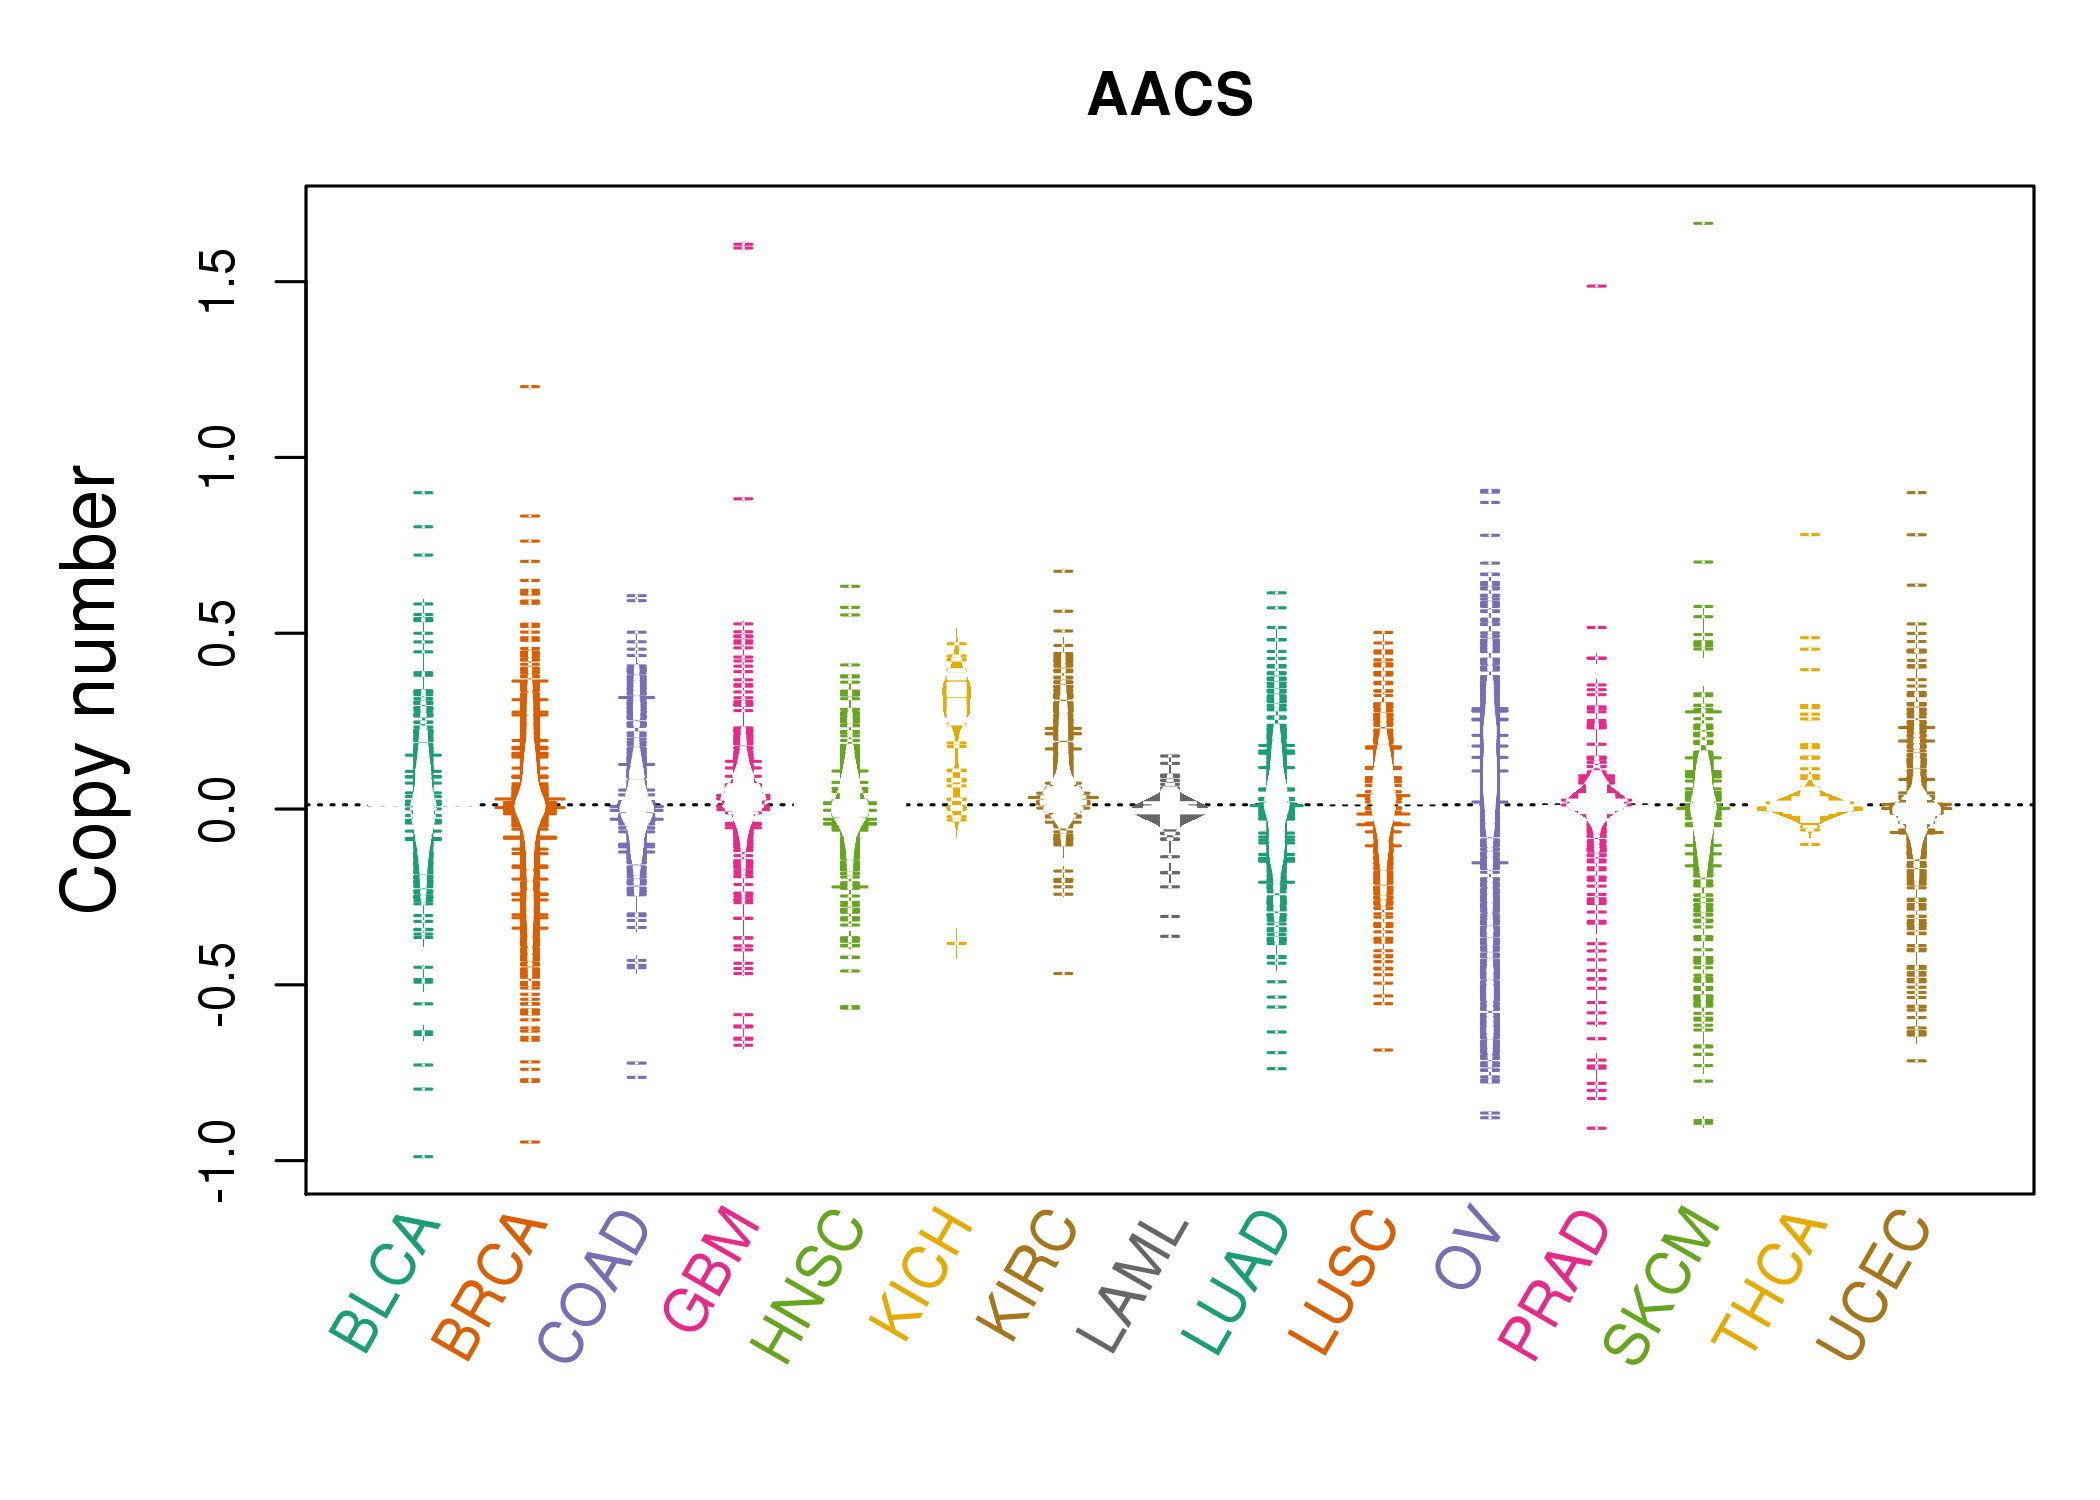 |
| cf) Tissue ID[Tissue type]: BLCA[Bladder Urothelial Carcinoma], BRCA[Breast invasive carcinoma], CESC[Cervical squamous cell carcinoma and endocervical adenocarcinoma], COAD[Colon adenocarcinoma], GBM[Glioblastoma multiforme], Glioma Low Grade, HNSC[Head and Neck squamous cell carcinoma], KICH[Kidney Chromophobe], KIRC[Kidney renal clear cell carcinoma], KIRP[Kidney renal papillary cell carcinoma], LAML[Acute Myeloid Leukemia], LUAD[Lung adenocarcinoma], LUSC[Lung squamous cell carcinoma], OV[Ovarian serous cystadenocarcinoma ], PAAD[Pancreatic adenocarcinoma], PRAD[Prostate adenocarcinoma], SKCM[Skin Cutaneous Melanoma], STAD[Stomach adenocarcinoma], THCA[Thyroid carcinoma], UCEC[Uterine Corpus Endometrial Carcinoma] |
| Top |
| Gene Expression for AACS |
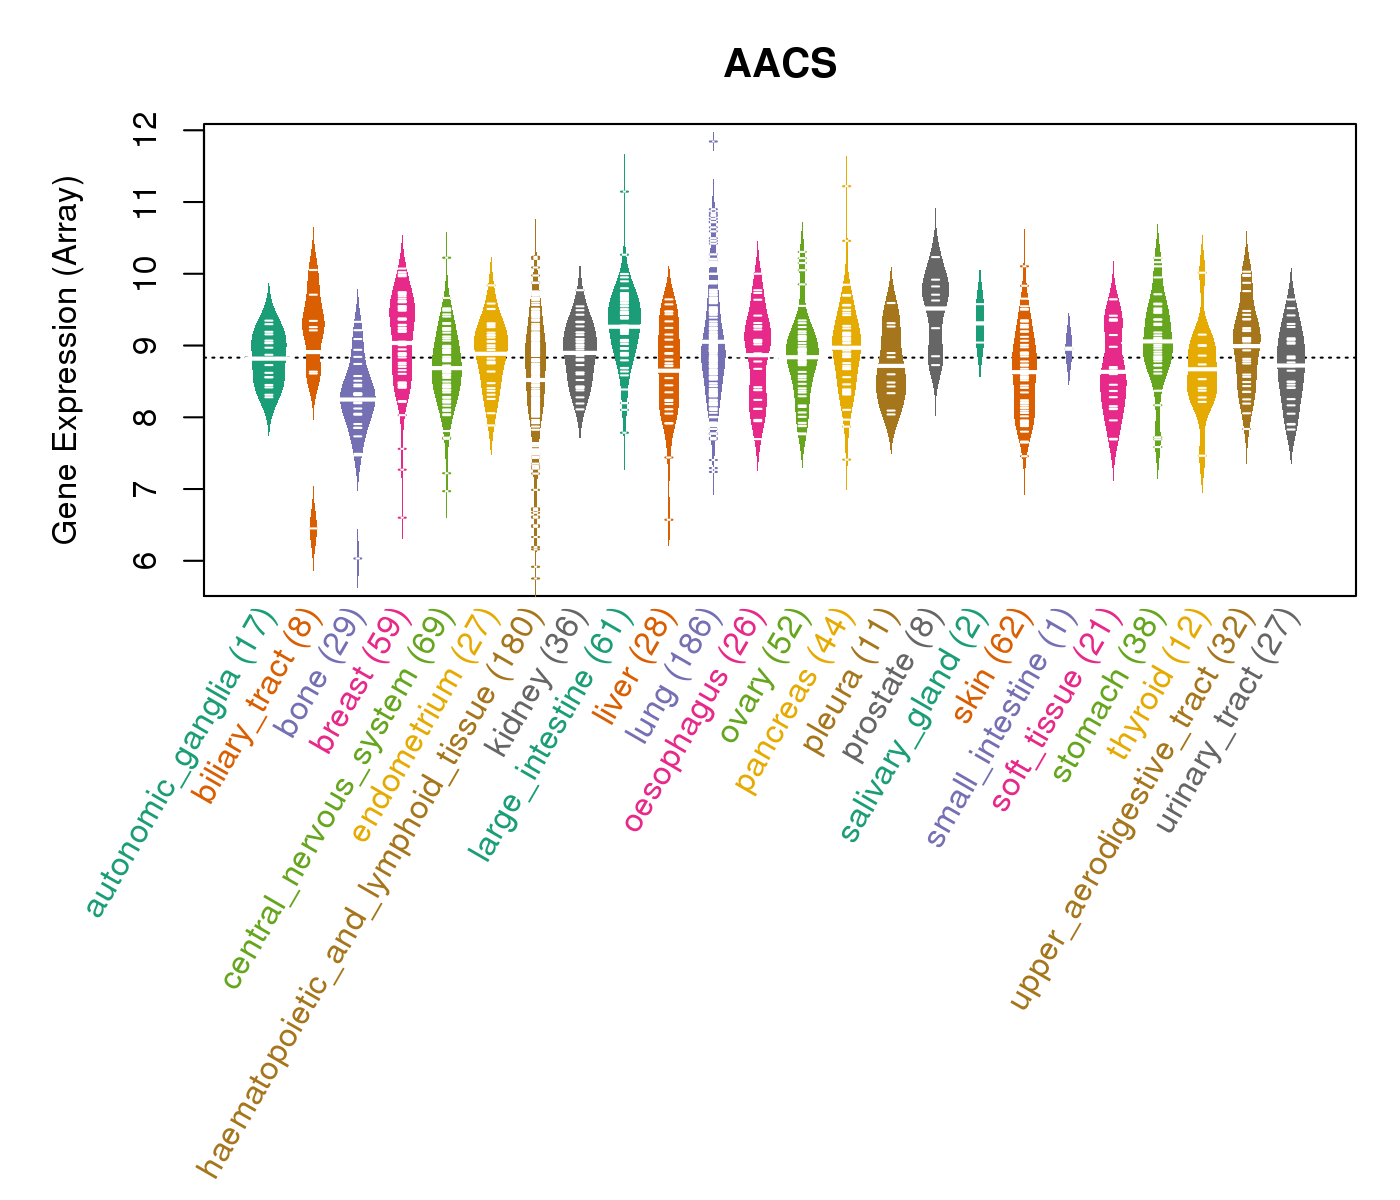
| * CCLE gene expression data were extracted from CCLE_Expression_Entrez_2012-10-18.res: Gene-centric RMA-normalized mRNA expression data. |
 |
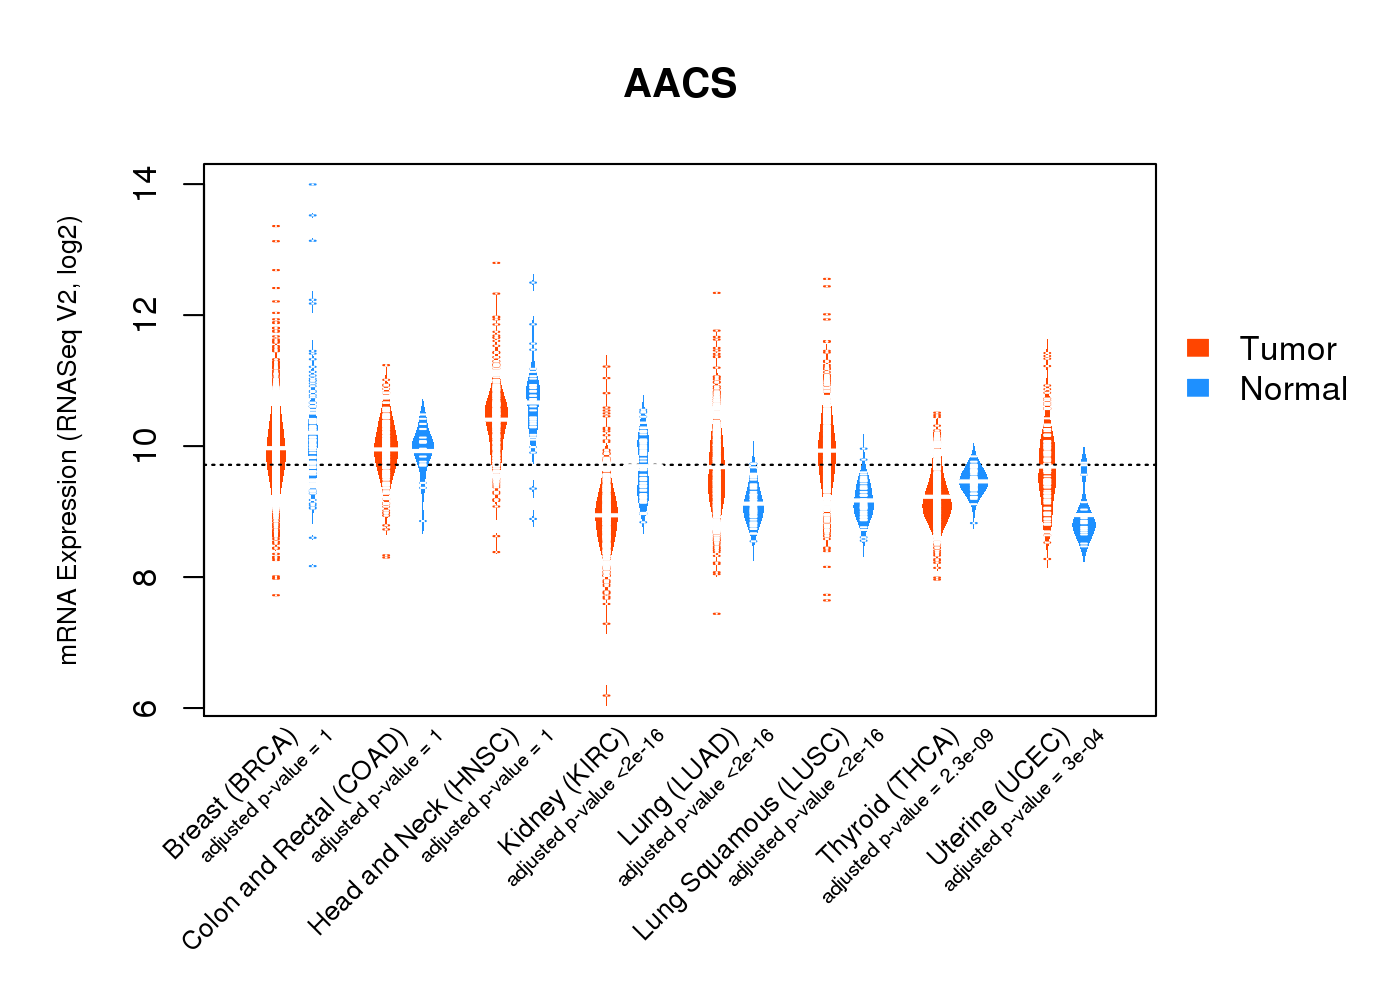
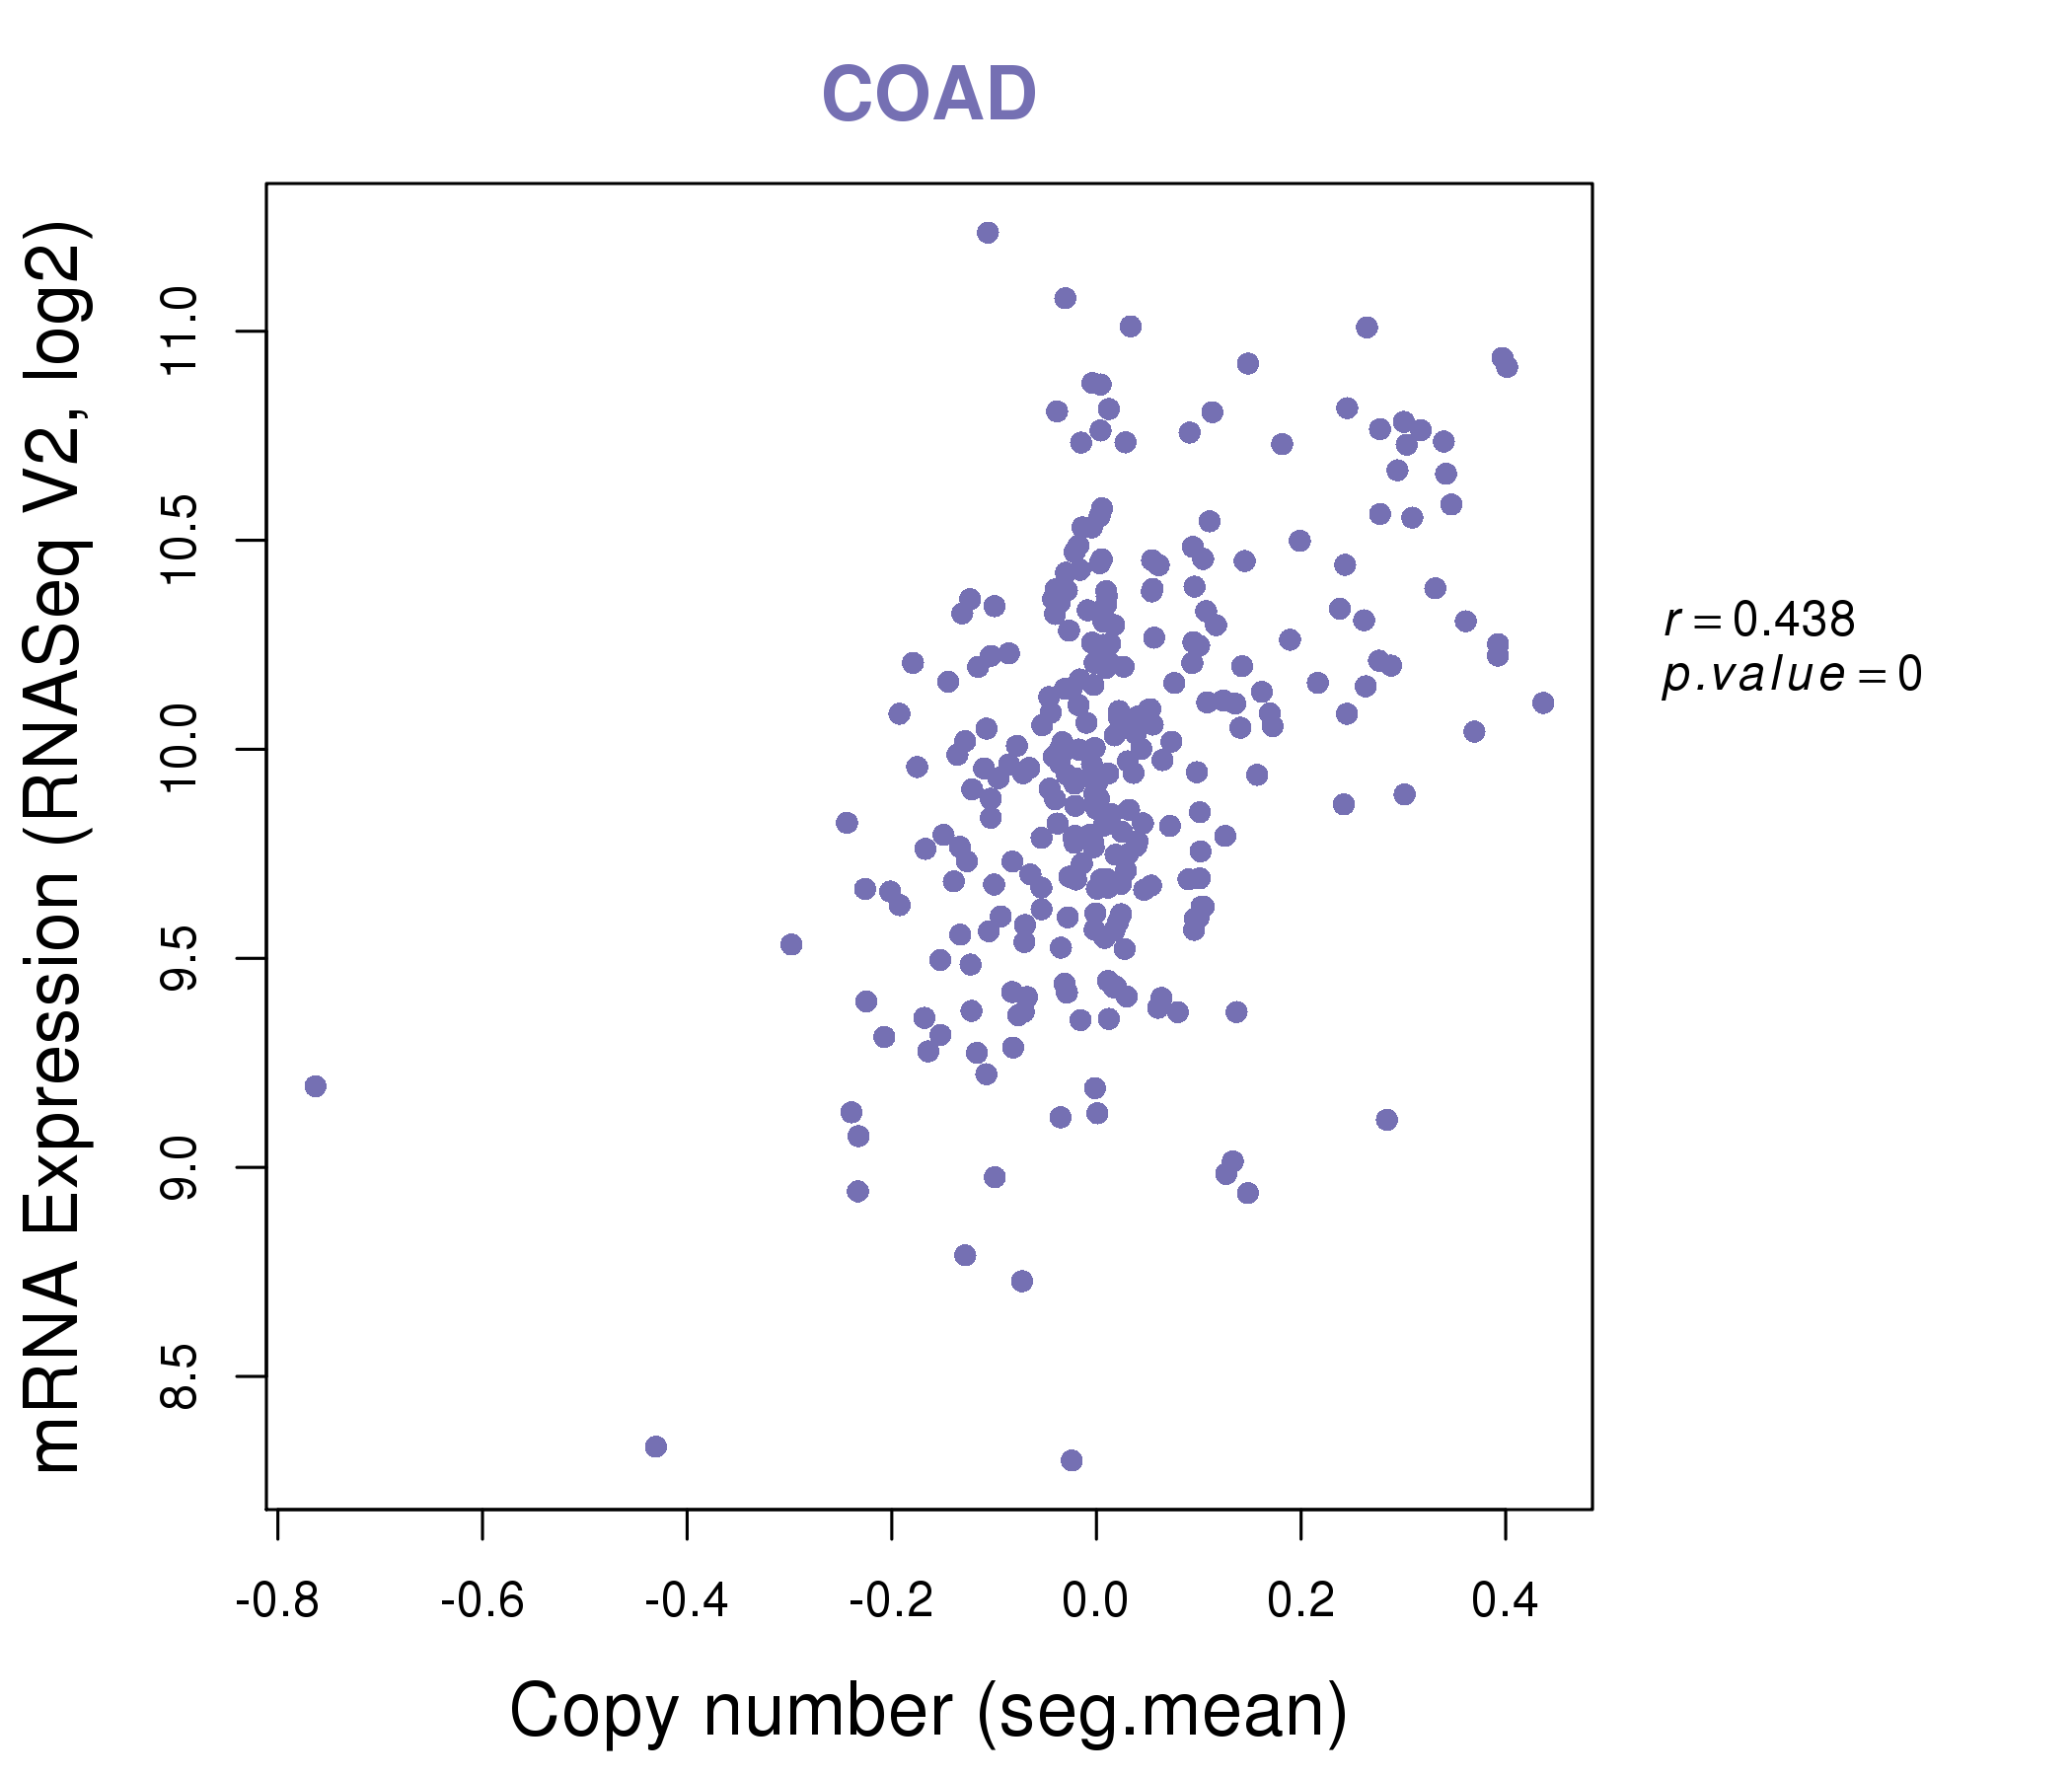
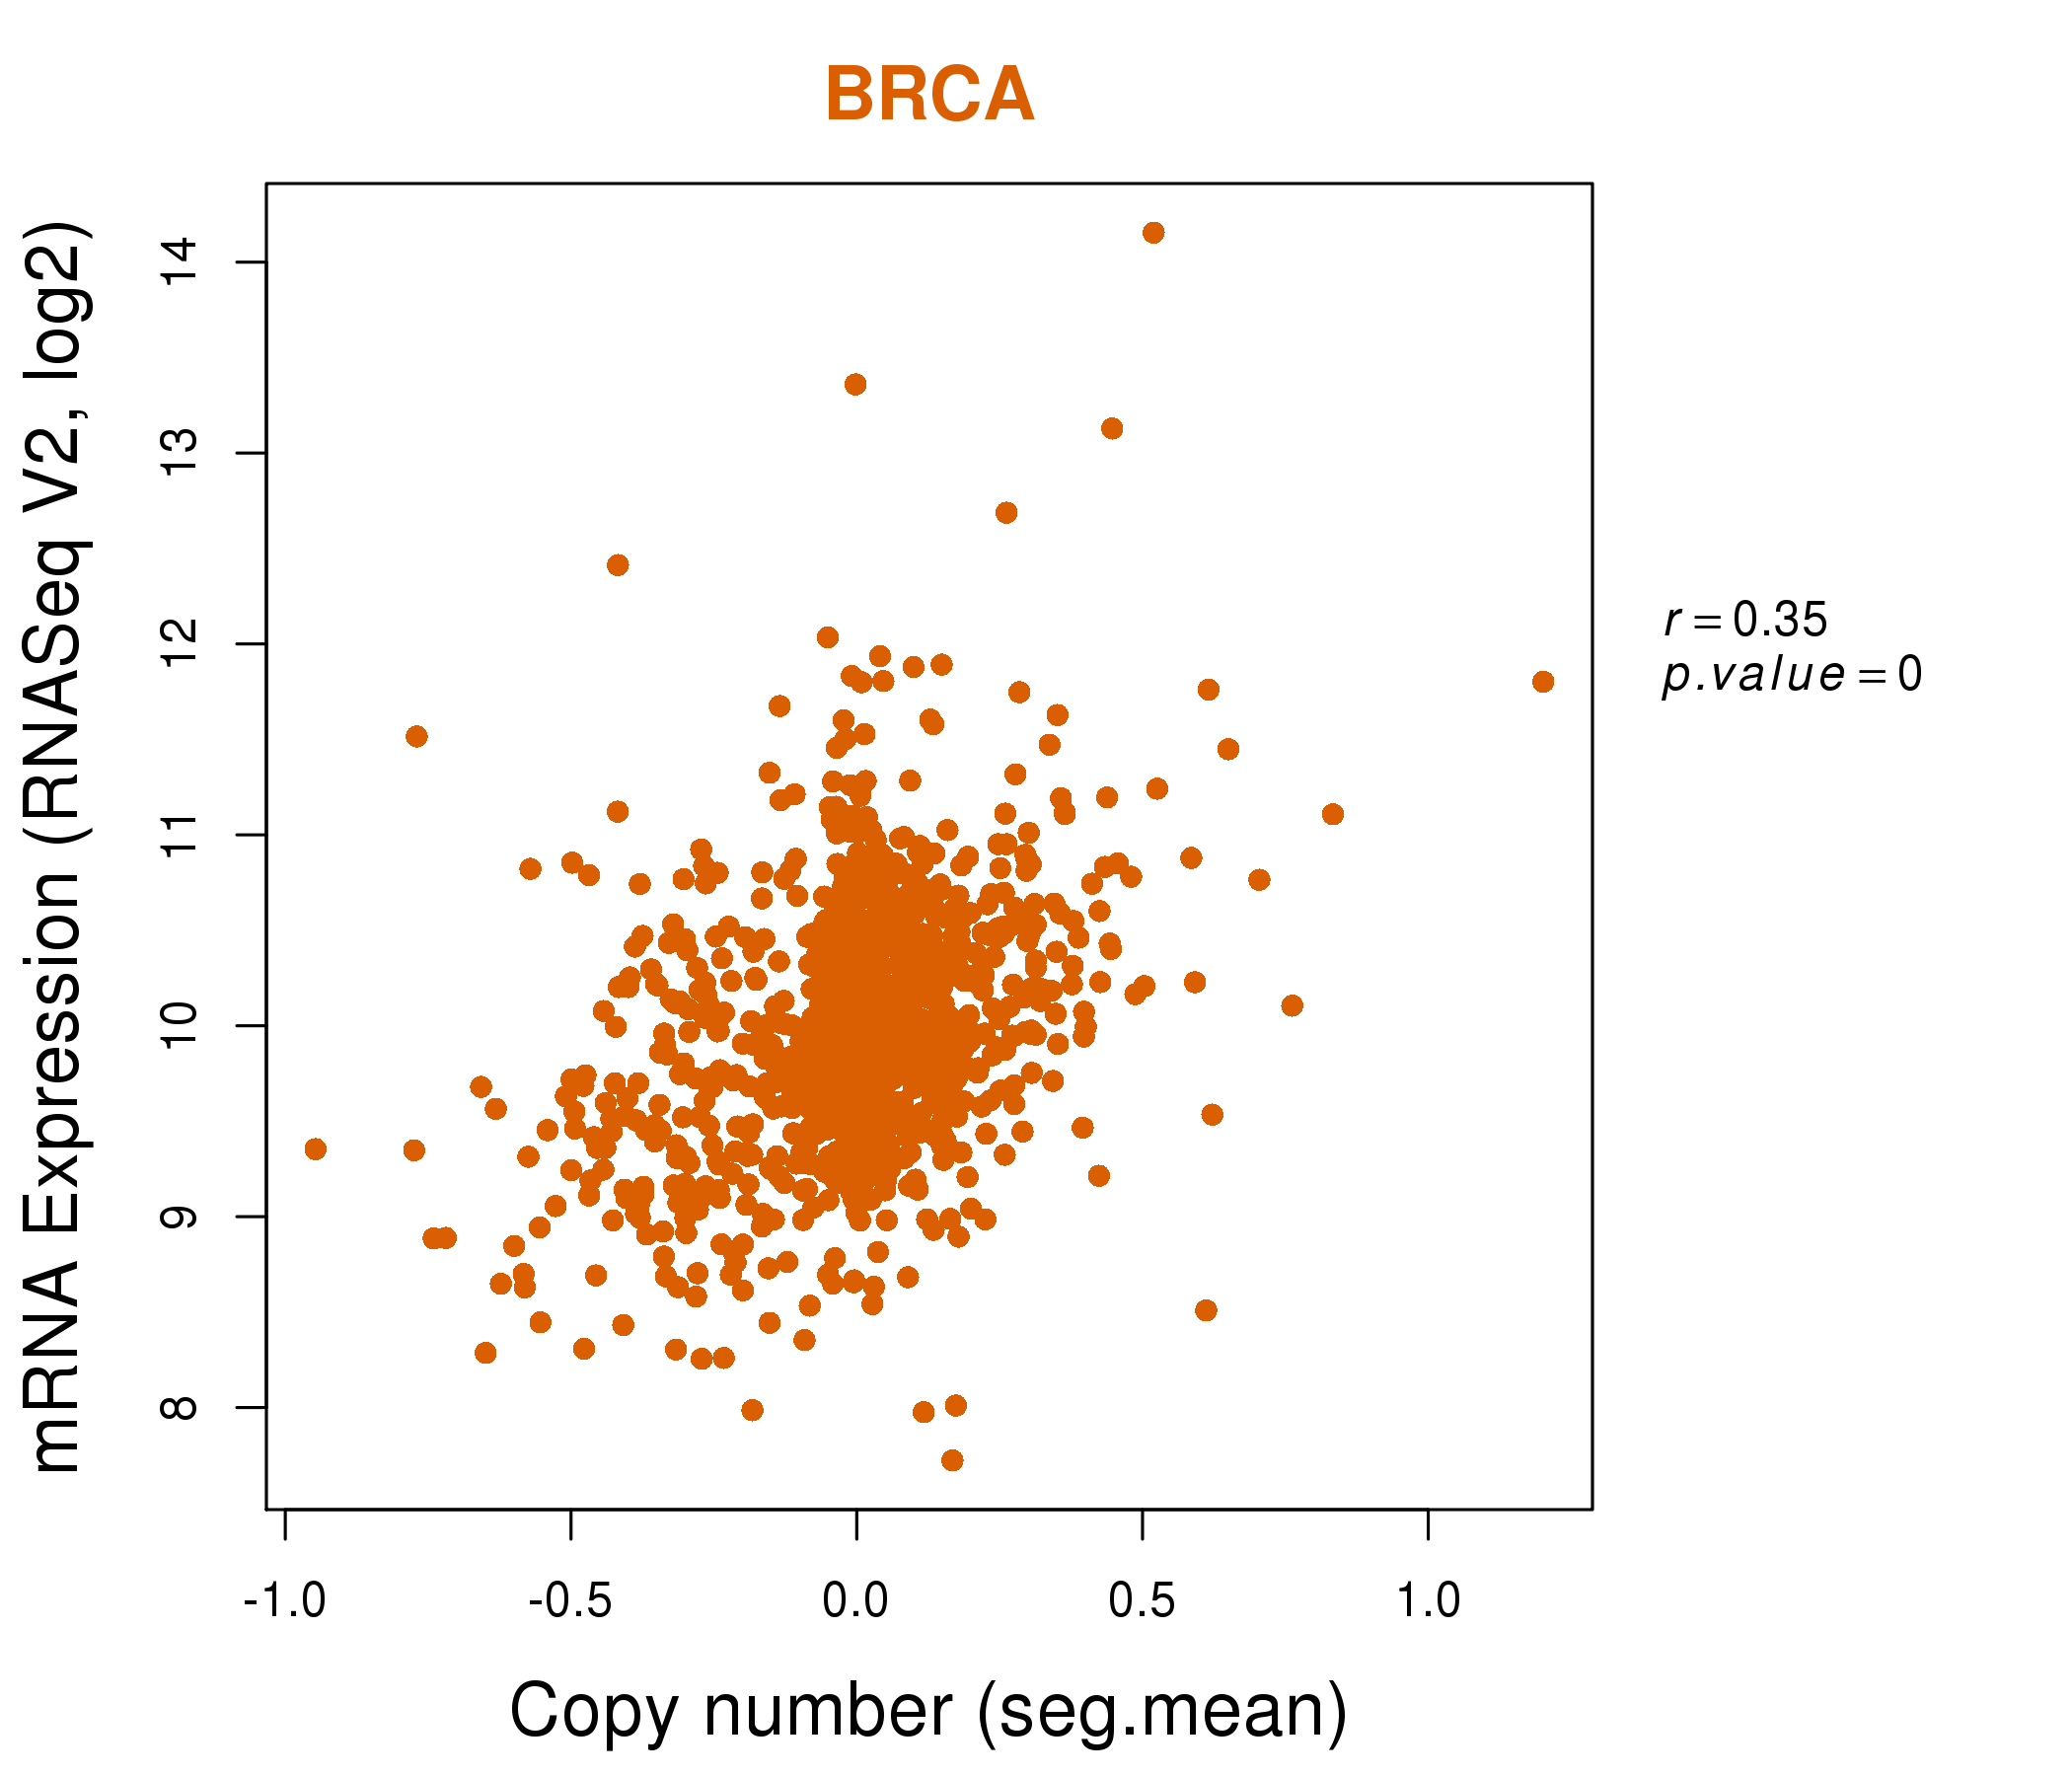
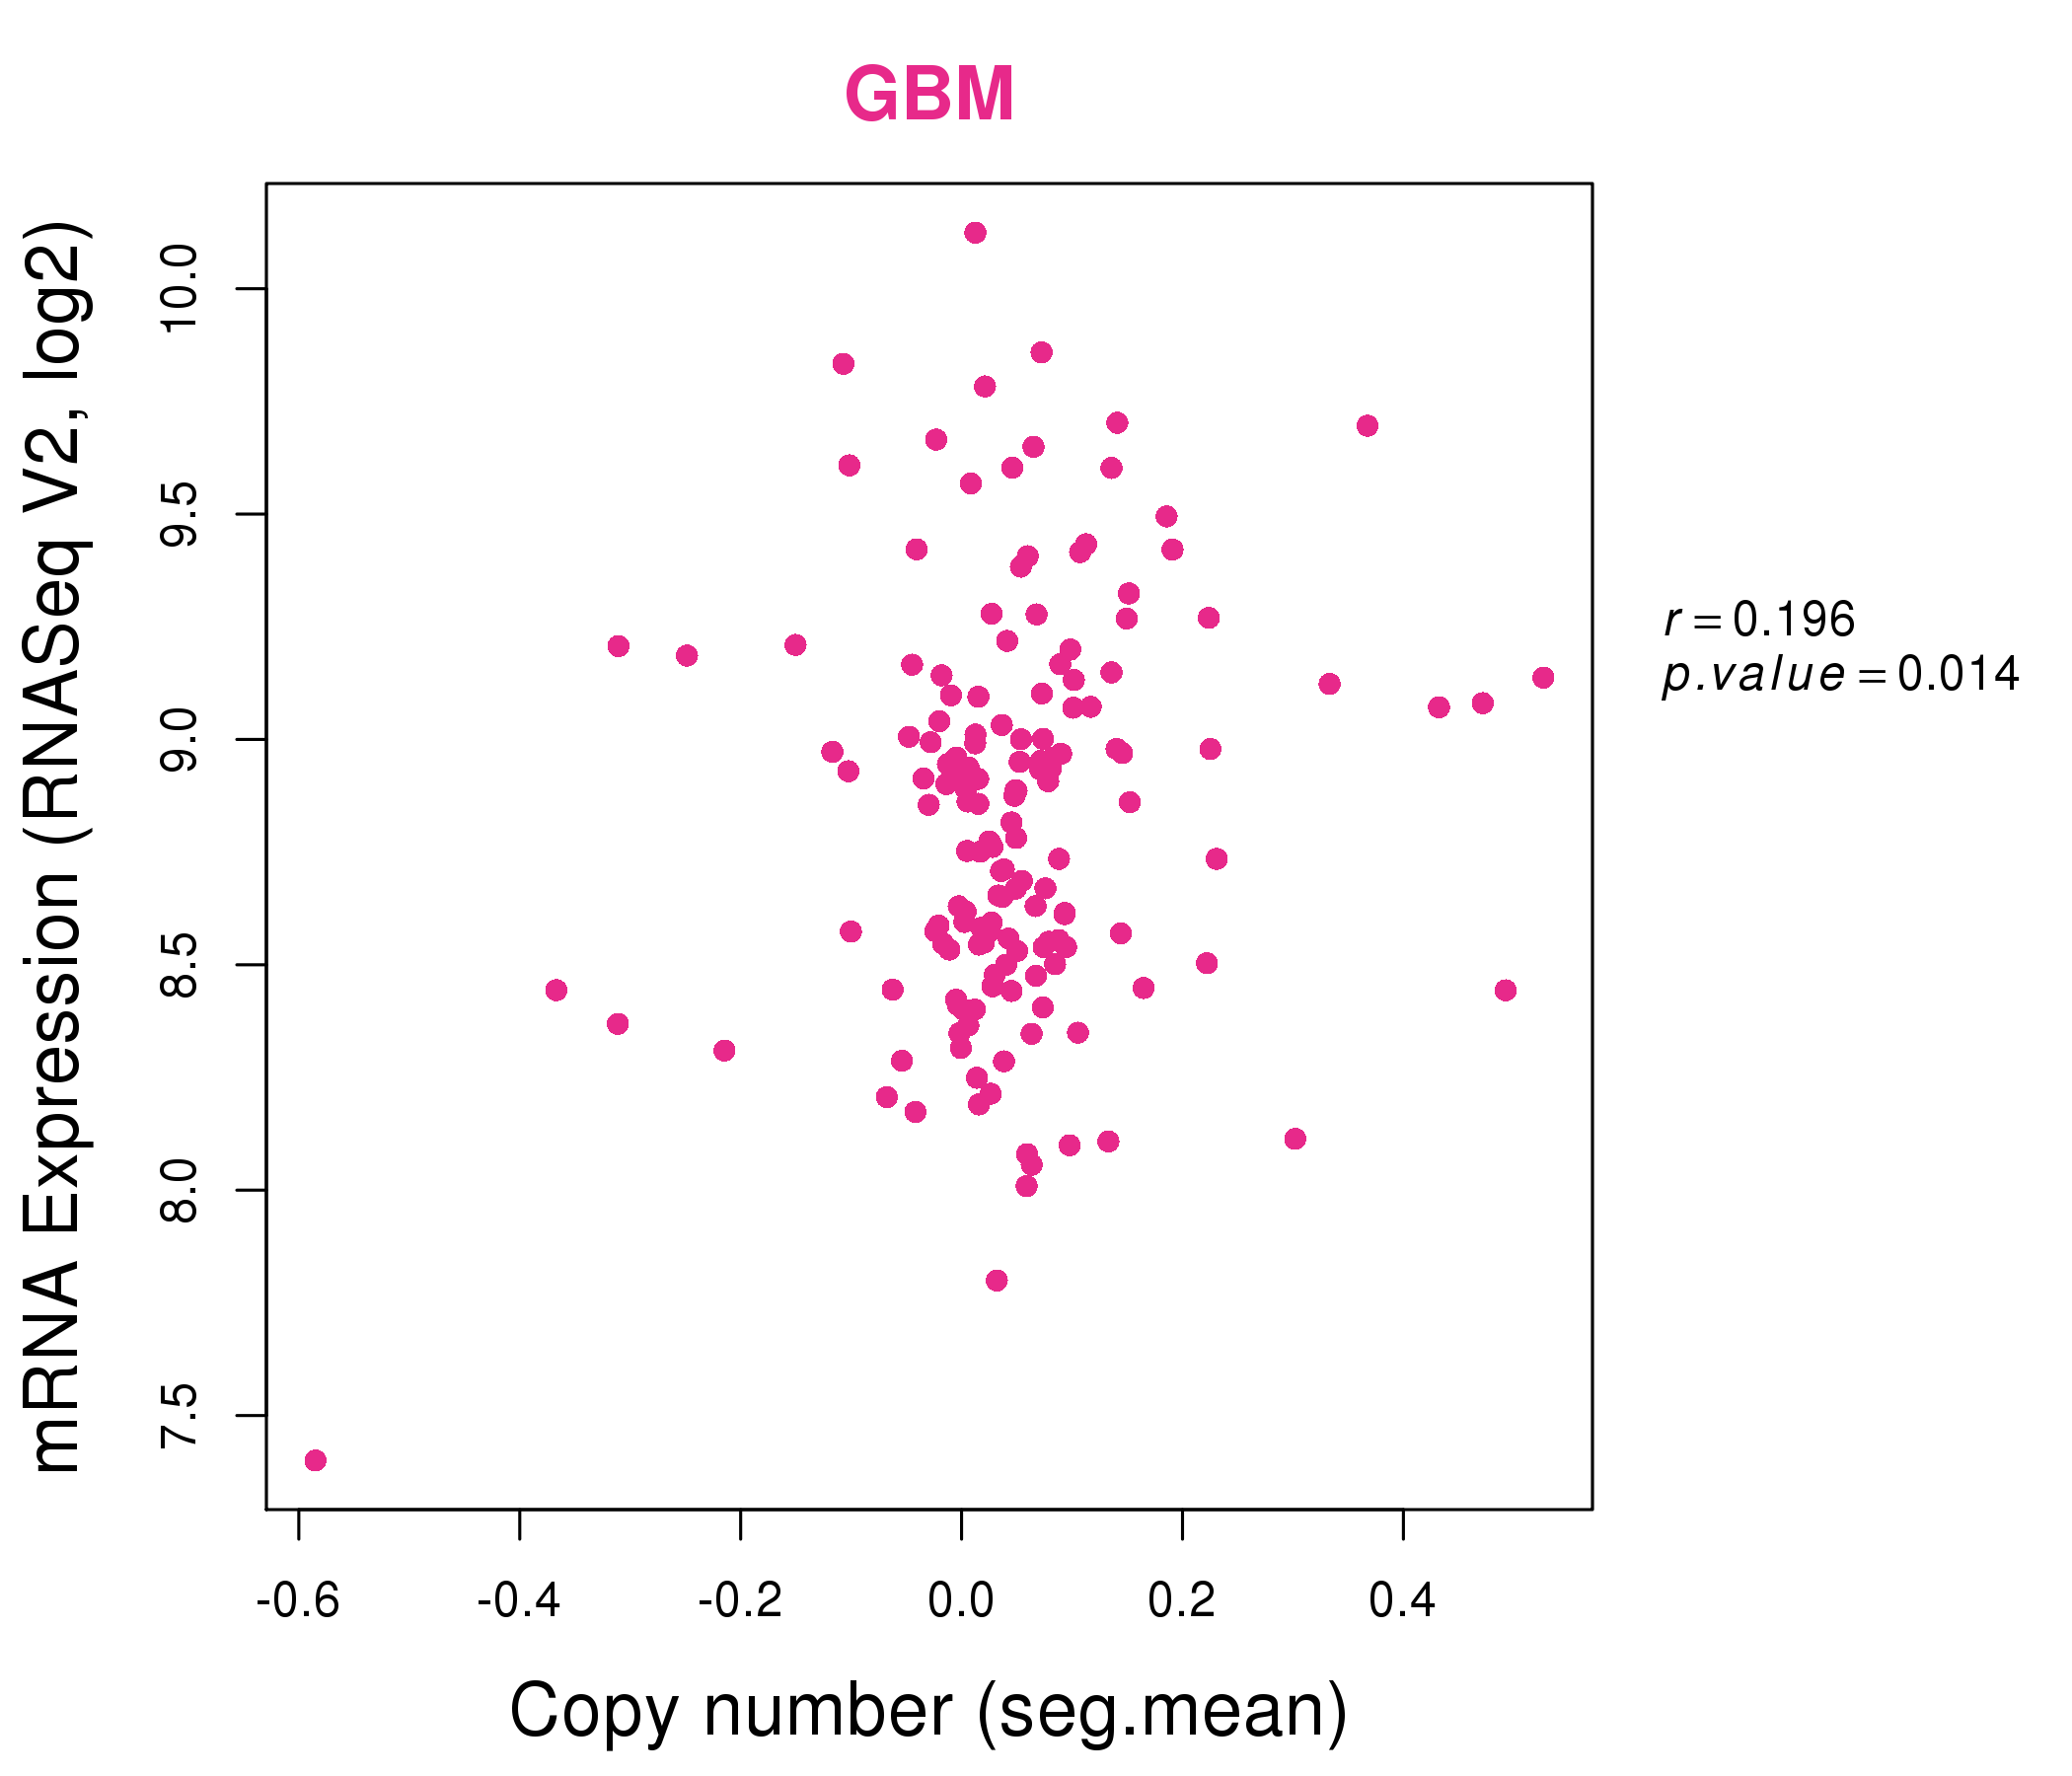
| * Normalized gene expression data of RNASeqV2 was extracted from TCGA using R package TCGA-Assembler. The URLs of all public data files on TCGA DCC data server were gathered at Jan-05-2015. Only eight cancer types have enough normal control samples for differential expression analysis. (t test, adjusted p<0.05 (using Benjamini-Hochberg FDR)) |
 |
| Top |
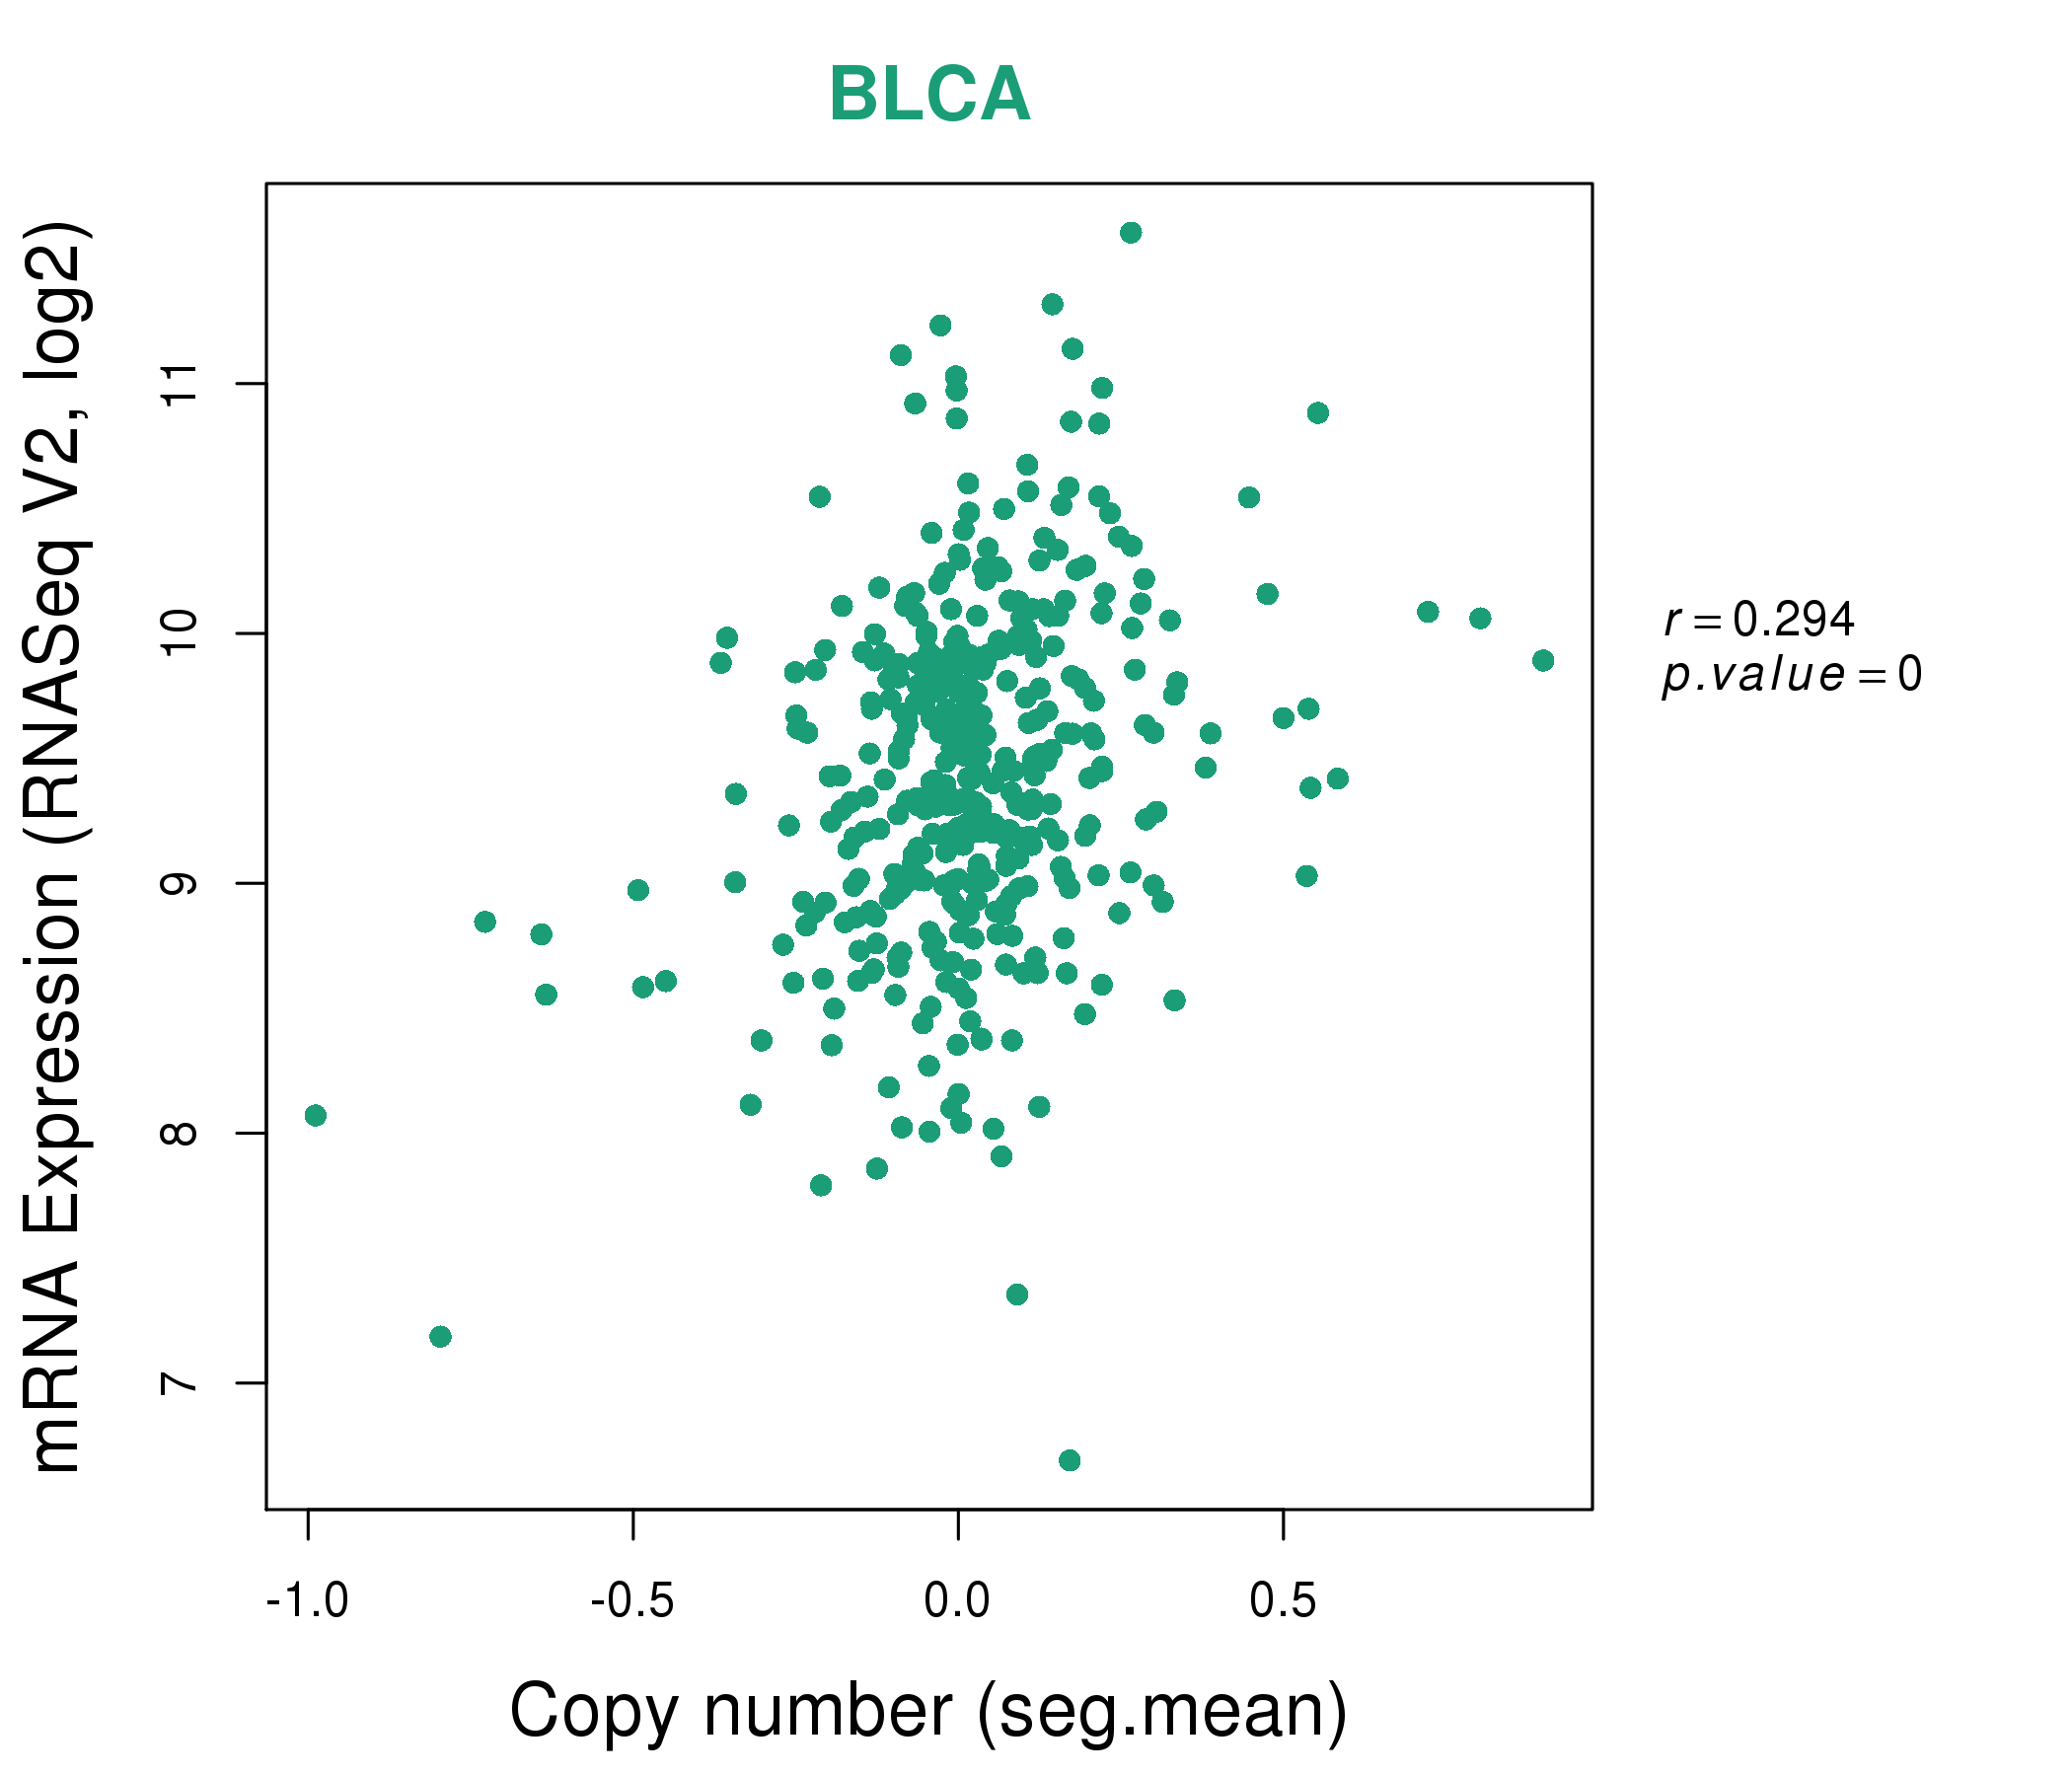
| * This plots show the correlation between CNV and gene expression. |
: Open all plots for all cancer types
 |
|
 |
|
| Top |
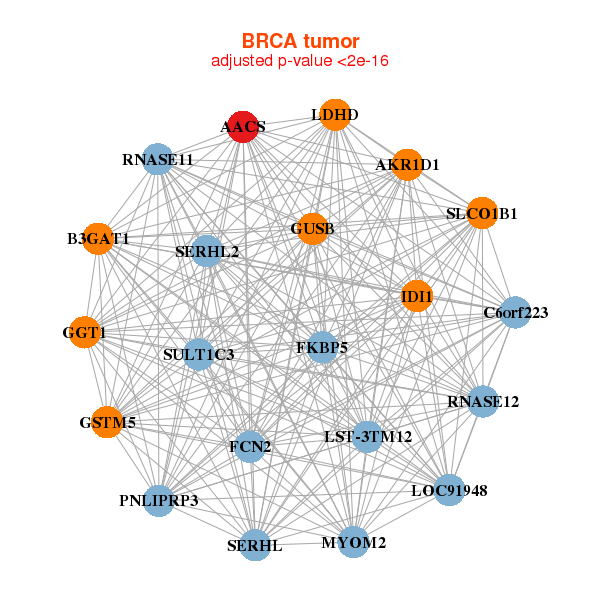
| Gene-Gene Network Information |
| * Co-Expression network figures were drawn using R package igraph. Only the top 20 genes with the highest correlations were shown. Red circle: input gene, orange circle: cell metabolism gene, sky circle: other gene |
: Open all plots for all cancer types
 |
|
| AACS,AKR1D1,B3GAT1,C6orf223,FCN2,FKBP5,GGT1, GSTM5,GUSB,IDI1,LDHD,LOC91948,LST-3TM12,MYOM2, PNLIPRP3,RNASE11,RNASE12,SERHL2,SERHL,SLCO1B1,SULT1C3 | AACS,ADAM2,ALOX15B,B3GAT1,CPB2,DHCR7,DHRS2, FDFT1,G6PD,HIST1H4H,HPGD,IVD,PNLIPRP3,PPEF1, MSMO1,SERHL2,SERHL,SLC15A1,SRD5A1,TARP,UGT2B28 |
 |
|
| AACS,ALDH2,ATP5B,CES3,CKAP4,CS,DDX54, ERP29,GAPDH,GCN1L1,GMPPB,LSS,MLEC,MMAB, MVK,PFKL,POLR3B,SCARB1,SRSF9,SH3BP1,SUOX | AACS,BEND3,C10orf95,CEP85,EPHB2,EPHB3,NXPE1, GAL3ST2,GPR56,KIAA1244,MET,PDZD8,PTGDR,RCC2, RNF43,RTN4R,SAMD5,SH3BP4,SLC29A2,TMEM63A,TNFRSF11A |
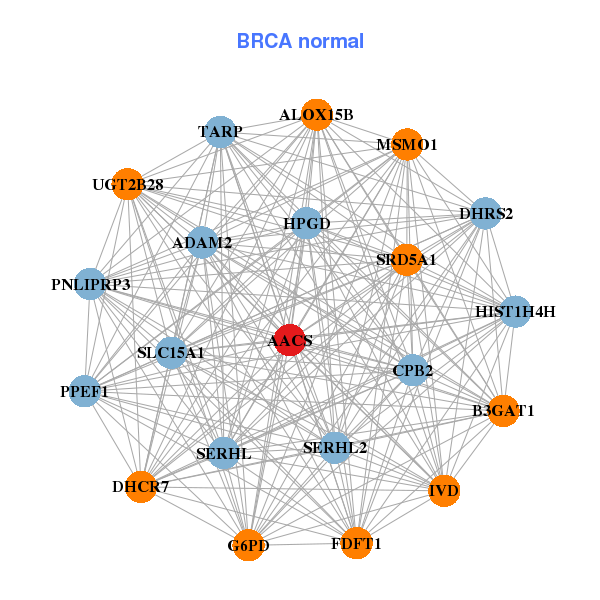
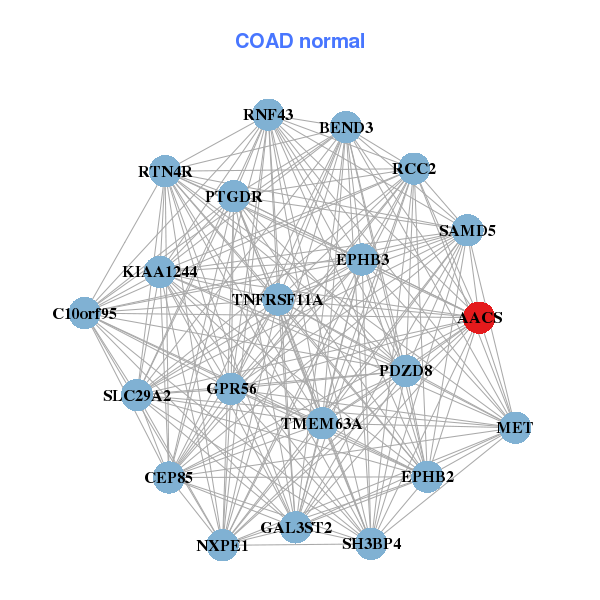
| * Co-Expression network figures were drawn using R package igraph. Only the top 20 genes with the highest correlations were shown. Red circle: input gene, orange circle: cell metabolism gene, sky circle: other gene |
: Open all plots for all cancer types
| Top |
: Open all interacting genes' information including KEGG pathway for all interacting genes from DAVID
| Top |
| Pharmacological Information for AACS |
| There's no related Drug. |
| Top |
| Cross referenced IDs for AACS |
| * We obtained these cross-references from Uniprot database. It covers 150 different DBs, 18 categories. http://www.uniprot.org/help/cross_references_section |
: Open all cross reference information
|
Copyright © 2016-Present - The Univsersity of Texas Health Science Center at Houston @ |