|
||||||||||||||||||||
| |
| Phenotypic Information (metabolism pathway, cancer, disease, phenome) |
| |
| |
| Gene-Gene Network Information: Co-Expression Network, Interacting Genes & KEGG |
| |
|


| Gene Summary for SMPD1 |
| Top |
| Phenotypic Information for SMPD1(metabolism pathway, cancer, disease, phenome) |
| Cancer | CGAP: SMPD1 |
| Familial Cancer Database: SMPD1 | |
| * This gene is included in those cancer gene databases. |
|
|
|
|
|
|
| ||||||||||||||
Oncogene 1 | Significant driver gene in | |||||||||||||||||||
| cf) number; DB name 1 Oncogene; http://nar.oxfordjournals.org/content/35/suppl_1/D721.long, 2 Tumor Suppressor gene; https://bioinfo.uth.edu/TSGene/, 3 Cancer Gene Census; http://www.nature.com/nrc/journal/v4/n3/abs/nrc1299.html, 4 CancerGenes; http://nar.oxfordjournals.org/content/35/suppl_1/D721.long, 5 Network of Cancer Gene; http://ncg.kcl.ac.uk/index.php, 1Therapeutic Vulnerabilities in Cancer; http://cbio.mskcc.org/cancergenomics/statius/ |
| KEGG_SPHINGOLIPID_METABOLISM REACTOME_GLYCOSPHINGOLIPID_METABOLISM REACTOME_PHOSPHOLIPID_METABOLISM REACTOME_SPHINGOLIPID_METABOLISM REACTOME_METABOLISM_OF_LIPIDS_AND_LIPOPROTEINS | |
| OMIM | |
| Orphanet | |
| Disease | KEGG Disease: SMPD1 |
| MedGen: SMPD1 (Human Medical Genetics with Condition) | |
| ClinVar: SMPD1 | |
| Phenotype | MGI: SMPD1 (International Mouse Phenotyping Consortium) |
| PhenomicDB: SMPD1 | |
| Mutations for SMPD1 |
| * Under tables are showing count per each tissue to give us broad intuition about tissue specific mutation patterns.You can go to the detailed page for each mutation database's web site. |
| There's no structural variation information in COSMIC data for this gene. |
| * From mRNA Sanger sequences, Chitars2.0 arranged chimeric transcripts. This table shows SMPD1 related fusion information. |
| ID | Head Gene | Tail Gene | Accession | Gene_a | qStart_a | qEnd_a | Chromosome_a | tStart_a | tEnd_a | Gene_a | qStart_a | qEnd_a | Chromosome_a | tStart_a | tEnd_a |
| AW951504 | MAGEA4 | 1 | 144 | X | 151092694 | 151092837 | SMPD1 | 141 | 493 | 11 | 6413115 | 6414884 | |
| BP375800 | SMPD1 | 4 | 423 | 11 | 6411708 | 6412128 | TRPC4 | 420 | 582 | 13 | 38357388 | 38443784 | |
| AA378043 | MAGEA4 | 1 | 144 | X | 151092693 | 151092837 | SMPD1 | 141 | 317 | 11 | 6413115 | 6413288 | |
| BF853689 | SMPD1 | 54 | 256 | 11 | 6414495 | 6414926 | SMPD1 | 252 | 456 | 11 | 6415198 | 6415558 | |
| AK057846 | NIPA1 | 1 | 1914 | 15 | 23044062 | 23086291 | SMPD1 | 1897 | 2065 | 11 | 6416059 | 6416227 | |
| Top |
| There's no copy number variation information in COSMIC data for this gene. |
| Top |
|
 |
| Top |
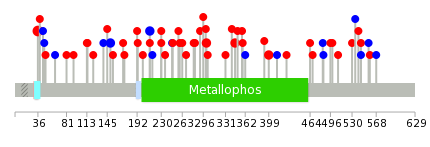
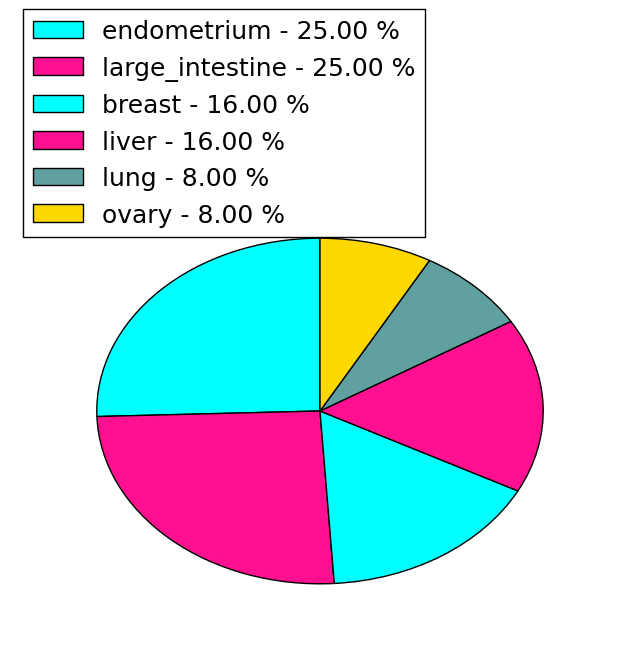
| Stat. for Non-Synonymous SNVs (# total SNVs=43) | (# total SNVs=12) |
 |  |
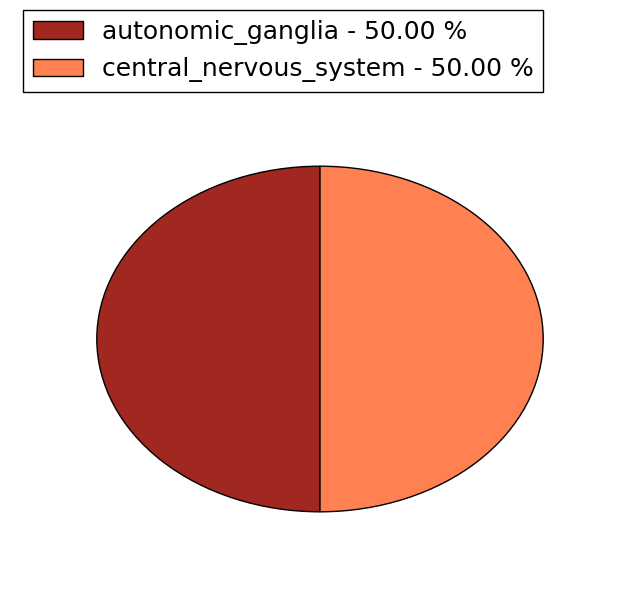
(# total SNVs=4) | (# total SNVs=2) |
 |  |
| Top |
| * When you move the cursor on each content, you can see more deailed mutation information on the Tooltip. Those are primary_site,primary_histology,mutation(aa),pubmedID. |
| GRCh37 position | Mutation(aa) | Unique sampleID count |
| chr11:6411935-6411935 | p.V36A | 4 |
| chr11:6413196-6413196 | p.V301I | 2 |
| chr11:6414911-6414911 | p.R399Q | 2 |
| chr11:6412931-6412931 | p.D212D | 2 |
| chr11:6412745-6412745 | p.R150R | 2 |
| chr11:6413332-6413332 | p.A346V | 2 |
| chr11:6411931-6411942 | p.V36_L39delVLAL | 2 |
| chr11:6413036-6413036 | p.G247G | 1 |
| chr11:6415595-6415595 | p.P508S | 1 |
| chr11:6412632-6412632 | p.R113C | 1 |
| Top |
|
 |
| Point Mutation/ Tissue ID | 1 | 2 | 3 | 4 | 5 | 6 | 7 | 8 | 9 | 10 | 11 | 12 | 13 | 14 | 15 | 16 | 17 | 18 | 19 | 20 |
| # sample | 4 | 1 | 9 | 1 | 1 | 3 | 4 | 1 | 3 | 7 | 10 | |||||||||
| # mutation | 4 | 1 | 10 | 1 | 1 | 3 | 4 | 1 | 3 | 8 | 10 | |||||||||
| nonsynonymous SNV | 4 | 8 | 1 | 1 | 2 | 4 | 2 | 6 | 7 | |||||||||||
| synonymous SNV | 1 | 2 | 1 | 1 | 1 | 2 | 3 |
| cf) Tissue ID; Tissue type (1; BLCA[Bladder Urothelial Carcinoma], 2; BRCA[Breast invasive carcinoma], 3; CESC[Cervical squamous cell carcinoma and endocervical adenocarcinoma], 4; COAD[Colon adenocarcinoma], 5; GBM[Glioblastoma multiforme], 6; Glioma Low Grade, 7; HNSC[Head and Neck squamous cell carcinoma], 8; KICH[Kidney Chromophobe], 9; KIRC[Kidney renal clear cell carcinoma], 10; KIRP[Kidney renal papillary cell carcinoma], 11; LAML[Acute Myeloid Leukemia], 12; LUAD[Lung adenocarcinoma], 13; LUSC[Lung squamous cell carcinoma], 14; OV[Ovarian serous cystadenocarcinoma ], 15; PAAD[Pancreatic adenocarcinoma], 16; PRAD[Prostate adenocarcinoma], 17; SKCM[Skin Cutaneous Melanoma], 18:STAD[Stomach adenocarcinoma], 19:THCA[Thyroid carcinoma], 20:UCEC[Uterine Corpus Endometrial Carcinoma]) |
| Top |
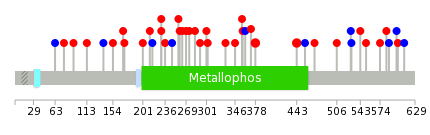
| * We represented just top 10 SNVs. When you move the cursor on each content, you can see more deailed mutation information on the Tooltip. Those are primary_site, primary_histology, mutation(aa), pubmedID. |
| Genomic Position | Mutation(aa) | Unique sampleID count |
| chr11:6414487 | p.R378H,SMPD1 | 2 |
| chr11:6414911 | p.R443Q,SMPD1 | 2 |
| chr11:6412102 | p.R113C,SMPD1 | 1 |
| chr11:6415458 | p.M274I,SMPD1 | 1 |
| chr11:6413002 | p.I528I,SMPD1 | 1 |
| chr11:6413286 | p.L139L,SMPD1 | 1 |
| chr11:6412632 | p.A283T,SMPD1 | 1 |
| chr11:6415525 | p.P529P,SMPD1 | 1 |
| chr11:6413036 | p.S154R,SMPD1 | 1 |
| chr11:6413332 | p.R291S,SMPD1 | 1 |
| * Copy number data were extracted from TCGA using R package TCGA-Assembler. The URLs of all public data files on TCGA DCC data server were gathered on Jan-05-2015. Function ProcessCNAData in TCGA-Assembler package was used to obtain gene-level copy number value which is calculated as the average copy number of the genomic region of a gene. |
 |
| cf) Tissue ID[Tissue type]: BLCA[Bladder Urothelial Carcinoma], BRCA[Breast invasive carcinoma], CESC[Cervical squamous cell carcinoma and endocervical adenocarcinoma], COAD[Colon adenocarcinoma], GBM[Glioblastoma multiforme], Glioma Low Grade, HNSC[Head and Neck squamous cell carcinoma], KICH[Kidney Chromophobe], KIRC[Kidney renal clear cell carcinoma], KIRP[Kidney renal papillary cell carcinoma], LAML[Acute Myeloid Leukemia], LUAD[Lung adenocarcinoma], LUSC[Lung squamous cell carcinoma], OV[Ovarian serous cystadenocarcinoma ], PAAD[Pancreatic adenocarcinoma], PRAD[Prostate adenocarcinoma], SKCM[Skin Cutaneous Melanoma], STAD[Stomach adenocarcinoma], THCA[Thyroid carcinoma], UCEC[Uterine Corpus Endometrial Carcinoma] |
| Top |
| Gene Expression for SMPD1 |
| * CCLE gene expression data were extracted from CCLE_Expression_Entrez_2012-10-18.res: Gene-centric RMA-normalized mRNA expression data. |
 |
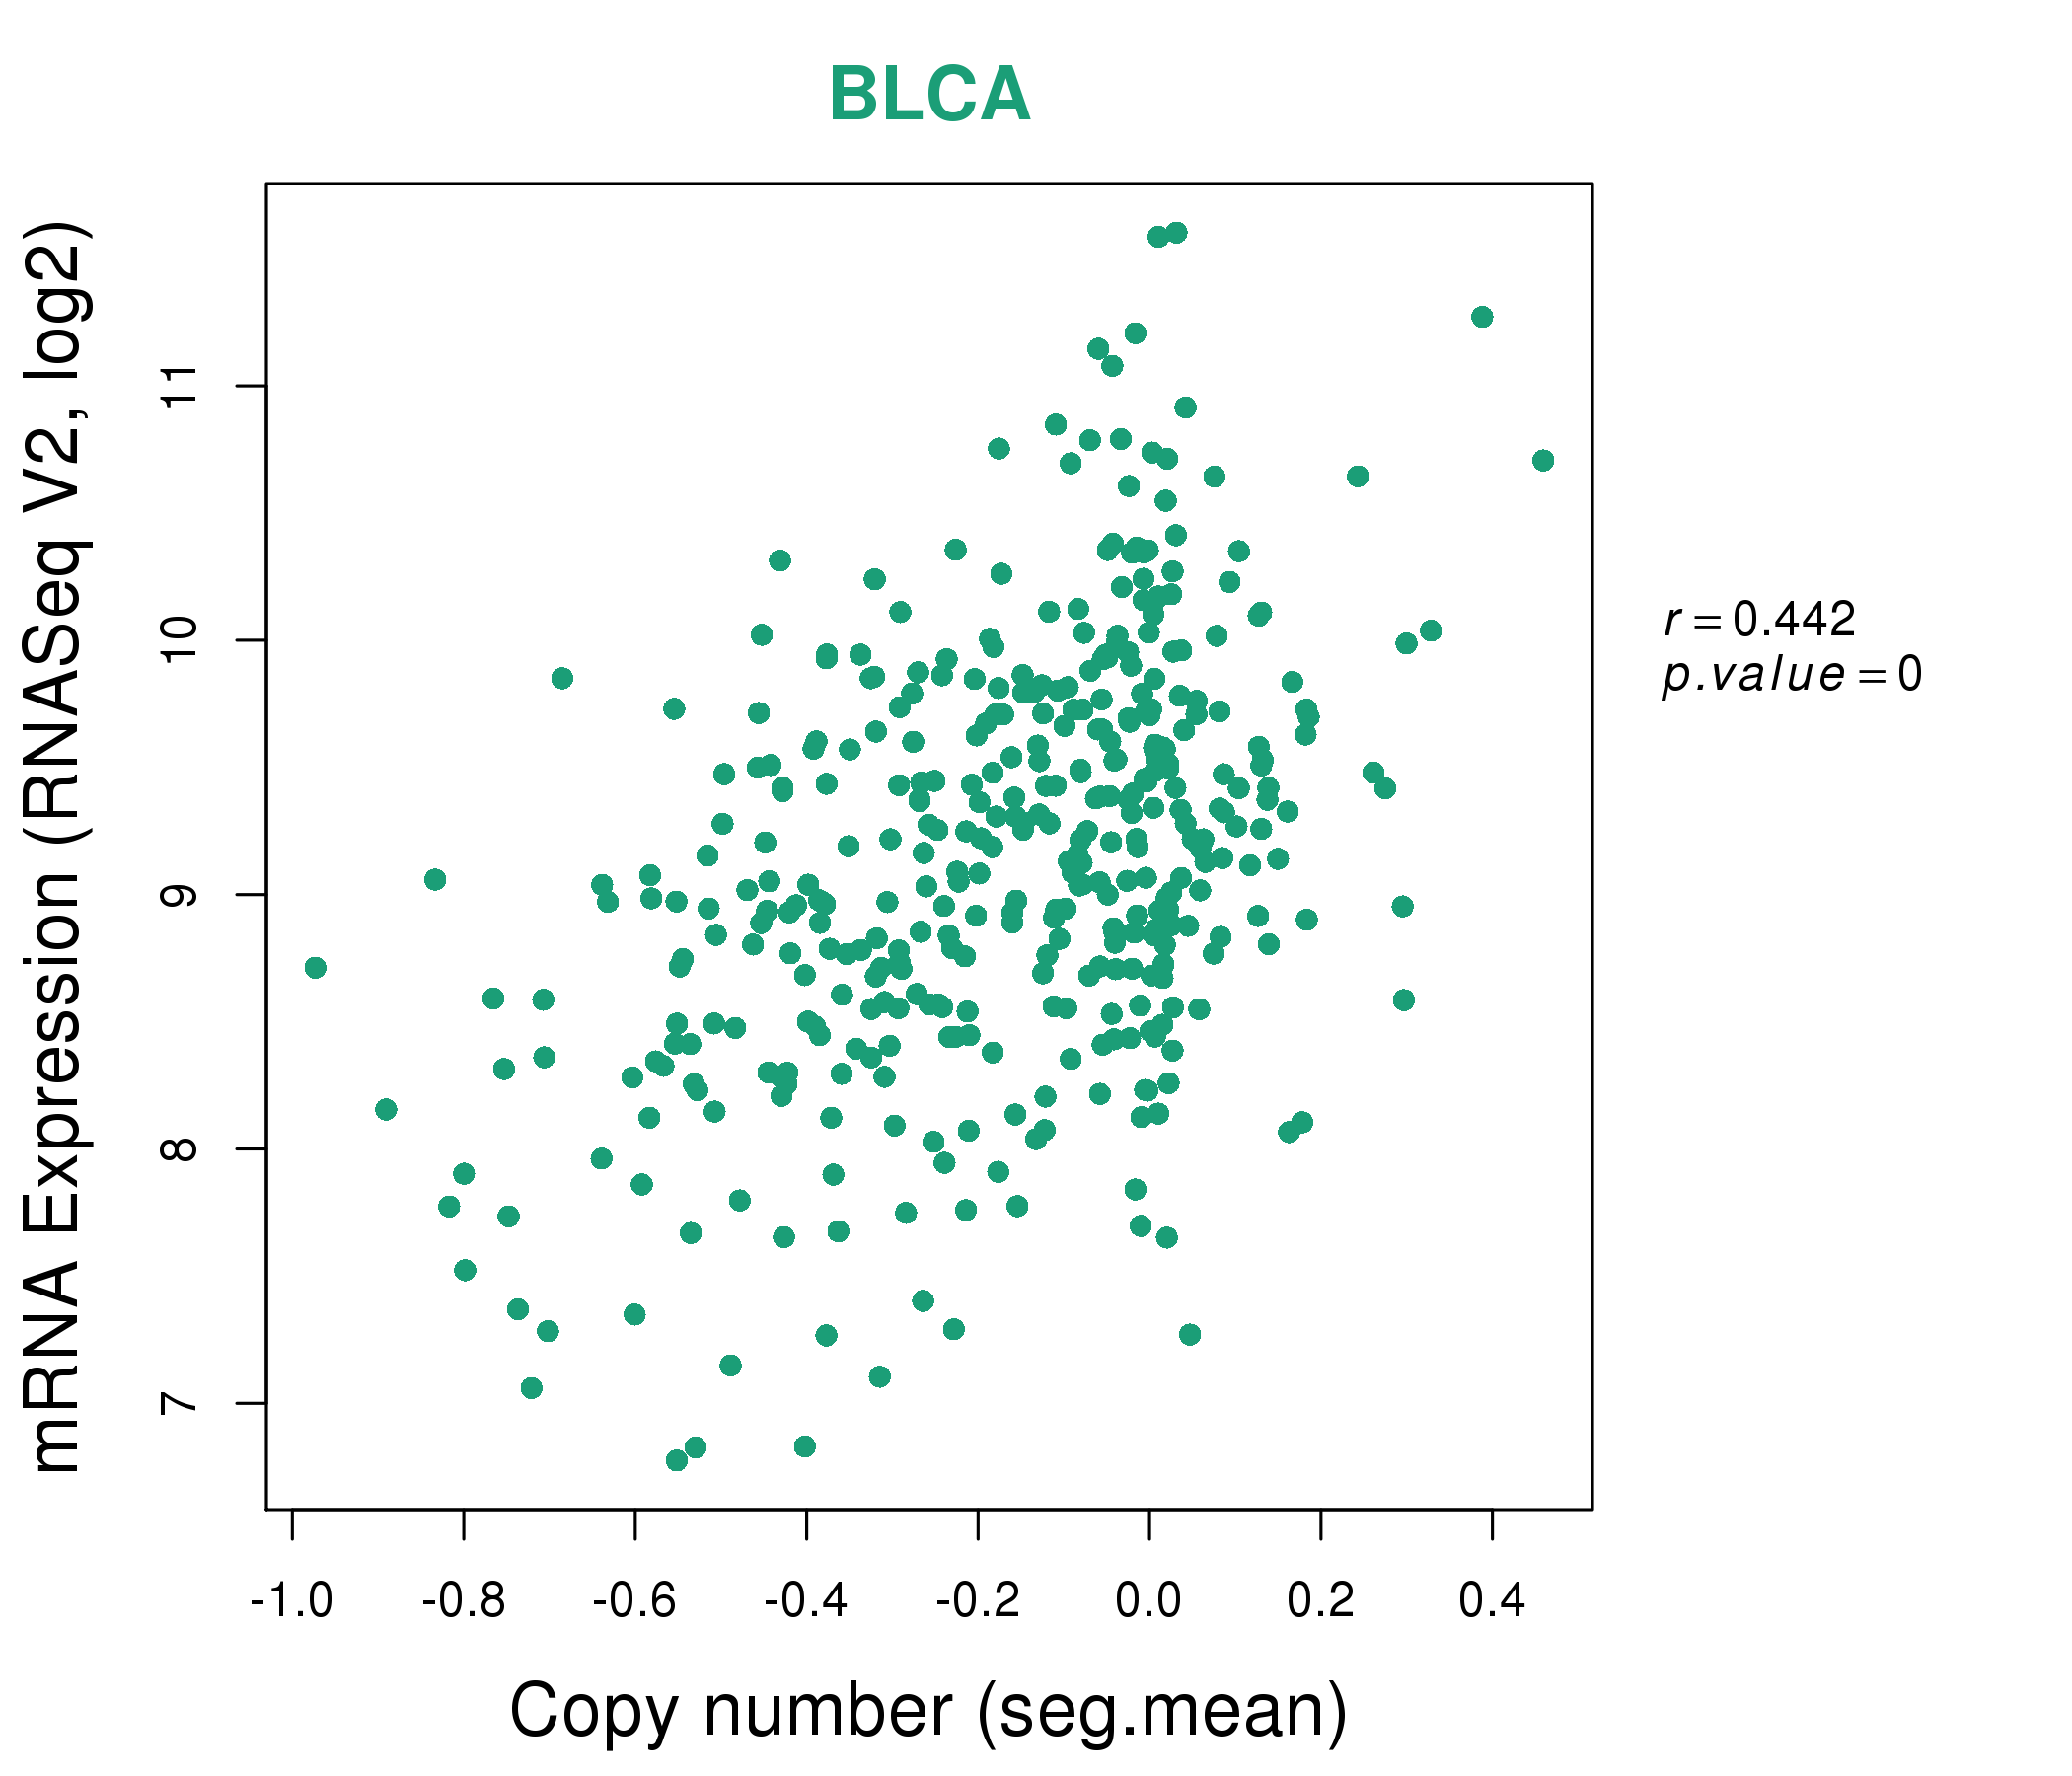
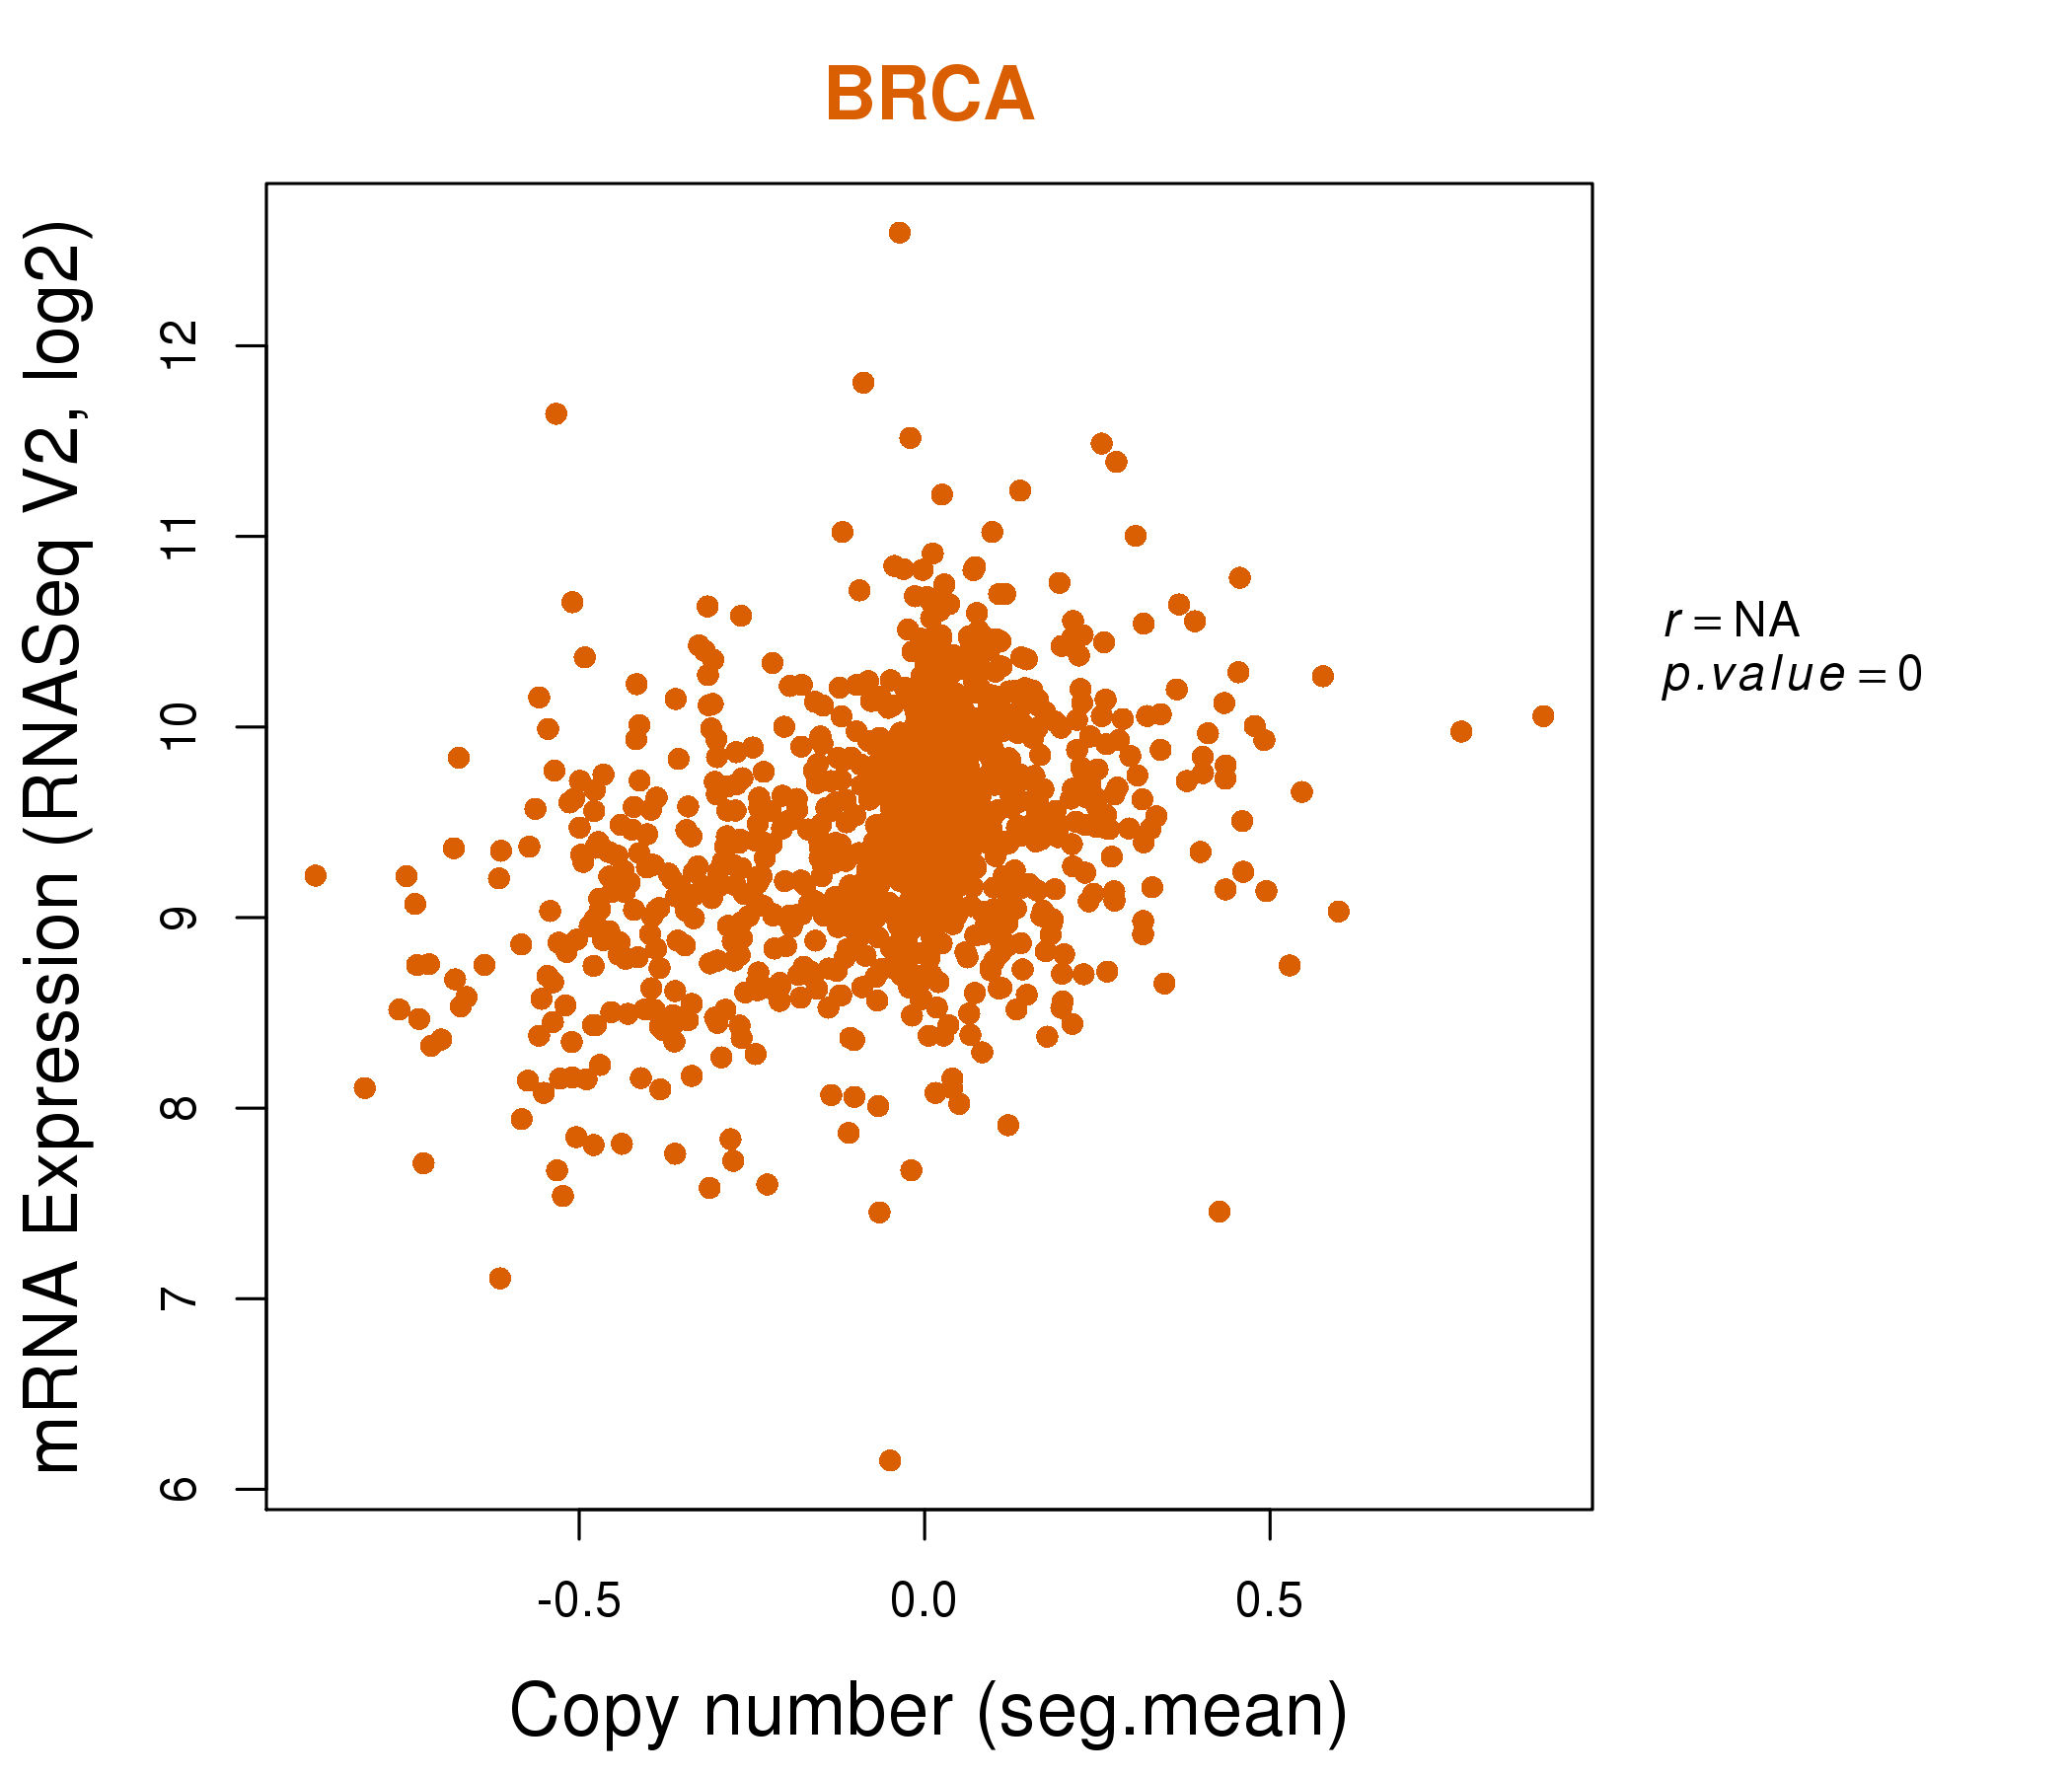
| * Normalized gene expression data of RNASeqV2 was extracted from TCGA using R package TCGA-Assembler. The URLs of all public data files on TCGA DCC data server were gathered at Jan-05-2015. Only eight cancer types have enough normal control samples for differential expression analysis. (t test, adjusted p<0.05 (using Benjamini-Hochberg FDR)) |
 |
| Top |
| * This plots show the correlation between CNV and gene expression. |
: Open all plots for all cancer types
 |
|
 |
|

| Top |
| Gene-Gene Network Information |
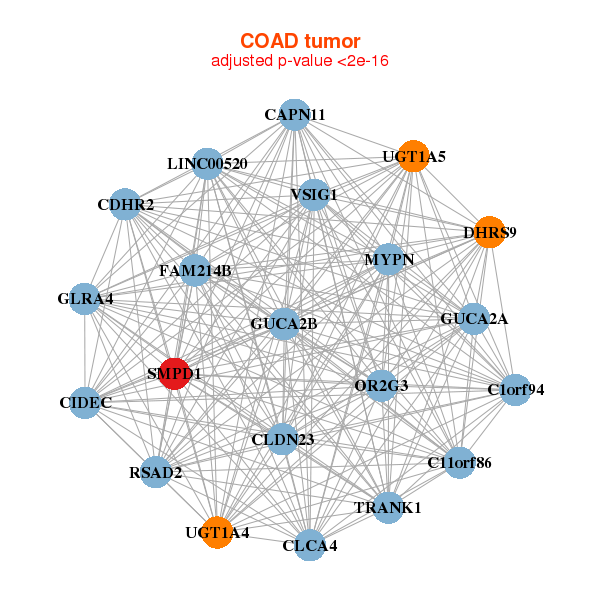
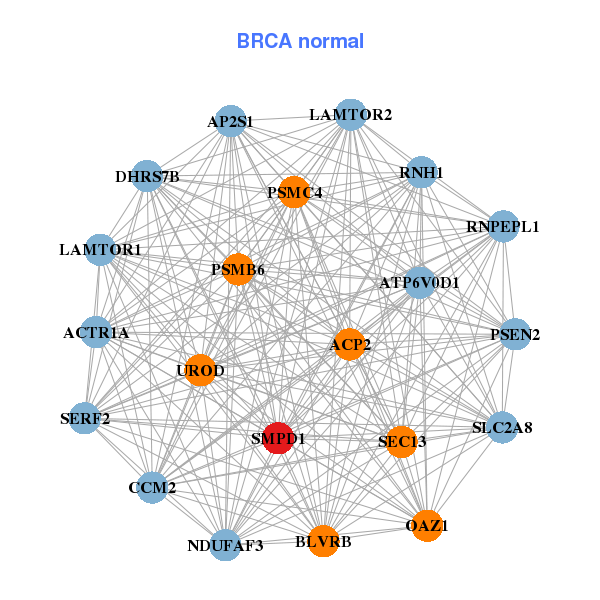
| * Co-Expression network figures were drawn using R package igraph. Only the top 20 genes with the highest correlations were shown. Red circle: input gene, orange circle: cell metabolism gene, sky circle: other gene |
: Open all plots for all cancer types
 |
| ||||
| CERCAM,CHID1,CHPF,CLEC11A,COPZ2,FAM20C,GPC1, IFI27L2,ILK,LEPRE1,LRPAP1,MRC2,MXRA8,NAGLU, RNH1,SDF4,SLC39A13,SMPD1,TGFB1,TSPAN4,VENTX | ACP2,ACTR1A,AP2S1,ATP6V0D1,BLVRB,LAMTOR1,CCM2, DHRS7B,NDUFAF3,OAZ1,PSEN2,PSMB6,PSMC4,RNH1, RNPEPL1,LAMTOR2,SEC13,SERF2,SLC2A8,SMPD1,UROD | ||||
 |
| ||||
| C11orf86,LINC00520,C1orf94,CAPN11,CDHR2,CIDEC,CLCA4, CLDN23,DHRS9,GLRA4,GUCA2A,GUCA2B,FAM214B,MYPN, OR2G3,RSAD2,SMPD1,TRANK1,UGT1A4,UGT1A5,VSIG1 | ARHGEF18,BSG,CAB39,CEACAM5,CGN,CTNNA1,FBLIM1, GBA,GBAP1,GNA13,GPRC5A,KIF16B,LRP10,PEX26, PLAC8,RHOF,SMPD1,SPATS2L,STX3,TBC1D2,TMEM127 |

| * Co-Expression network figures were drawn using R package igraph. Only the top 20 genes with the highest correlations were shown. Red circle: input gene, orange circle: cell metabolism gene, sky circle: other gene |
: Open all plots for all cancer types
| Top |
: Open all interacting genes' information including KEGG pathway for all interacting genes from DAVID
| Top |
| Pharmacological Information for SMPD1 |
| DB Category | DB Name | DB's ID and Url link |
| * Gene Centered Interaction Network. |
 |
| * Drug Centered Interaction Network. |
| DrugBank ID | Target Name | Drug Groups | Generic Name | Drug Centered Network | Drug Structure |
| DB01151 | sphingomyelin phosphodiesterase 1, acid lysosomal | approved | Desipramine | 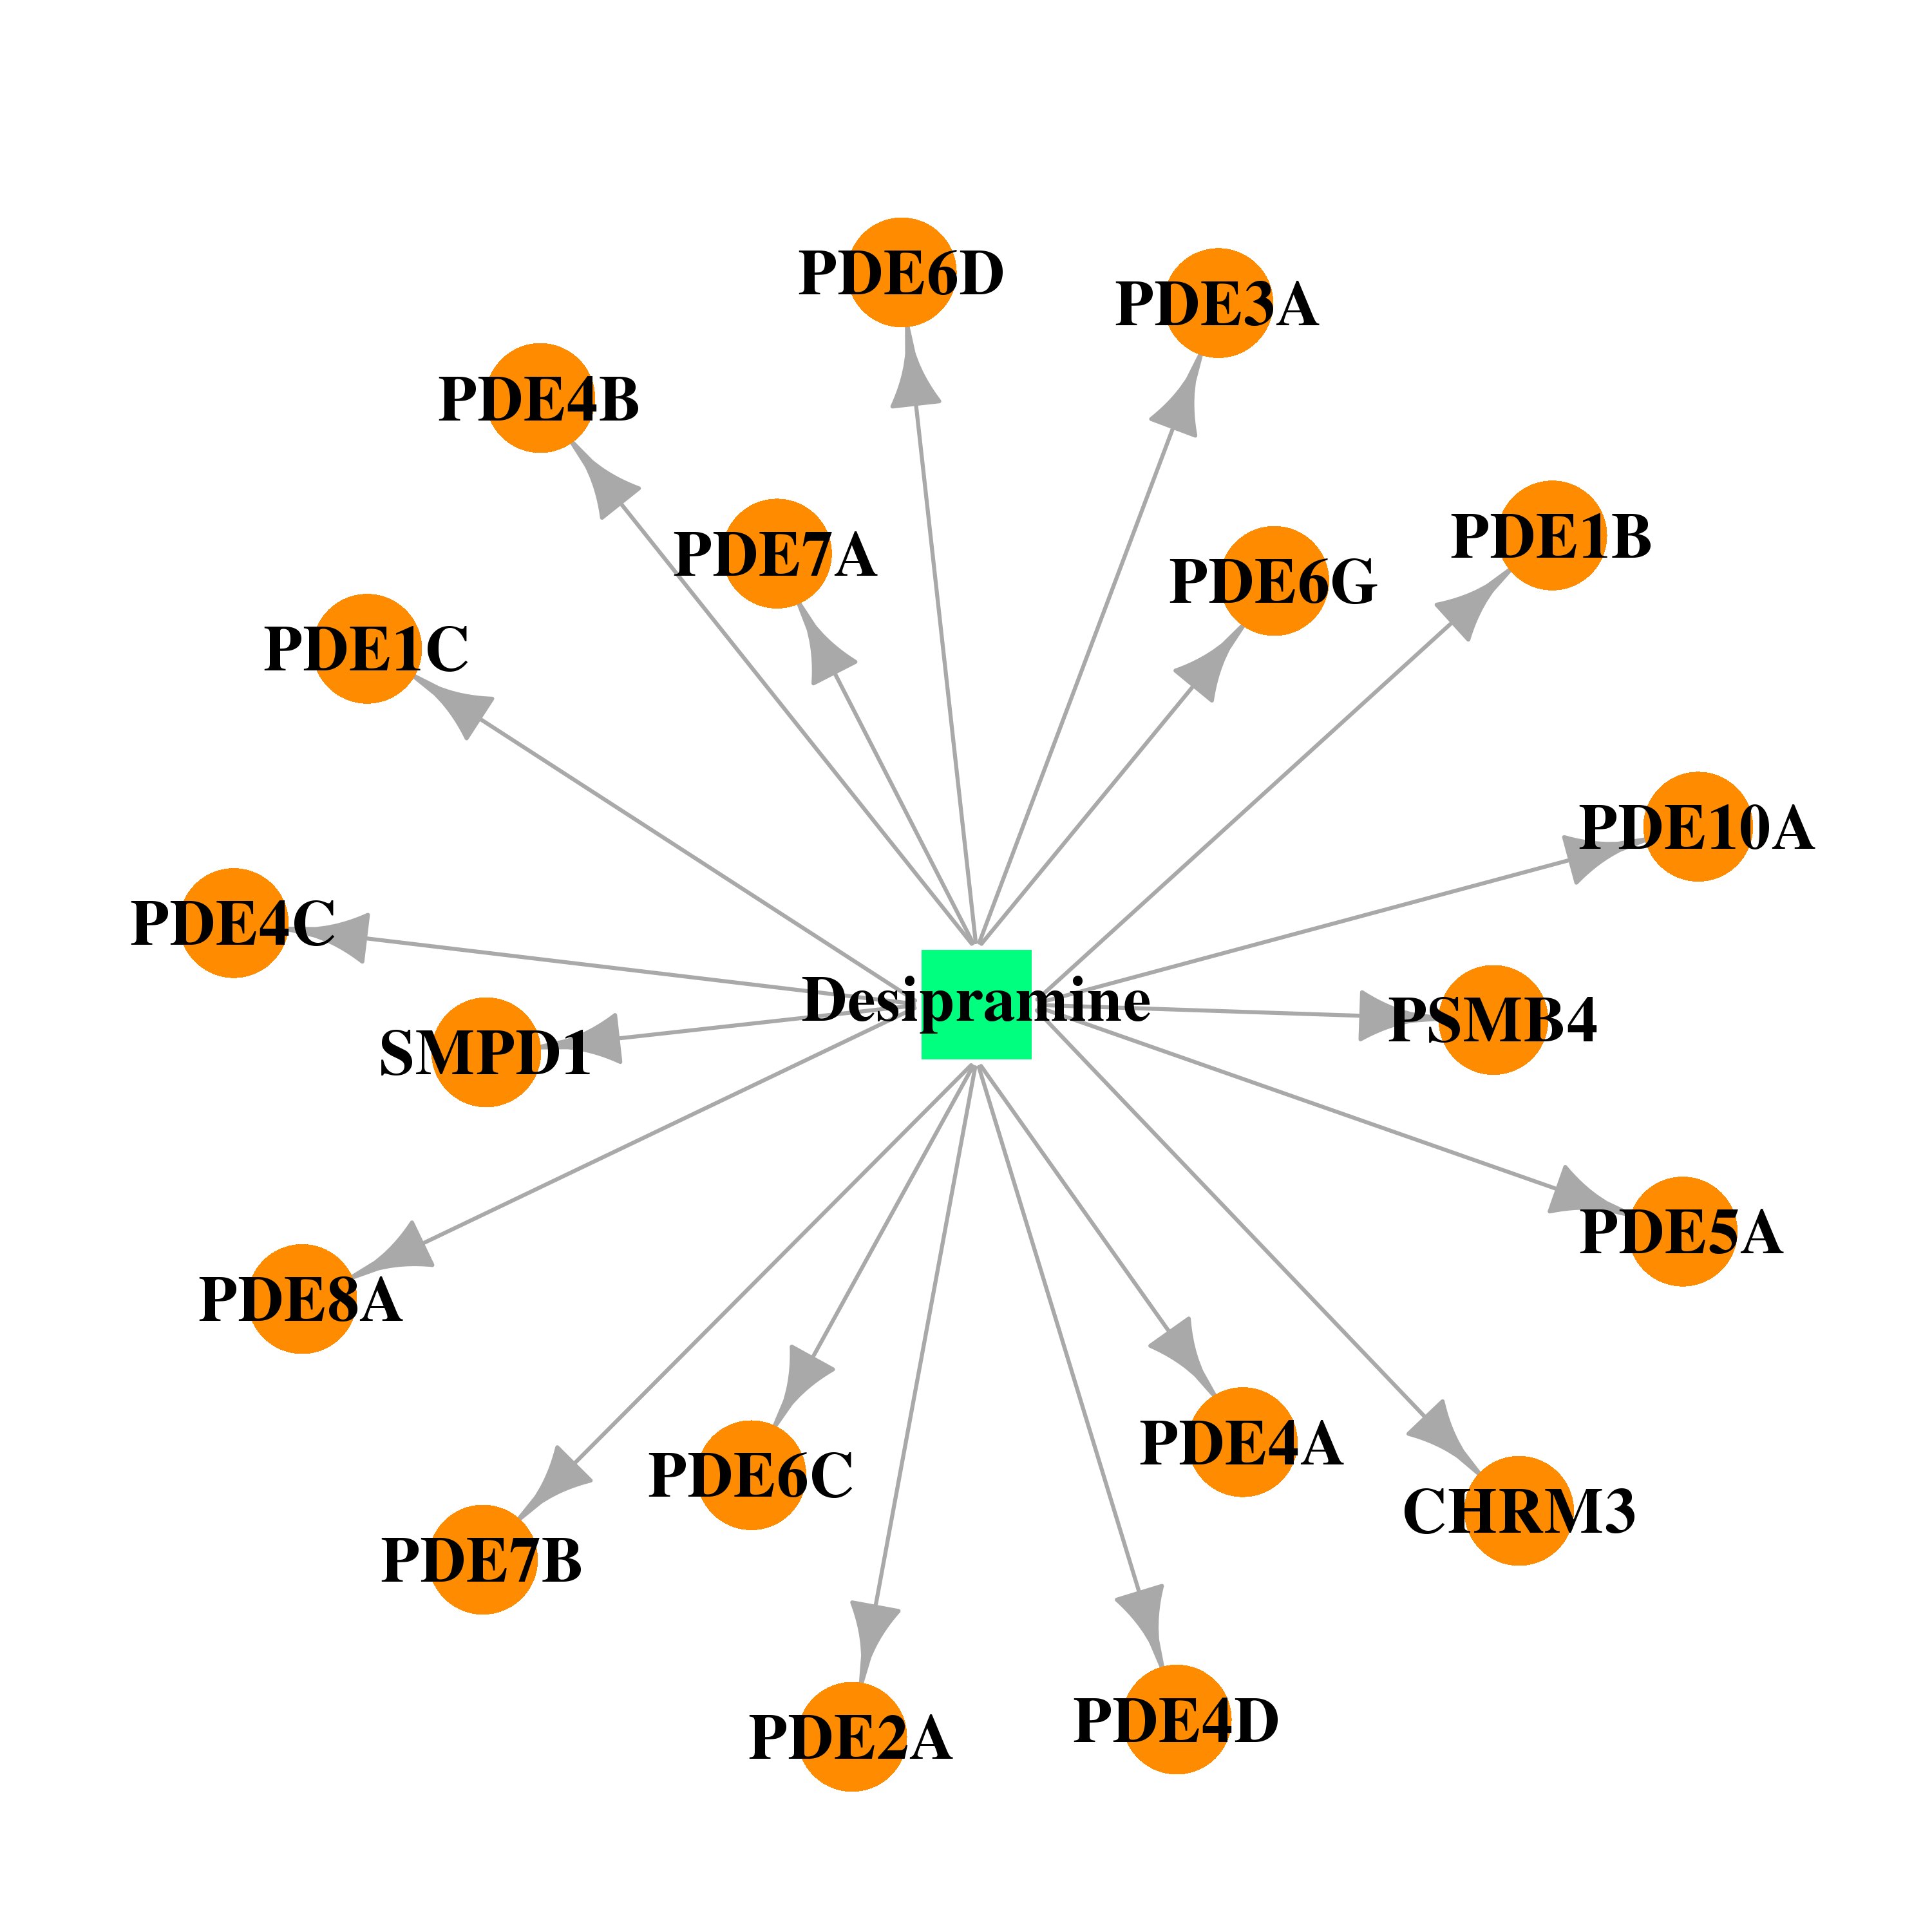 | 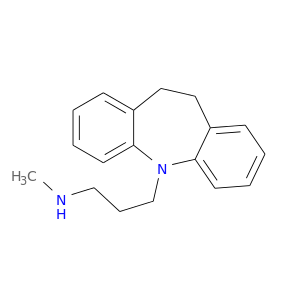 |
| DB00143 | sphingomyelin phosphodiesterase 1, acid lysosomal | approved; nutraceutical | Glutathione |  |  |
| Top |
| Cross referenced IDs for SMPD1 |
| * We obtained these cross-references from Uniprot database. It covers 150 different DBs, 18 categories. http://www.uniprot.org/help/cross_references_section |
: Open all cross reference information
|
Copyright © 2016-Present - The Univsersity of Texas Health Science Center at Houston @ |