|
||||||||||||||||||||
| |
| Phenotypic Information (metabolism pathway, cancer, disease, phenome) |
| |
| |
| Gene-Gene Network Information: Co-Expression Network, Interacting Genes & KEGG |
| |
|


| Gene Summary for SNRPG |
| Basic gene info. | Gene symbol | SNRPG |
| Gene name | small nuclear ribonucleoprotein polypeptide G | |
| Synonyms | SMG|Sm-G | |
| Cytomap | UCSC genome browser: 2p13.3 | |
| Genomic location | chr2 :70508505-70520869 | |
| Type of gene | protein-coding | |
| RefGenes | NM_003096.2, | |
| Ensembl id | ENSG00000143977 | |
| Description | sm protein Gsmall nuclear ribonucleoprotein GsnRNP-G | |
| Modification date | 20141215 | |
| dbXrefs | MIM : 603542 | |
| HGNC : HGNC | ||
| Ensembl : ENSG00000143977 | ||
| HPRD : 04646 | ||
| Vega : OTTHUMG00000129670 | ||
| Protein | UniProt: go to UniProt's Cross Reference DB Table | |
| Expression | CleanEX: HS_SNRPG | |
| BioGPS: 6637 | ||
| Gene Expression Atlas: ENSG00000143977 | ||
| The Human Protein Atlas: ENSG00000143977 | ||
| Pathway | NCI Pathway Interaction Database: SNRPG | |
| KEGG: SNRPG | ||
| REACTOME: SNRPG | ||
| ConsensusPathDB | ||
| Pathway Commons: SNRPG | ||
| Metabolism | MetaCyc: SNRPG | |
| HUMANCyc: SNRPG | ||
| Regulation | Ensembl's Regulation: ENSG00000143977 | |
| miRBase: chr2 :70,508,505-70,520,869 | ||
| TargetScan: NM_003096 | ||
| cisRED: ENSG00000143977 | ||
| Context | iHOP: SNRPG | |
| cancer metabolism search in PubMed: SNRPG | ||
| UCL Cancer Institute: SNRPG | ||
| Assigned class in ccmGDB | C | |
| Top |
| Phenotypic Information for SNRPG(metabolism pathway, cancer, disease, phenome) |
| Cancer | CGAP: SNRPG |
| Familial Cancer Database: SNRPG | |
| * This gene is included in those cancer gene databases. |
|
|
|
|
|
| . | ||||||||||||||
Oncogene 1 | Significant driver gene in | |||||||||||||||||||
| cf) number; DB name 1 Oncogene; http://nar.oxfordjournals.org/content/35/suppl_1/D721.long, 2 Tumor Suppressor gene; https://bioinfo.uth.edu/TSGene/, 3 Cancer Gene Census; http://www.nature.com/nrc/journal/v4/n3/abs/nrc1299.html, 4 CancerGenes; http://nar.oxfordjournals.org/content/35/suppl_1/D721.long, 5 Network of Cancer Gene; http://ncg.kcl.ac.uk/index.php, 1Therapeutic Vulnerabilities in Cancer; http://cbio.mskcc.org/cancergenomics/statius/ |
| REACTOME_METABOLISM_OF_NON_CODING_RNA REACTOME_METABOLISM_OF_RNA | |
| OMIM | |
| Orphanet | |
| Disease | KEGG Disease: SNRPG |
| MedGen: SNRPG (Human Medical Genetics with Condition) | |
| ClinVar: SNRPG | |
| Phenotype | MGI: SNRPG (International Mouse Phenotyping Consortium) |
| PhenomicDB: SNRPG | |
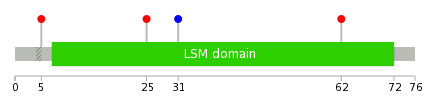
| Mutations for SNRPG |
| * Under tables are showing count per each tissue to give us broad intuition about tissue specific mutation patterns.You can go to the detailed page for each mutation database's web site. |
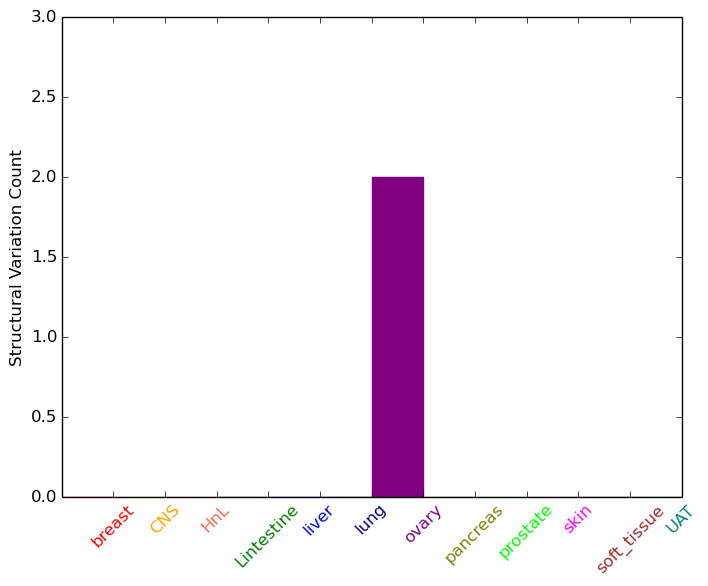
| - Statistics for Tissue and Mutation type | Top |
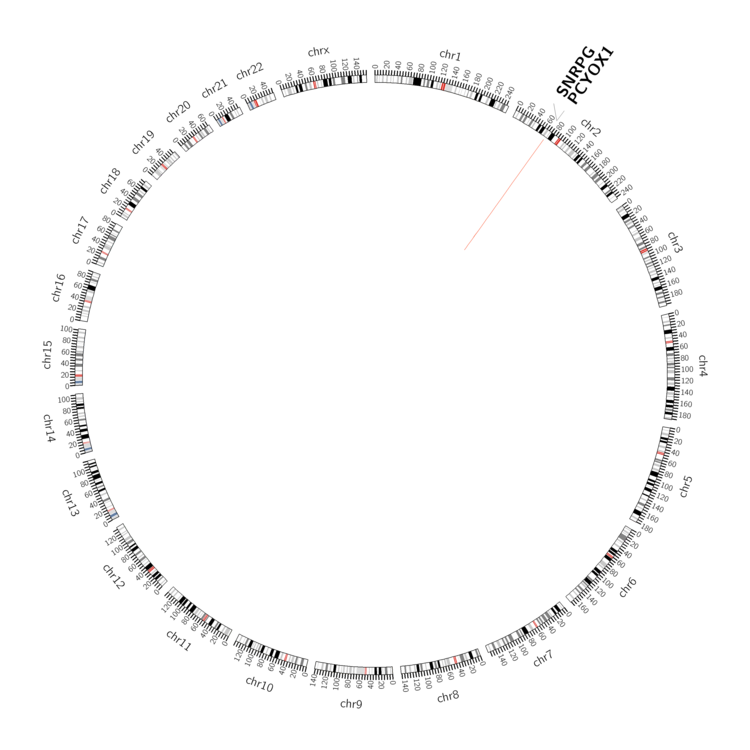 |
| - For Inter-chromosomal Variations |
| There's no inter-chromosomal structural variation. |
| - For Intra-chromosomal Variations |
| * Intra-chromosomal variantions includes 'intrachromosomal amplicon to amplicon', 'intrachromosomal amplicon to non-amplified dna', 'intrachromosomal deletion', 'intrachromosomal fold-back inversion', 'intrachromosomal inversion', 'intrachromosomal tandem duplication', 'Intrachromosomal unknown type', 'intrachromosomal with inverted orientation', 'intrachromosomal with non-inverted orientation'. |
 |
| Sample | Symbol_a | Chr_a | Start_a | End_a | Symbol_b | Chr_b | Start_b | End_b |
| ovary | SNRPG | chr2 | 70509407 | 70509427 | PCYOX1 | chr2 | 70502627 | 70502647 |
| ovary | SNRPG | chr2 | 70509413 | 70509433 | PCYOX1 | chr2 | 70502627 | 70502647 |
| cf) Tissue number; Tissue name (1;Breast, 2;Central_nervous_system, 3;Haematopoietic_and_lymphoid_tissue, 4;Large_intestine, 5;Liver, 6;Lung, 7;Ovary, 8;Pancreas, 9;Prostate, 10;Skin, 11;Soft_tissue, 12;Upper_aerodigestive_tract) |
| * From mRNA Sanger sequences, Chitars2.0 arranged chimeric transcripts. This table shows SNRPG related fusion information. |
| ID | Head Gene | Tail Gene | Accession | Gene_a | qStart_a | qEnd_a | Chromosome_a | tStart_a | tEnd_a | Gene_a | qStart_a | qEnd_a | Chromosome_a | tStart_a | tEnd_a |
| BU186812 | SNRPG | 3 | 100 | 2 | 70520748 | 70520845 | NOMO2 | 99 | 739 | 16 | 18530823 | 18535874 | |
| Top |
| There's no copy number variation information in COSMIC data for this gene. |
| Top |
|
 |
| Top |
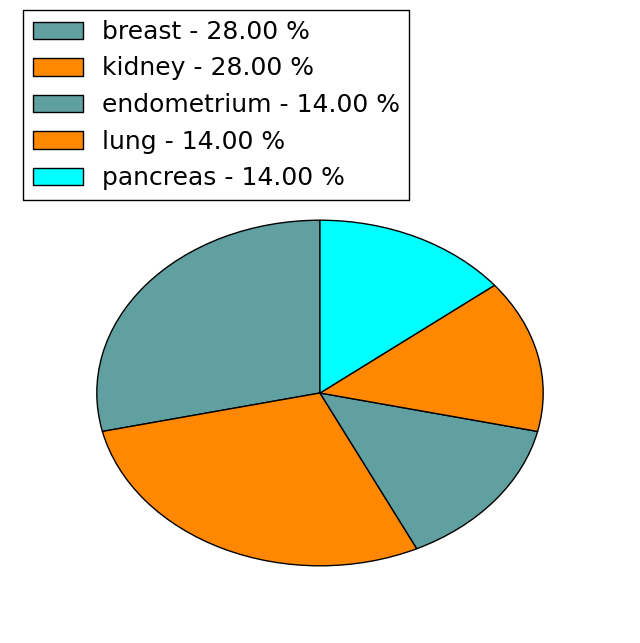
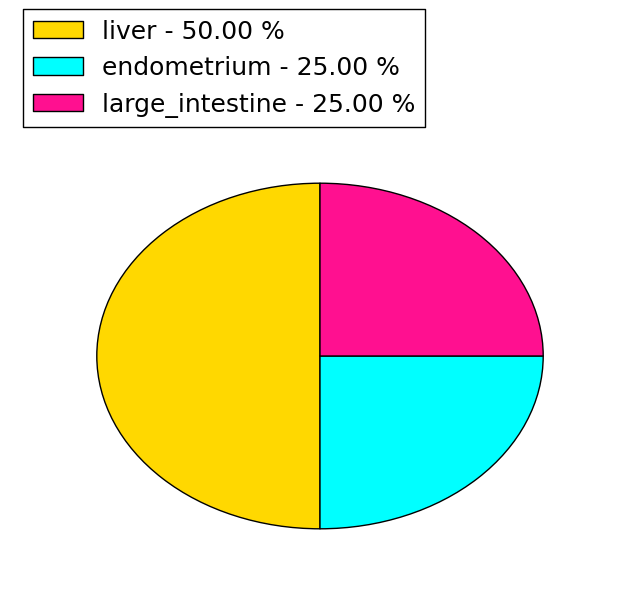
| Stat. for Non-Synonymous SNVs (# total SNVs=7) | (# total SNVs=4) |
 |  |
(# total SNVs=0) | (# total SNVs=0) |
| Top |
| * When you move the cursor on each content, you can see more deailed mutation information on the Tooltip. Those are primary_site,primary_histology,mutation(aa),pubmedID. |
| GRCh37 position | Mutation(aa) | Unique sampleID count |
| chr2:70515306-70515306 | p.R25T | 2 |
| chr2:70516486-70516486 | p.L17L | 2 |
| chr2:70515288-70515288 | p.L31* | 1 |
| chr2:70515289-70515289 | p.L31L | 1 |
| chr2:70516492-70516492 | p.K15N | 1 |
| chr2:70516503-70516503 | p.F12I | 1 |
| chr2:70520768-70520768 | p.H5R | 1 |
| chr2:70508796-70508796 | p.I67I | 1 |
| chr2:70520772-70520772 | p.A4S | 1 |
| chr2:70515213-70515213 | p.N56S | 1 |
| Top |
|
 |
| Point Mutation/ Tissue ID | 1 | 2 | 3 | 4 | 5 | 6 | 7 | 8 | 9 | 10 | 11 | 12 | 13 | 14 | 15 | 16 | 17 | 18 | 19 | 20 |
| # sample | 1 | 1 | 2 | |||||||||||||||||
| # mutation | 1 | 1 | 2 | |||||||||||||||||
| nonsynonymous SNV | 1 | 1 | 1 | |||||||||||||||||
| synonymous SNV | 1 |
| cf) Tissue ID; Tissue type (1; BLCA[Bladder Urothelial Carcinoma], 2; BRCA[Breast invasive carcinoma], 3; CESC[Cervical squamous cell carcinoma and endocervical adenocarcinoma], 4; COAD[Colon adenocarcinoma], 5; GBM[Glioblastoma multiforme], 6; Glioma Low Grade, 7; HNSC[Head and Neck squamous cell carcinoma], 8; KICH[Kidney Chromophobe], 9; KIRC[Kidney renal clear cell carcinoma], 10; KIRP[Kidney renal papillary cell carcinoma], 11; LAML[Acute Myeloid Leukemia], 12; LUAD[Lung adenocarcinoma], 13; LUSC[Lung squamous cell carcinoma], 14; OV[Ovarian serous cystadenocarcinoma ], 15; PAAD[Pancreatic adenocarcinoma], 16; PRAD[Prostate adenocarcinoma], 17; SKCM[Skin Cutaneous Melanoma], 18:STAD[Stomach adenocarcinoma], 19:THCA[Thyroid carcinoma], 20:UCEC[Uterine Corpus Endometrial Carcinoma]) |
| Top |
| * We represented just top 10 SNVs. When you move the cursor on each content, you can see more deailed mutation information on the Tooltip. Those are primary_site, primary_histology, mutation(aa), pubmedID. |
| Genomic Position | Mutation(aa) | Unique sampleID count |
| chr2:70508813 | p.I62V | 1 |
| chr2:70515289 | p.L31L | 1 |
| chr2:70515306 | p.R25I | 1 |
| chr2:70520768 | p.H5R | 1 |
| * Copy number data were extracted from TCGA using R package TCGA-Assembler. The URLs of all public data files on TCGA DCC data server were gathered on Jan-05-2015. Function ProcessCNAData in TCGA-Assembler package was used to obtain gene-level copy number value which is calculated as the average copy number of the genomic region of a gene. |
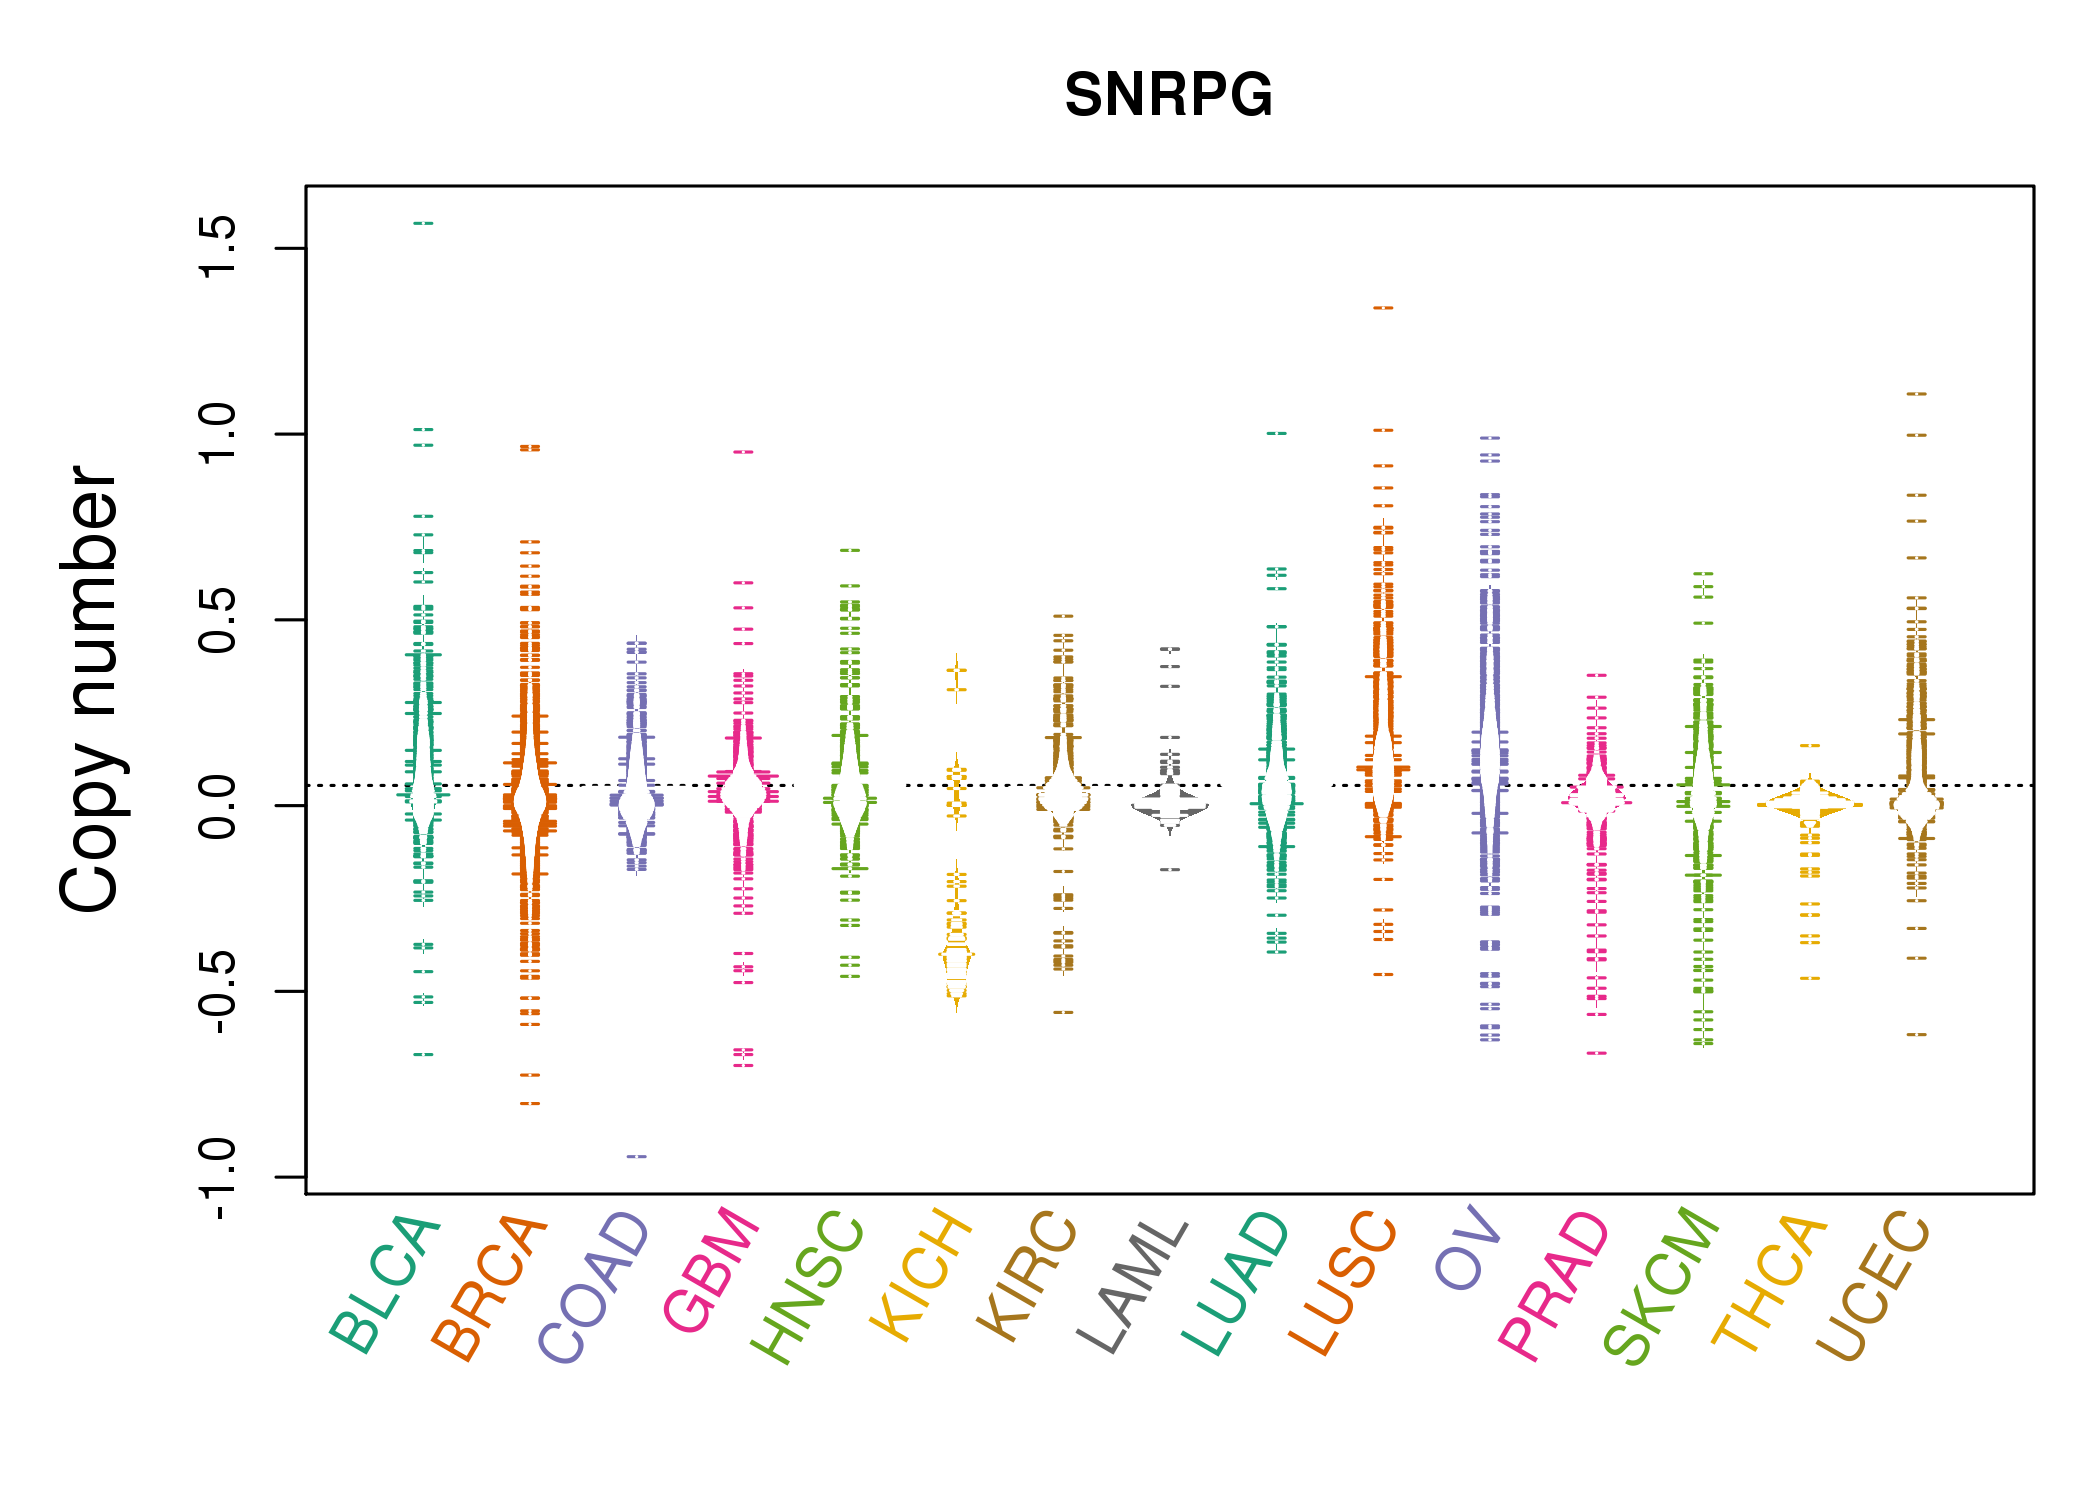 |
| cf) Tissue ID[Tissue type]: BLCA[Bladder Urothelial Carcinoma], BRCA[Breast invasive carcinoma], CESC[Cervical squamous cell carcinoma and endocervical adenocarcinoma], COAD[Colon adenocarcinoma], GBM[Glioblastoma multiforme], Glioma Low Grade, HNSC[Head and Neck squamous cell carcinoma], KICH[Kidney Chromophobe], KIRC[Kidney renal clear cell carcinoma], KIRP[Kidney renal papillary cell carcinoma], LAML[Acute Myeloid Leukemia], LUAD[Lung adenocarcinoma], LUSC[Lung squamous cell carcinoma], OV[Ovarian serous cystadenocarcinoma ], PAAD[Pancreatic adenocarcinoma], PRAD[Prostate adenocarcinoma], SKCM[Skin Cutaneous Melanoma], STAD[Stomach adenocarcinoma], THCA[Thyroid carcinoma], UCEC[Uterine Corpus Endometrial Carcinoma] |
| Top |
| Gene Expression for SNRPG |
| * CCLE gene expression data were extracted from CCLE_Expression_Entrez_2012-10-18.res: Gene-centric RMA-normalized mRNA expression data. |
 |
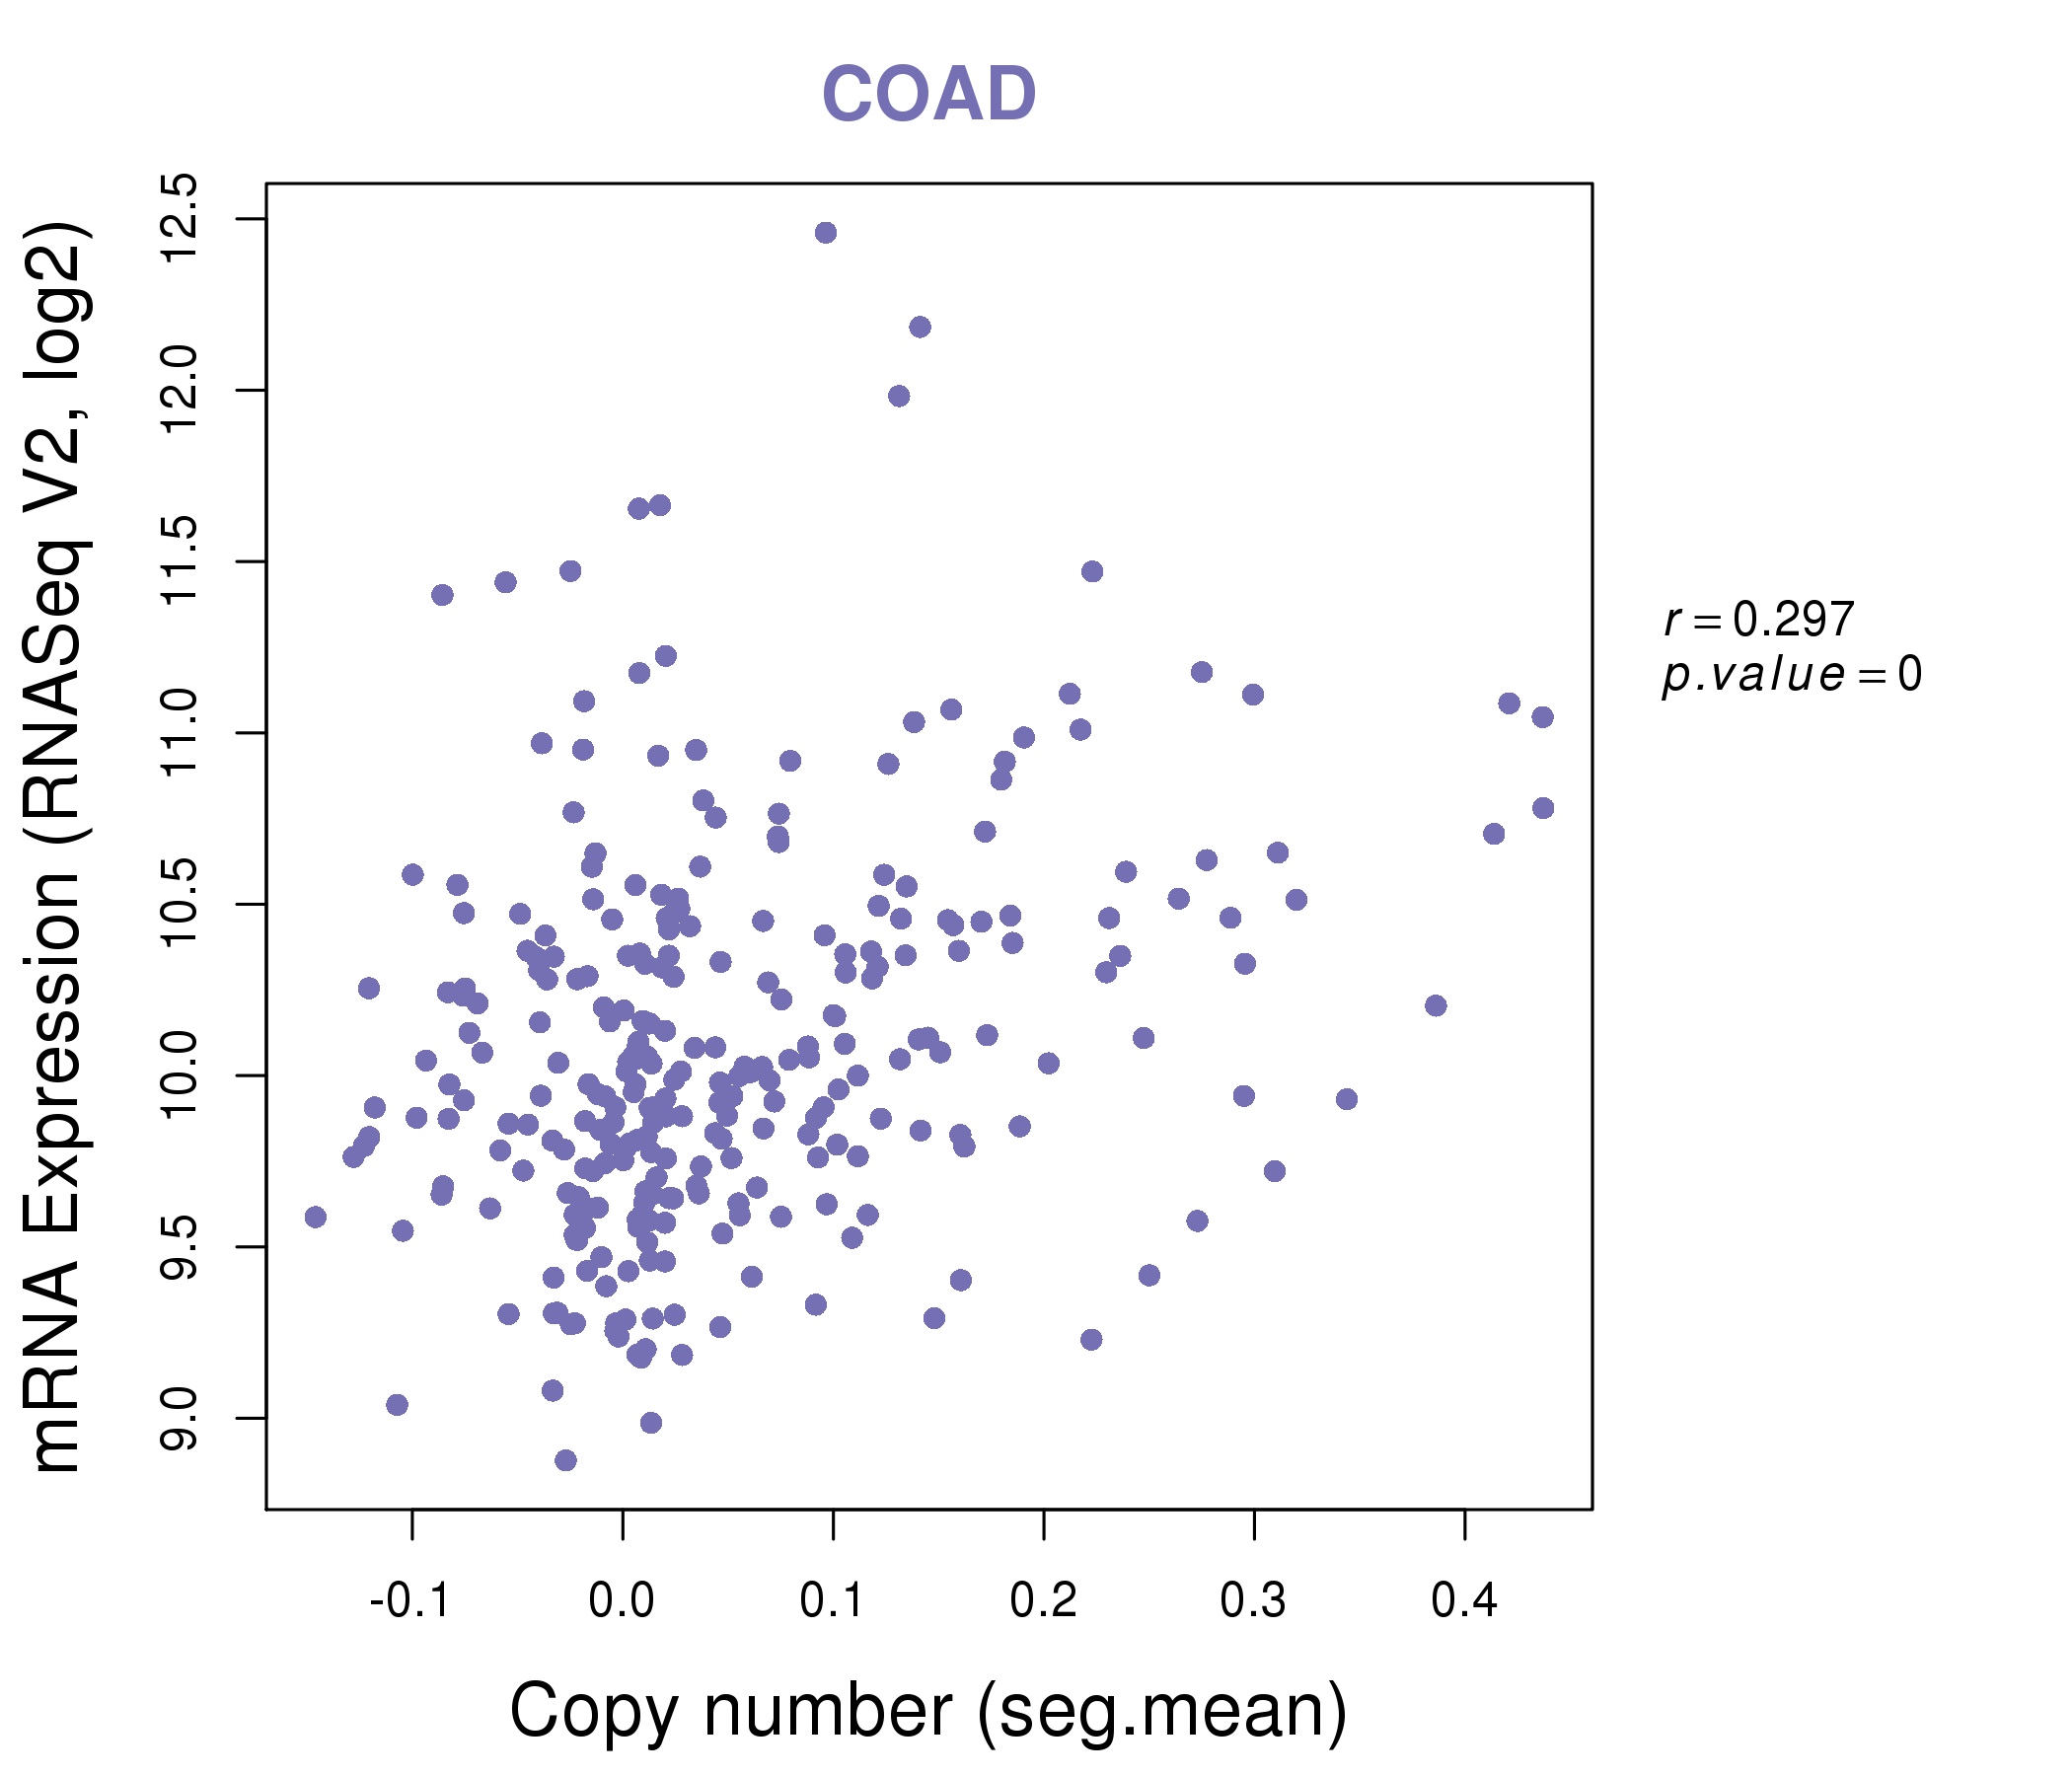
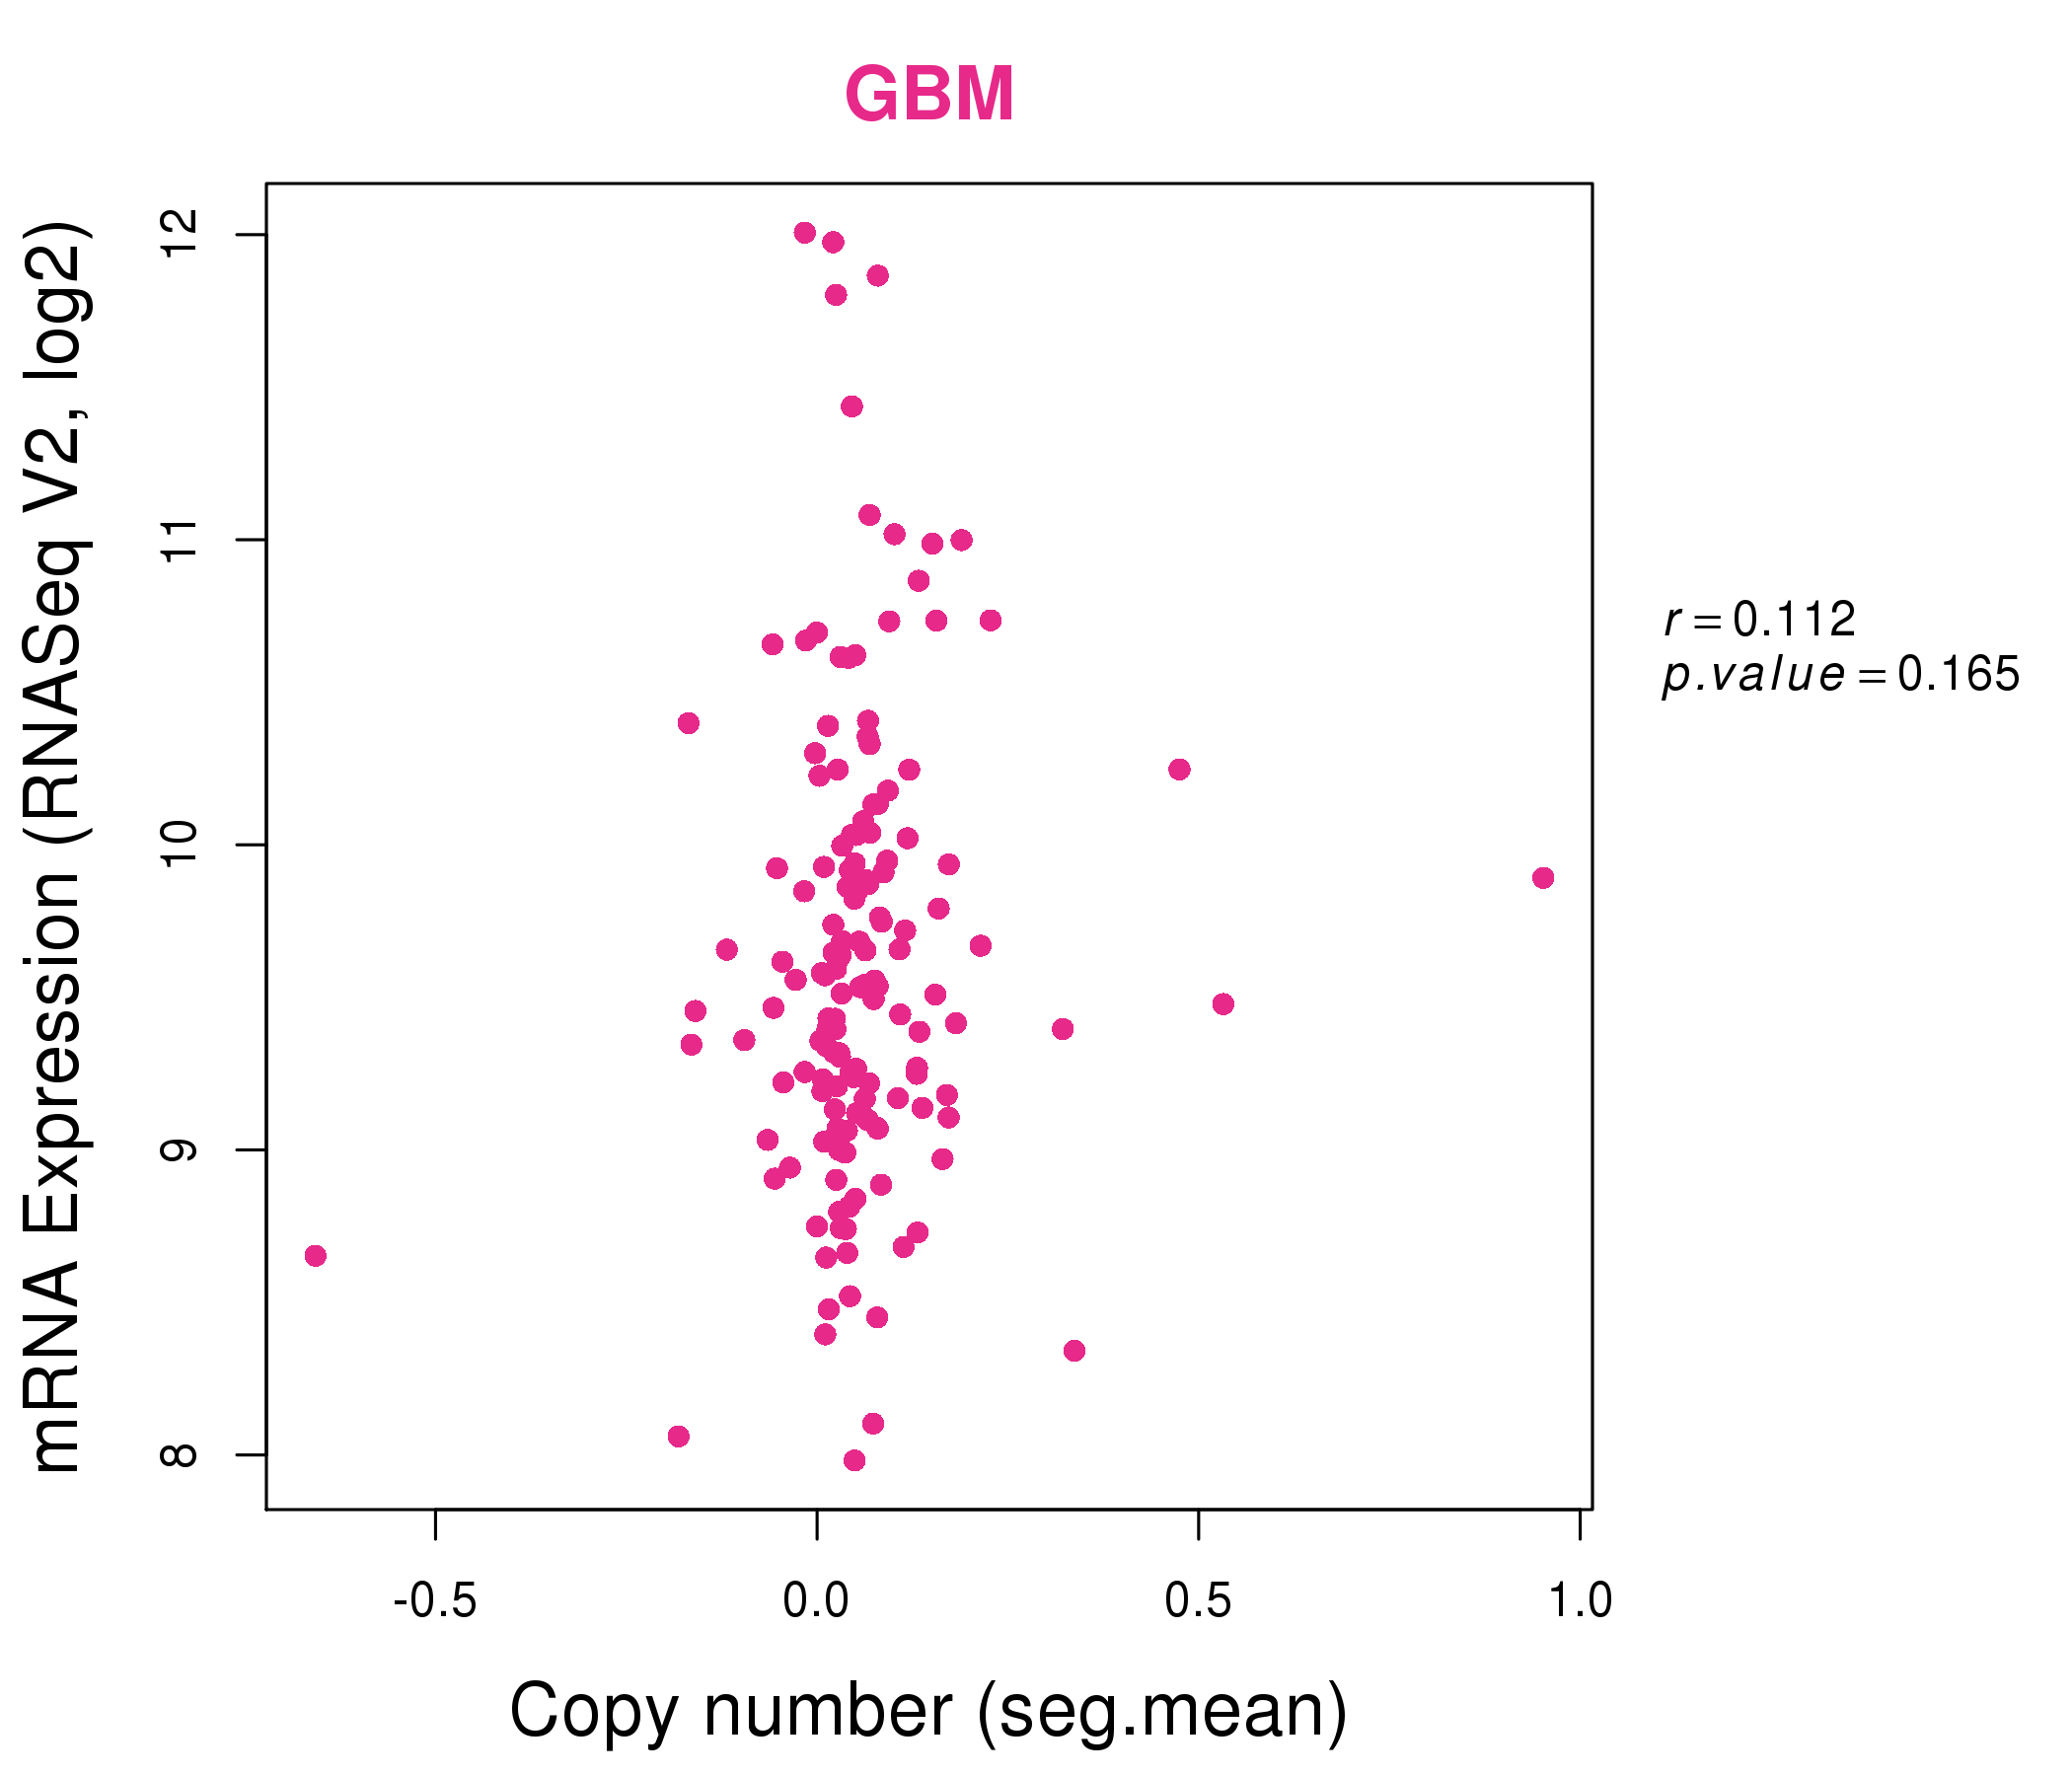
| * Normalized gene expression data of RNASeqV2 was extracted from TCGA using R package TCGA-Assembler. The URLs of all public data files on TCGA DCC data server were gathered at Jan-05-2015. Only eight cancer types have enough normal control samples for differential expression analysis. (t test, adjusted p<0.05 (using Benjamini-Hochberg FDR)) |
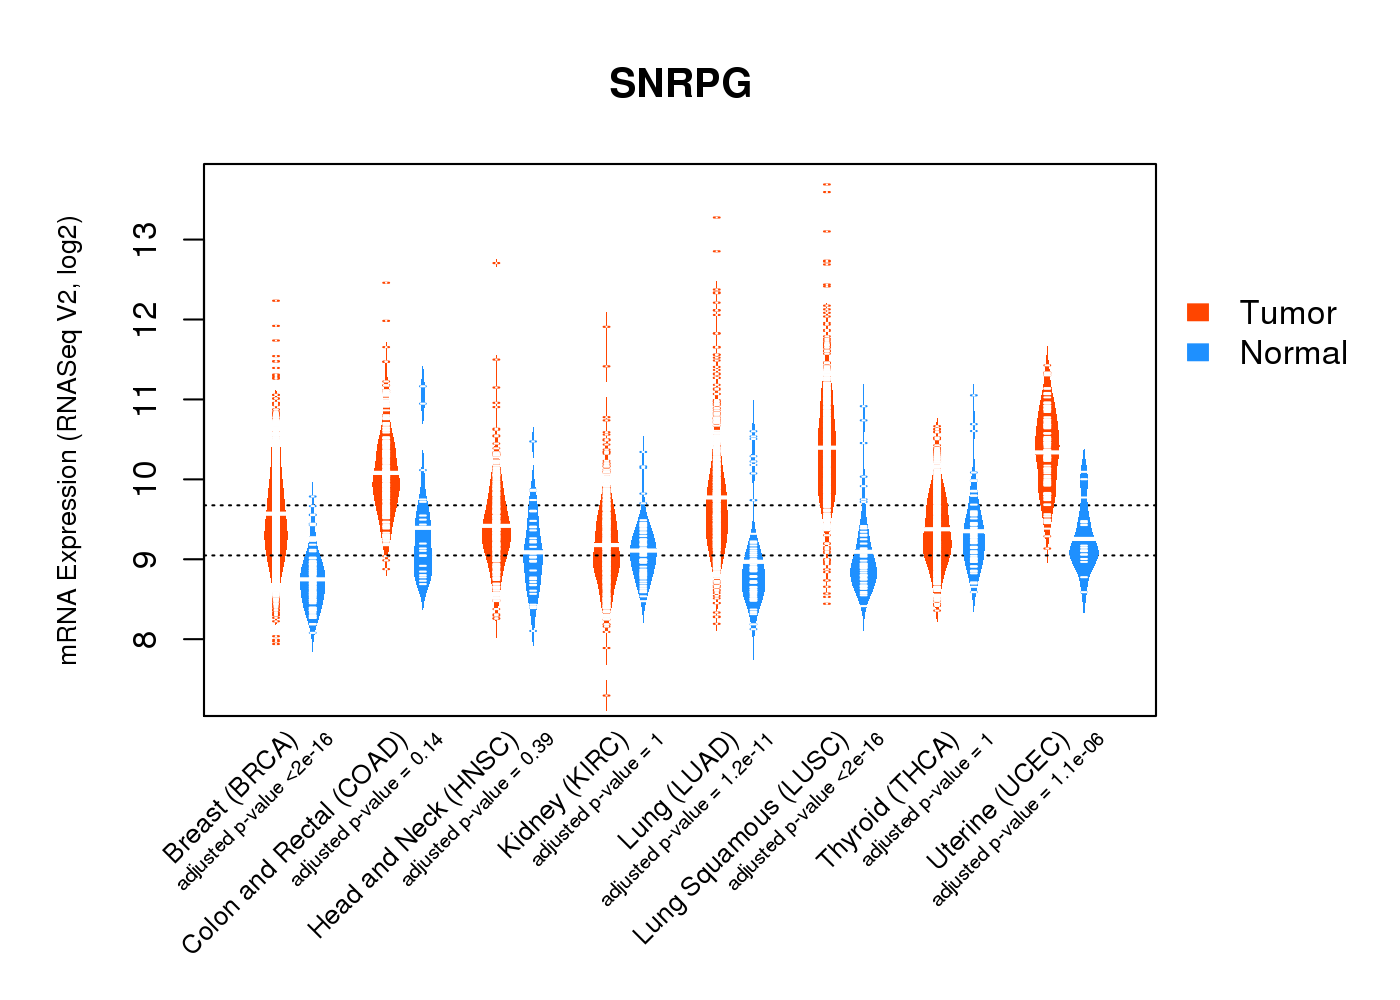 |
| Top |
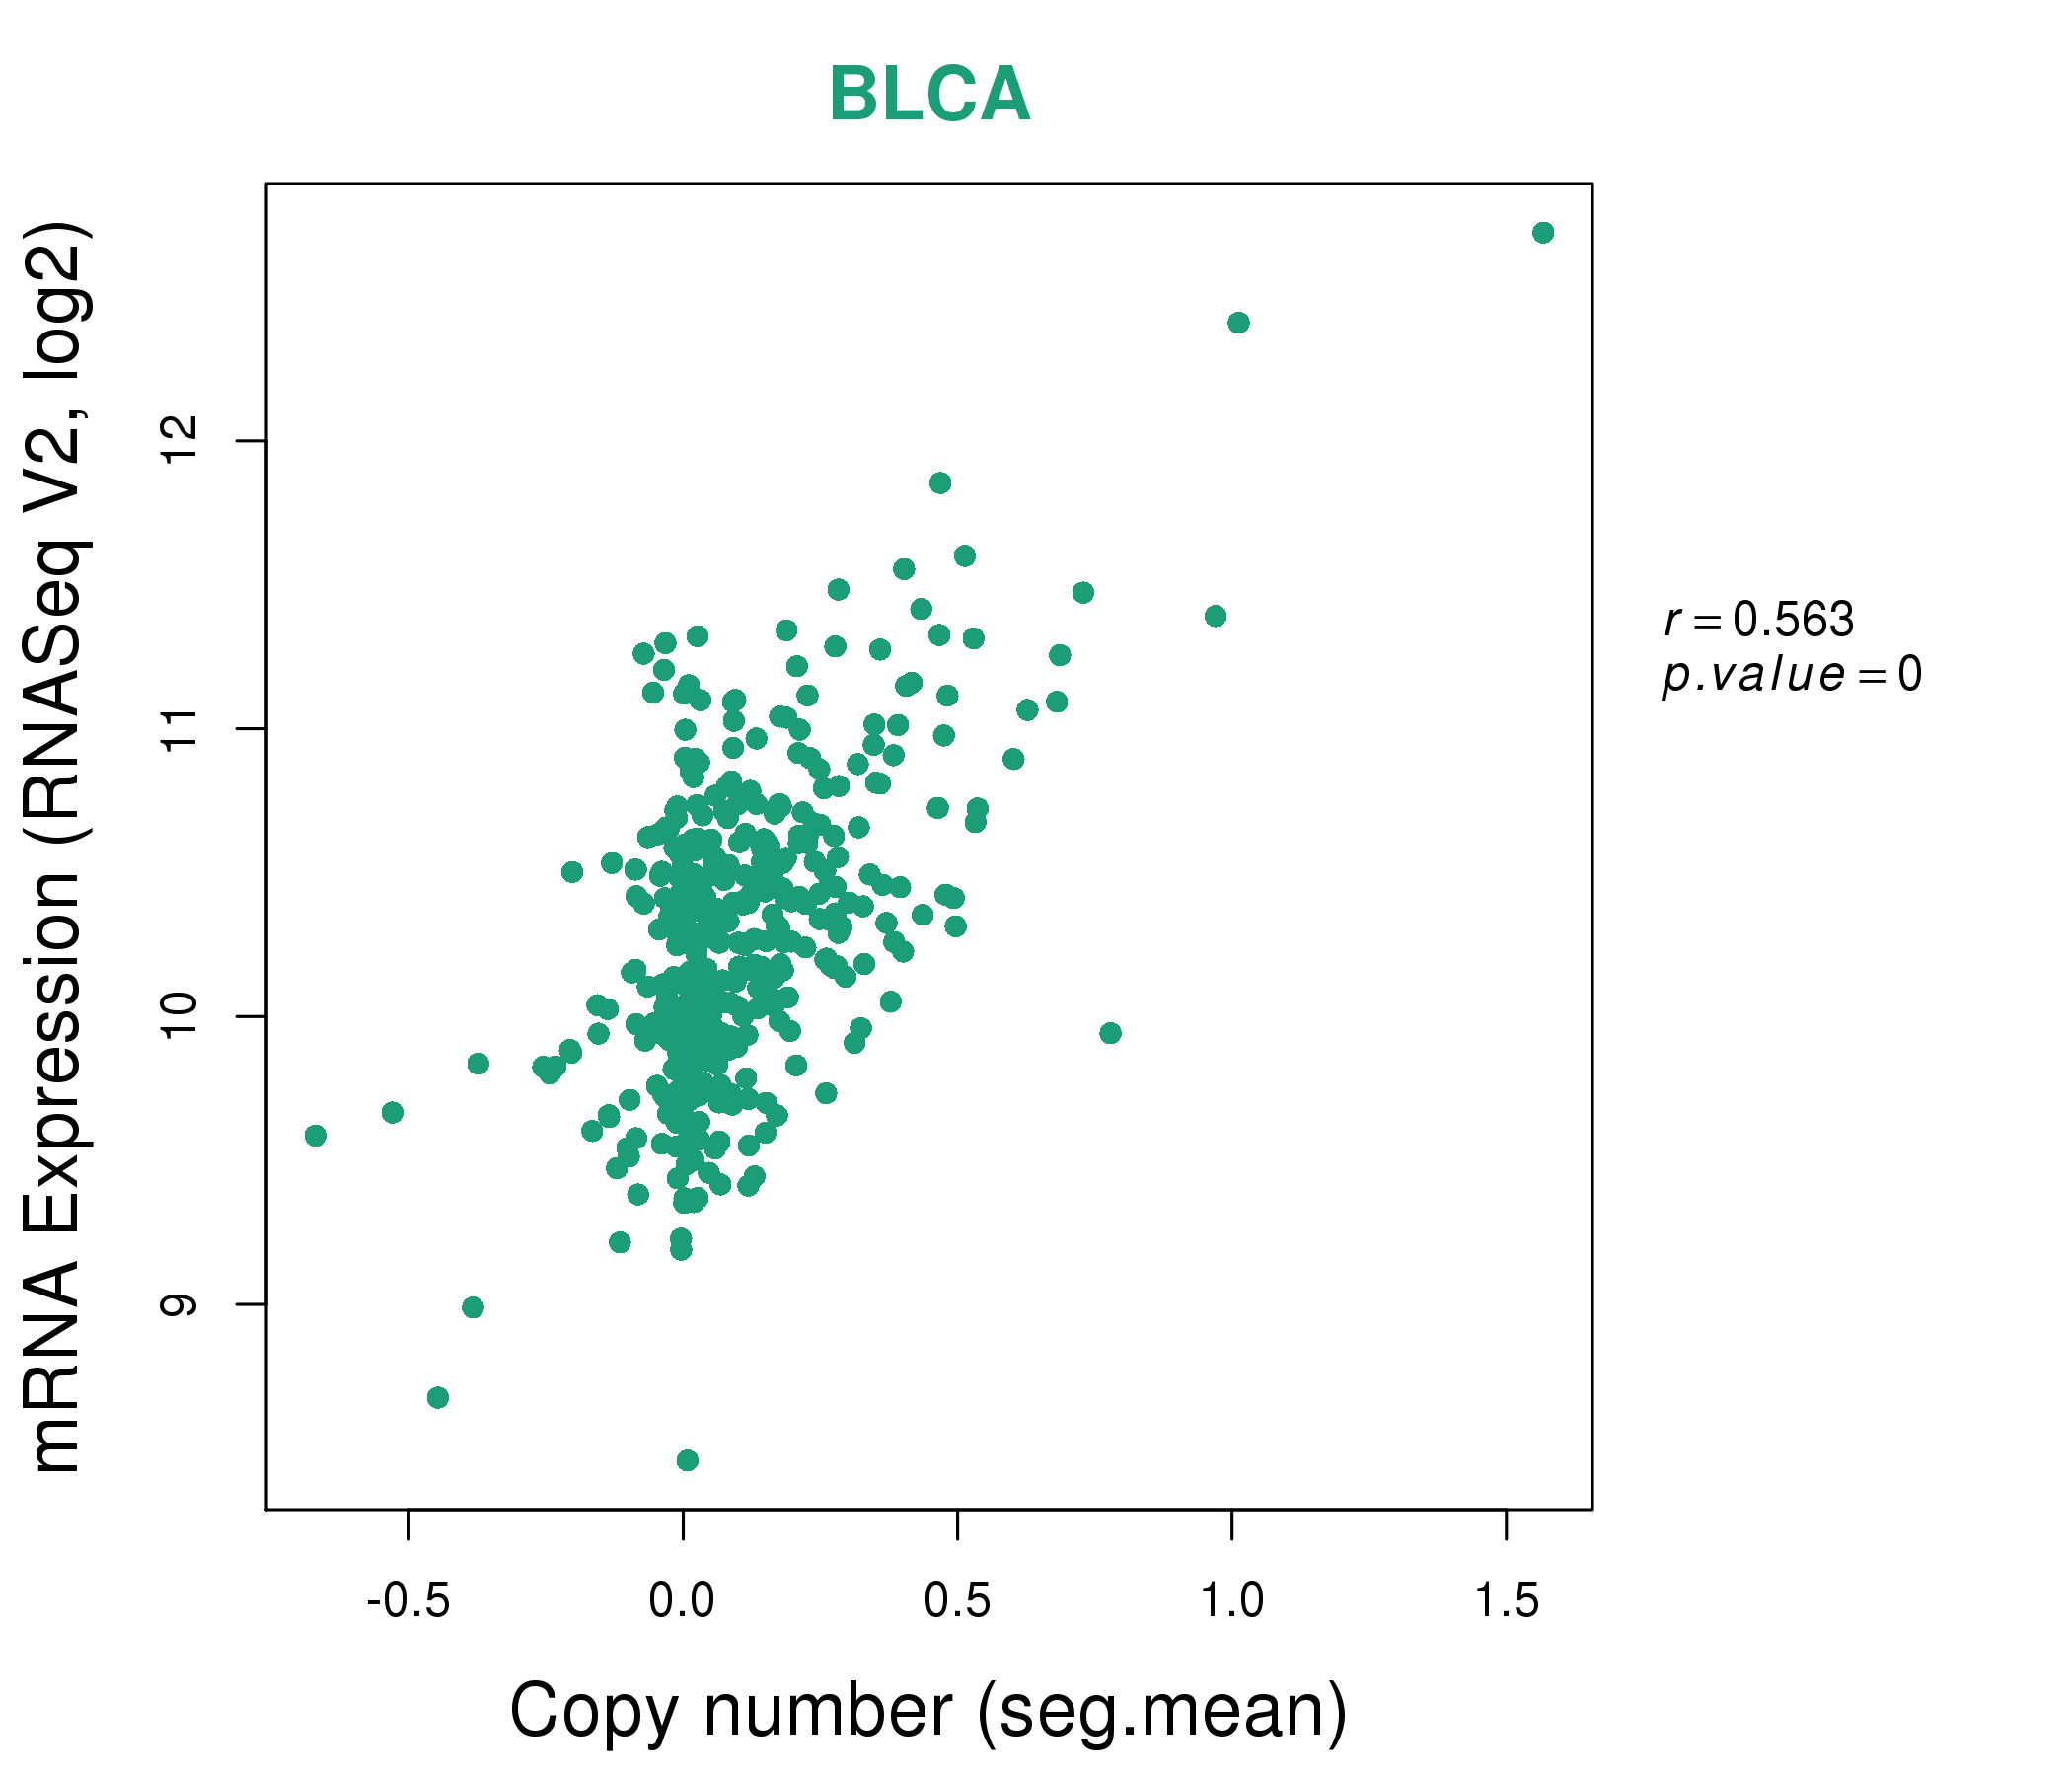
| * This plots show the correlation between CNV and gene expression. |
: Open all plots for all cancer types
 |
|
 |
|

| Top |
| Gene-Gene Network Information |
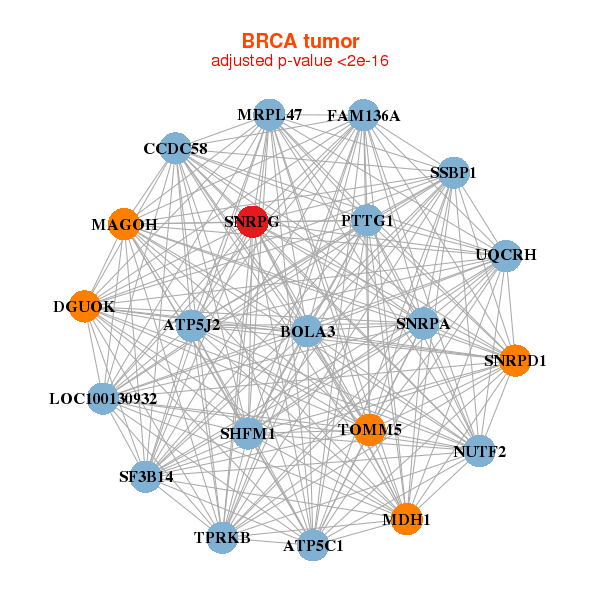
| * Co-Expression network figures were drawn using R package igraph. Only the top 20 genes with the highest correlations were shown. Red circle: input gene, orange circle: cell metabolism gene, sky circle: other gene |
: Open all plots for all cancer types
 |
|
| ATP5C1,ATP5J2,BOLA3,CCDC58,DGUOK,FAM136A,LOC100130932, MAGOH,MDH1,MRPL47,NUTF2,PTTG1,SF3B14,SHFM1, SNRPA,SNRPD1,SNRPG,SSBP1,TOMM5,TPRKB,UQCRH | CDC123,DYNLT1,JTB,LSM3,MRPL47,MRPS17,MRPS23, NUTF2,PSMA4,PSMA5,RBX1,SARNP,SEC61B,SF3B14, SNRPG,SRP14,SSBP1,SUPT4H1,TOMM22,TOMM6,TXNDC17 |
 |
|
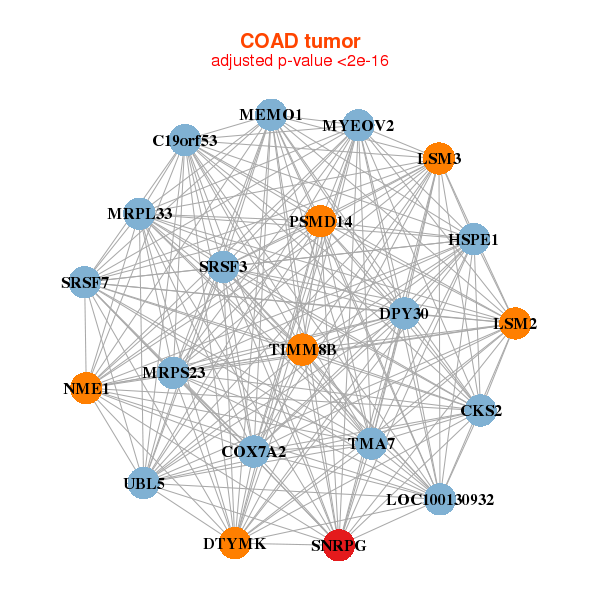
| C19orf53,TMA7,CKS2,COX7A2,DPY30,DTYMK,HSPE1, LOC100130932,LSM2,LSM3,MEMO1,MRPL33,MRPS23,MYEOV2, NME1,PSMD14,SRSF3,SRSF7,SNRPG,TIMM8B,UBL5 | EMC7,DPM1,EMG1,GLRX3,HSPE1,MRPL22,PHF5A, PSMA5,PSMA7,PSMC6,PSMD14,PTS,RAN,RBX1, SNRPG,SSBP1,TCEB1,TIMM8B,TOMM5,UBE2N,VPS29 |
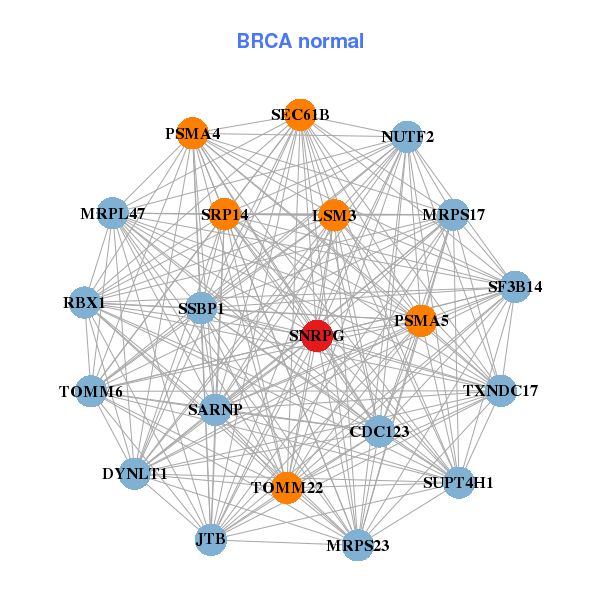
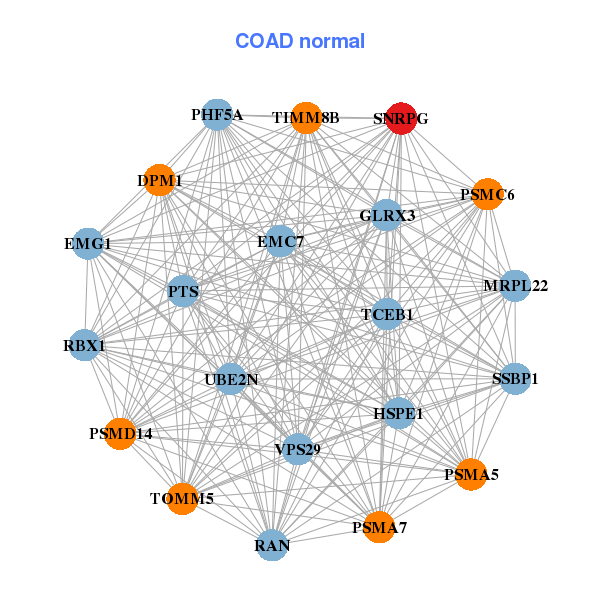
| * Co-Expression network figures were drawn using R package igraph. Only the top 20 genes with the highest correlations were shown. Red circle: input gene, orange circle: cell metabolism gene, sky circle: other gene |
: Open all plots for all cancer types
| Top |
: Open all interacting genes' information including KEGG pathway for all interacting genes from DAVID
| Top |
| Pharmacological Information for SNRPG |
| There's no related Drug. |
| Top |
| Cross referenced IDs for SNRPG |
| * We obtained these cross-references from Uniprot database. It covers 150 different DBs, 18 categories. http://www.uniprot.org/help/cross_references_section |
: Open all cross reference information
|
Copyright © 2016-Present - The Univsersity of Texas Health Science Center at Houston @ |