|
|||||||||||||||||||||||||||||||||||||||||||||||||||||||||||||||||||||||||||||||||||||||||||||||||||||||||||||||||||||||||||||||||||||||||||||||||||||||||||||||||||||||||||||||||||||||||||||||||||||||||||||||||||||||||||||||||||||||||||||||||||||||||||||||||||||||||||||||||||||||||||||||||||||||||||||||||||||||||||||||||||||||||||||||||||
| |
| Phenotypic Information (metabolism pathway, cancer, disease, phenome) |
| |
| |
| Gene-Gene Network Information: Co-Expression Network, Interacting Genes & KEGG |
| |
|


| Gene Summary for UAP1 |
| Top |
| Phenotypic Information for UAP1(metabolism pathway, cancer, disease, phenome) |
| Cancer | CGAP: UAP1 |
| Familial Cancer Database: UAP1 | |
| * This gene is included in those cancer gene databases. |
|
|
|
|
|
|
| |||||||||||||||||||||||||||||||||||||||||||||||||||||||||||||||||||||||||||||||||||||||||||||||||||||||||||||||||||||||||||||||||||||||||||||||||||||||||||||||||||||||||||||||||||||||||||||||||||||||||||||||||||||||||||||||||||||||||||||||||||||||||||||||||||||||||||||||||||||||||||||||||||||||||||||||||||||||||||||||||||||||||||||
Oncogene 1 | Significant driver gene in | ||||||||||||||||||||||||||||||||||||||||||||||||||||||||||||||||||||||||||||||||||||||||||||||||||||||||||||||||||||||||||||||||||||||||||||||||||||||||||||||||||||||||||||||||||||||||||||||||||||||||||||||||||||||||||||||||||||||||||||||||||||||||||||||||||||||||||||||||||||||||||||||||||||||||||||||||||||||||||||||||||||||||||||||||||
| cf) number; DB name 1 Oncogene; http://nar.oxfordjournals.org/content/35/suppl_1/D721.long, 2 Tumor Suppressor gene; https://bioinfo.uth.edu/TSGene/, 3 Cancer Gene Census; http://www.nature.com/nrc/journal/v4/n3/abs/nrc1299.html, 4 CancerGenes; http://nar.oxfordjournals.org/content/35/suppl_1/D721.long, 5 Network of Cancer Gene; http://ncg.kcl.ac.uk/index.php, 1Therapeutic Vulnerabilities in Cancer; http://cbio.mskcc.org/cancergenomics/statius/ |
| KEGG_AMINO_SUGAR_AND_NUCLEOTIDE_SUGAR_METABOLISM | |
| OMIM | |
| Orphanet | |
| Disease | KEGG Disease: UAP1 |
| MedGen: UAP1 (Human Medical Genetics with Condition) | |
| ClinVar: UAP1 | |
| Phenotype | MGI: UAP1 (International Mouse Phenotyping Consortium) |
| PhenomicDB: UAP1 | |
| Mutations for UAP1 |
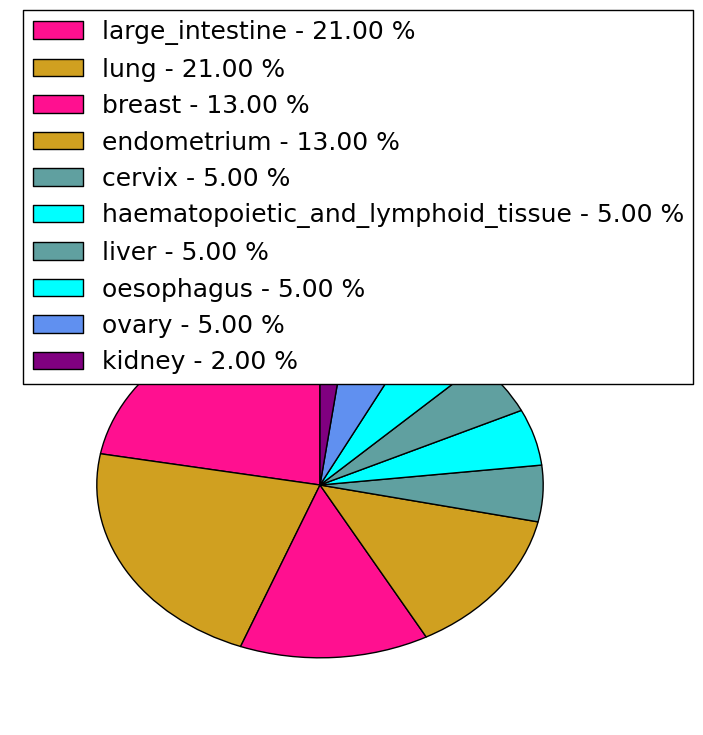
| * Under tables are showing count per each tissue to give us broad intuition about tissue specific mutation patterns.You can go to the detailed page for each mutation database's web site. |
| There's no structural variation information in COSMIC data for this gene. |
| * From mRNA Sanger sequences, Chitars2.0 arranged chimeric transcripts. This table shows UAP1 related fusion information. |
| ID | Head Gene | Tail Gene | Accession | Gene_a | qStart_a | qEnd_a | Chromosome_a | tStart_a | tEnd_a | Gene_a | qStart_a | qEnd_a | Chromosome_a | tStart_a | tEnd_a |
| AL042818 | SMURF1 | 1 | 405 | 7 | 98647203 | 98647605 | UAP1 | 405 | 603 | 1 | 162566157 | 162566352 | |
| Top |
| Mutation type/ Tissue ID | brca | cns | cerv | endome | haematopo | kidn | Lintest | liver | lung | ns | ovary | pancre | prost | skin | stoma | thyro | urina | |||
| Total # sample | 4 | 1 | ||||||||||||||||||
| GAIN (# sample) | 4 | 1 | ||||||||||||||||||
| LOSS (# sample) |
| cf) Tissue ID; Tissue type (1; Breast, 2; Central_nervous_system, 3; Cervix, 4; Endometrium, 5; Haematopoietic_and_lymphoid_tissue, 6; Kidney, 7; Large_intestine, 8; Liver, 9; Lung, 10; NS, 11; Ovary, 12; Pancreas, 13; Prostate, 14; Skin, 15; Stomach, 16; Thyroid, 17; Urinary_tract) |
| Top |
|
 |
| Top |
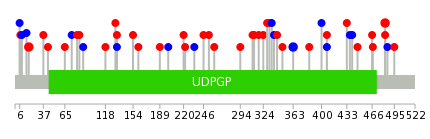
| Stat. for Non-Synonymous SNVs (# total SNVs=37) | (# total SNVs=11) |
 |  |
(# total SNVs=1) | (# total SNVs=0) |
 |
| Top |
| * When you move the cursor on each content, you can see more deailed mutation information on the Tooltip. Those are primary_site,primary_histology,mutation(aa),pubmedID. |
| GRCh37 position | Mutation(aa) | Unique sampleID count |
| chr1:162549290-162549290 | p.E189fs*3 | 2 |
| chr1:162569083-162569083 | p.D483G | 2 |
| chr1:162535911-162535911 | p.L18P | 2 |
| chr1:162560164-162560164 | p.K407N | 2 |
| chr1:162546767-162546767 | p.P161S | 1 |
| chr1:162567623-162567623 | p.S467F | 1 |
| chr1:162535877-162535877 | p.K7E | 1 |
| chr1:162551193-162551193 | p.A260S | 1 |
| chr1:162536109-162536109 | p.Q84R | 1 |
| chr1:162558499-162558499 | p.L349M | 1 |
| Top |
|
 |
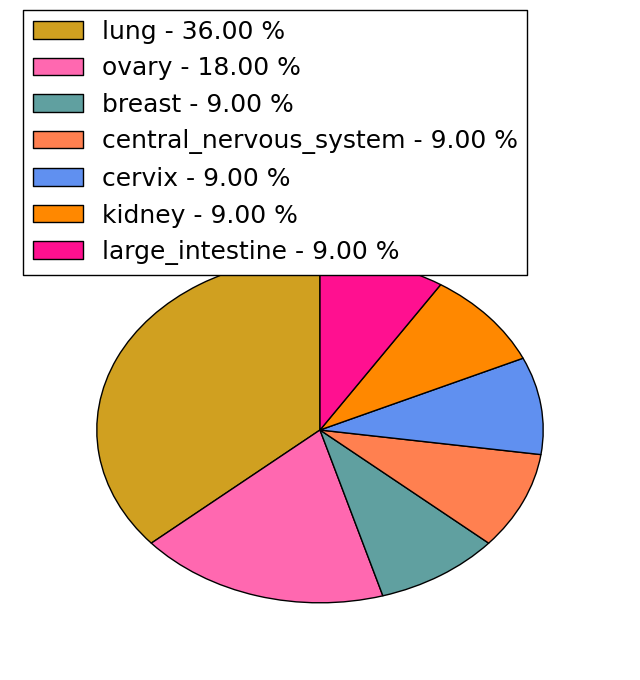
| Point Mutation/ Tissue ID | 1 | 2 | 3 | 4 | 5 | 6 | 7 | 8 | 9 | 10 | 11 | 12 | 13 | 14 | 15 | 16 | 17 | 18 | 19 | 20 |
| # sample | 2 | 1 | 5 | 1 | 1 | 6 | 2 | 4 | 2 | 3 | 3 | |||||||||
| # mutation | 2 | 2 | 5 | 1 | 1 | 8 | 2 | 4 | 2 | 4 | 4 | |||||||||
| nonsynonymous SNV | 1 | 1 | 4 | 1 | 1 | 7 | 2 | 2 | 1 | 3 | 4 | |||||||||
| synonymous SNV | 1 | 1 | 1 | 1 | 2 | 1 | 1 |
| cf) Tissue ID; Tissue type (1; BLCA[Bladder Urothelial Carcinoma], 2; BRCA[Breast invasive carcinoma], 3; CESC[Cervical squamous cell carcinoma and endocervical adenocarcinoma], 4; COAD[Colon adenocarcinoma], 5; GBM[Glioblastoma multiforme], 6; Glioma Low Grade, 7; HNSC[Head and Neck squamous cell carcinoma], 8; KICH[Kidney Chromophobe], 9; KIRC[Kidney renal clear cell carcinoma], 10; KIRP[Kidney renal papillary cell carcinoma], 11; LAML[Acute Myeloid Leukemia], 12; LUAD[Lung adenocarcinoma], 13; LUSC[Lung squamous cell carcinoma], 14; OV[Ovarian serous cystadenocarcinoma ], 15; PAAD[Pancreatic adenocarcinoma], 16; PRAD[Prostate adenocarcinoma], 17; SKCM[Skin Cutaneous Melanoma], 18:STAD[Stomach adenocarcinoma], 19:THCA[Thyroid carcinoma], 20:UCEC[Uterine Corpus Endometrial Carcinoma]) |
| Top |
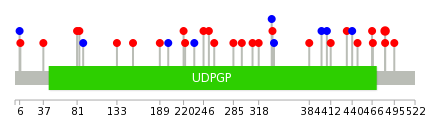
| * We represented just top 10 SNVs. When you move the cursor on each content, you can see more deailed mutation information on the Tooltip. Those are primary_site, primary_histology, mutation(aa), pubmedID. |
| Genomic Position | Mutation(aa) | Unique sampleID count |
| chr1:162569083 | p.D483G | 2 |
| chr1:162557442 | p.L6L | 1 |
| chr1:162535877 | p.P285H | 1 |
| chr1:162551117 | p.D483Y | 1 |
| chr1:162558605 | p.K7E | 1 |
| chr1:162535967 | p.D296N | 1 |
| chr1:162569119 | p.L37I | 1 |
| chr1:162551152 | p.A310E | 1 |
| chr1:162560143 | p.N495S | 1 |
| chr1:162536099 | p.T81S | 1 |
| * Copy number data were extracted from TCGA using R package TCGA-Assembler. The URLs of all public data files on TCGA DCC data server were gathered on Jan-05-2015. Function ProcessCNAData in TCGA-Assembler package was used to obtain gene-level copy number value which is calculated as the average copy number of the genomic region of a gene. |
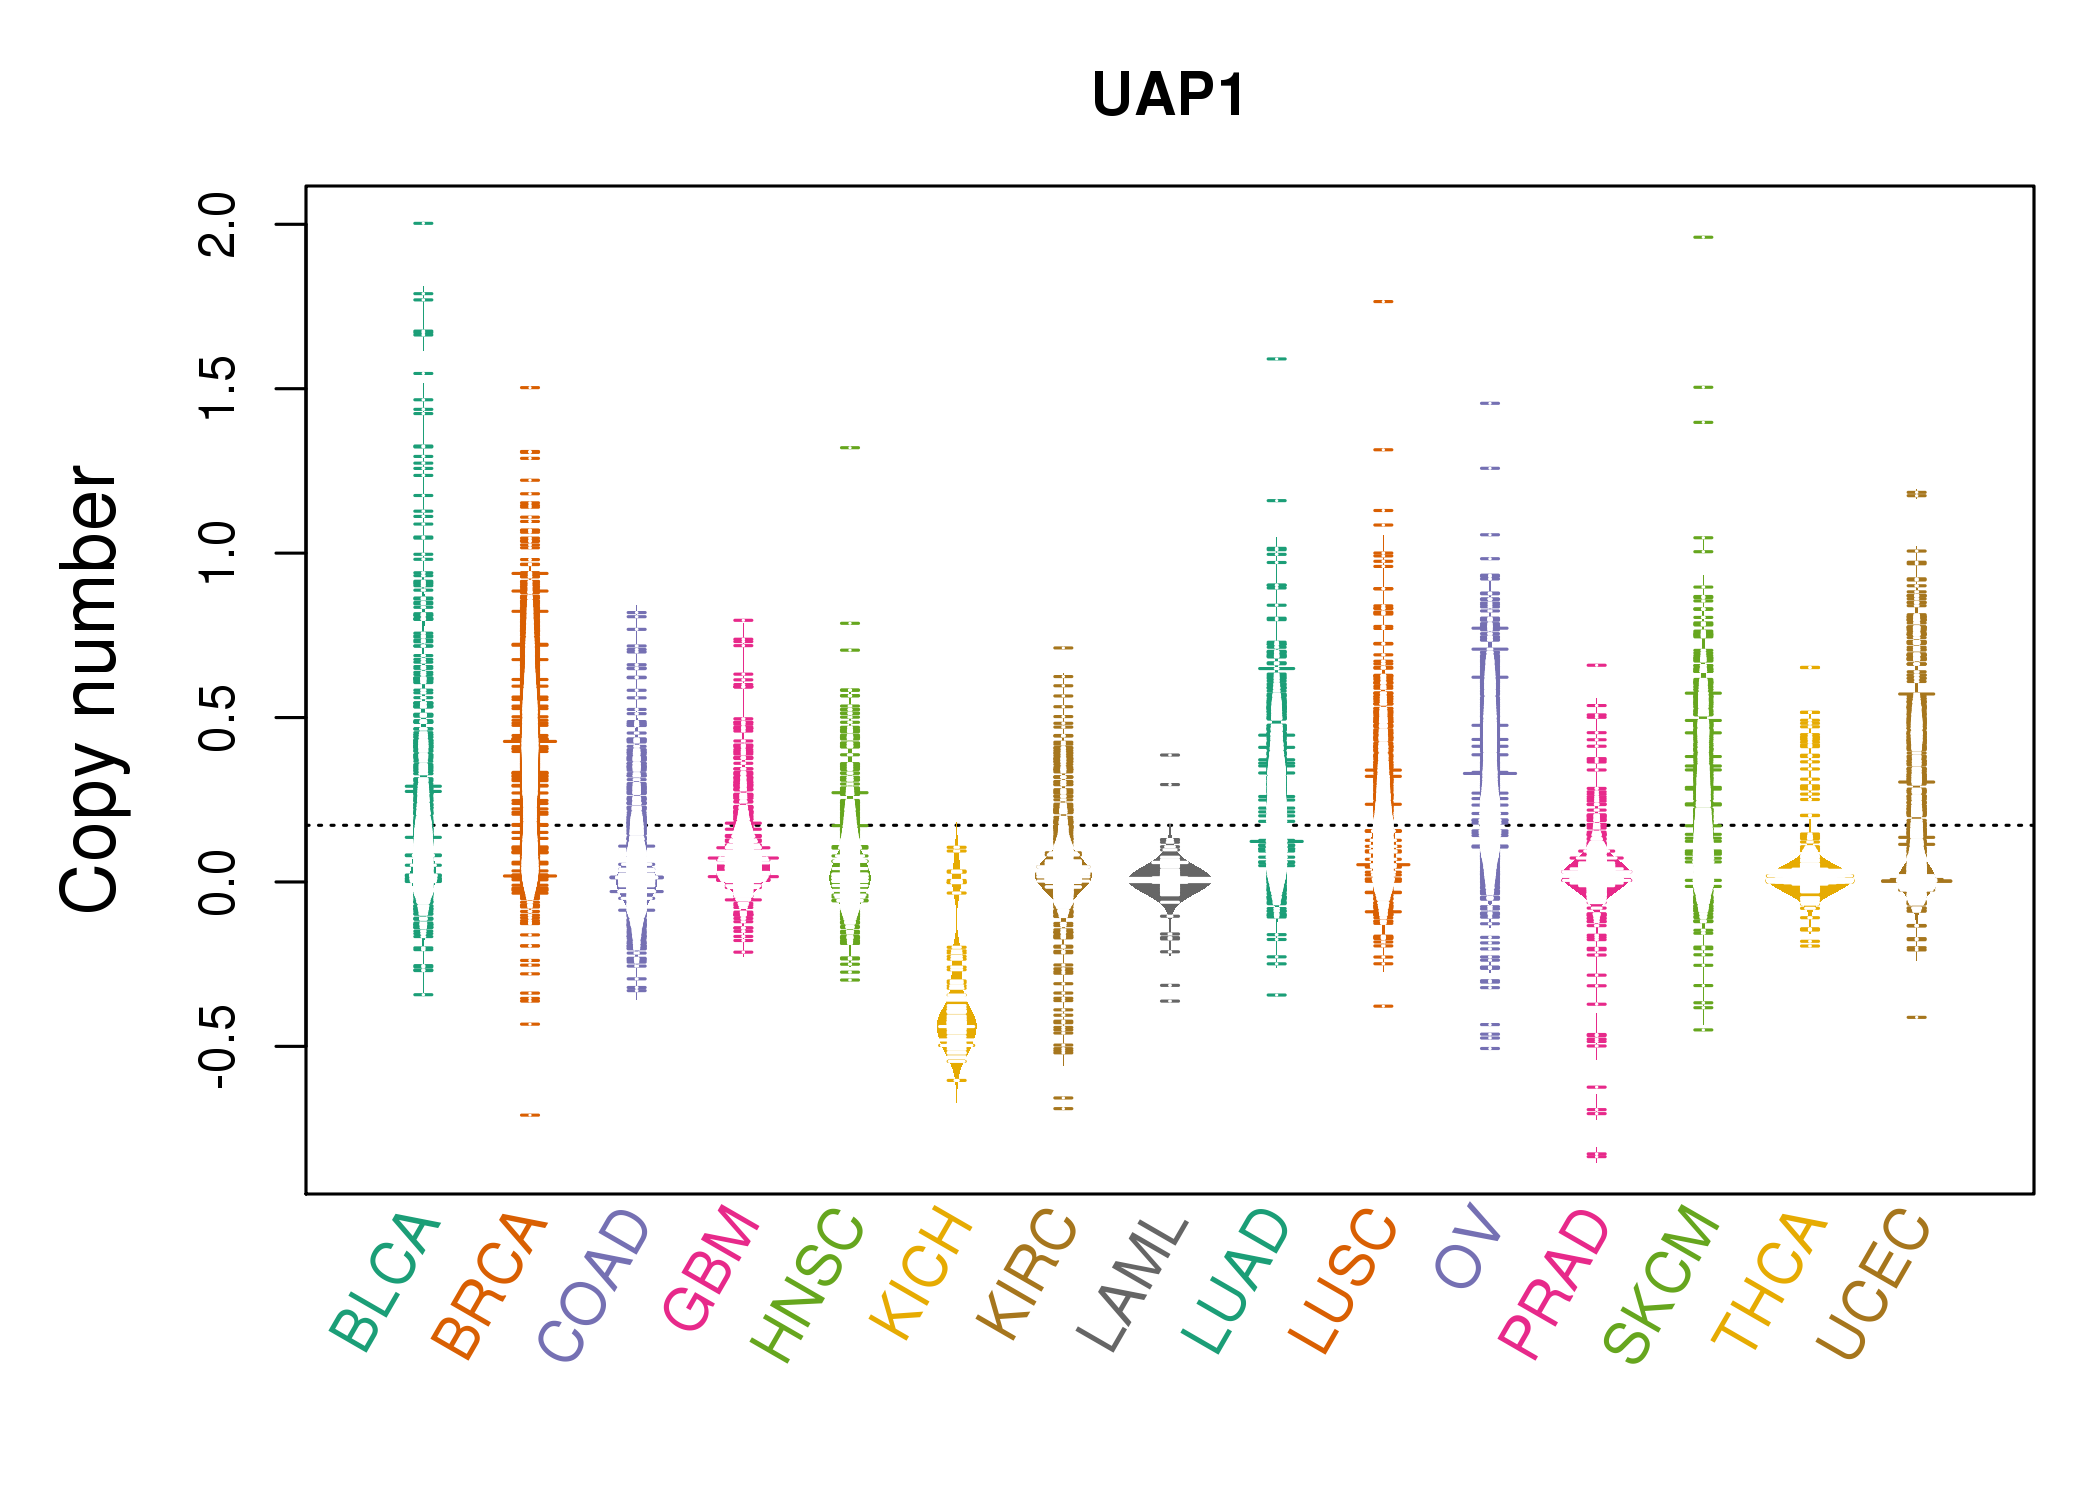 |
| cf) Tissue ID[Tissue type]: BLCA[Bladder Urothelial Carcinoma], BRCA[Breast invasive carcinoma], CESC[Cervical squamous cell carcinoma and endocervical adenocarcinoma], COAD[Colon adenocarcinoma], GBM[Glioblastoma multiforme], Glioma Low Grade, HNSC[Head and Neck squamous cell carcinoma], KICH[Kidney Chromophobe], KIRC[Kidney renal clear cell carcinoma], KIRP[Kidney renal papillary cell carcinoma], LAML[Acute Myeloid Leukemia], LUAD[Lung adenocarcinoma], LUSC[Lung squamous cell carcinoma], OV[Ovarian serous cystadenocarcinoma ], PAAD[Pancreatic adenocarcinoma], PRAD[Prostate adenocarcinoma], SKCM[Skin Cutaneous Melanoma], STAD[Stomach adenocarcinoma], THCA[Thyroid carcinoma], UCEC[Uterine Corpus Endometrial Carcinoma] |
| Top |
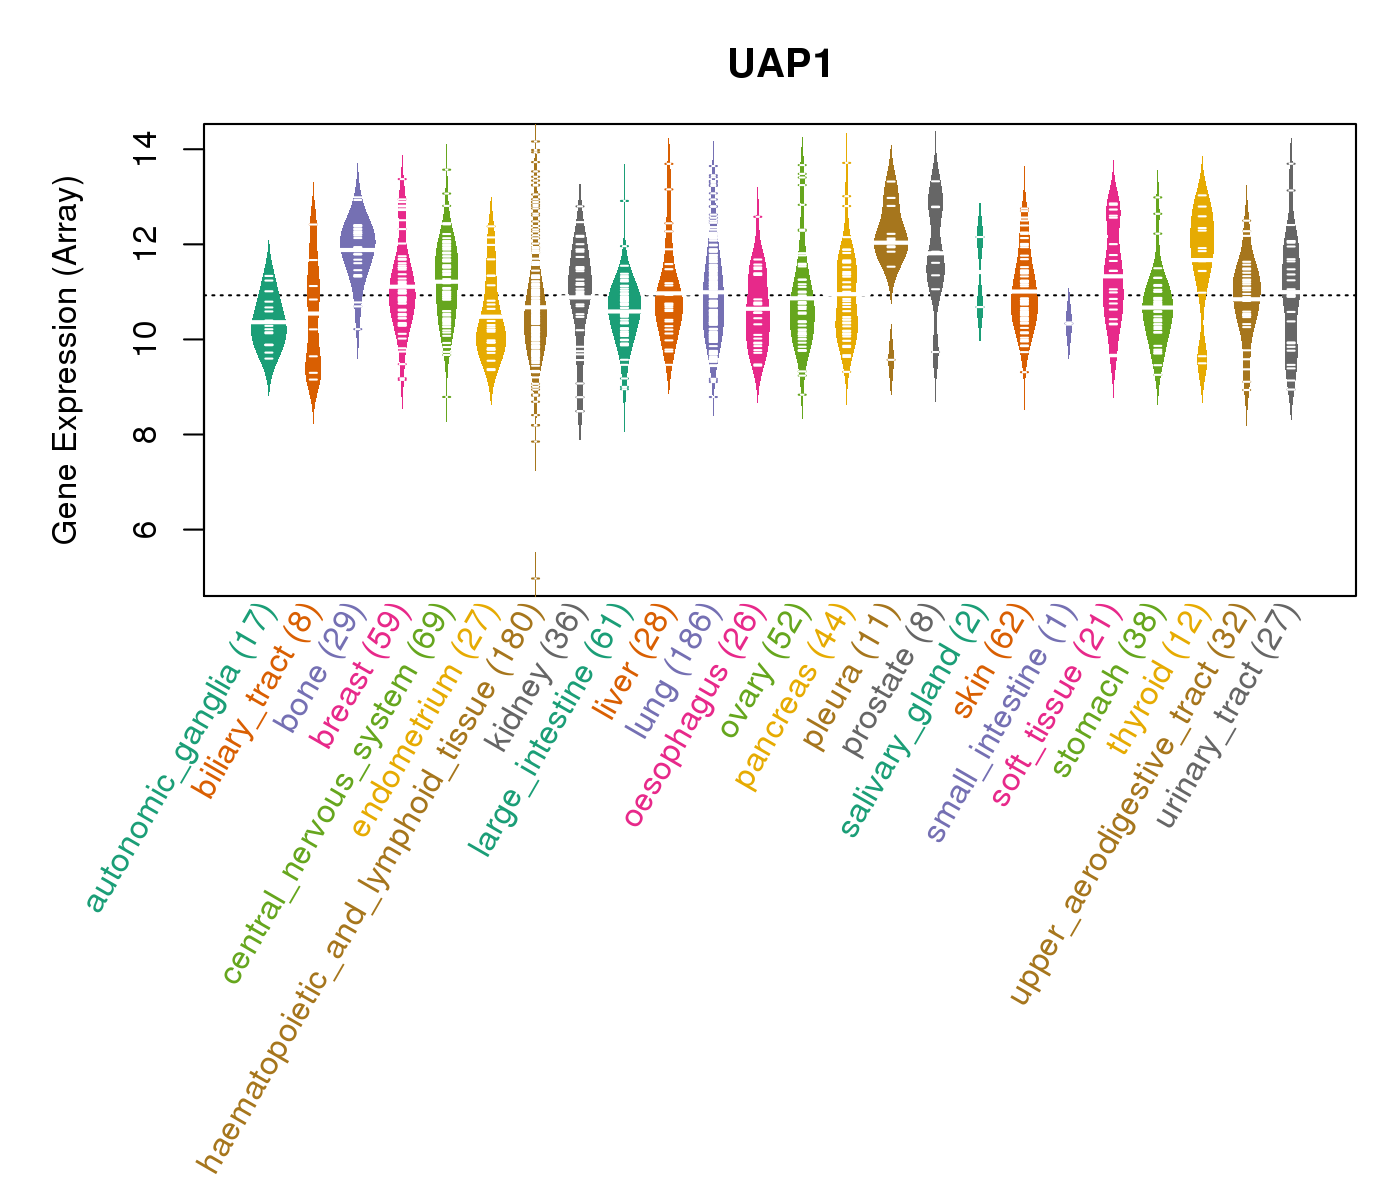
| Gene Expression for UAP1 |
| * CCLE gene expression data were extracted from CCLE_Expression_Entrez_2012-10-18.res: Gene-centric RMA-normalized mRNA expression data. |
 |
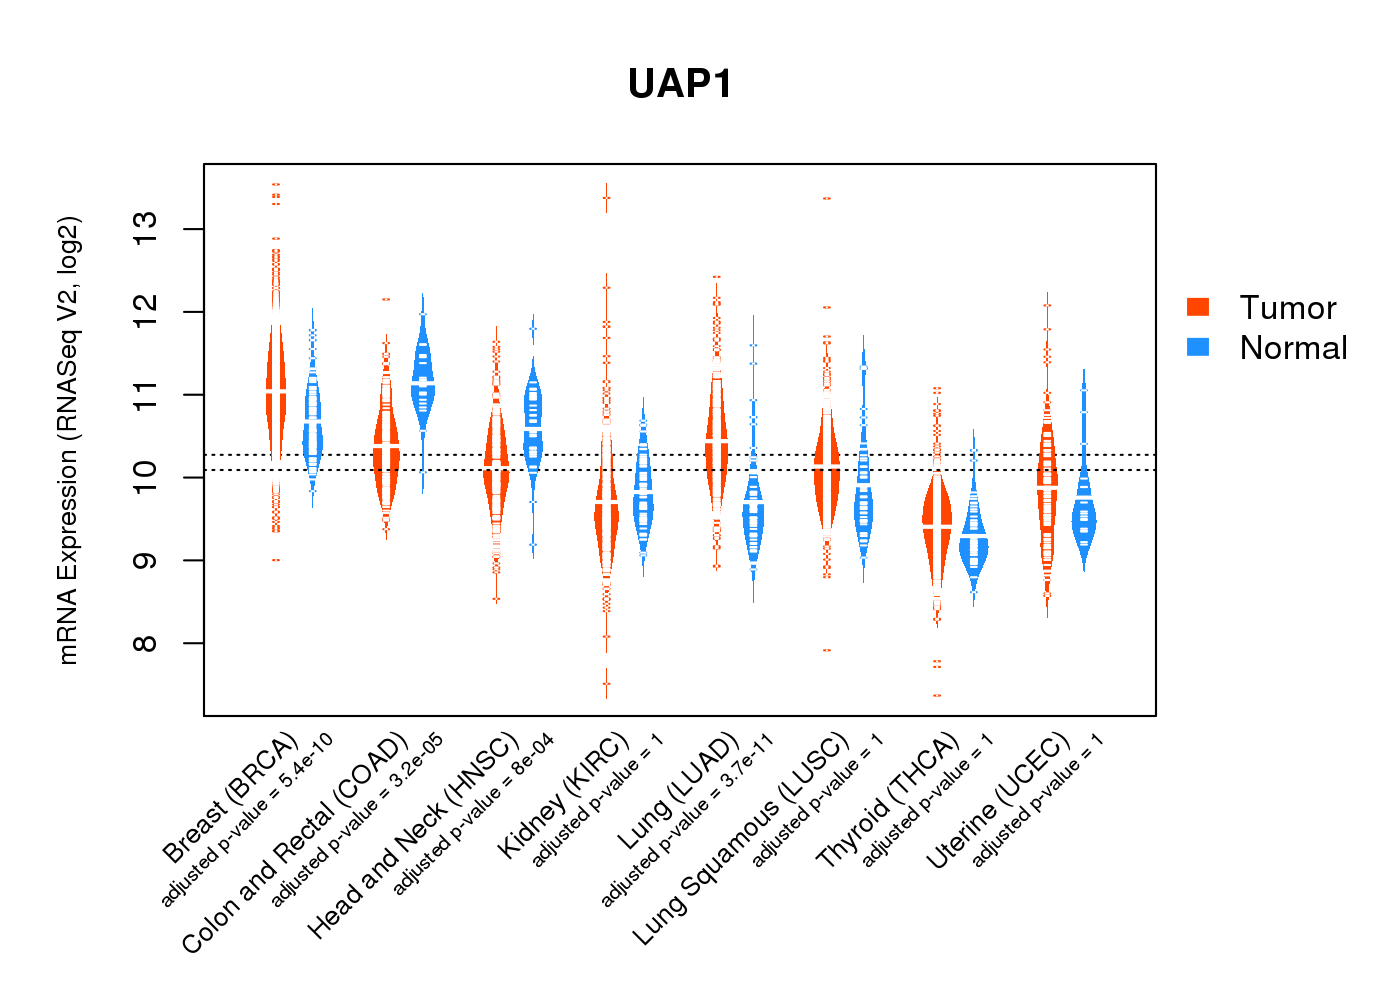
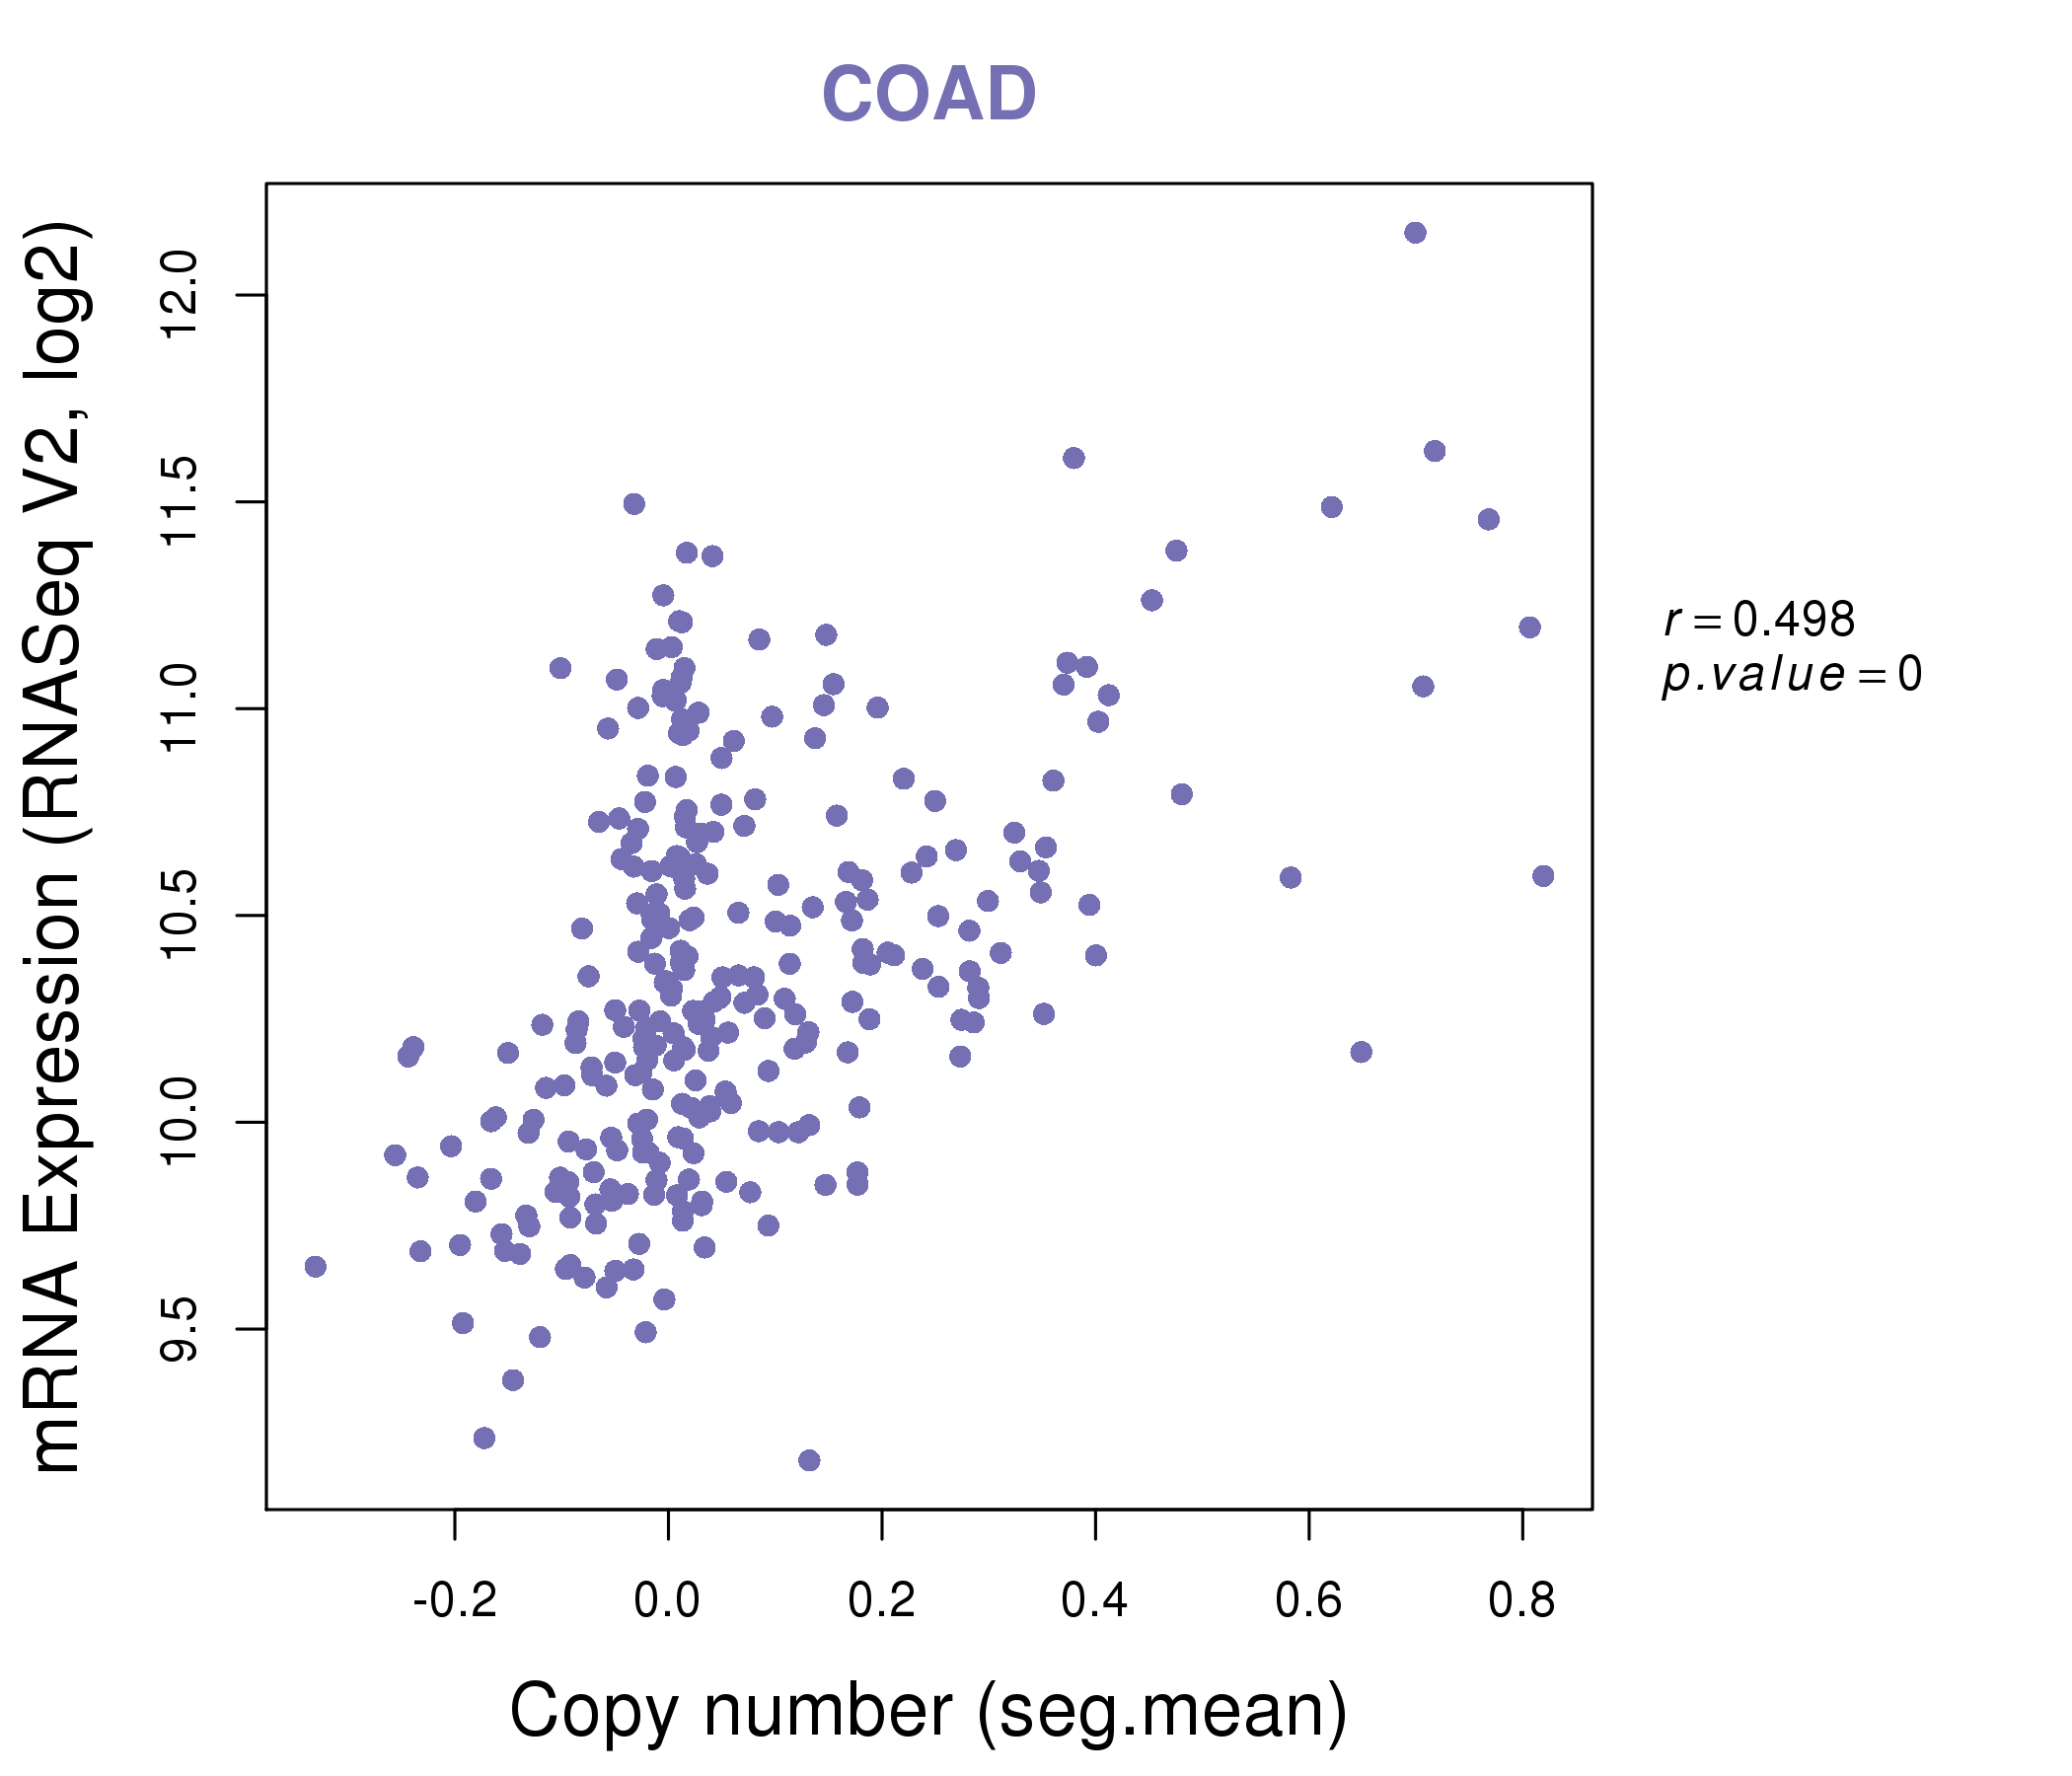
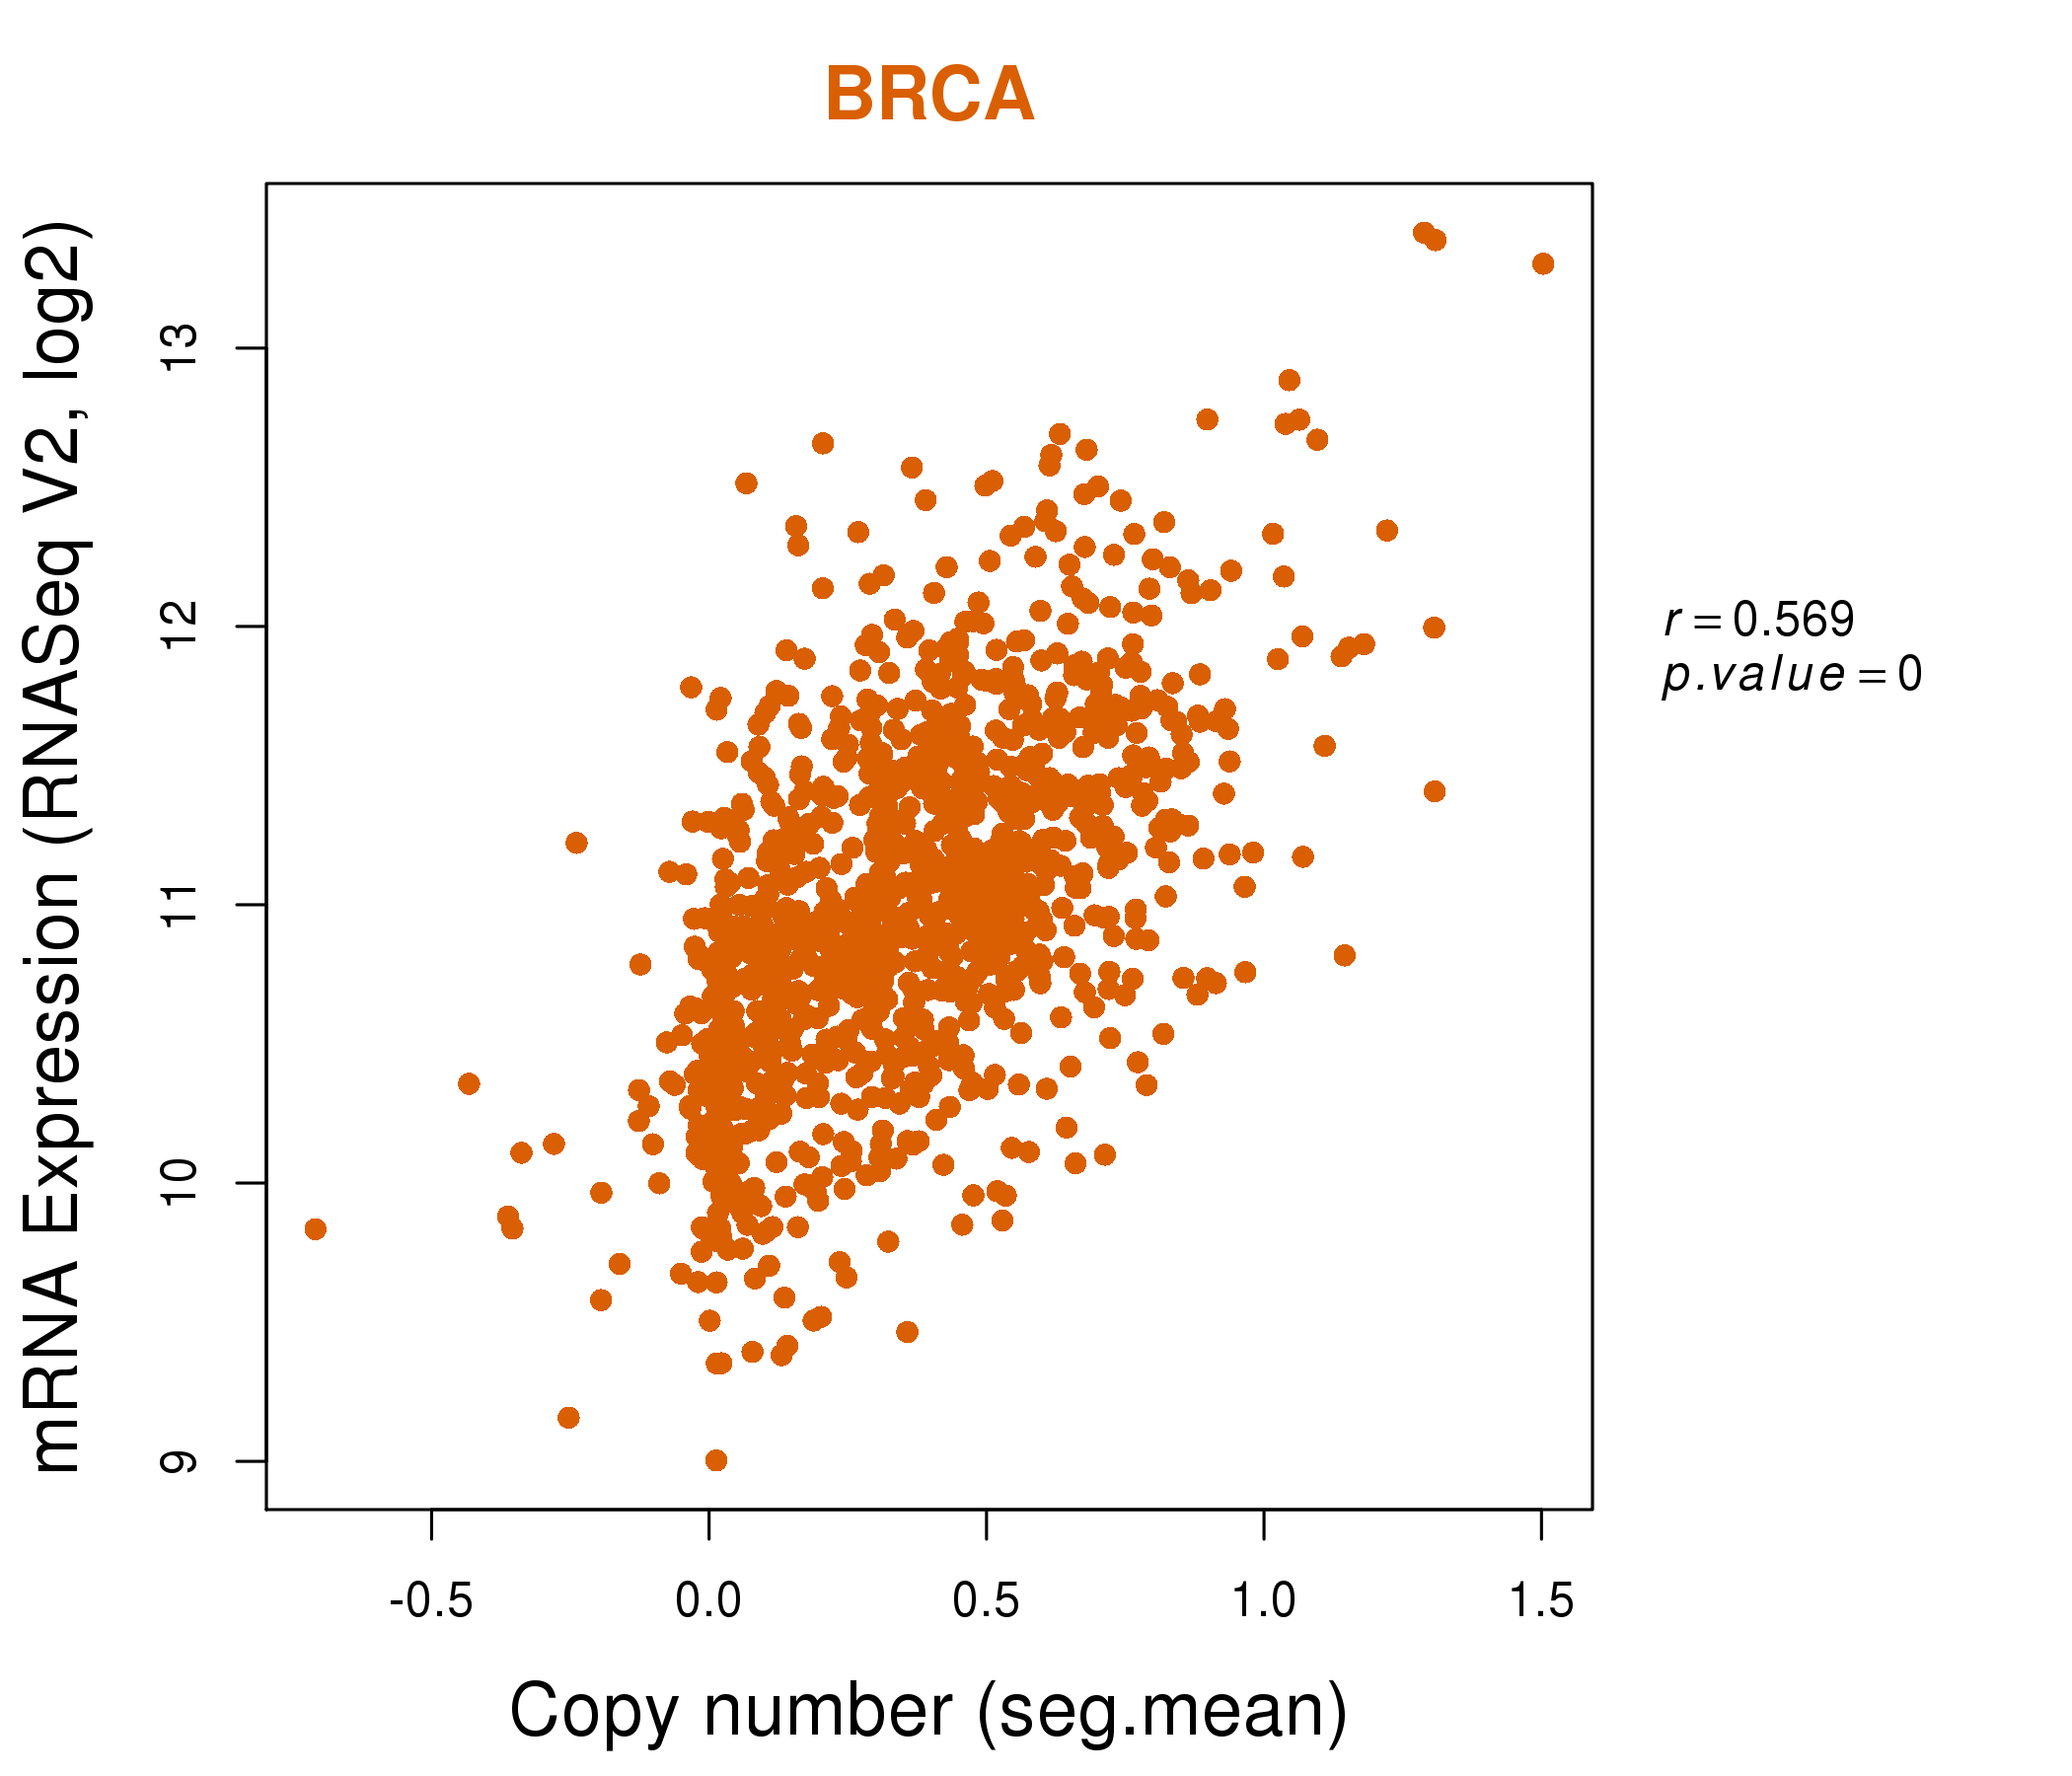
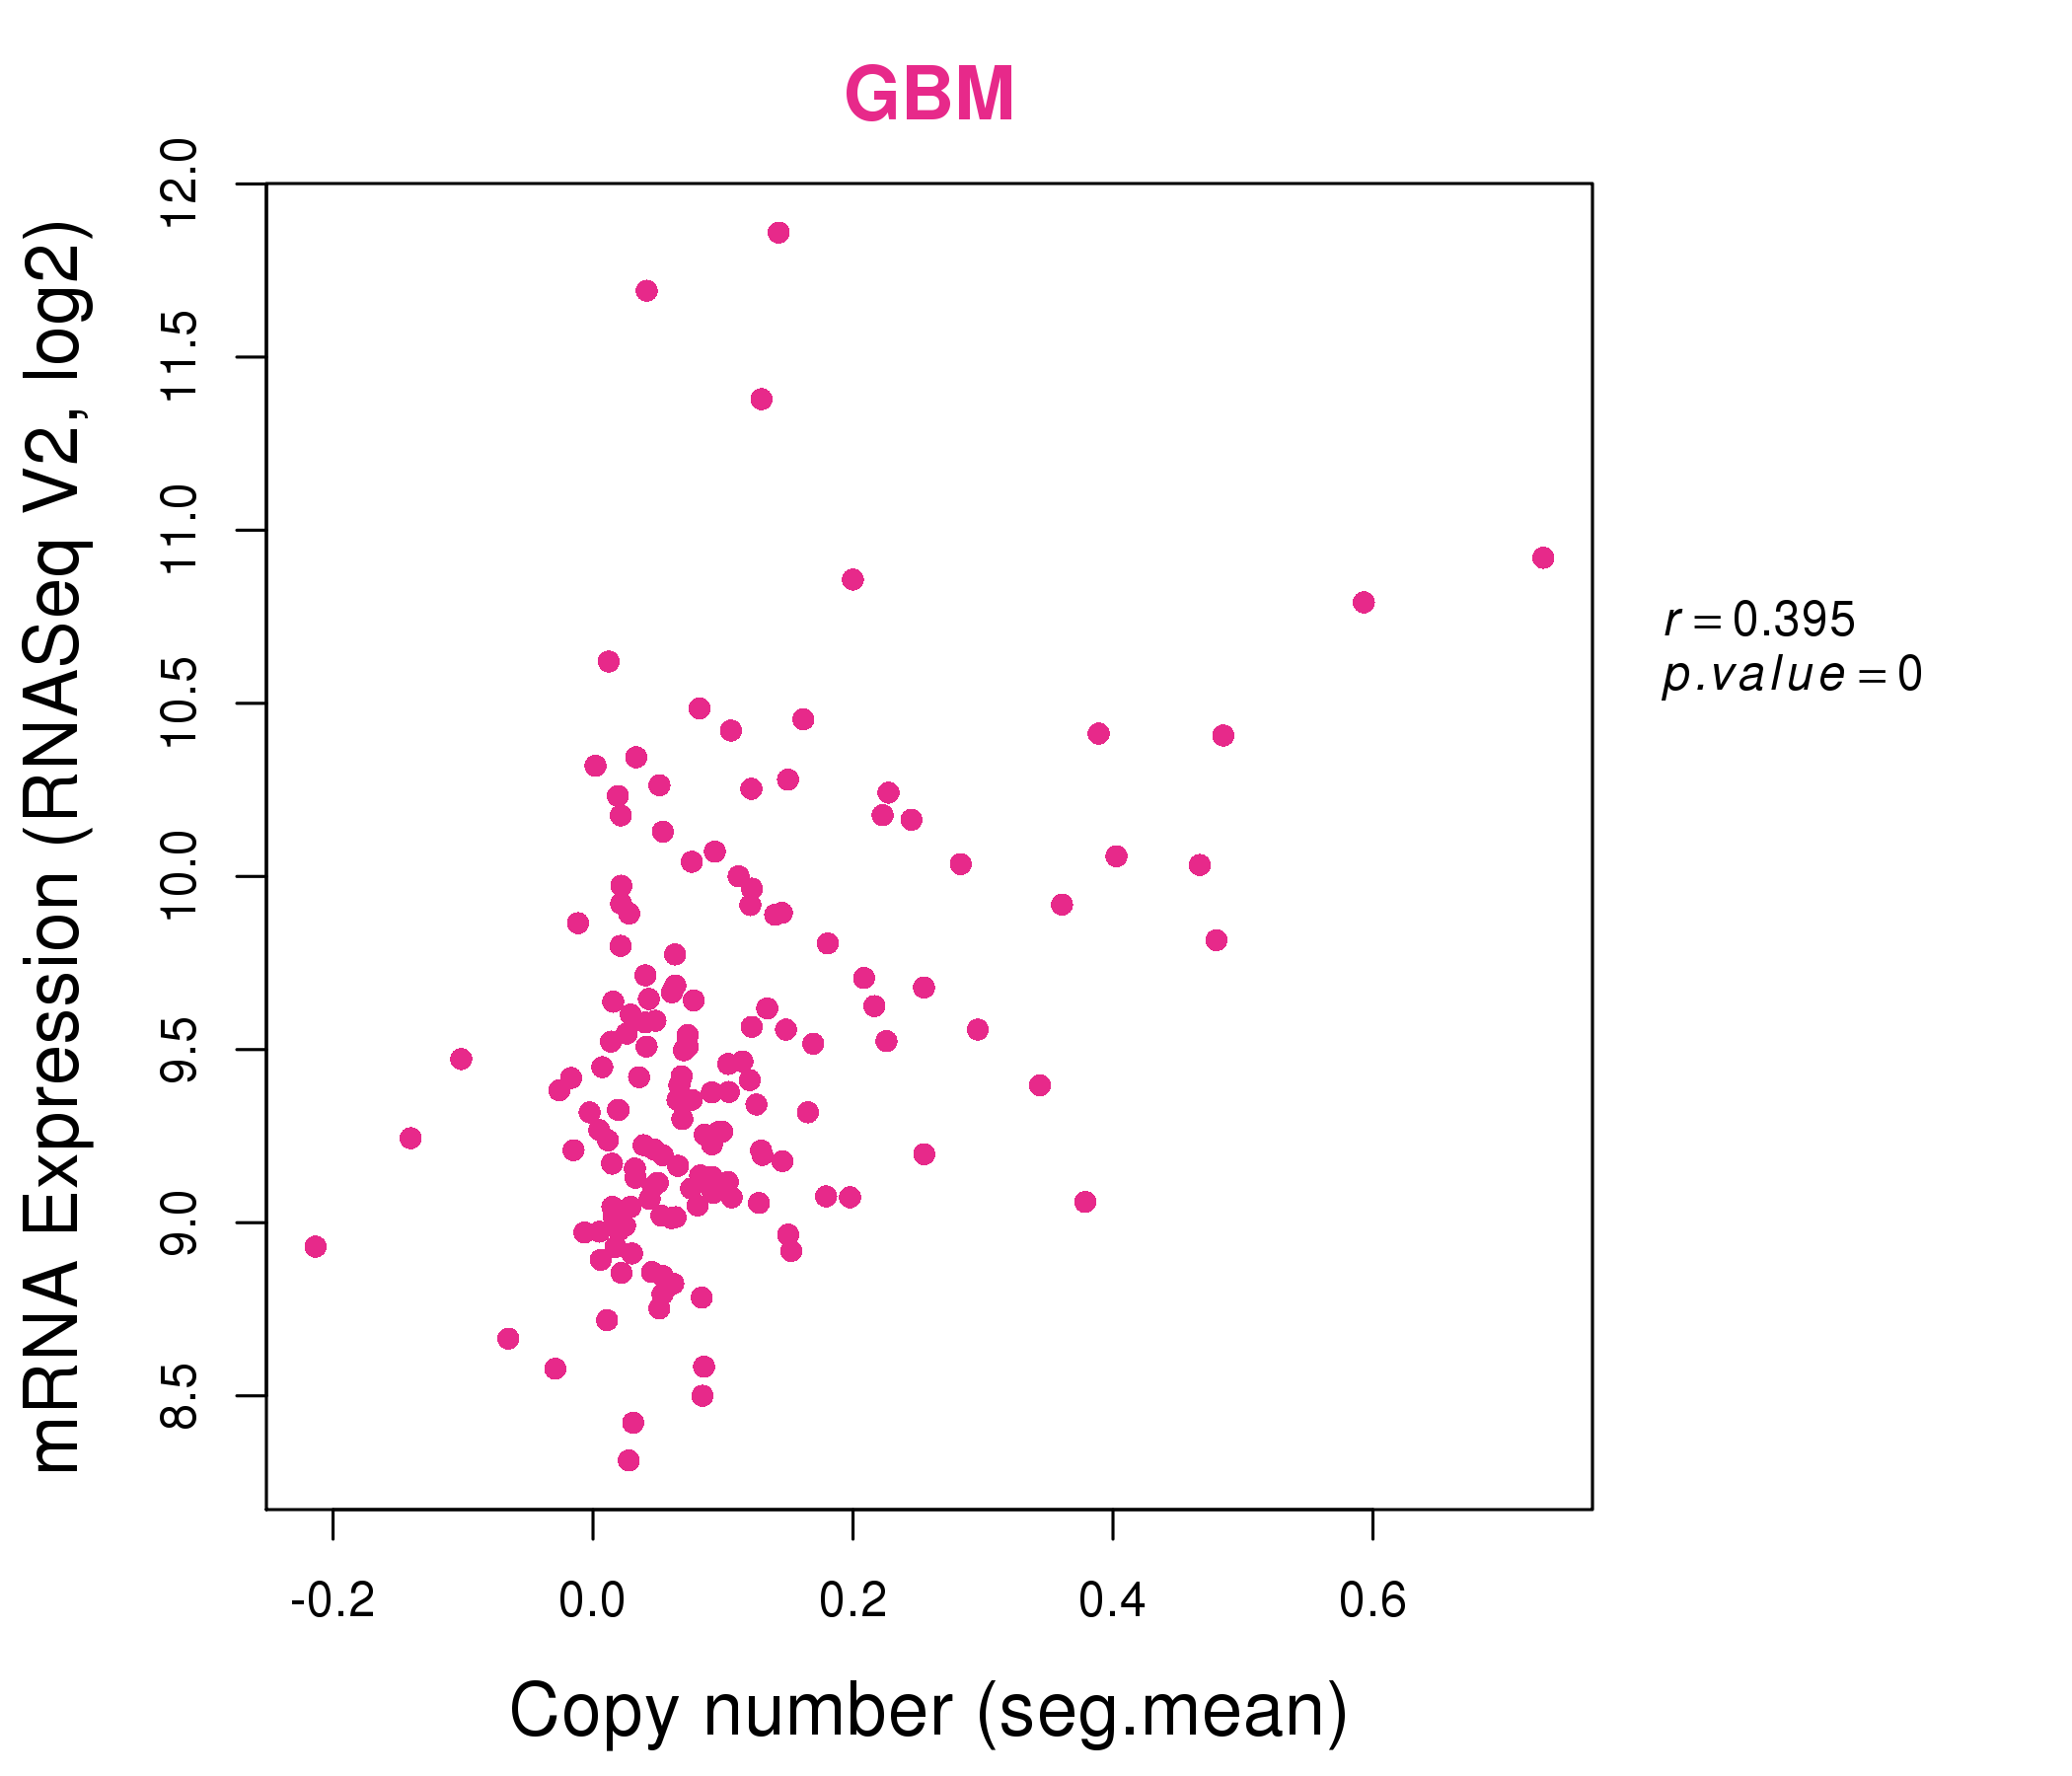
| * Normalized gene expression data of RNASeqV2 was extracted from TCGA using R package TCGA-Assembler. The URLs of all public data files on TCGA DCC data server were gathered at Jan-05-2015. Only eight cancer types have enough normal control samples for differential expression analysis. (t test, adjusted p<0.05 (using Benjamini-Hochberg FDR)) |
 |
| Top |
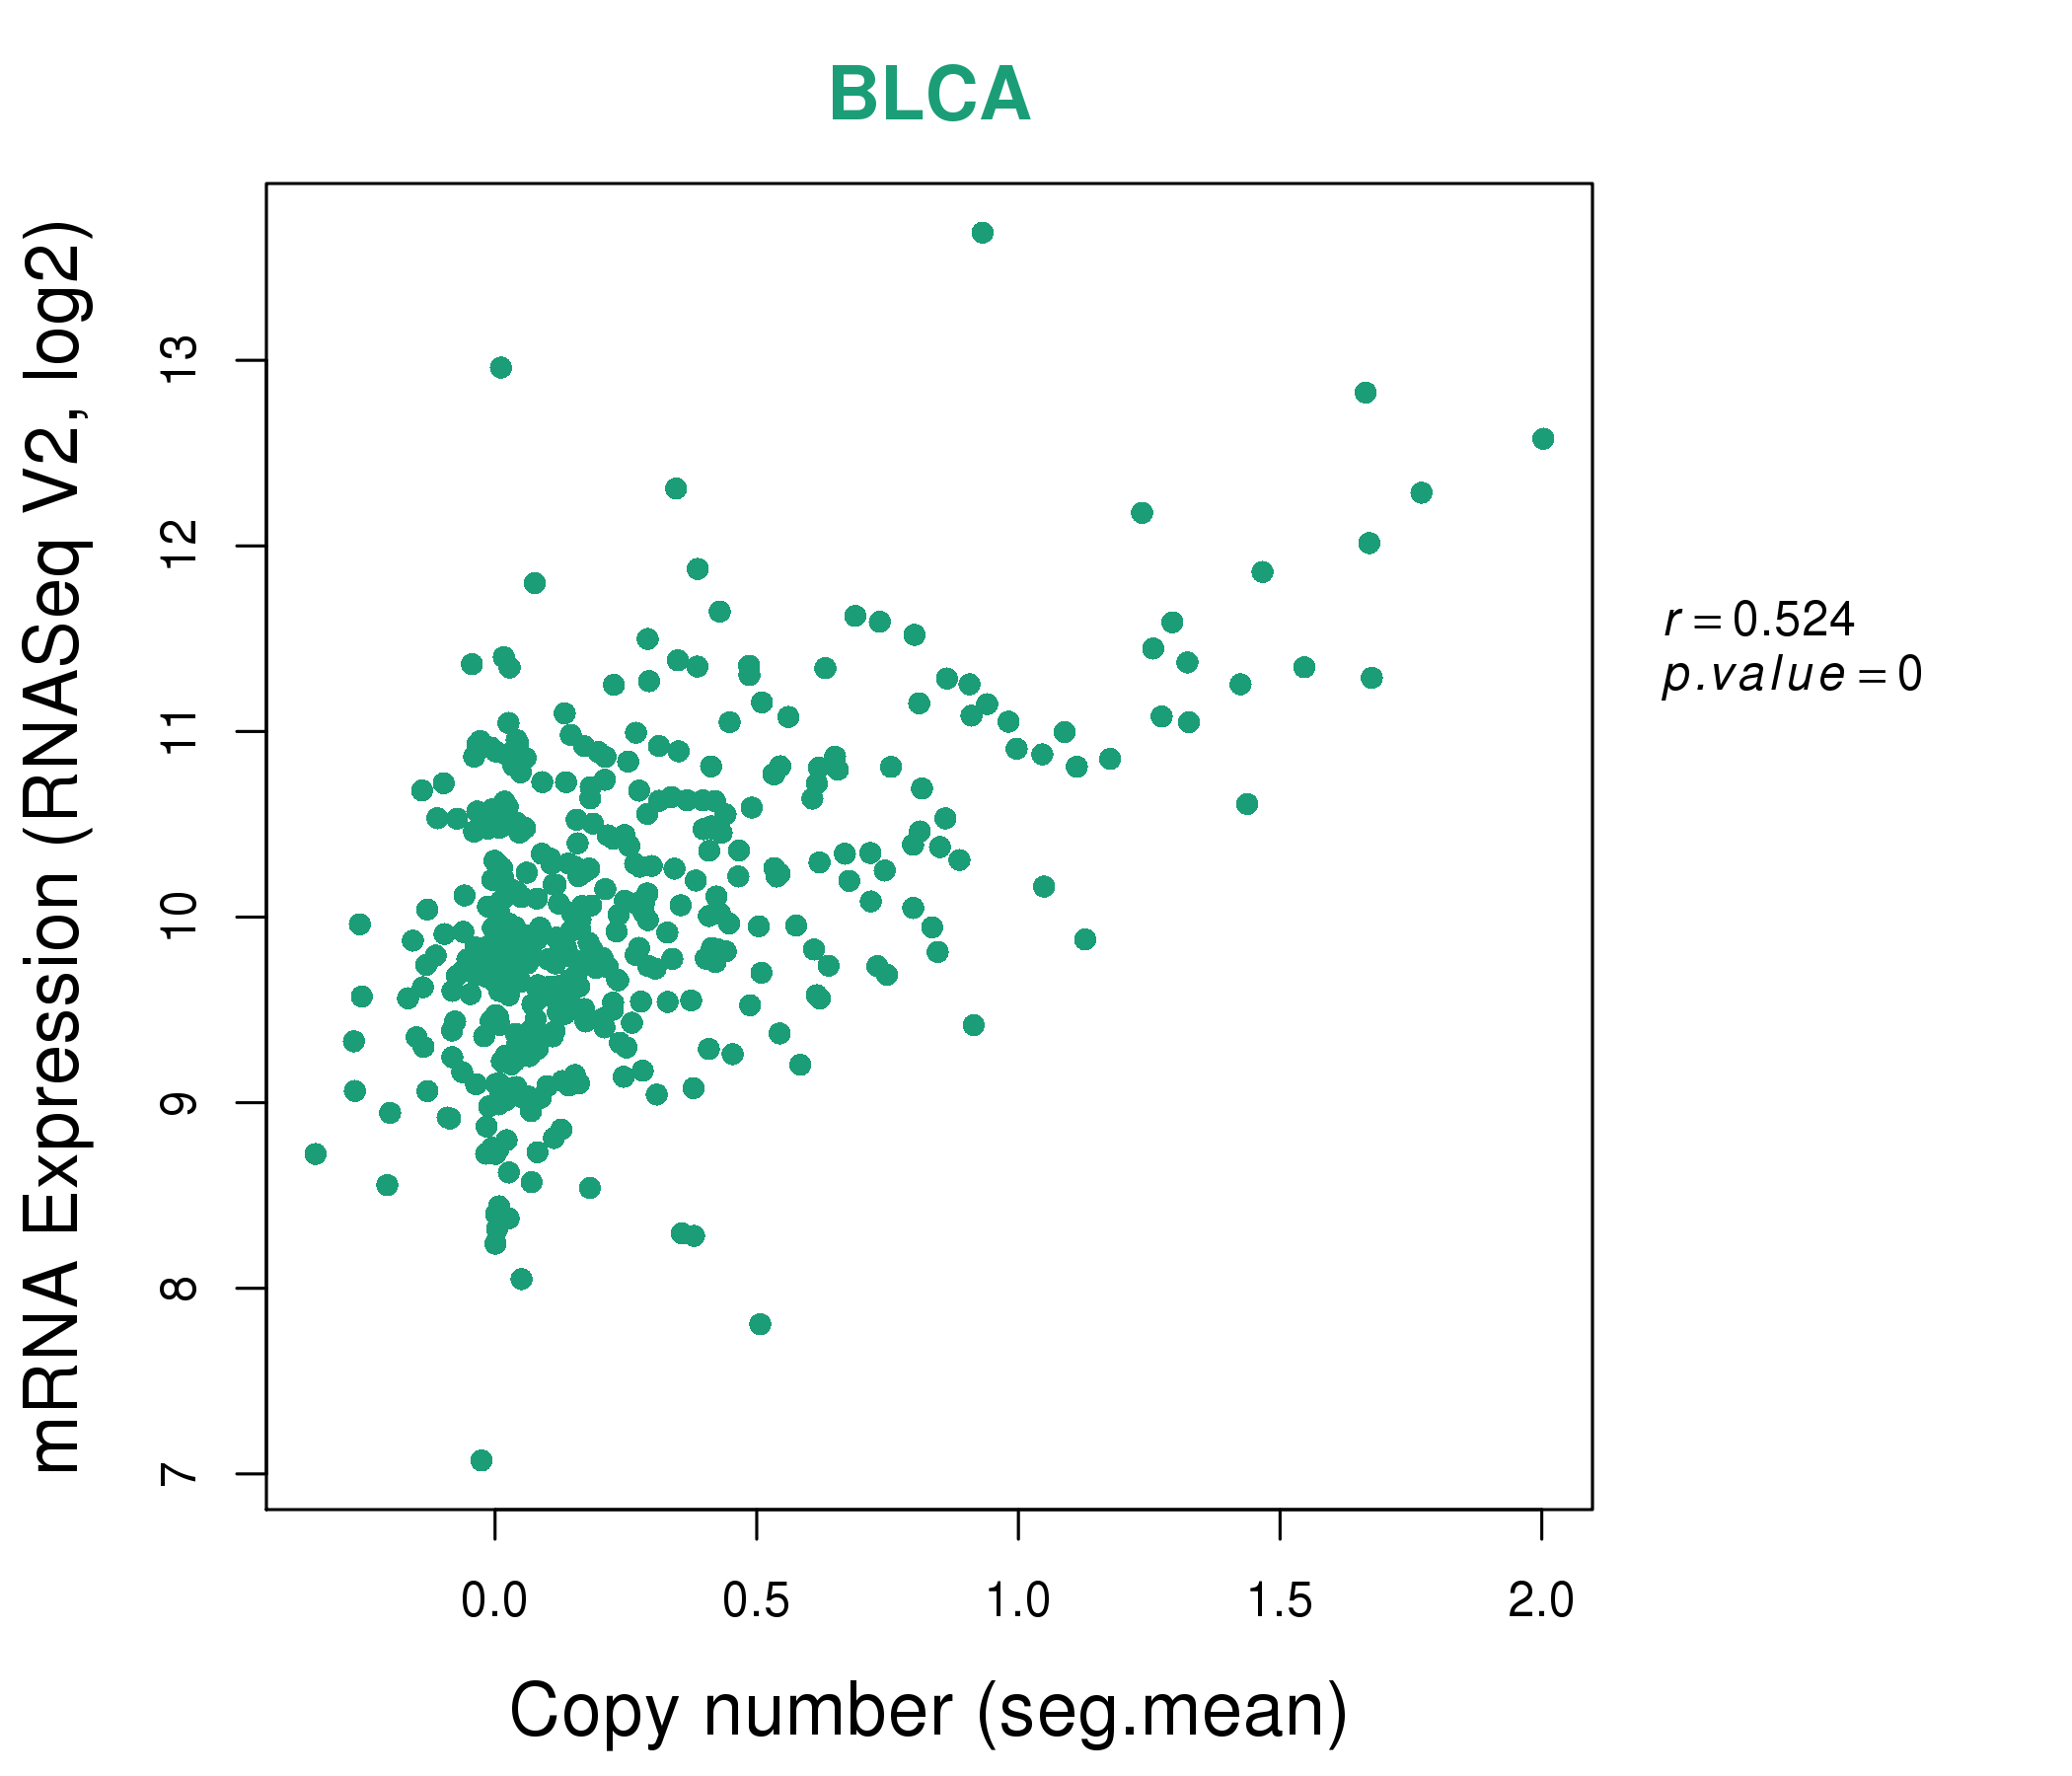
| * This plots show the correlation between CNV and gene expression. |
: Open all plots for all cancer types
 |
|
 |
|
| Top |
| Gene-Gene Network Information |
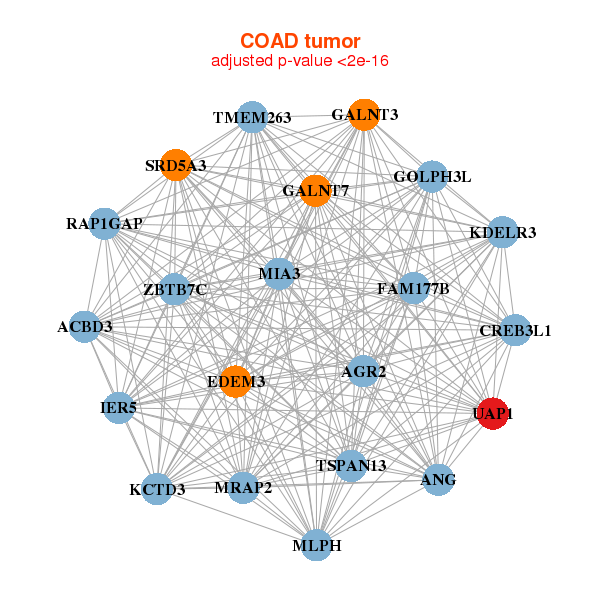
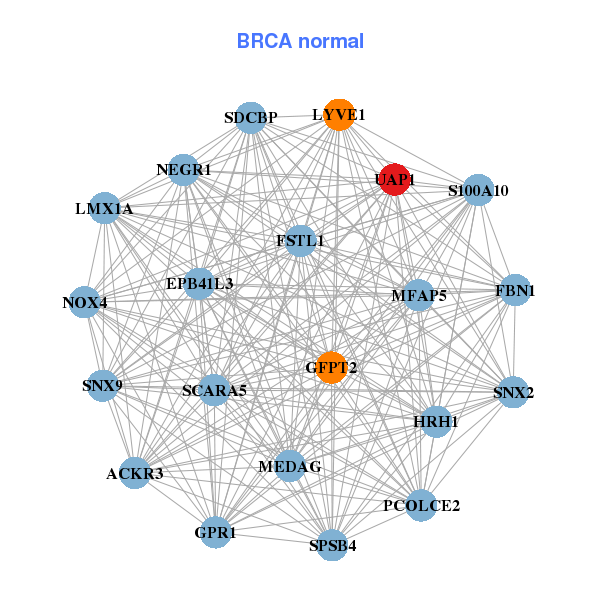
| * Co-Expression network figures were drawn using R package igraph. Only the top 20 genes with the highest correlations were shown. Red circle: input gene, orange circle: cell metabolism gene, sky circle: other gene |
: Open all plots for all cancer types
 |
| ||||
| ALDH9A1,B4GALT3,CENPL,COPA,DAP3,DEDD,F11R, GORAB,GPR89A,NCSTN,POGK,DESI2,RFWD2,SDHC, TAF5L,TFB2M,TIPRL,TTC13,UAP1,UCHL5,YY1AP1 | MEDAG,ACKR3,EPB41L3,FBN1,FSTL1,GFPT2,GPR1, HRH1,LMX1A,LYVE1,MFAP5,NEGR1,NOX4,PCOLCE2, S100A10,SCARA5,SDCBP,SNX2,SNX9,SPSB4,UAP1 | ||||
 |
| ||||
| ACBD3,AGR2,ANG,TMEM263,CREB3L1,EDEM3,FAM177B, GALNT3,GALNT7,GOLPH3L,IER5,KCTD3,KDELR3,MIA3, MLPH,MRAP2,RAP1GAP,SRD5A3,TSPAN13,UAP1,ZBTB7C | ARF6,SMIM15,CCRL2,CEBPG,F2RL1,GLTP,NECAP1, NFE2L2,NIP7,NOSTRIN,NRAS,PIGA,PPP2R2A,PPP6C, PTP4A1,SLC25A24,SPTY2D1,UAP1,YTHDF2,ZDHHC13,ZNF800 |
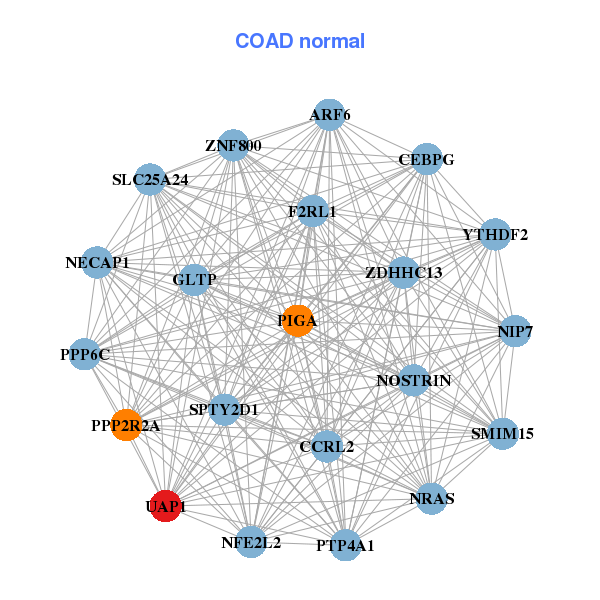
| * Co-Expression network figures were drawn using R package igraph. Only the top 20 genes with the highest correlations were shown. Red circle: input gene, orange circle: cell metabolism gene, sky circle: other gene |
: Open all plots for all cancer types
| Top |
: Open all interacting genes' information including KEGG pathway for all interacting genes from DAVID
| Top |
| Pharmacological Information for UAP1 |
| DB Category | DB Name | DB's ID and Url link |
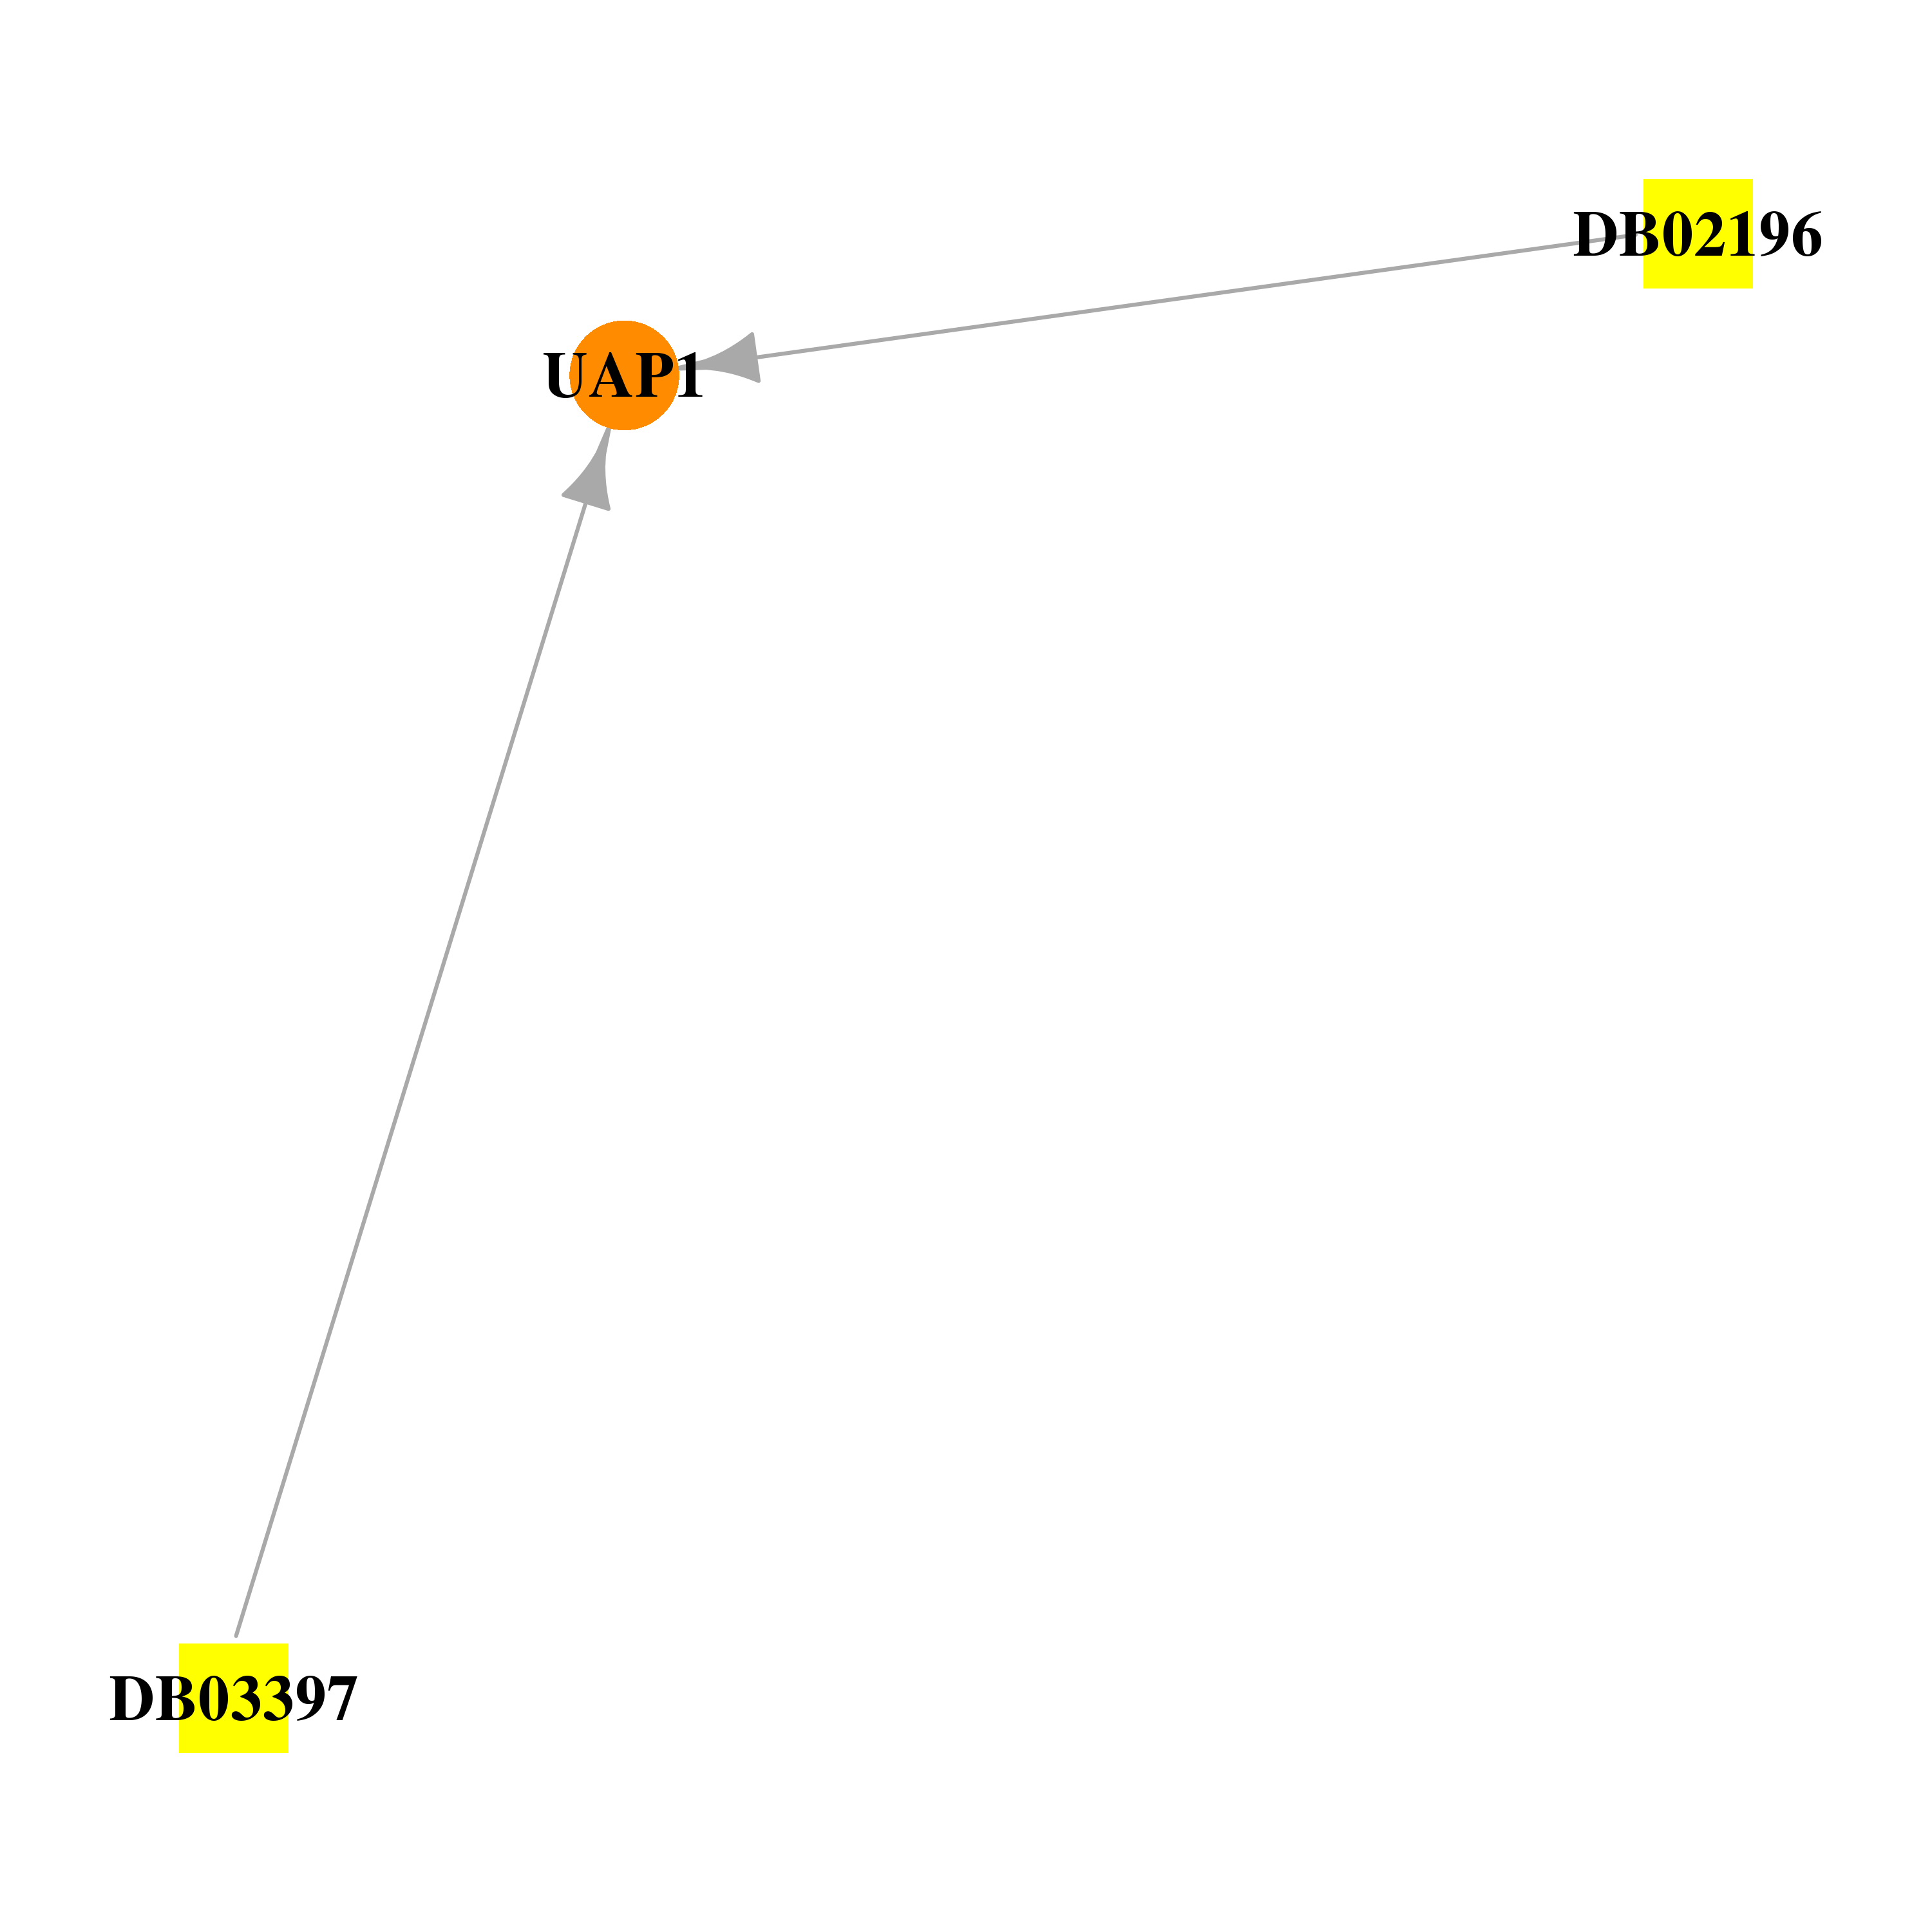
| * Gene Centered Interaction Network. |
 |
| * Drug Centered Interaction Network. |
| DrugBank ID | Target Name | Drug Groups | Generic Name | Drug Centered Network | Drug Structure |
| DB02196 | UDP-N-acteylglucosamine pyrophosphorylase 1 | experimental | Uridine-Diphosphate-N-Acetylgalactosamine | 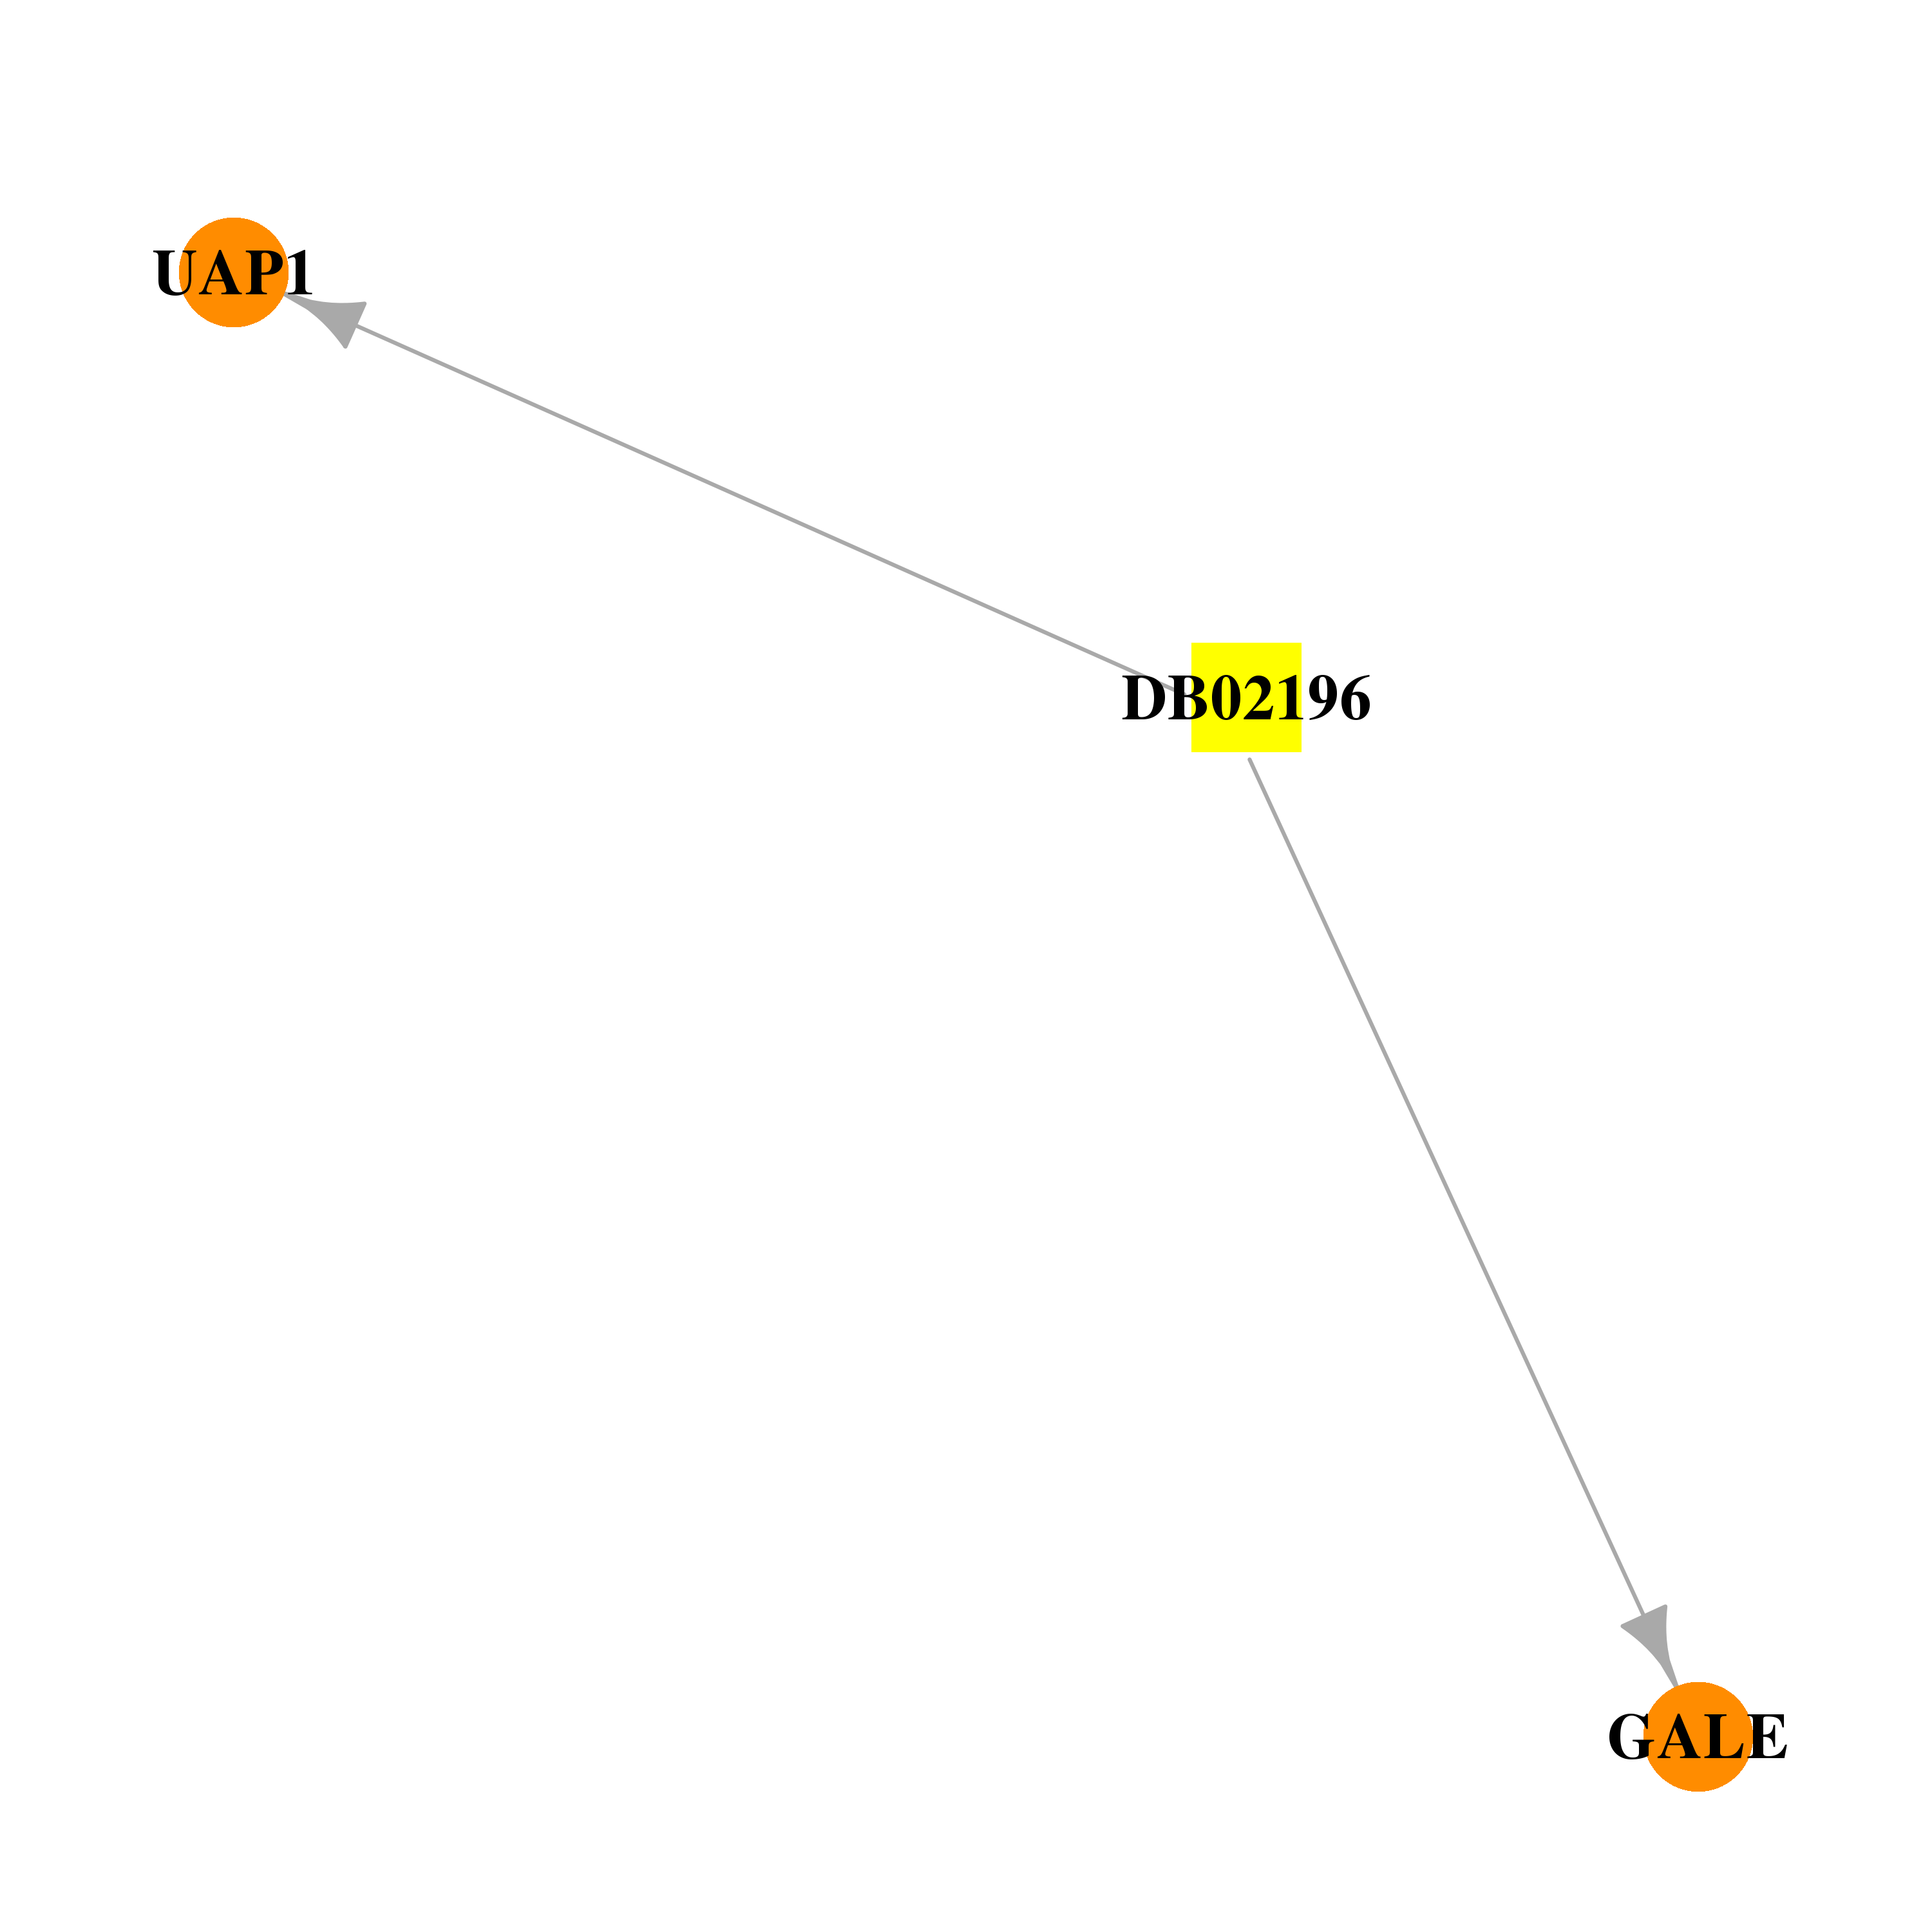 | 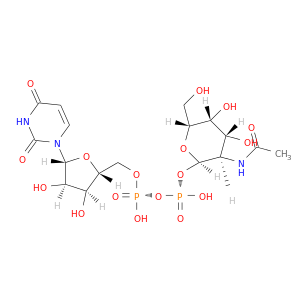 |
| DB03397 | UDP-N-acteylglucosamine pyrophosphorylase 1 | experimental | Uridine-Diphosphate-N-Acetylglucosamine |  | 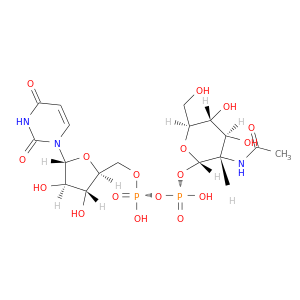 |
| Top |
| Cross referenced IDs for UAP1 |
| * We obtained these cross-references from Uniprot database. It covers 150 different DBs, 18 categories. http://www.uniprot.org/help/cross_references_section |
: Open all cross reference information
|
Copyright © 2016-Present - The Univsersity of Texas Health Science Center at Houston @ |