|
||||||||||||||||||||||||||||||||||||||||||||||||||||||||||||||||||||||||||||||||||||||||||||||||||||||||||||||||||||||||||||||||||||||||||||||||||||||||||||||||||||||||||||||||||||||||||||||||||||||||||||||||||||||||||||||||||||||||||||||||||||||||||||||||||||||||||||||||||||||||||||||||||||||||||||||||||||||||||
| |
| Phenotypic Information (metabolism pathway, cancer, disease, phenome) |
| |
| |
| Gene-Gene Network Information: Co-Expression Network, Interacting Genes & KEGG |
| |
|


| Gene Summary for BPGM |
| Basic gene info. | Gene symbol | BPGM |
| Gene name | 2,3-bisphosphoglycerate mutase | |
| Synonyms | DPGM | |
| Cytomap | UCSC genome browser: 7q33 | |
| Genomic location | chr7 :134331530-134364567 | |
| Type of gene | protein-coding | |
| RefGenes | NM_001293085.1, NM_001724.4,NM_199186.2, | |
| Ensembl id | ENSG00000172331 | |
| Description | 2,3-bisphosphoglycerate mutase, erythrocyte2,3-bisphosphoglycerate synthase2,3-diphosphoglycerate mutaseBPG-dependent PGAMbisphosphoglycerate mutaseerythrocyte 2,3-bisphosphoglycerate mutase | |
| Modification date | 20141207 | |
| dbXrefs | MIM : 613896 | |
| HGNC : HGNC | ||
| Ensembl : ENSG00000172331 | ||
| HPRD : 01961 | ||
| Vega : OTTHUMG00000155380 | ||
| Protein | UniProt: go to UniProt's Cross Reference DB Table | |
| Expression | CleanEX: HS_BPGM | |
| BioGPS: 669 | ||
| Gene Expression Atlas: ENSG00000172331 | ||
| The Human Protein Atlas: ENSG00000172331 | ||
| Pathway | NCI Pathway Interaction Database: BPGM | |
| KEGG: BPGM | ||
| REACTOME: BPGM | ||
| ConsensusPathDB | ||
| Pathway Commons: BPGM | ||
| Metabolism | MetaCyc: BPGM | |
| HUMANCyc: BPGM | ||
| Regulation | Ensembl's Regulation: ENSG00000172331 | |
| miRBase: chr7 :134,331,530-134,364,567 | ||
| TargetScan: NM_001293085 | ||
| cisRED: ENSG00000172331 | ||
| Context | iHOP: BPGM | |
| cancer metabolism search in PubMed: BPGM | ||
| UCL Cancer Institute: BPGM | ||
| Assigned class in ccmGDB | C | |
| Top |
| Phenotypic Information for BPGM(metabolism pathway, cancer, disease, phenome) |
| Cancer | CGAP: BPGM |
| Familial Cancer Database: BPGM | |
| * This gene is included in those cancer gene databases. |
|
|
|
|
|
|
| ||||||||||||||||||||||||||||||||||||||||||||||||||||||||||||||||||||||||||||||||||||||||||||||||||||||||||||||||||||||||||||||||||||||||||||||||||||||||||||||||||||||||||||||||||||||||||||||||||||||||||||||||||||||||||||||||||||||||||||||||||||||||||||||||||||||||||||||||||||||||||||||||||||||||||||||||||||
Oncogene 1 | Significant driver gene in | |||||||||||||||||||||||||||||||||||||||||||||||||||||||||||||||||||||||||||||||||||||||||||||||||||||||||||||||||||||||||||||||||||||||||||||||||||||||||||||||||||||||||||||||||||||||||||||||||||||||||||||||||||||||||||||||||||||||||||||||||||||||||||||||||||||||||||||||||||||||||||||||||||||||||||||||||||||||||
| cf) number; DB name 1 Oncogene; http://nar.oxfordjournals.org/content/35/suppl_1/D721.long, 2 Tumor Suppressor gene; https://bioinfo.uth.edu/TSGene/, 3 Cancer Gene Census; http://www.nature.com/nrc/journal/v4/n3/abs/nrc1299.html, 4 CancerGenes; http://nar.oxfordjournals.org/content/35/suppl_1/D721.long, 5 Network of Cancer Gene; http://ncg.kcl.ac.uk/index.php, 1Therapeutic Vulnerabilities in Cancer; http://cbio.mskcc.org/cancergenomics/statius/ |
| KEGG_GLYCOLYSIS_GLUCONEOGENESIS | |
| OMIM | |
| Orphanet | |
| Disease | KEGG Disease: BPGM |
| MedGen: BPGM (Human Medical Genetics with Condition) | |
| ClinVar: BPGM | |
| Phenotype | MGI: BPGM (International Mouse Phenotyping Consortium) |
| PhenomicDB: BPGM | |
| Mutations for BPGM |
| * Under tables are showing count per each tissue to give us broad intuition about tissue specific mutation patterns.You can go to the detailed page for each mutation database's web site. |
| - Statistics for Tissue and Mutation type | Top |
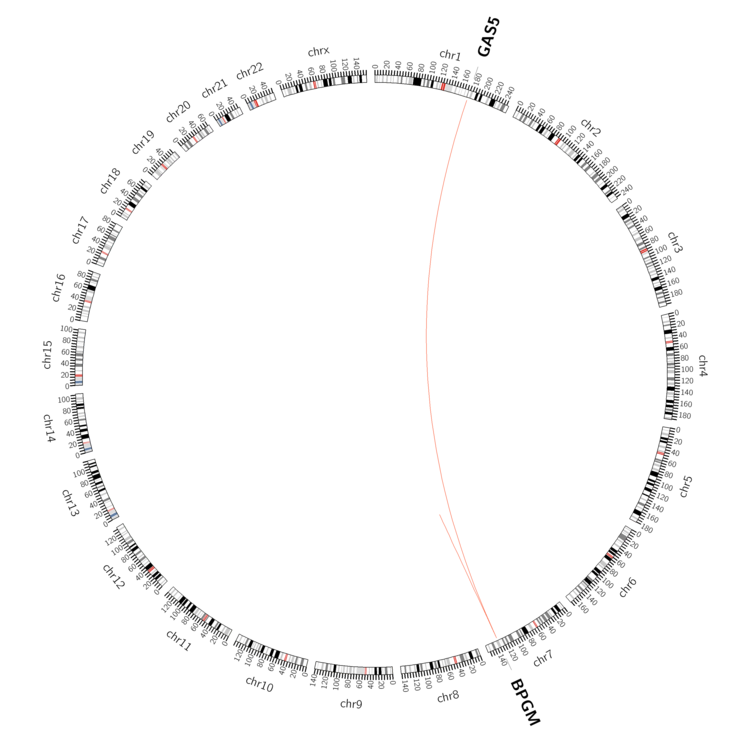 |
| - For Inter-chromosomal Variations |
| * Inter-chromosomal variantions includes 'interchromosomal amplicon to amplicon', 'interchromosomal amplicon to non-amplified dna', 'interchromosomal insertion', 'Interchromosomal unknown type'. |
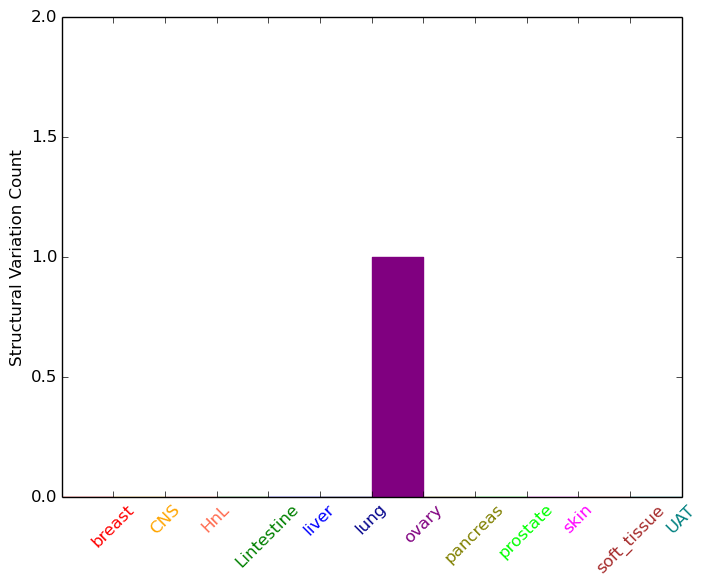 |
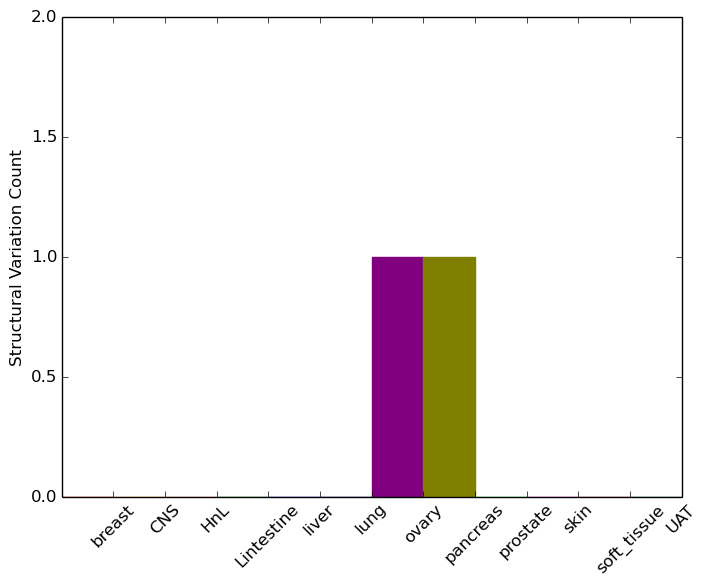
| - For Intra-chromosomal Variations |
| * Intra-chromosomal variantions includes 'intrachromosomal amplicon to amplicon', 'intrachromosomal amplicon to non-amplified dna', 'intrachromosomal deletion', 'intrachromosomal fold-back inversion', 'intrachromosomal inversion', 'intrachromosomal tandem duplication', 'Intrachromosomal unknown type', 'intrachromosomal with inverted orientation', 'intrachromosomal with non-inverted orientation'. |
 |
| Sample | Symbol_a | Chr_a | Start_a | End_a | Symbol_b | Chr_b | Start_b | End_b |
| ovary | BPGM | chr7 | 134353288 | 134353308 | BPGM | chr7 | 134356321 | 134356341 |
| pancreas | BPGM | chr7 | 134349983 | 134350003 | BPGM | chr7 | 134350407 | 134350427 |
| cf) Tissue number; Tissue name (1;Breast, 2;Central_nervous_system, 3;Haematopoietic_and_lymphoid_tissue, 4;Large_intestine, 5;Liver, 6;Lung, 7;Ovary, 8;Pancreas, 9;Prostate, 10;Skin, 11;Soft_tissue, 12;Upper_aerodigestive_tract) |
| * From mRNA Sanger sequences, Chitars2.0 arranged chimeric transcripts. This table shows BPGM related fusion information. |
| ID | Head Gene | Tail Gene | Accession | Gene_a | qStart_a | qEnd_a | Chromosome_a | tStart_a | tEnd_a | Gene_a | qStart_a | qEnd_a | Chromosome_a | tStart_a | tEnd_a |
| AI380175 | RASSF4 | 1 | 188 | 10 | 45471715 | 45471902 | BPGM | 184 | 559 | 7 | 134363981 | 134364356 | |
| BQ367874 | TSC22D1 | 17 | 409 | 13 | 45008211 | 45008606 | BPGM | 398 | 560 | 7 | 134363825 | 134363987 | |
| Top |
| Mutation type/ Tissue ID | brca | cns | cerv | endome | haematopo | kidn | Lintest | liver | lung | ns | ovary | pancre | prost | skin | stoma | thyro | urina | |||
| Total # sample | 1 | 1 | 1 | 1 | 1 | |||||||||||||||
| GAIN (# sample) | 1 | 1 | 1 | 1 | 1 | |||||||||||||||
| LOSS (# sample) |
| cf) Tissue ID; Tissue type (1; Breast, 2; Central_nervous_system, 3; Cervix, 4; Endometrium, 5; Haematopoietic_and_lymphoid_tissue, 6; Kidney, 7; Large_intestine, 8; Liver, 9; Lung, 10; NS, 11; Ovary, 12; Pancreas, 13; Prostate, 14; Skin, 15; Stomach, 16; Thyroid, 17; Urinary_tract) |
| Top |
|
 |
| Top |
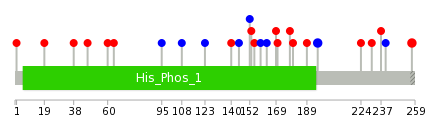
| Stat. for Non-Synonymous SNVs (# total SNVs=14) | (# total SNVs=4) |
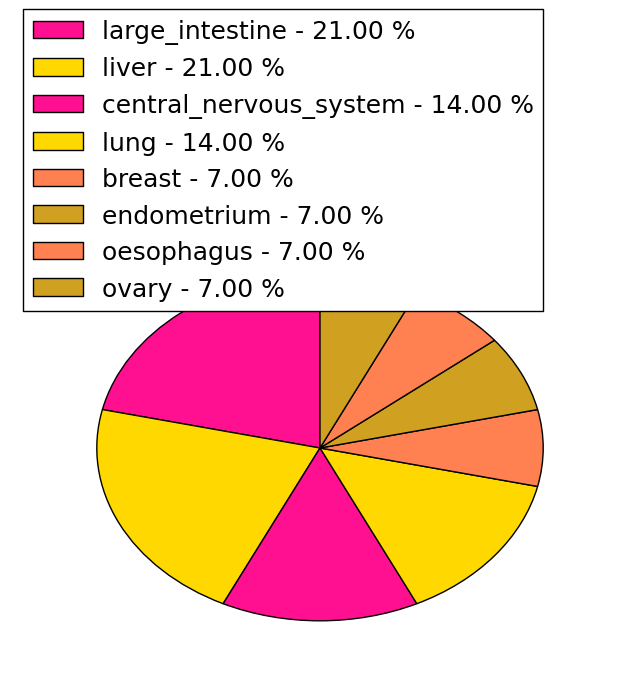 | 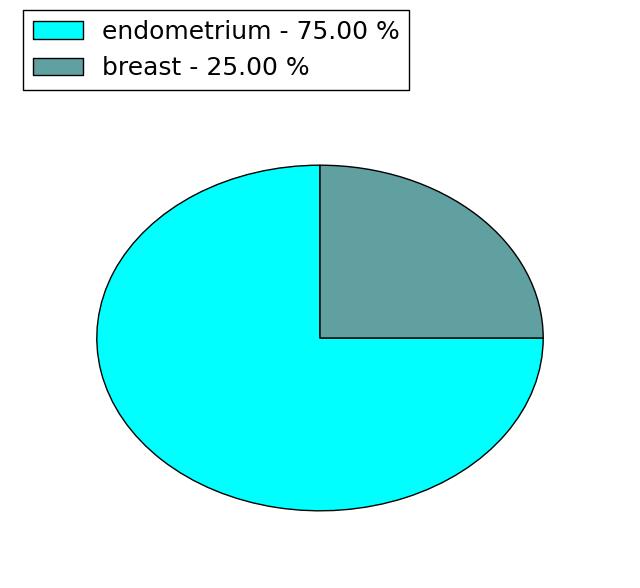 |
(# total SNVs=0) | (# total SNVs=0) |
| Top |
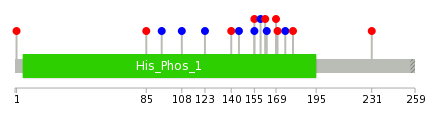
| * When you move the cursor on each content, you can see more deailed mutation information on the Tooltip. Those are primary_site,primary_histology,mutation(aa),pubmedID. |
| GRCh37 position | Mutation(aa) | Unique sampleID count |
| chr7:134363772-134363772 | p.A257T | 2 |
| chr7:134346845-134346845 | p.L196L | 2 |
| chr7:134346437-134346437 | p.L60F | 1 |
| chr7:134346716-134346716 | p.P153S | 1 |
| chr7:134363695-134363695 | p.P231H | 1 |
| chr7:134346449-134346449 | p.I64V | 1 |
| chr7:134346723-134346723 | p.S155L | 1 |
| chr7:134363713-134363713 | p.D237G | 1 |
| chr7:134346485-134346485 | p.Q76* | 1 |
| chr7:134346736-134346736 | p.K159K | 1 |
| Top |
|
 |
| Point Mutation/ Tissue ID | 1 | 2 | 3 | 4 | 5 | 6 | 7 | 8 | 9 | 10 | 11 | 12 | 13 | 14 | 15 | 16 | 17 | 18 | 19 | 20 |
| # sample | 1 | 1 | 4 | 1 | 3 | 5 | 2 | |||||||||||||
| # mutation | 1 | 1 | 4 | 1 | 3 | 5 | 2 | |||||||||||||
| nonsynonymous SNV | 1 | 3 | 1 | 1 | 3 | |||||||||||||||
| synonymous SNV | 1 | 1 | 2 | 2 | 2 |
| cf) Tissue ID; Tissue type (1; BLCA[Bladder Urothelial Carcinoma], 2; BRCA[Breast invasive carcinoma], 3; CESC[Cervical squamous cell carcinoma and endocervical adenocarcinoma], 4; COAD[Colon adenocarcinoma], 5; GBM[Glioblastoma multiforme], 6; Glioma Low Grade, 7; HNSC[Head and Neck squamous cell carcinoma], 8; KICH[Kidney Chromophobe], 9; KIRC[Kidney renal clear cell carcinoma], 10; KIRP[Kidney renal papillary cell carcinoma], 11; LAML[Acute Myeloid Leukemia], 12; LUAD[Lung adenocarcinoma], 13; LUSC[Lung squamous cell carcinoma], 14; OV[Ovarian serous cystadenocarcinoma ], 15; PAAD[Pancreatic adenocarcinoma], 16; PRAD[Prostate adenocarcinoma], 17; SKCM[Skin Cutaneous Melanoma], 18:STAD[Stomach adenocarcinoma], 19:THCA[Thyroid carcinoma], 20:UCEC[Uterine Corpus Endometrial Carcinoma]) |
| Top |
| * We represented just top 10 SNVs. When you move the cursor on each content, you can see more deailed mutation information on the Tooltip. Those are primary_site, primary_histology, mutation(aa), pubmedID. |
| Genomic Position | Mutation(aa) | Unique sampleID count |
| chr7:134346628 | p.W85C,BPGM | 1 |
| chr7:134346797 | p.L95L,BPGM | 1 |
| chr7:134346677 | p.G108G,BPGM | 1 |
| chr7:134363695 | p.P123P,BPGM | 1 |
| chr7:134346694 | p.R140W,BPGM | 1 |
| chr7:134346723 | p.C145C,BPGM | 1 |
| chr7:134346724 | p.S155L,BPGM | 1 |
| chr7:134346736 | p.S155S,BPGM | 1 |
| chr7:134346744 | p.K159K,BPGM | 1 |
| chr7:134346262 | p.L162P,BPGM | 1 |
| * Copy number data were extracted from TCGA using R package TCGA-Assembler. The URLs of all public data files on TCGA DCC data server were gathered on Jan-05-2015. Function ProcessCNAData in TCGA-Assembler package was used to obtain gene-level copy number value which is calculated as the average copy number of the genomic region of a gene. |
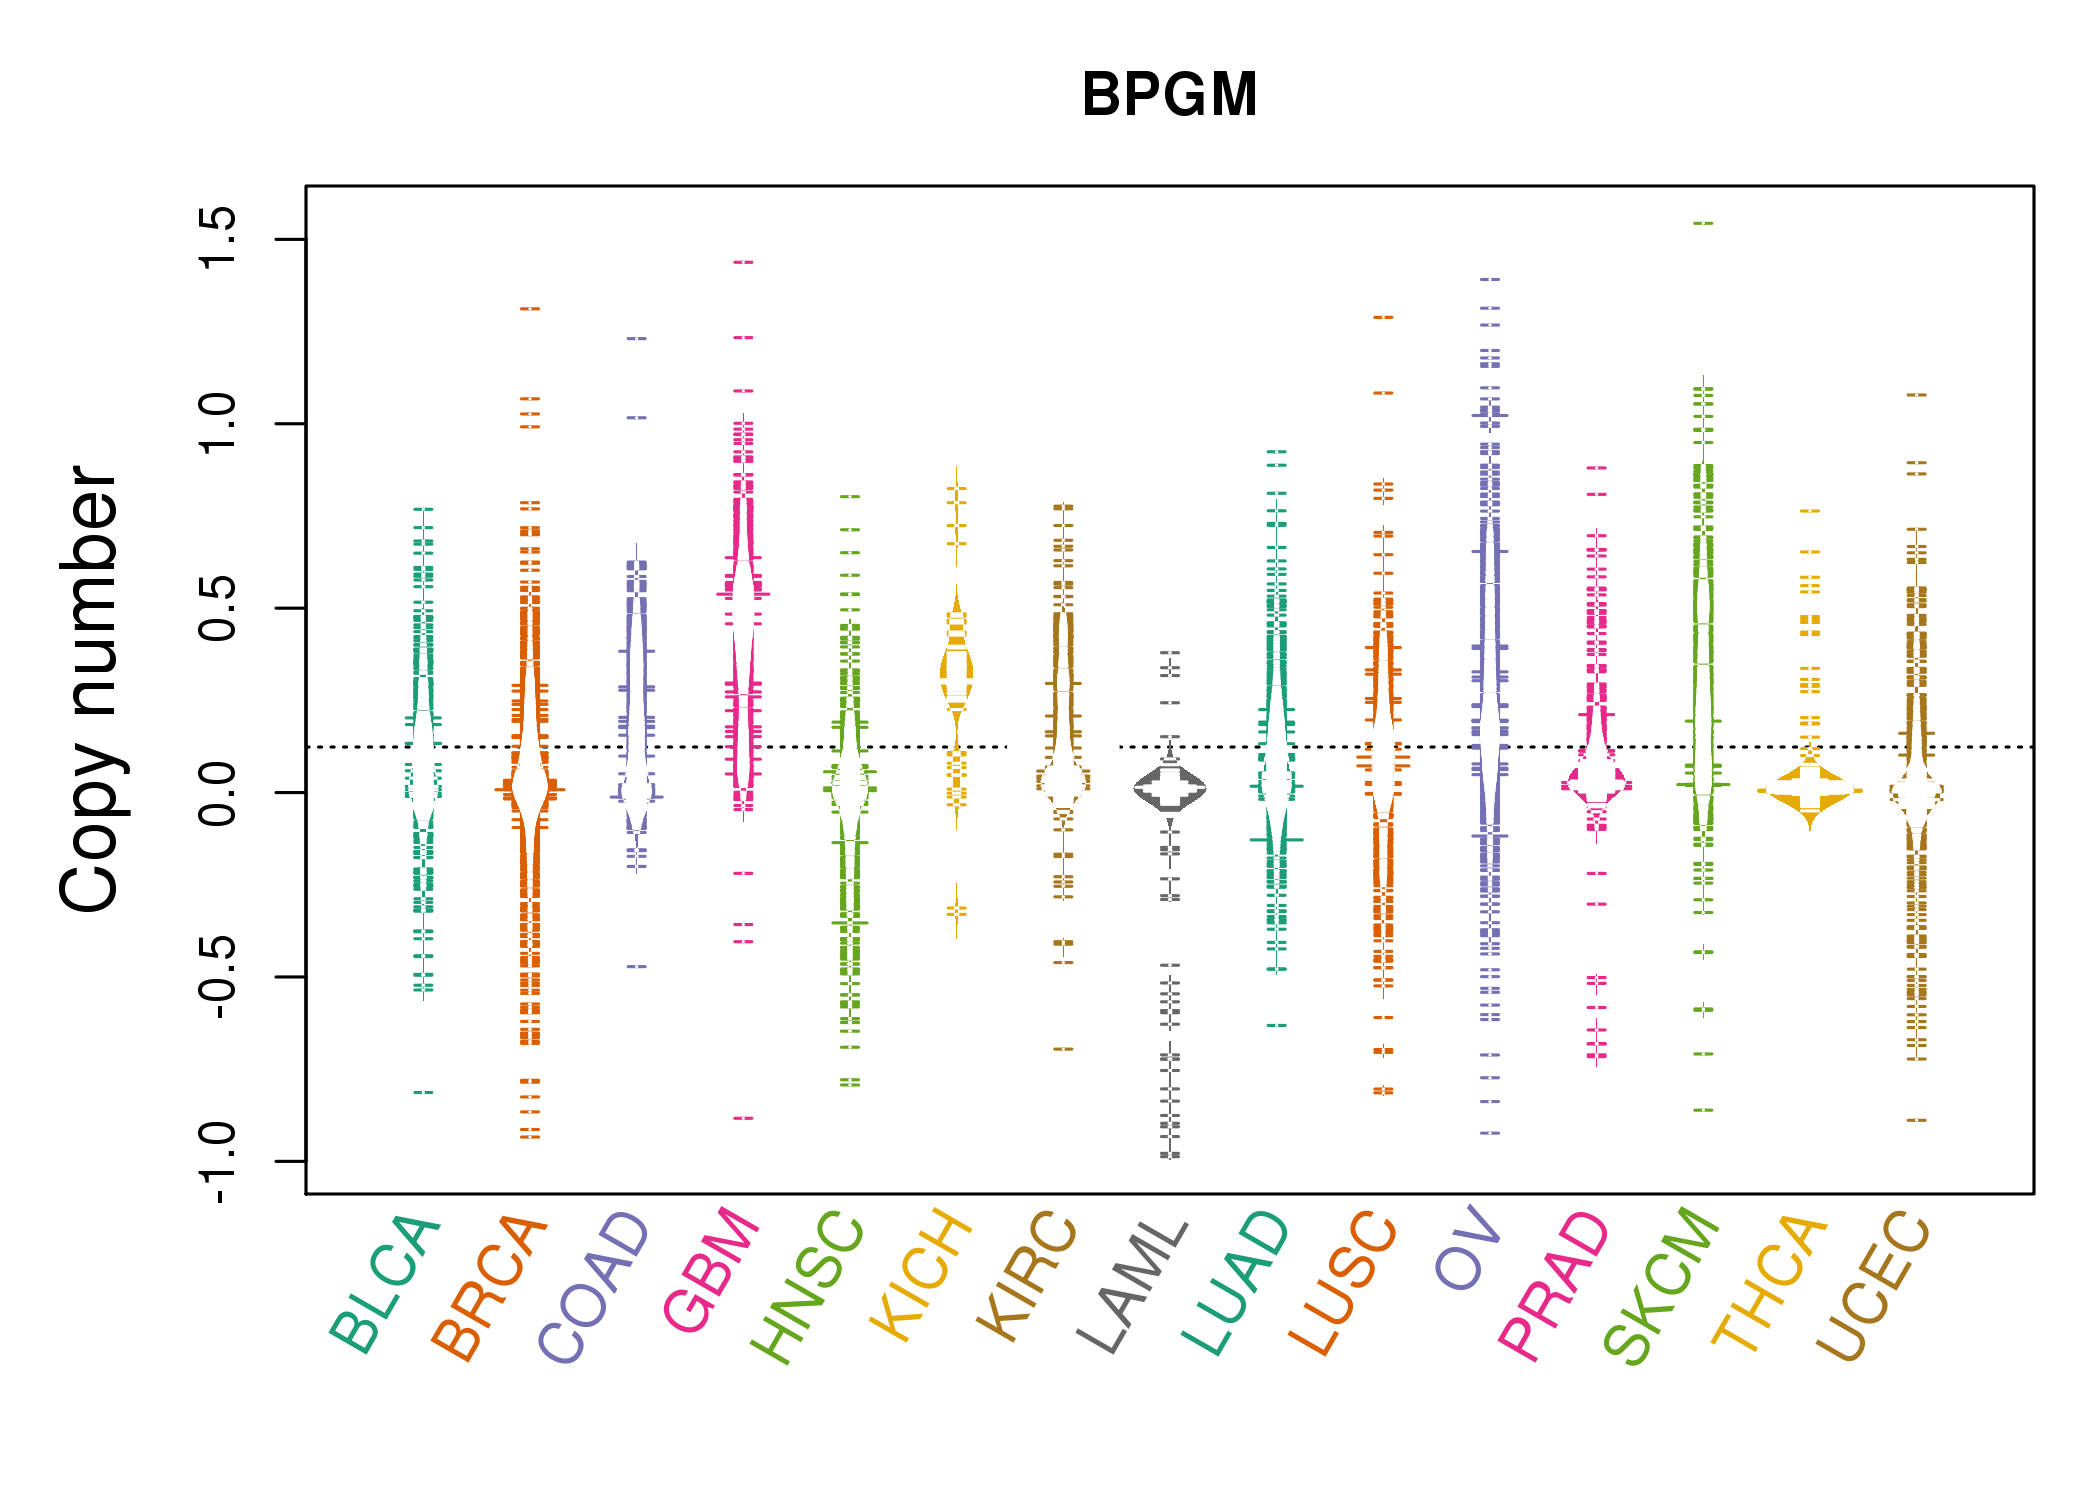 |
| cf) Tissue ID[Tissue type]: BLCA[Bladder Urothelial Carcinoma], BRCA[Breast invasive carcinoma], CESC[Cervical squamous cell carcinoma and endocervical adenocarcinoma], COAD[Colon adenocarcinoma], GBM[Glioblastoma multiforme], Glioma Low Grade, HNSC[Head and Neck squamous cell carcinoma], KICH[Kidney Chromophobe], KIRC[Kidney renal clear cell carcinoma], KIRP[Kidney renal papillary cell carcinoma], LAML[Acute Myeloid Leukemia], LUAD[Lung adenocarcinoma], LUSC[Lung squamous cell carcinoma], OV[Ovarian serous cystadenocarcinoma ], PAAD[Pancreatic adenocarcinoma], PRAD[Prostate adenocarcinoma], SKCM[Skin Cutaneous Melanoma], STAD[Stomach adenocarcinoma], THCA[Thyroid carcinoma], UCEC[Uterine Corpus Endometrial Carcinoma] |
| Top |
| Gene Expression for BPGM |
| * CCLE gene expression data were extracted from CCLE_Expression_Entrez_2012-10-18.res: Gene-centric RMA-normalized mRNA expression data. |
 |
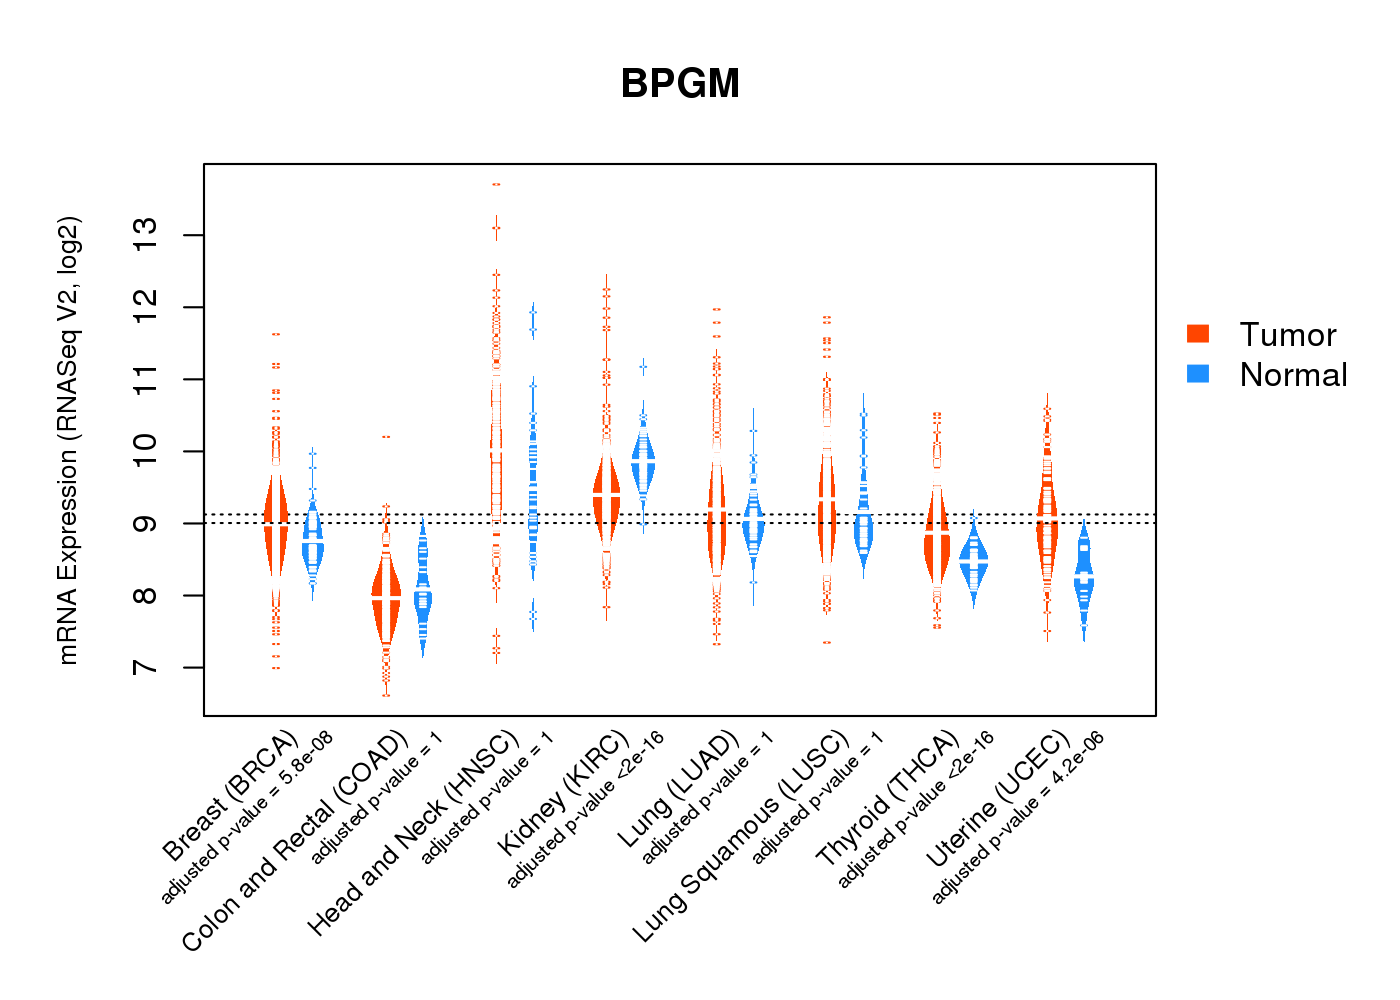
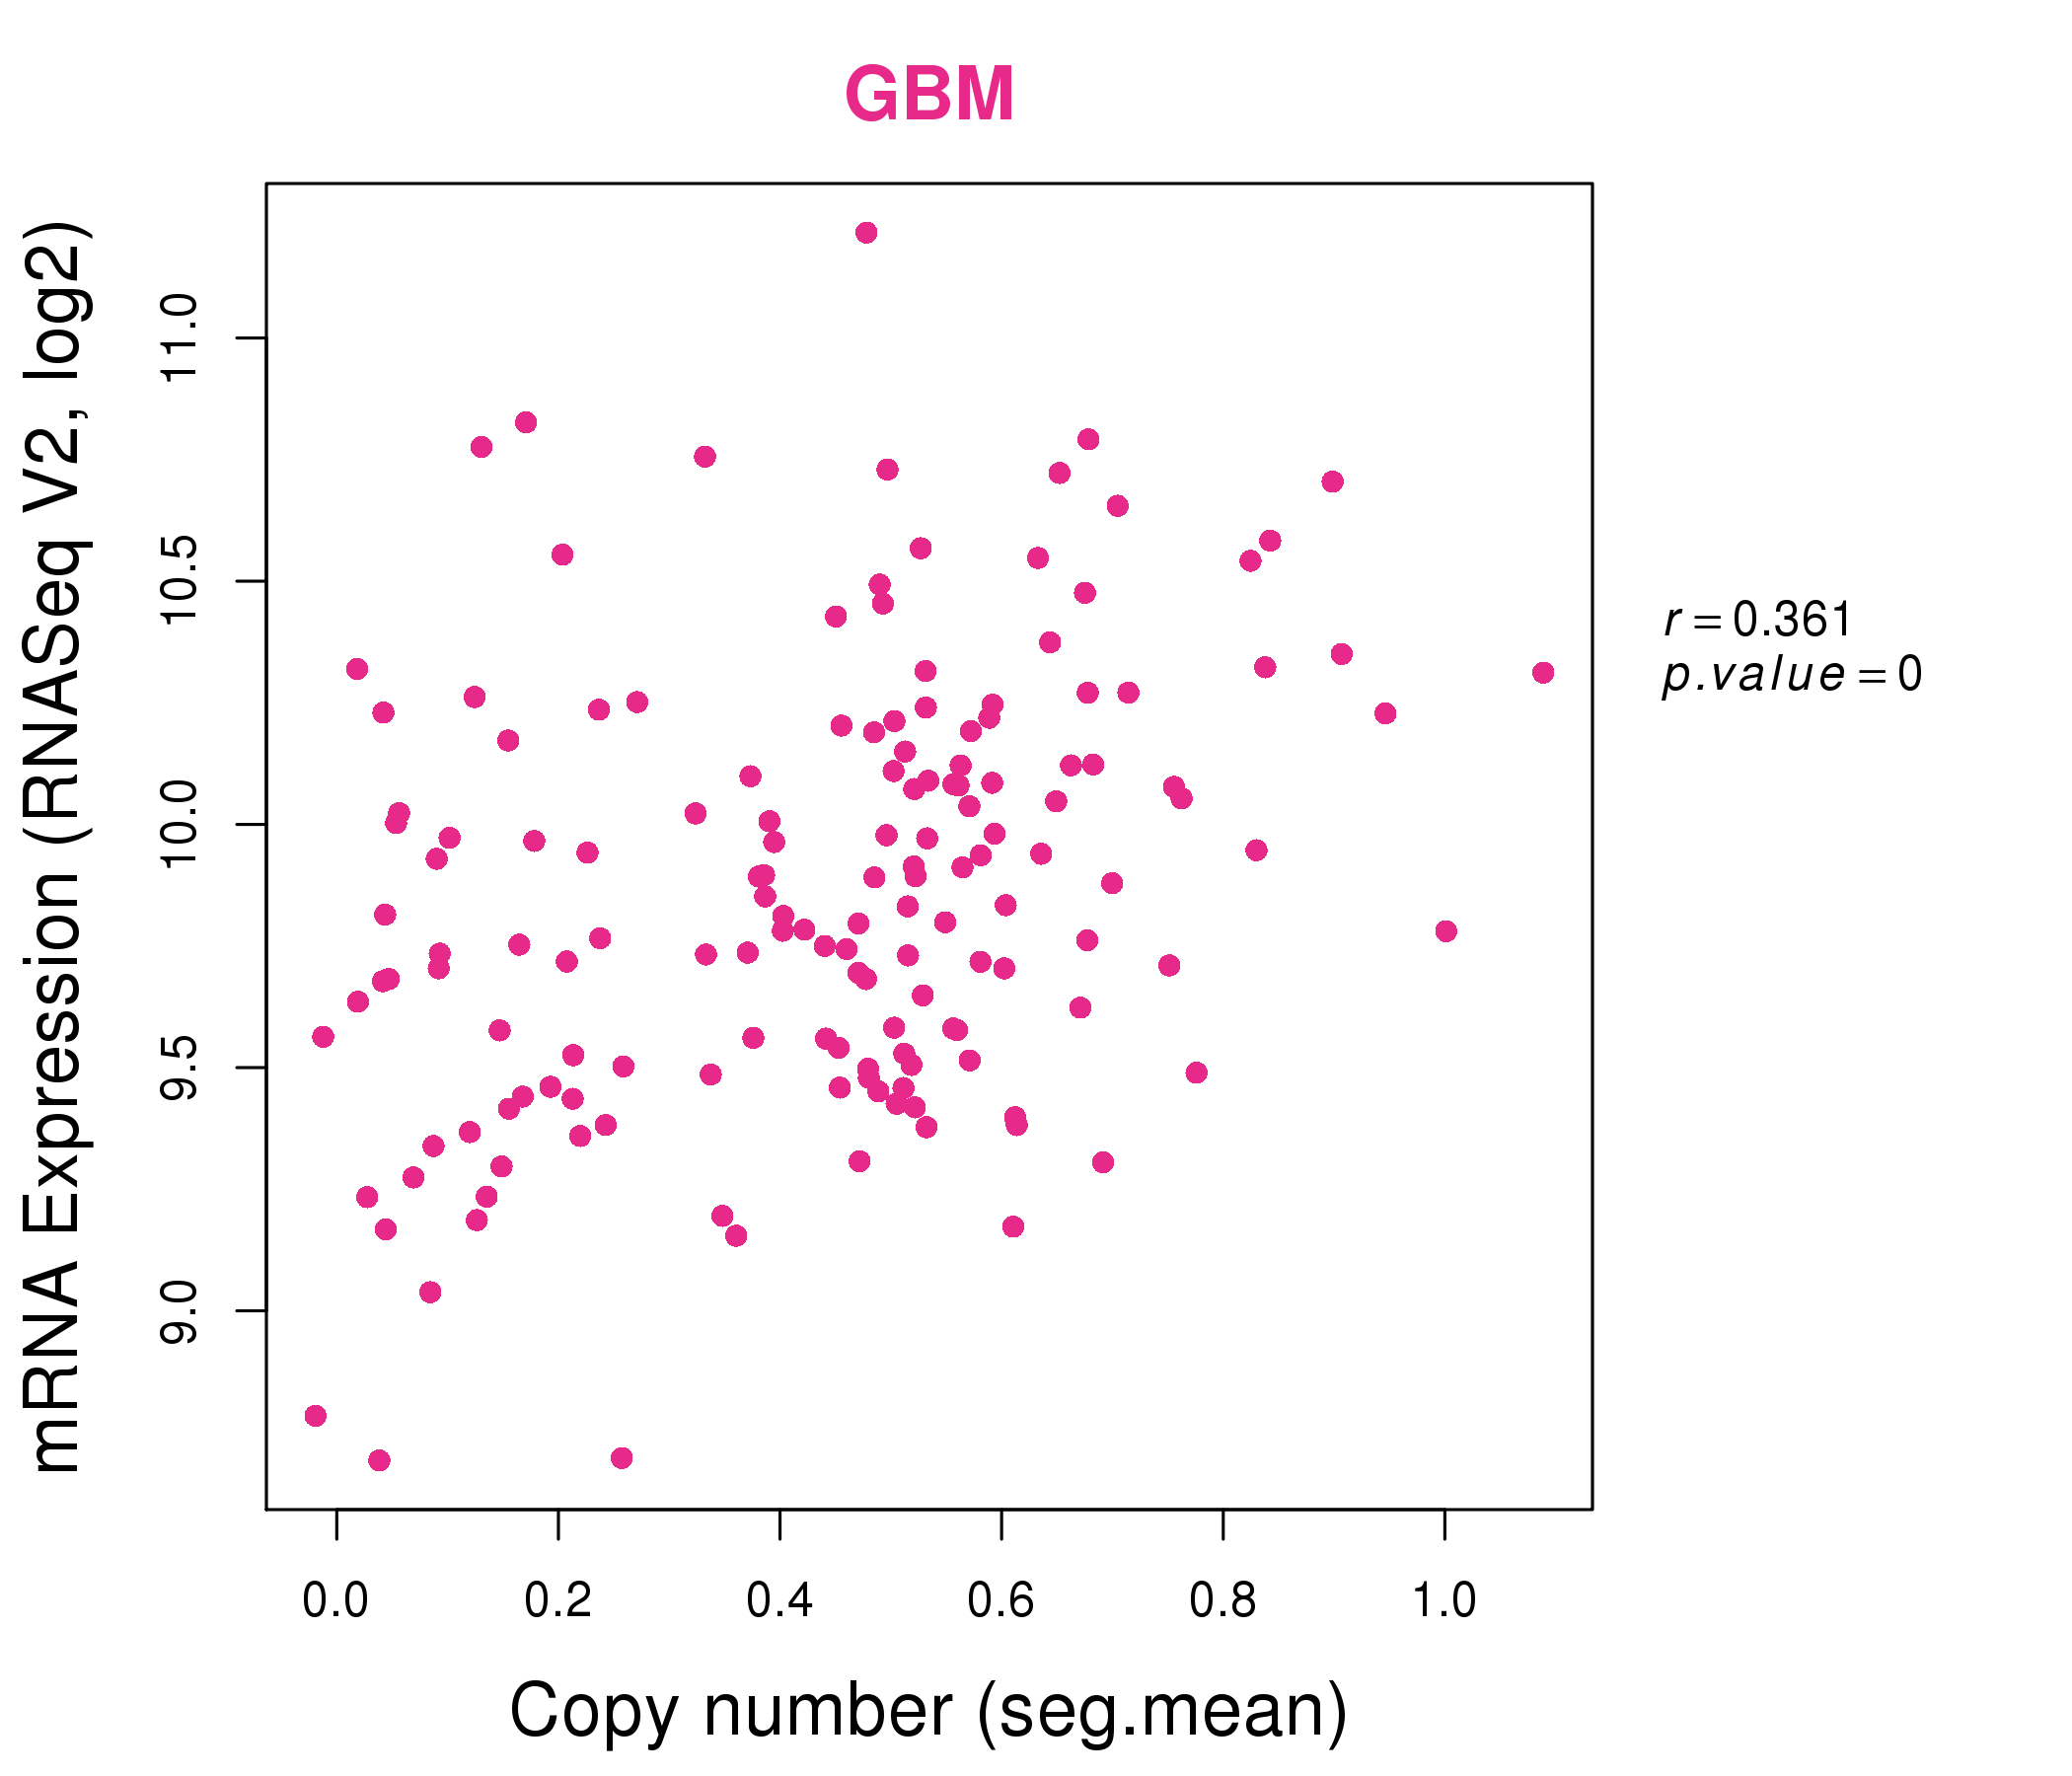
| * Normalized gene expression data of RNASeqV2 was extracted from TCGA using R package TCGA-Assembler. The URLs of all public data files on TCGA DCC data server were gathered at Jan-05-2015. Only eight cancer types have enough normal control samples for differential expression analysis. (t test, adjusted p<0.05 (using Benjamini-Hochberg FDR)) |
 |
| Top |
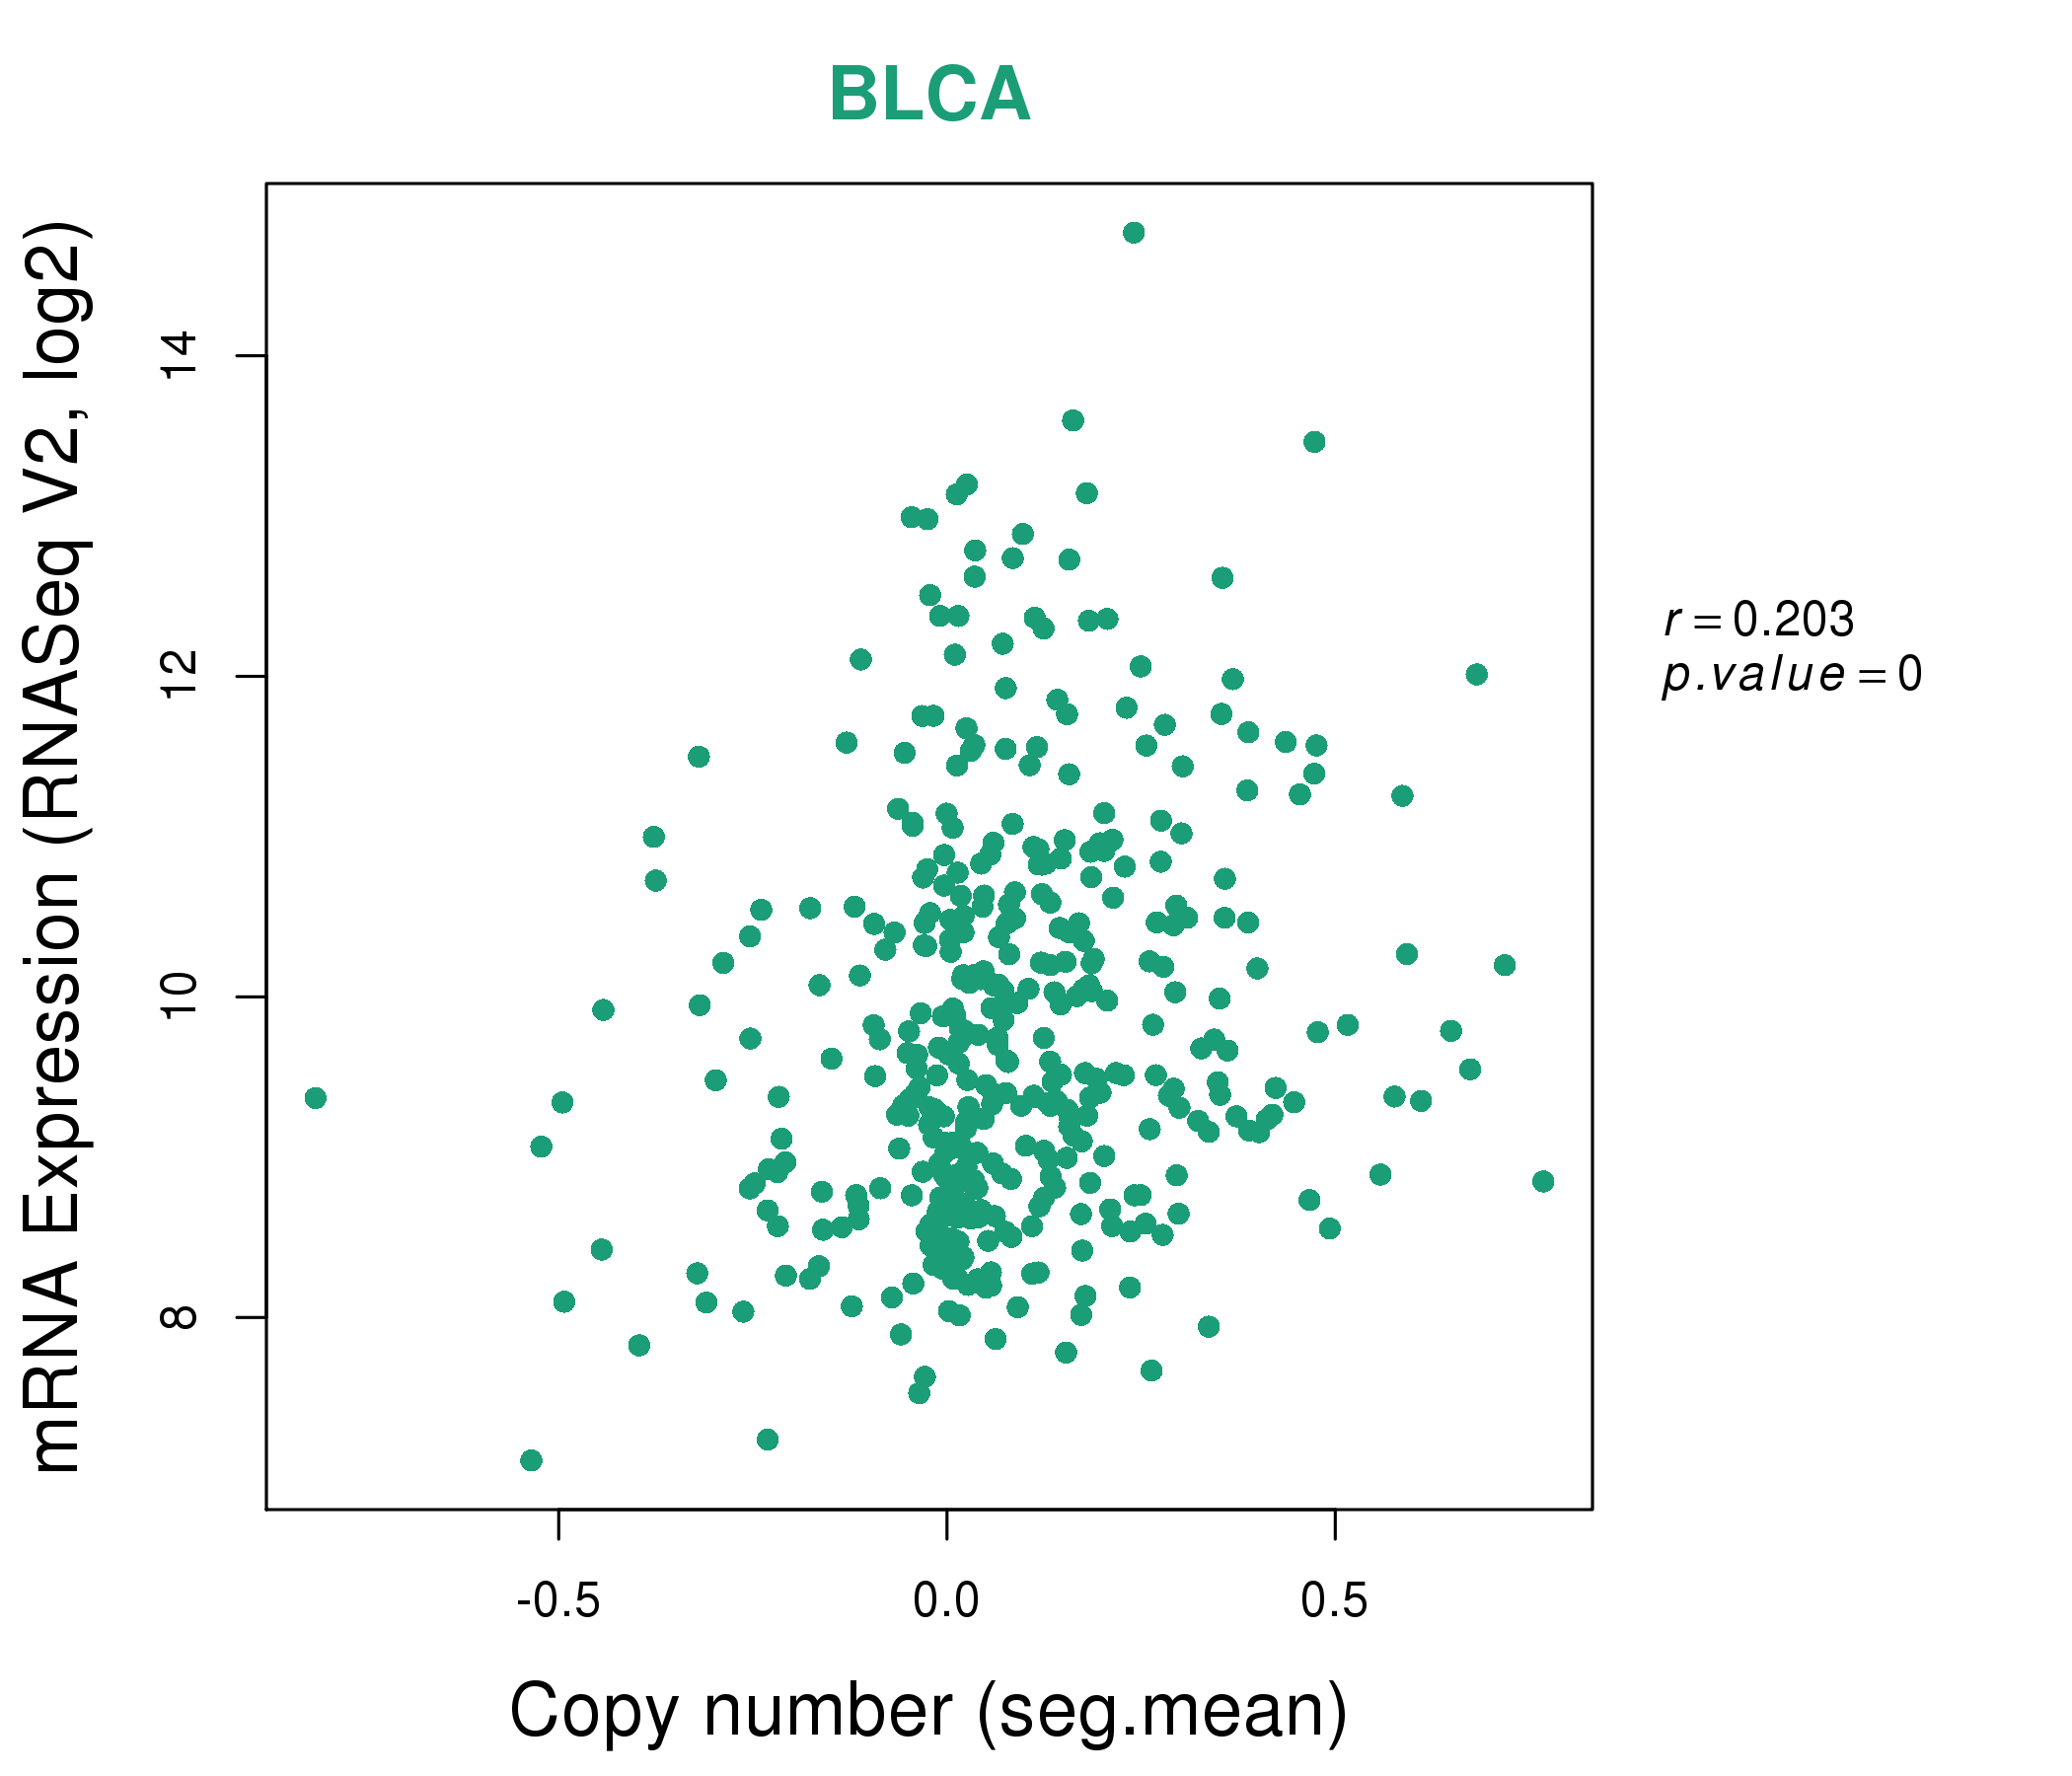
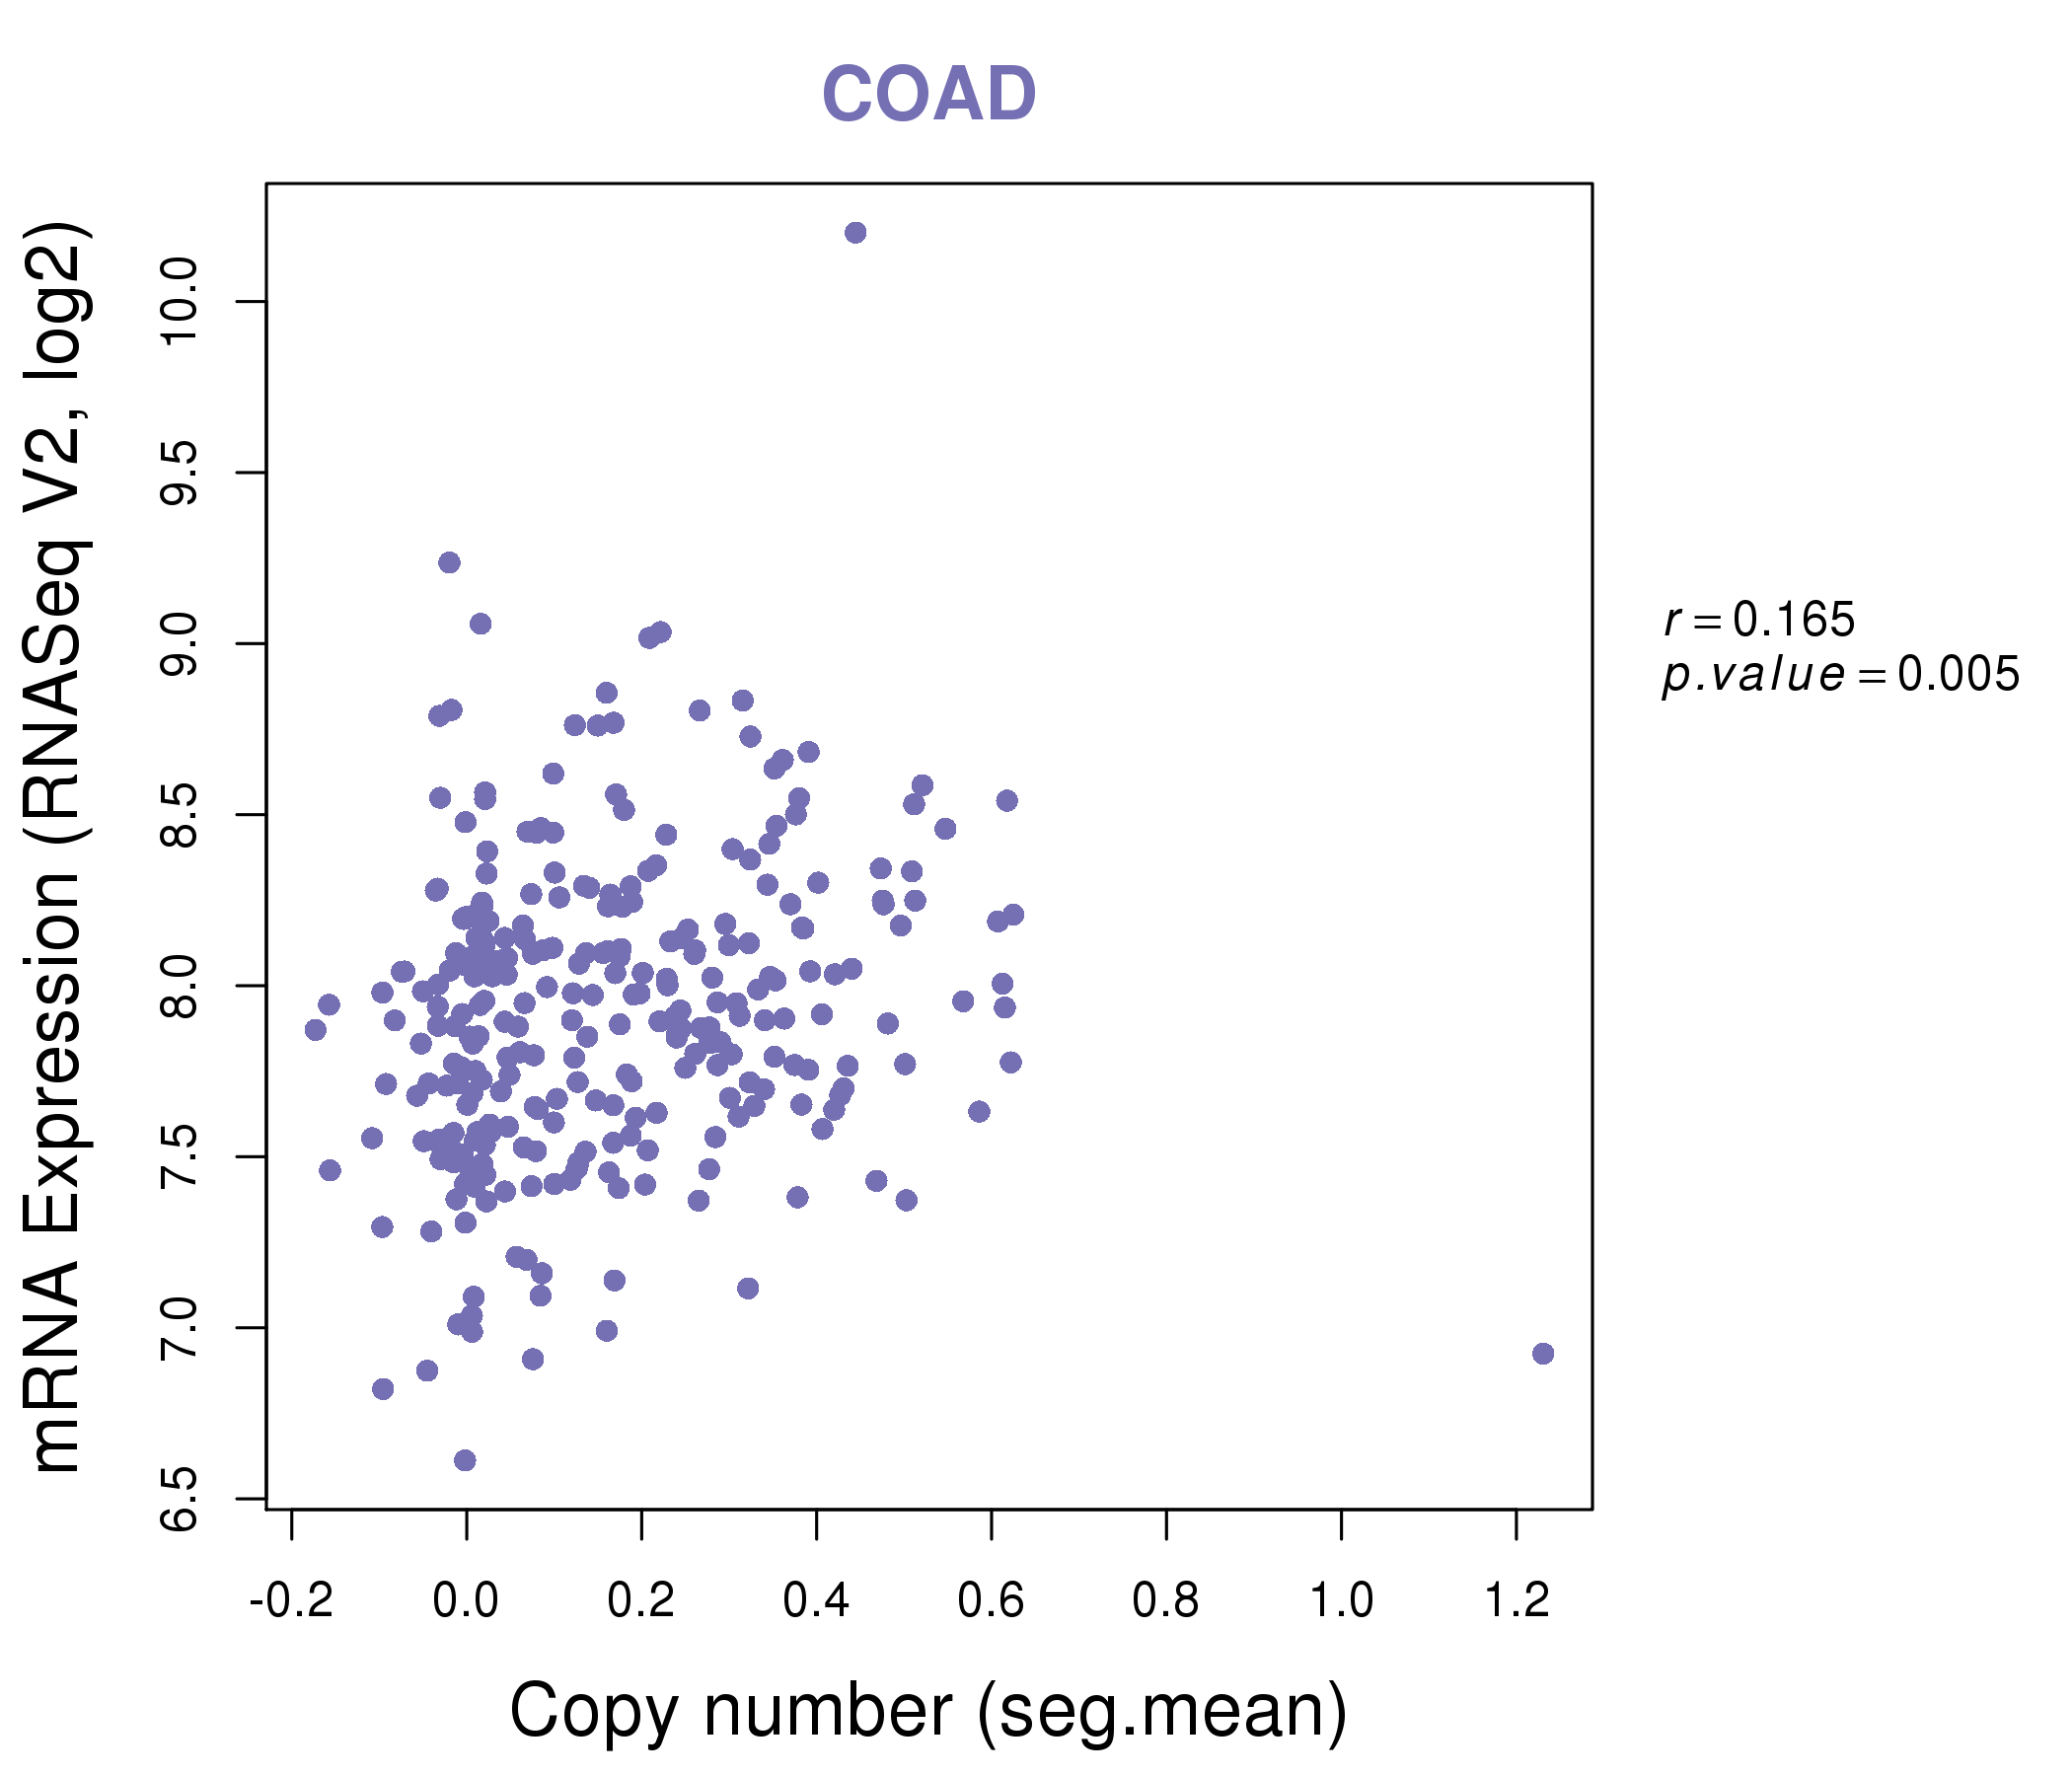
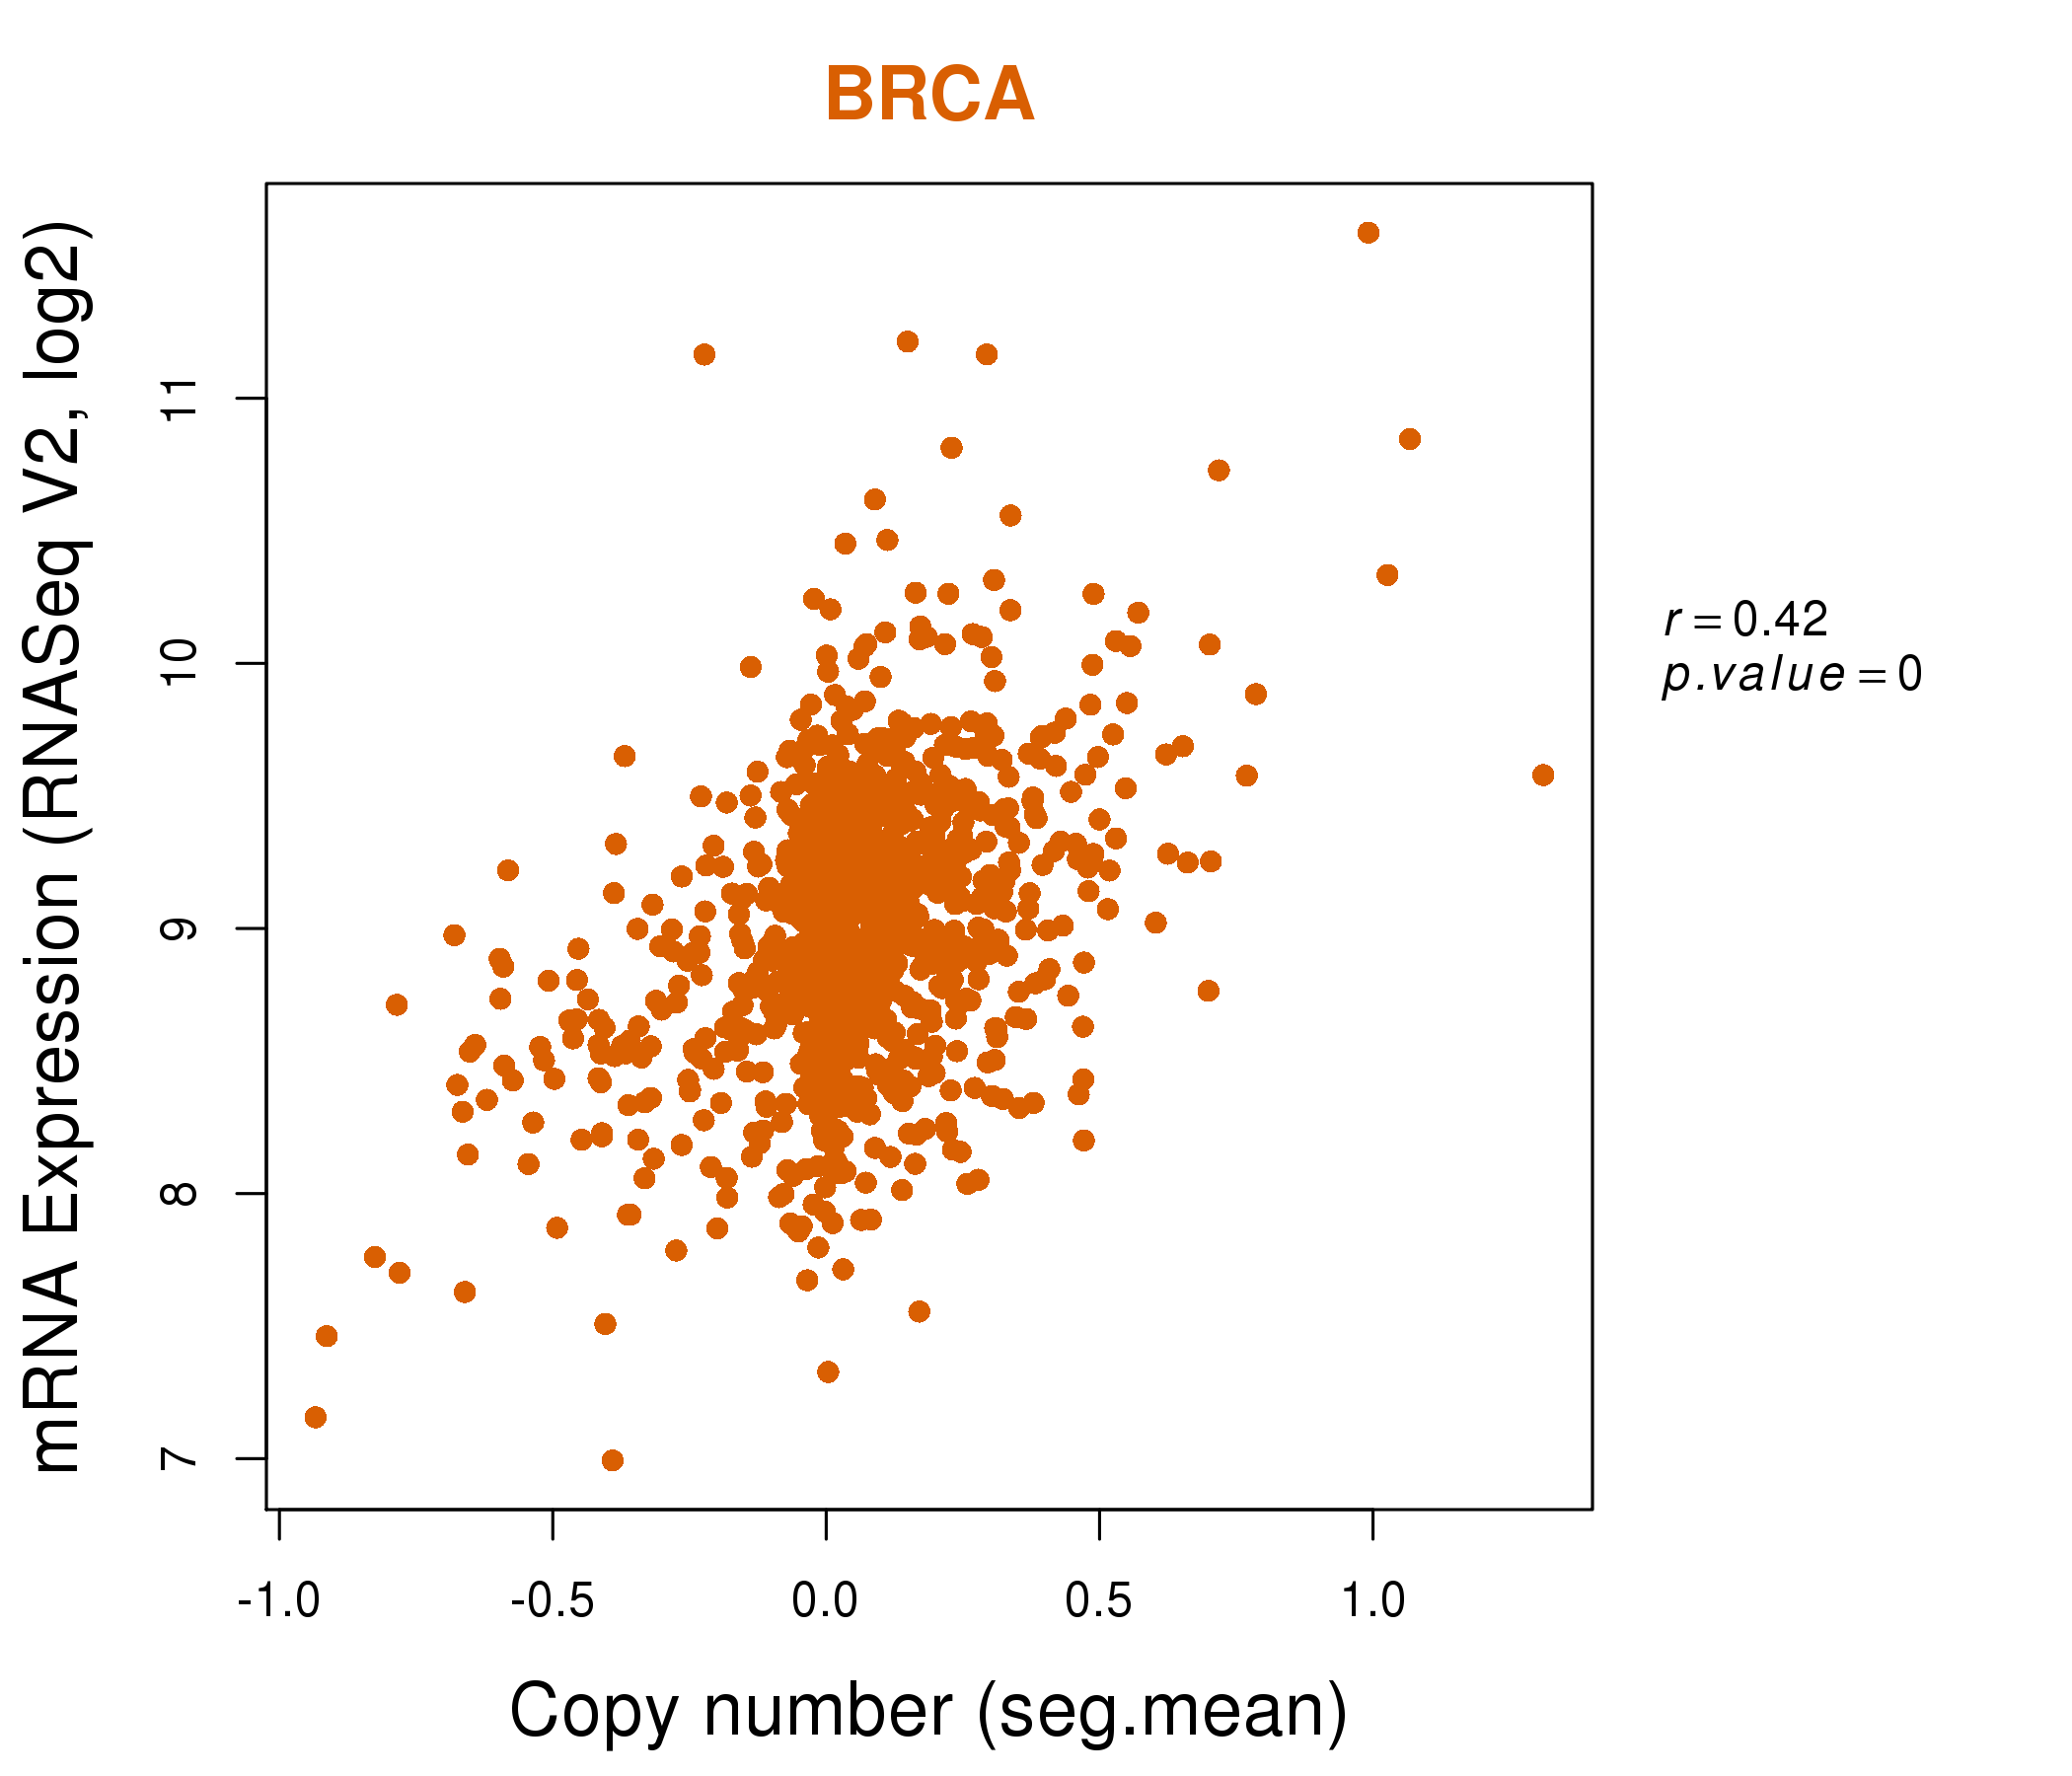
| * This plots show the correlation between CNV and gene expression. |
: Open all plots for all cancer types
 |
|
 |
|
| Top |
| Gene-Gene Network Information |
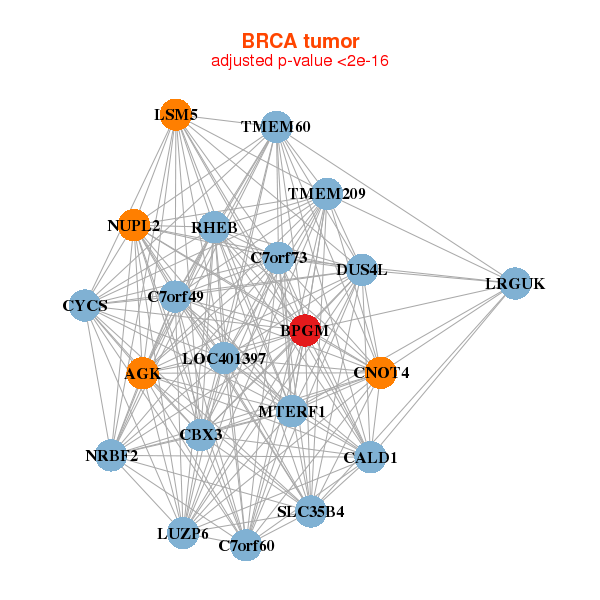
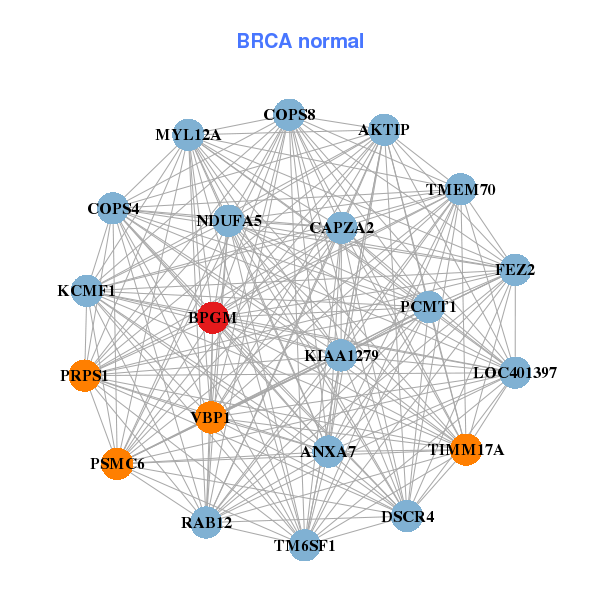
| * Co-Expression network figures were drawn using R package igraph. Only the top 20 genes with the highest correlations were shown. Red circle: input gene, orange circle: cell metabolism gene, sky circle: other gene |
: Open all plots for all cancer types
 |
|
| AGK,BPGM,C7orf49,C7orf60,CALD1,CBX3,CNOT4, CYCS,DUS4L,LOC401397,LRGUK,LSM5,LUZP6,MTERF1, NRBF2,NUPL2,C7orf73,RHEB,SLC35B4,TMEM209,TMEM60 | AKTIP,ANXA7,BPGM,CAPZA2,COPS4,COPS8,DSCR4, FEZ2,KCMF1,KIAA1279,LOC401397,MYL12A,NDUFA5,PCMT1, PRPS1,PSMC6,RAB12,TIMM17A,TM6SF1,TMEM70,VBP1 |
 |
|
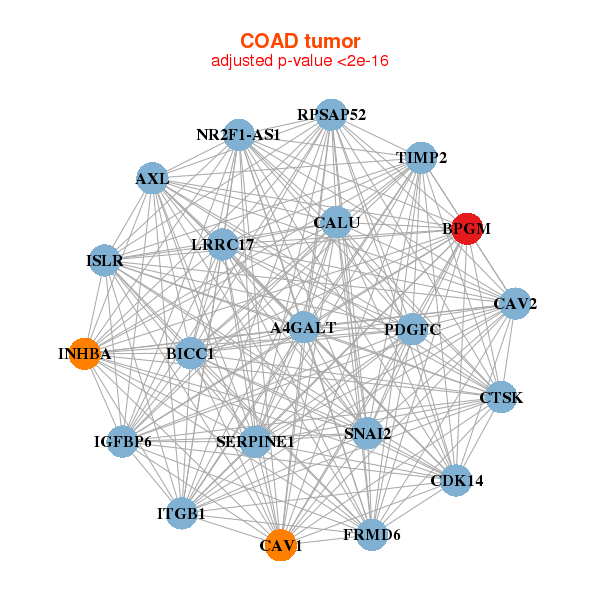
| A4GALT,AXL,BICC1,BPGM,CALU,CAV1,CAV2, CDK14,CTSK,NR2F1-AS1,FRMD6,IGFBP6,INHBA,ISLR, ITGB1,LRRC17,PDGFC,RPSAP52,SERPINE1,SNAI2,TIMP2 | BPGM,ARL14EP,C1orf123,BRK1,C4orf27,CCDC53,COMMD6, CRYZL1,MORF4L1,MYL6,PAIP2,PCMT1,PKIG,PPT1, RAP1A,SEPT10,SNAPIN,SNX3,TTC33,UQCRB,UROD |
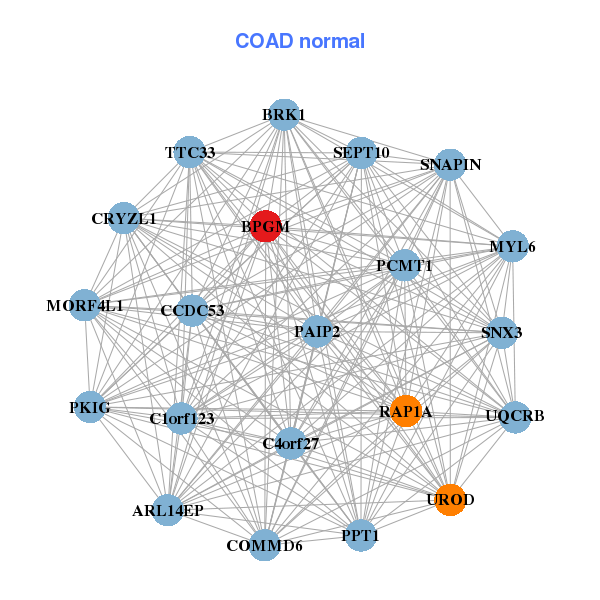
| * Co-Expression network figures were drawn using R package igraph. Only the top 20 genes with the highest correlations were shown. Red circle: input gene, orange circle: cell metabolism gene, sky circle: other gene |
: Open all plots for all cancer types
| Top |
: Open all interacting genes' information including KEGG pathway for all interacting genes from DAVID
| Top |
| Pharmacological Information for BPGM |
| There's no related Drug. |
| Top |
| Cross referenced IDs for BPGM |
| * We obtained these cross-references from Uniprot database. It covers 150 different DBs, 18 categories. http://www.uniprot.org/help/cross_references_section |
: Open all cross reference information
|
Copyright © 2016-Present - The Univsersity of Texas Health Science Center at Houston @ |