|
||||||||||||||||||||||||||||||||||||||||||||||||||||||||||||||||||||||||||||||||||||||||||||||||||||||||||||||||||||||||||||||||||||||||||||||||||||||||||||||||||||||||||||||||||||||||||||||||||||||||||||||||||||||||||||||||||||||||||||||||||||||||||||||||||||||||||||||||||||||||||||||||||||||||||||||||||||||||||
| |
| Phenotypic Information (metabolism pathway, cancer, disease, phenome) |
| |
| |
| Gene-Gene Network Information: Co-Expression Network, Interacting Genes & KEGG |
| |
|


| Gene Summary for SQLE |
| Basic gene info. | Gene symbol | SQLE |
| Gene name | squalene epoxidase | |
| Synonyms | - | |
| Cytomap | UCSC genome browser: 8q24.1 | |
| Genomic location | chr8 :126010719-126034525 | |
| Type of gene | protein-coding | |
| RefGenes | NM_003129.3, | |
| Ensembl id | ENSG00000104549 | |
| Description | SEsqualene monooxygenase | |
| Modification date | 20141207 | |
| dbXrefs | MIM : 602019 | |
| HGNC : HGNC | ||
| Ensembl : ENSG00000104549 | ||
| HPRD : 11802 | ||
| Vega : OTTHUMG00000164990 | ||
| Protein | UniProt: go to UniProt's Cross Reference DB Table | |
| Expression | CleanEX: HS_SQLE | |
| BioGPS: 6713 | ||
| Gene Expression Atlas: ENSG00000104549 | ||
| The Human Protein Atlas: ENSG00000104549 | ||
| Pathway | NCI Pathway Interaction Database: SQLE | |
| KEGG: SQLE | ||
| REACTOME: SQLE | ||
| ConsensusPathDB | ||
| Pathway Commons: SQLE | ||
| Metabolism | MetaCyc: SQLE | |
| HUMANCyc: SQLE | ||
| Regulation | Ensembl's Regulation: ENSG00000104549 | |
| miRBase: chr8 :126,010,719-126,034,525 | ||
| TargetScan: NM_003129 | ||
| cisRED: ENSG00000104549 | ||
| Context | iHOP: SQLE | |
| cancer metabolism search in PubMed: SQLE | ||
| UCL Cancer Institute: SQLE | ||
| Assigned class in ccmGDB | C | |
| Top |
| Phenotypic Information for SQLE(metabolism pathway, cancer, disease, phenome) |
| Cancer | CGAP: SQLE |
| Familial Cancer Database: SQLE | |
| * This gene is included in those cancer gene databases. |
|
|
|
|
|
| . | ||||||||||||||||||||||||||||||||||||||||||||||||||||||||||||||||||||||||||||||||||||||||||||||||||||||||||||||||||||||||||||||||||||||||||||||||||||||||||||||||||||||||||||||||||||||||||||||||||||||||||||||||||||||||||||||||||||||||||||||||||||||||||||||||||||||||||||||||||||||||||||||||||||||||||||||||||||
Oncogene 1 | Significant driver gene in | |||||||||||||||||||||||||||||||||||||||||||||||||||||||||||||||||||||||||||||||||||||||||||||||||||||||||||||||||||||||||||||||||||||||||||||||||||||||||||||||||||||||||||||||||||||||||||||||||||||||||||||||||||||||||||||||||||||||||||||||||||||||||||||||||||||||||||||||||||||||||||||||||||||||||||||||||||||||||
| cf) number; DB name 1 Oncogene; http://nar.oxfordjournals.org/content/35/suppl_1/D721.long, 2 Tumor Suppressor gene; https://bioinfo.uth.edu/TSGene/, 3 Cancer Gene Census; http://www.nature.com/nrc/journal/v4/n3/abs/nrc1299.html, 4 CancerGenes; http://nar.oxfordjournals.org/content/35/suppl_1/D721.long, 5 Network of Cancer Gene; http://ncg.kcl.ac.uk/index.php, 1Therapeutic Vulnerabilities in Cancer; http://cbio.mskcc.org/cancergenomics/statius/ |
| REACTOME_METABOLISM_OF_LIPIDS_AND_LIPOPROTEINS | |
| OMIM | |
| Orphanet | |
| Disease | KEGG Disease: SQLE |
| MedGen: SQLE (Human Medical Genetics with Condition) | |
| ClinVar: SQLE | |
| Phenotype | MGI: SQLE (International Mouse Phenotyping Consortium) |
| PhenomicDB: SQLE | |
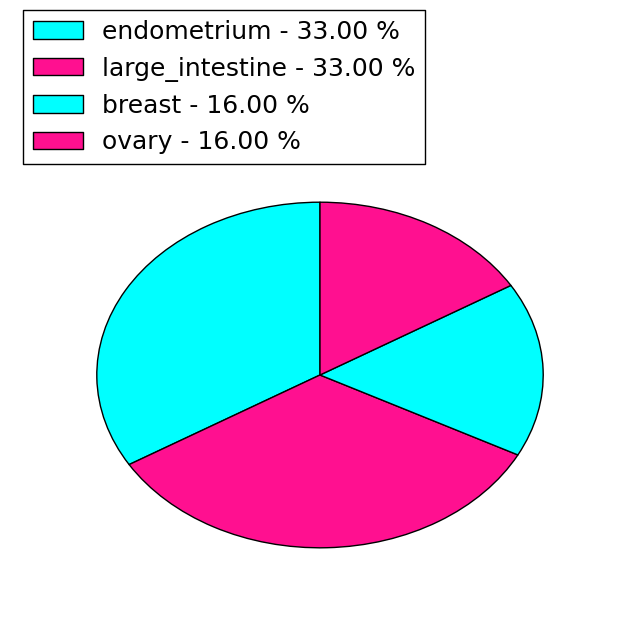
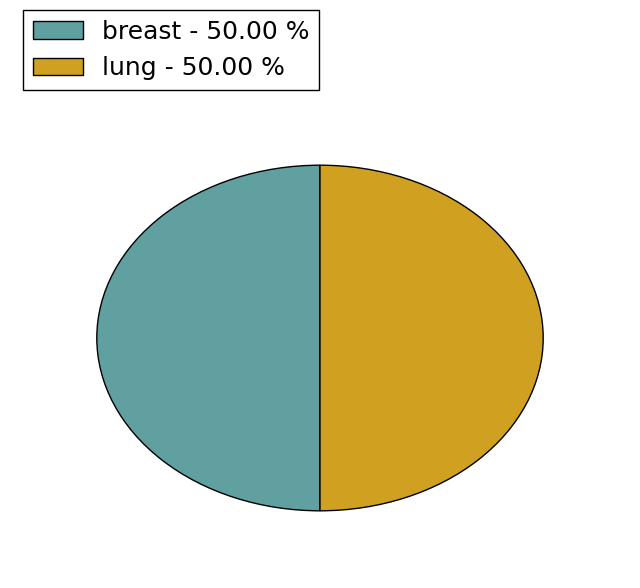
| Mutations for SQLE |
| * Under tables are showing count per each tissue to give us broad intuition about tissue specific mutation patterns.You can go to the detailed page for each mutation database's web site. |
| - Statistics for Tissue and Mutation type | Top |
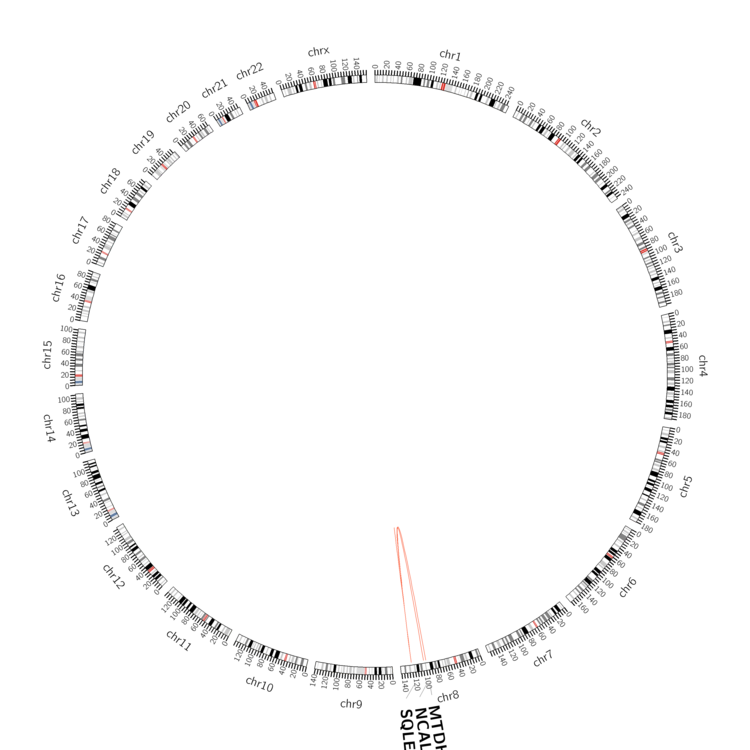 |
| - For Inter-chromosomal Variations |
| There's no inter-chromosomal structural variation. |
| - For Intra-chromosomal Variations |
| * Intra-chromosomal variantions includes 'intrachromosomal amplicon to amplicon', 'intrachromosomal amplicon to non-amplified dna', 'intrachromosomal deletion', 'intrachromosomal fold-back inversion', 'intrachromosomal inversion', 'intrachromosomal tandem duplication', 'Intrachromosomal unknown type', 'intrachromosomal with inverted orientation', 'intrachromosomal with non-inverted orientation'. |
 |
| Sample | Symbol_a | Chr_a | Start_a | End_a | Symbol_b | Chr_b | Start_b | End_b |
| ovary | SQLE | chr8 | 126021985 | 126022005 | SQLE | chr8 | 126022060 | 126022080 |
| pancreas | SQLE | chr8 | 126015834 | 126015854 | NCALD | chr8 | 102783017 | 102783037 |
| pancreas | SQLE | chr8 | 126015837 | 126015857 | NCALD | chr8 | 102783017 | 102783037 |
| pancreas | SQLE | chr8 | 126026192 | 126026212 | MTDH | chr8 | 98710116 | 98710136 |
| cf) Tissue number; Tissue name (1;Breast, 2;Central_nervous_system, 3;Haematopoietic_and_lymphoid_tissue, 4;Large_intestine, 5;Liver, 6;Lung, 7;Ovary, 8;Pancreas, 9;Prostate, 10;Skin, 11;Soft_tissue, 12;Upper_aerodigestive_tract) |
| * From mRNA Sanger sequences, Chitars2.0 arranged chimeric transcripts. This table shows SQLE related fusion information. |
| ID | Head Gene | Tail Gene | Accession | Gene_a | qStart_a | qEnd_a | Chromosome_a | tStart_a | tEnd_a | Gene_a | qStart_a | qEnd_a | Chromosome_a | tStart_a | tEnd_a |
| BE183534 | RAI1 | 1 | 134 | 17 | 17624352 | 17624486 | SQLE | 126 | 333 | 8 | 126021415 | 126023815 | |
| Top |
| Mutation type/ Tissue ID | brca | cns | cerv | endome | haematopo | kidn | Lintest | liver | lung | ns | ovary | pancre | prost | skin | stoma | thyro | urina | |||
| Total # sample | 1 | 1 | 2 | 1 | ||||||||||||||||
| GAIN (# sample) | 1 | 1 | 2 | 1 | ||||||||||||||||
| LOSS (# sample) |
| cf) Tissue ID; Tissue type (1; Breast, 2; Central_nervous_system, 3; Cervix, 4; Endometrium, 5; Haematopoietic_and_lymphoid_tissue, 6; Kidney, 7; Large_intestine, 8; Liver, 9; Lung, 10; NS, 11; Ovary, 12; Pancreas, 13; Prostate, 14; Skin, 15; Stomach, 16; Thyroid, 17; Urinary_tract) |
| Top |
|
 |
| Top |
| Stat. for Non-Synonymous SNVs (# total SNVs=24) | (# total SNVs=6) |
 |  |
(# total SNVs=2) | (# total SNVs=0) |
 |
| Top |
| * When you move the cursor on each content, you can see more deailed mutation information on the Tooltip. Those are primary_site,primary_histology,mutation(aa),pubmedID. |
| GRCh37 position | Mutation(aa) | Unique sampleID count |
| chr8:126034161-126034161 | p.S567A | 2 |
| chr8:126030321-126030321 | p.A409T | 2 |
| chr8:126030962-126030962 | p.A479A | 2 |
| chr8:126011654-126011654 | p.T3T | 2 |
| chr8:126015497-126015497 | p.P124L | 2 |
| chr8:126015523-126015523 | p.V133M | 2 |
| chr8:126021249-126021249 | p.L287F | 1 |
| chr8:126021568-126021568 | p.I364N | 1 |
| chr8:126011749-126011751 | p.L36delL | 1 |
| chr8:126015634-126015634 | p.G170S | 1 |
| Top |
|
 |
| Point Mutation/ Tissue ID | 1 | 2 | 3 | 4 | 5 | 6 | 7 | 8 | 9 | 10 | 11 | 12 | 13 | 14 | 15 | 16 | 17 | 18 | 19 | 20 |
| # sample | 1 | 4 | 1 | 1 | 3 | 3 | 2 | 6 | 5 | 6 | ||||||||||
| # mutation | 1 | 4 | 1 | 1 | 2 | 3 | 2 | 6 | 5 | 7 | ||||||||||
| nonsynonymous SNV | 3 | 1 | 1 | 3 | 1 | 5 | 3 | 5 | ||||||||||||
| synonymous SNV | 1 | 1 | 1 | 1 | 1 | 1 | 2 | 2 |
| cf) Tissue ID; Tissue type (1; BLCA[Bladder Urothelial Carcinoma], 2; BRCA[Breast invasive carcinoma], 3; CESC[Cervical squamous cell carcinoma and endocervical adenocarcinoma], 4; COAD[Colon adenocarcinoma], 5; GBM[Glioblastoma multiforme], 6; Glioma Low Grade, 7; HNSC[Head and Neck squamous cell carcinoma], 8; KICH[Kidney Chromophobe], 9; KIRC[Kidney renal clear cell carcinoma], 10; KIRP[Kidney renal papillary cell carcinoma], 11; LAML[Acute Myeloid Leukemia], 12; LUAD[Lung adenocarcinoma], 13; LUSC[Lung squamous cell carcinoma], 14; OV[Ovarian serous cystadenocarcinoma ], 15; PAAD[Pancreatic adenocarcinoma], 16; PRAD[Prostate adenocarcinoma], 17; SKCM[Skin Cutaneous Melanoma], 18:STAD[Stomach adenocarcinoma], 19:THCA[Thyroid carcinoma], 20:UCEC[Uterine Corpus Endometrial Carcinoma]) |
| Top |
| * We represented just top 10 SNVs. When you move the cursor on each content, you can see more deailed mutation information on the Tooltip. Those are primary_site, primary_histology, mutation(aa), pubmedID. |
| Genomic Position | Mutation(aa) | Unique sampleID count |
| chr8:126015633 | p.P169P | 2 |
| chr8:126011654 | p.T3T | 2 |
| chr8:126021464 | p.I21T | 1 |
| chr8:126011707 | p.S294S | 1 |
| chr8:126017926 | p.L29L | 1 |
| chr8:126021539 | p.V300V | 1 |
| chr8:126011730 | p.K90T | 1 |
| chr8:126019643 | p.V302A | 1 |
| chr8:126021568 | p.I128I | 1 |
| chr8:126011914 | p.P329S | 1 |
| * Copy number data were extracted from TCGA using R package TCGA-Assembler. The URLs of all public data files on TCGA DCC data server were gathered on Jan-05-2015. Function ProcessCNAData in TCGA-Assembler package was used to obtain gene-level copy number value which is calculated as the average copy number of the genomic region of a gene. |
 |
| cf) Tissue ID[Tissue type]: BLCA[Bladder Urothelial Carcinoma], BRCA[Breast invasive carcinoma], CESC[Cervical squamous cell carcinoma and endocervical adenocarcinoma], COAD[Colon adenocarcinoma], GBM[Glioblastoma multiforme], Glioma Low Grade, HNSC[Head and Neck squamous cell carcinoma], KICH[Kidney Chromophobe], KIRC[Kidney renal clear cell carcinoma], KIRP[Kidney renal papillary cell carcinoma], LAML[Acute Myeloid Leukemia], LUAD[Lung adenocarcinoma], LUSC[Lung squamous cell carcinoma], OV[Ovarian serous cystadenocarcinoma ], PAAD[Pancreatic adenocarcinoma], PRAD[Prostate adenocarcinoma], SKCM[Skin Cutaneous Melanoma], STAD[Stomach adenocarcinoma], THCA[Thyroid carcinoma], UCEC[Uterine Corpus Endometrial Carcinoma] |
| Top |
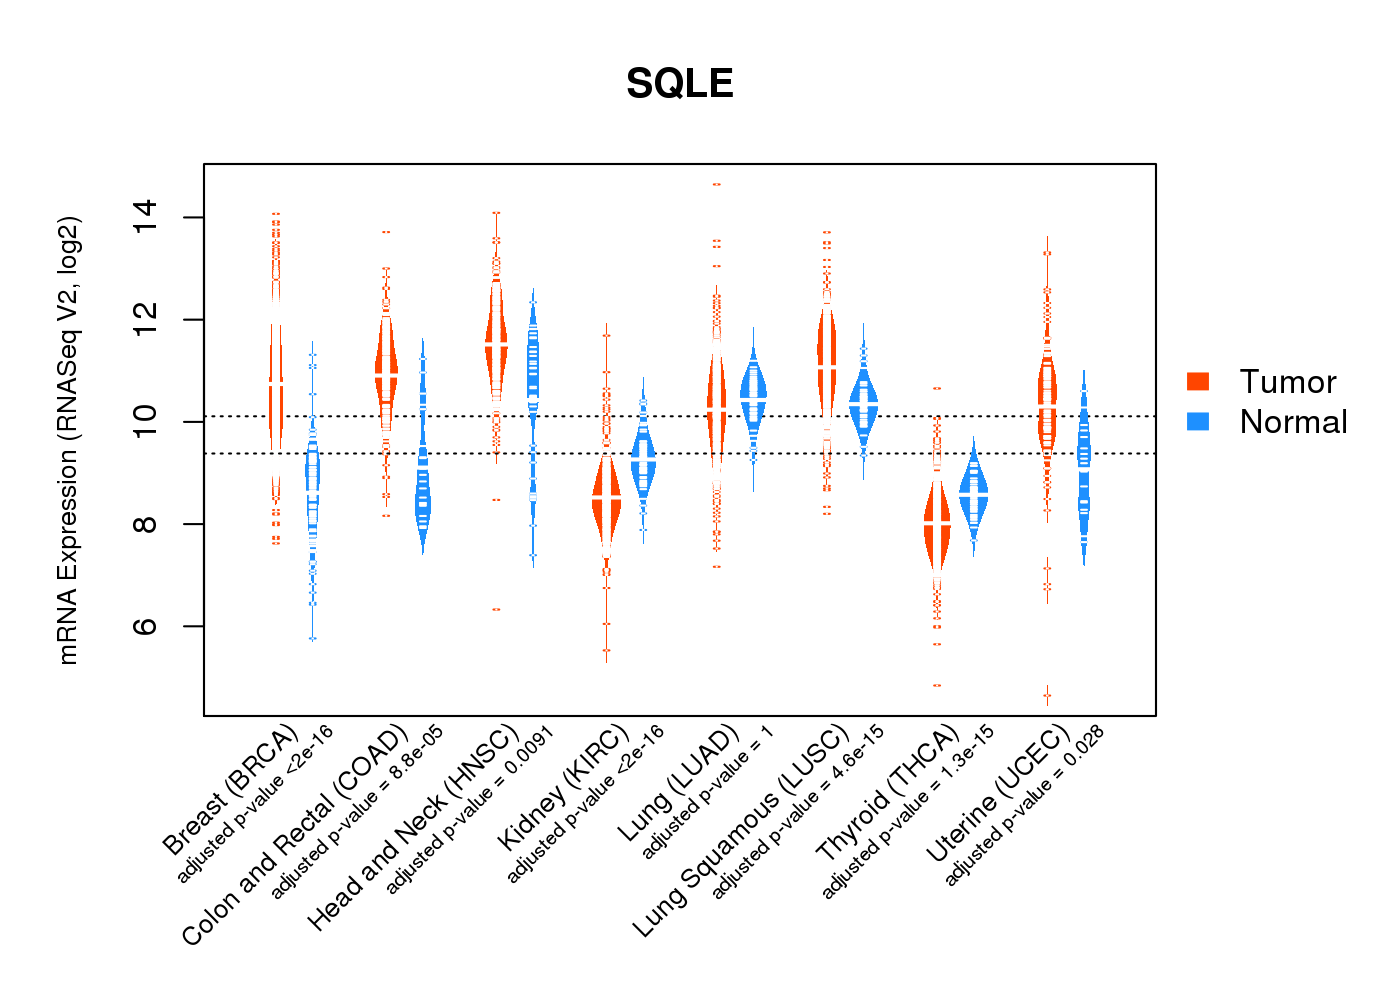
| Gene Expression for SQLE |
| * CCLE gene expression data were extracted from CCLE_Expression_Entrez_2012-10-18.res: Gene-centric RMA-normalized mRNA expression data. |
 |
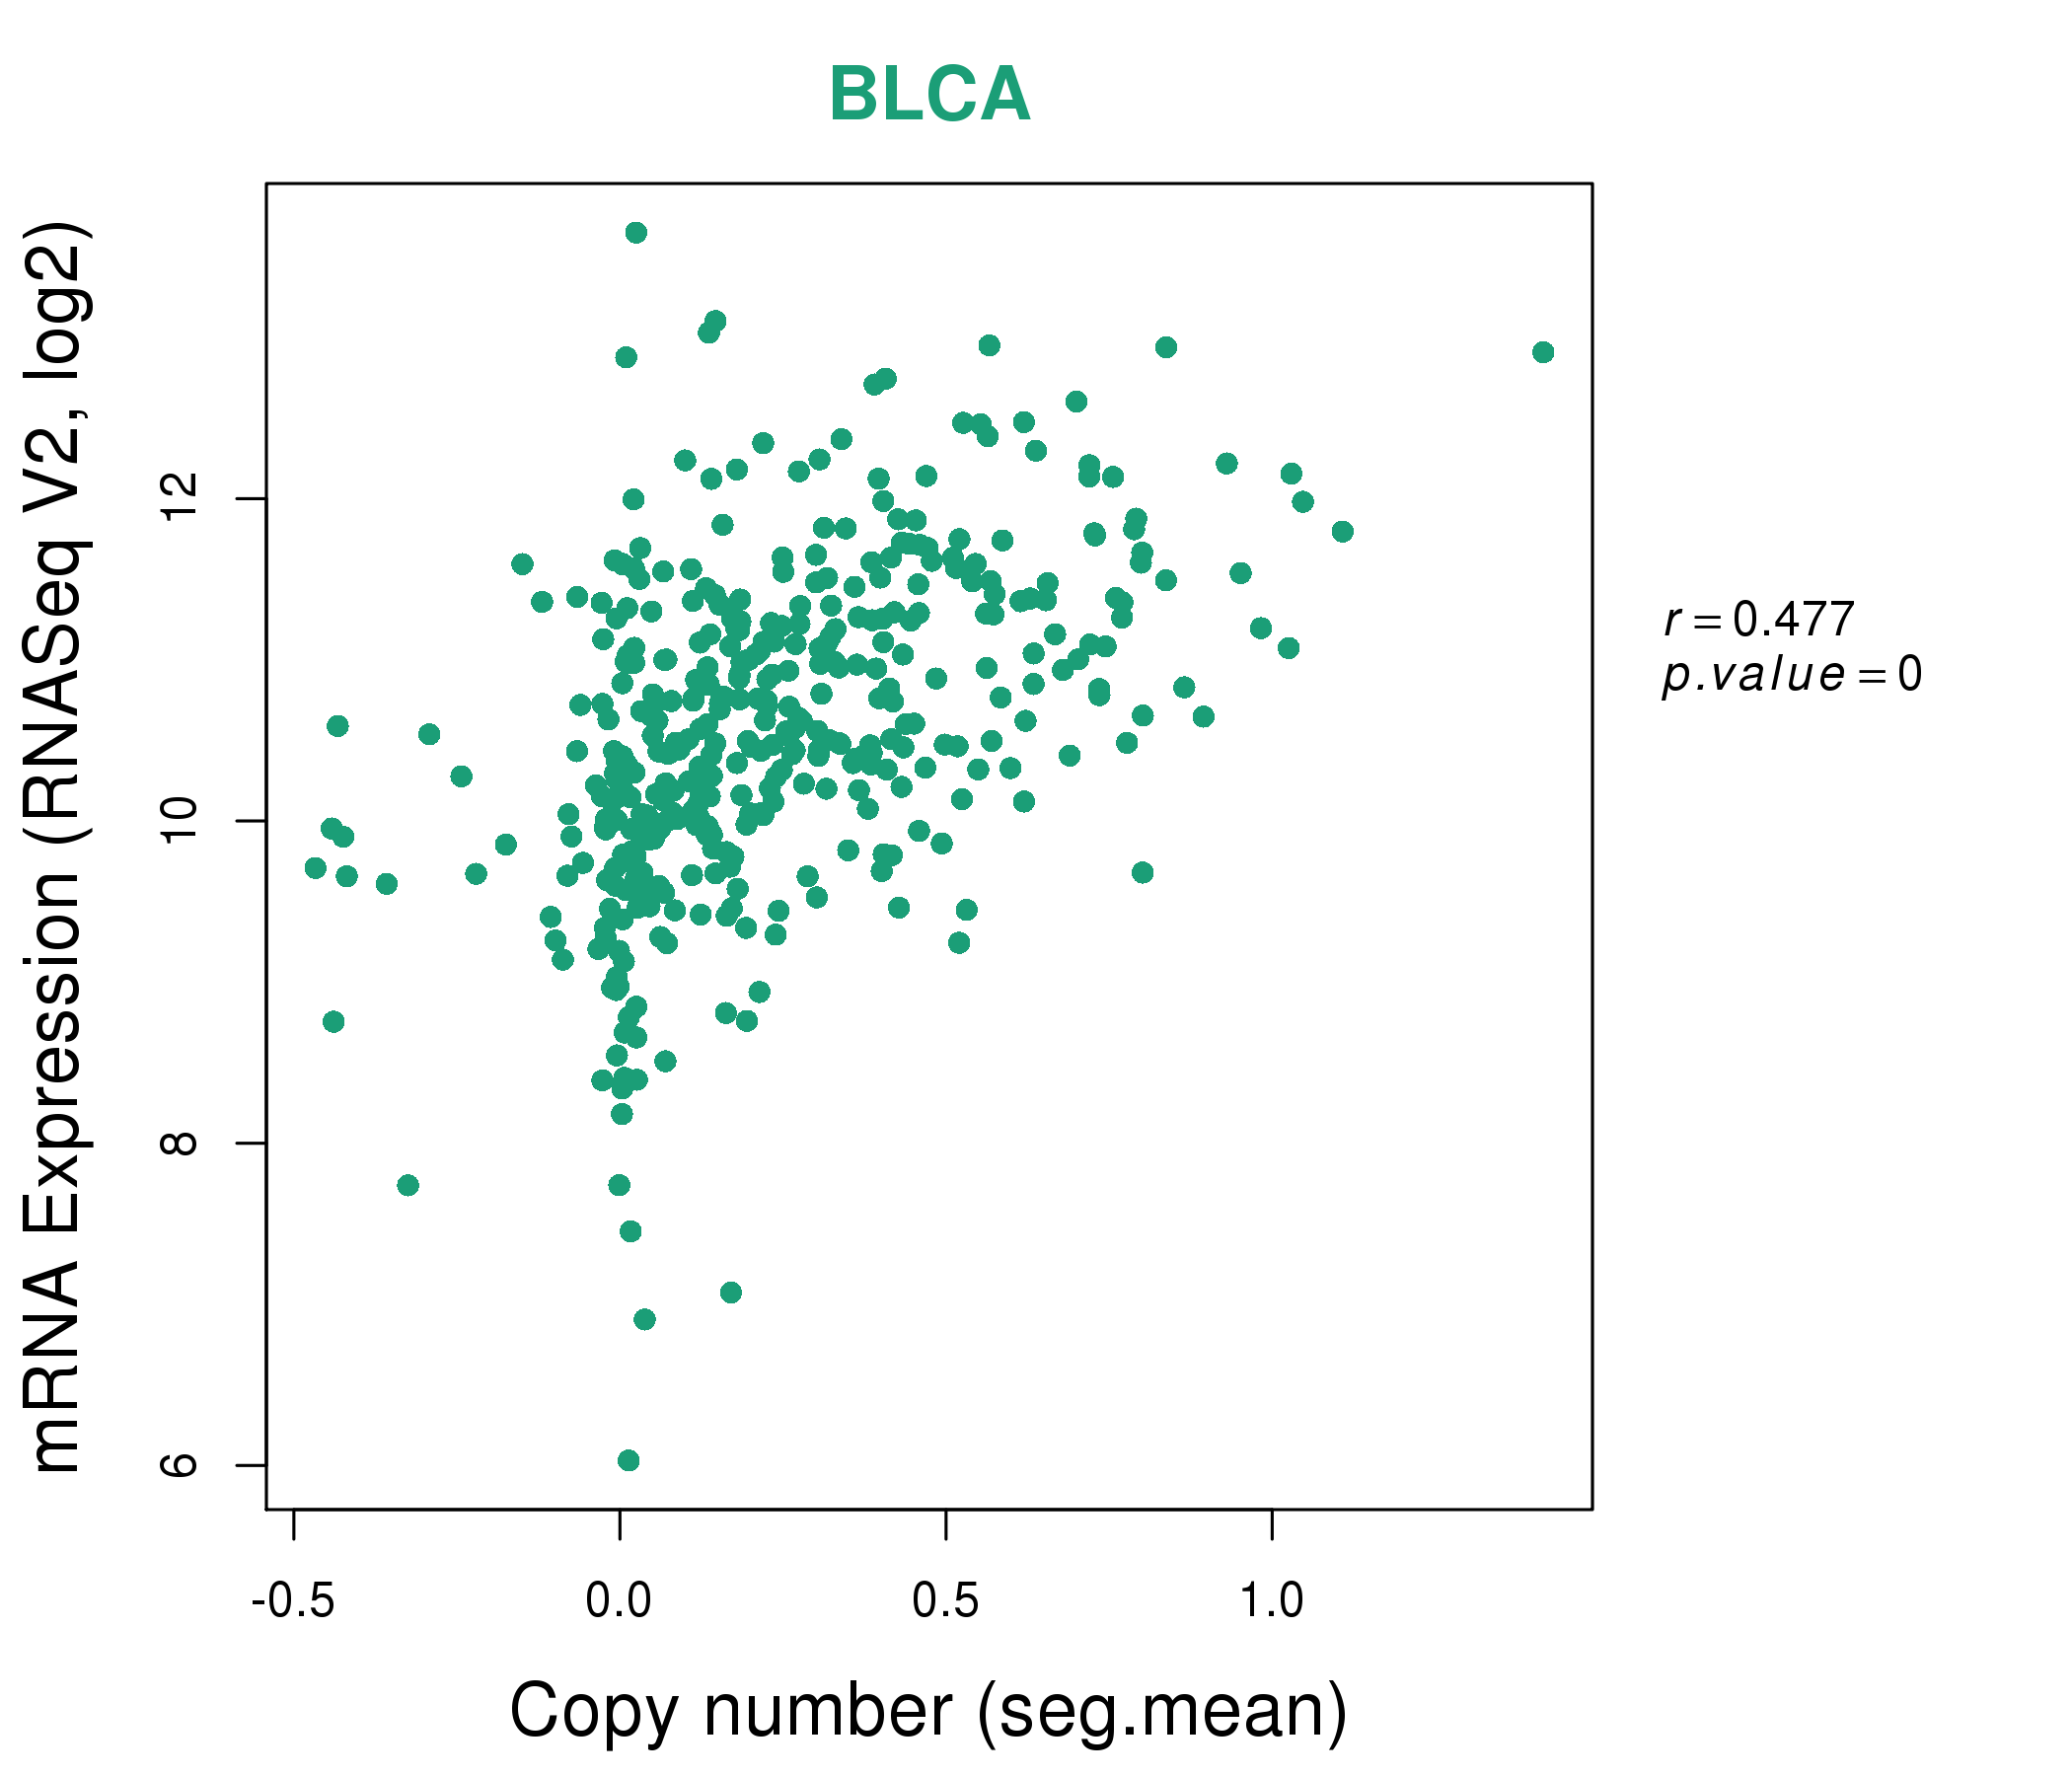
| * Normalized gene expression data of RNASeqV2 was extracted from TCGA using R package TCGA-Assembler. The URLs of all public data files on TCGA DCC data server were gathered at Jan-05-2015. Only eight cancer types have enough normal control samples for differential expression analysis. (t test, adjusted p<0.05 (using Benjamini-Hochberg FDR)) |
 |
| Top |
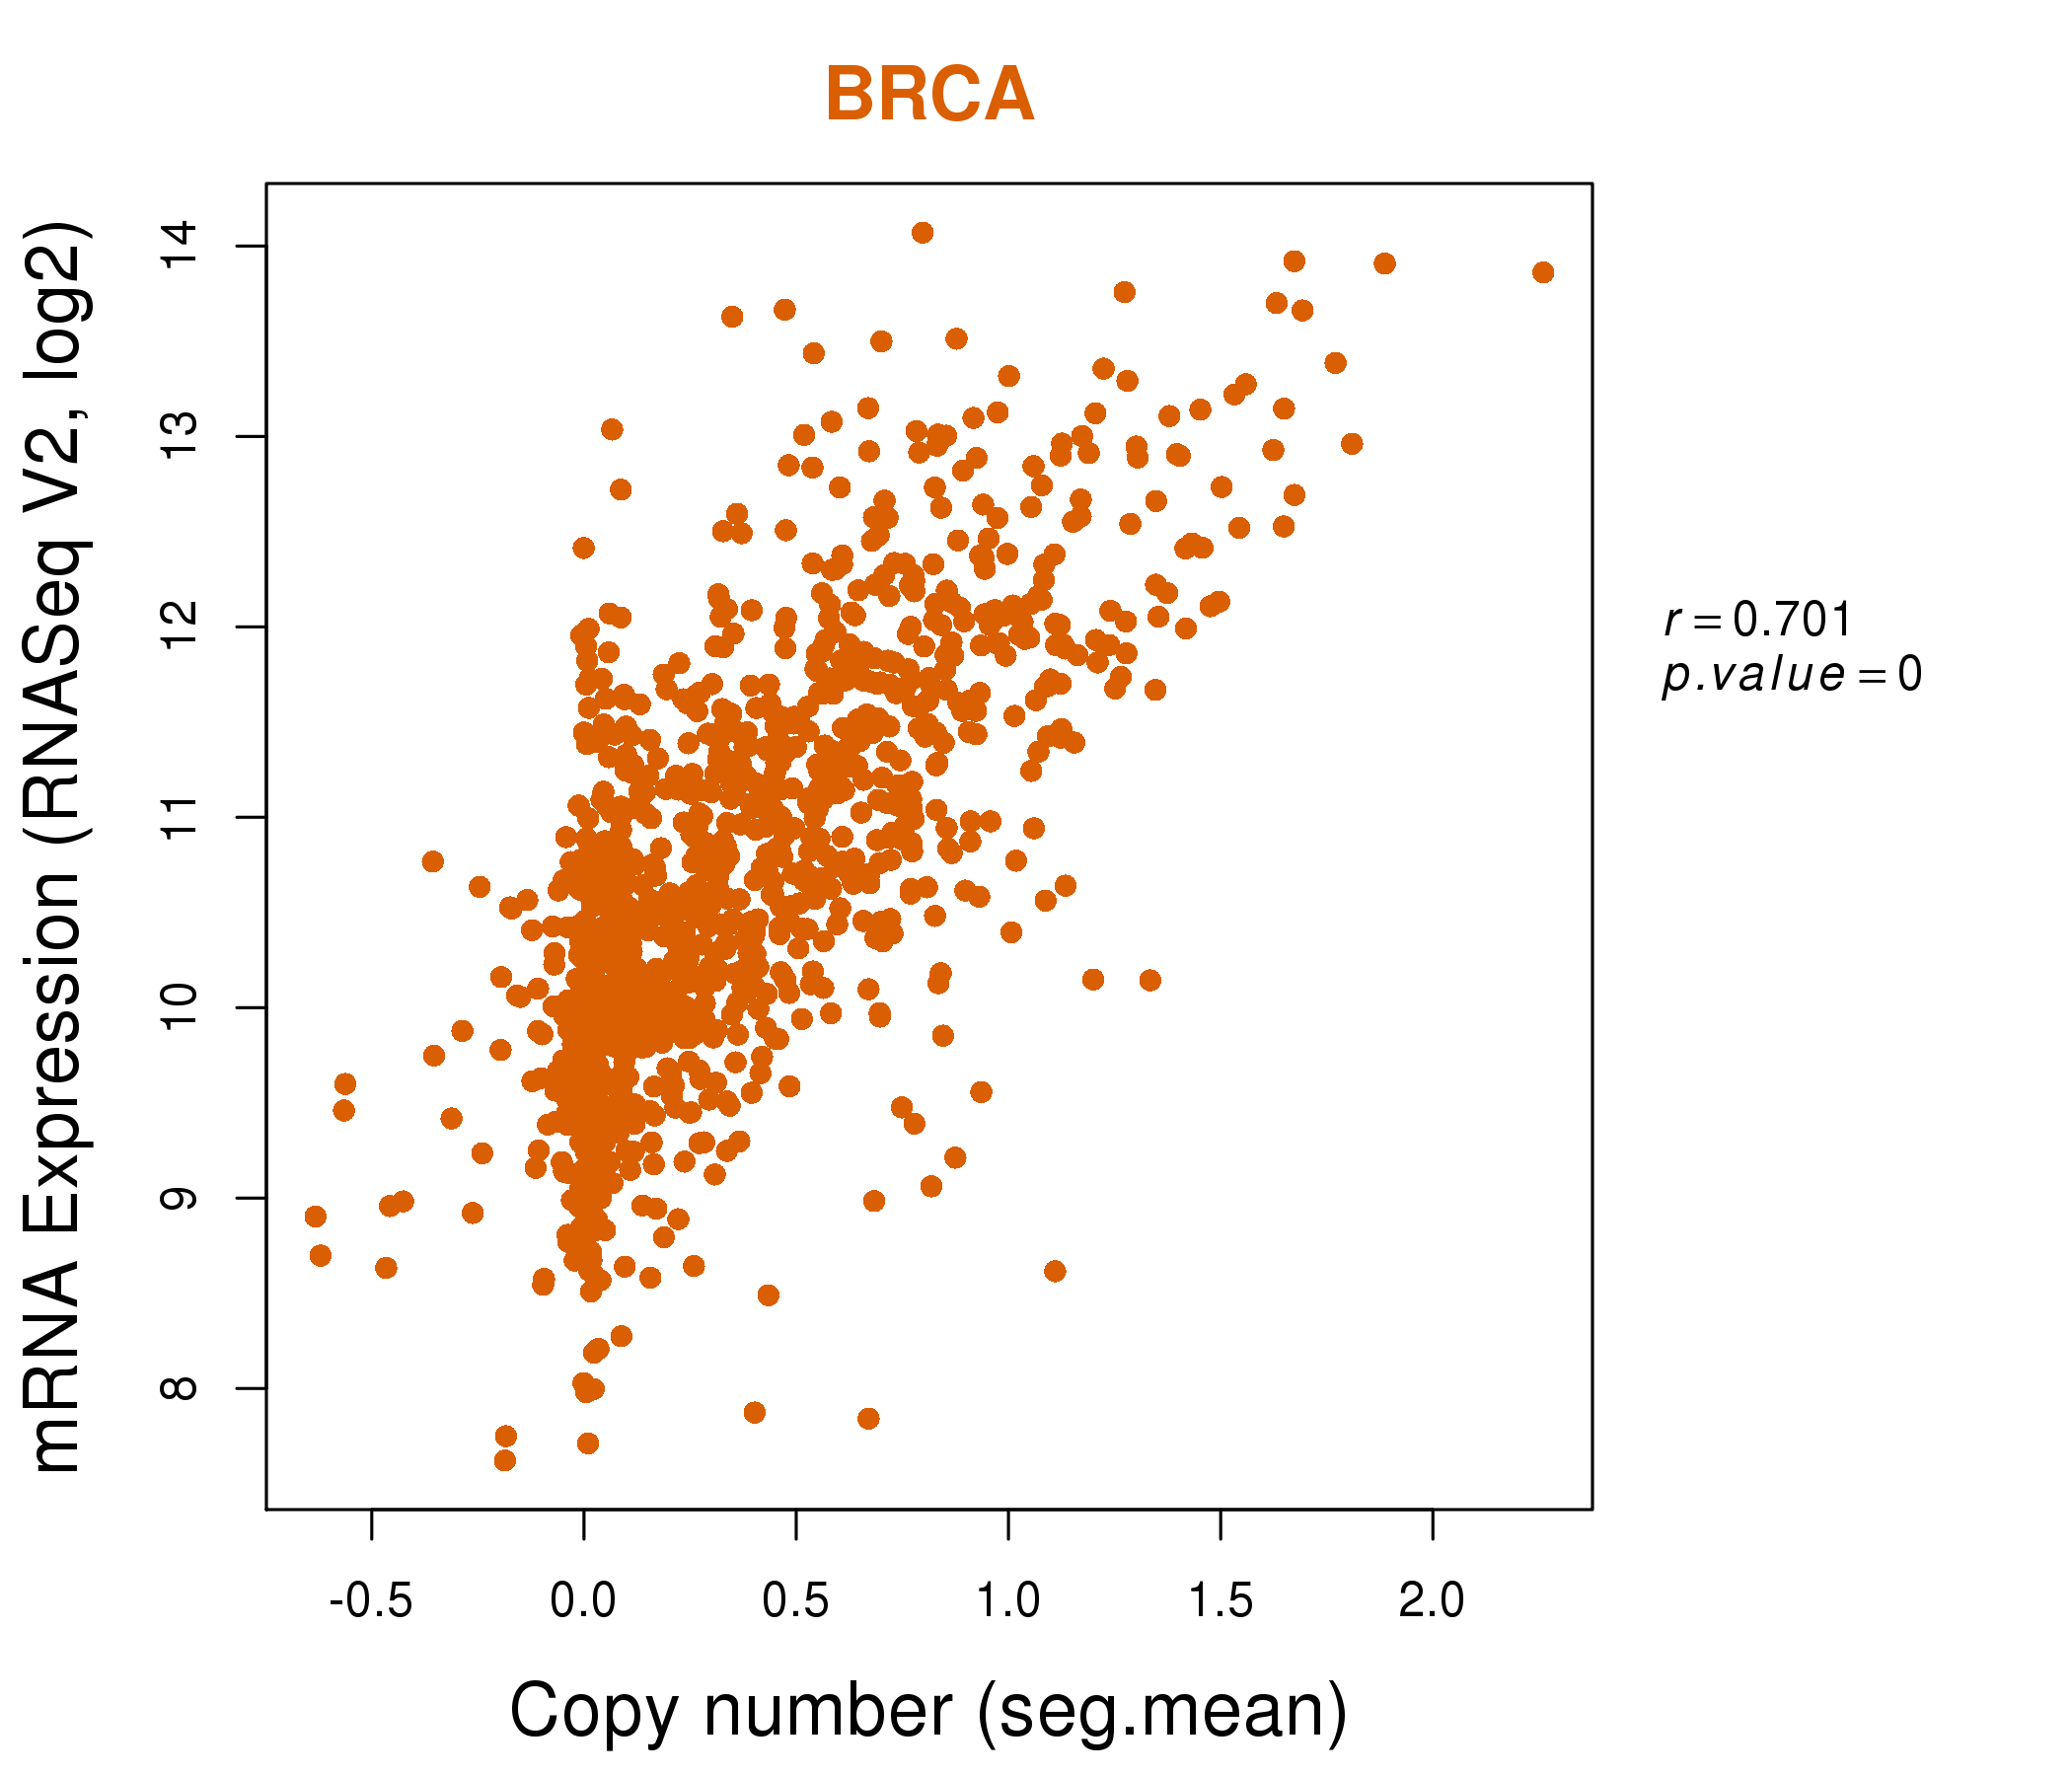
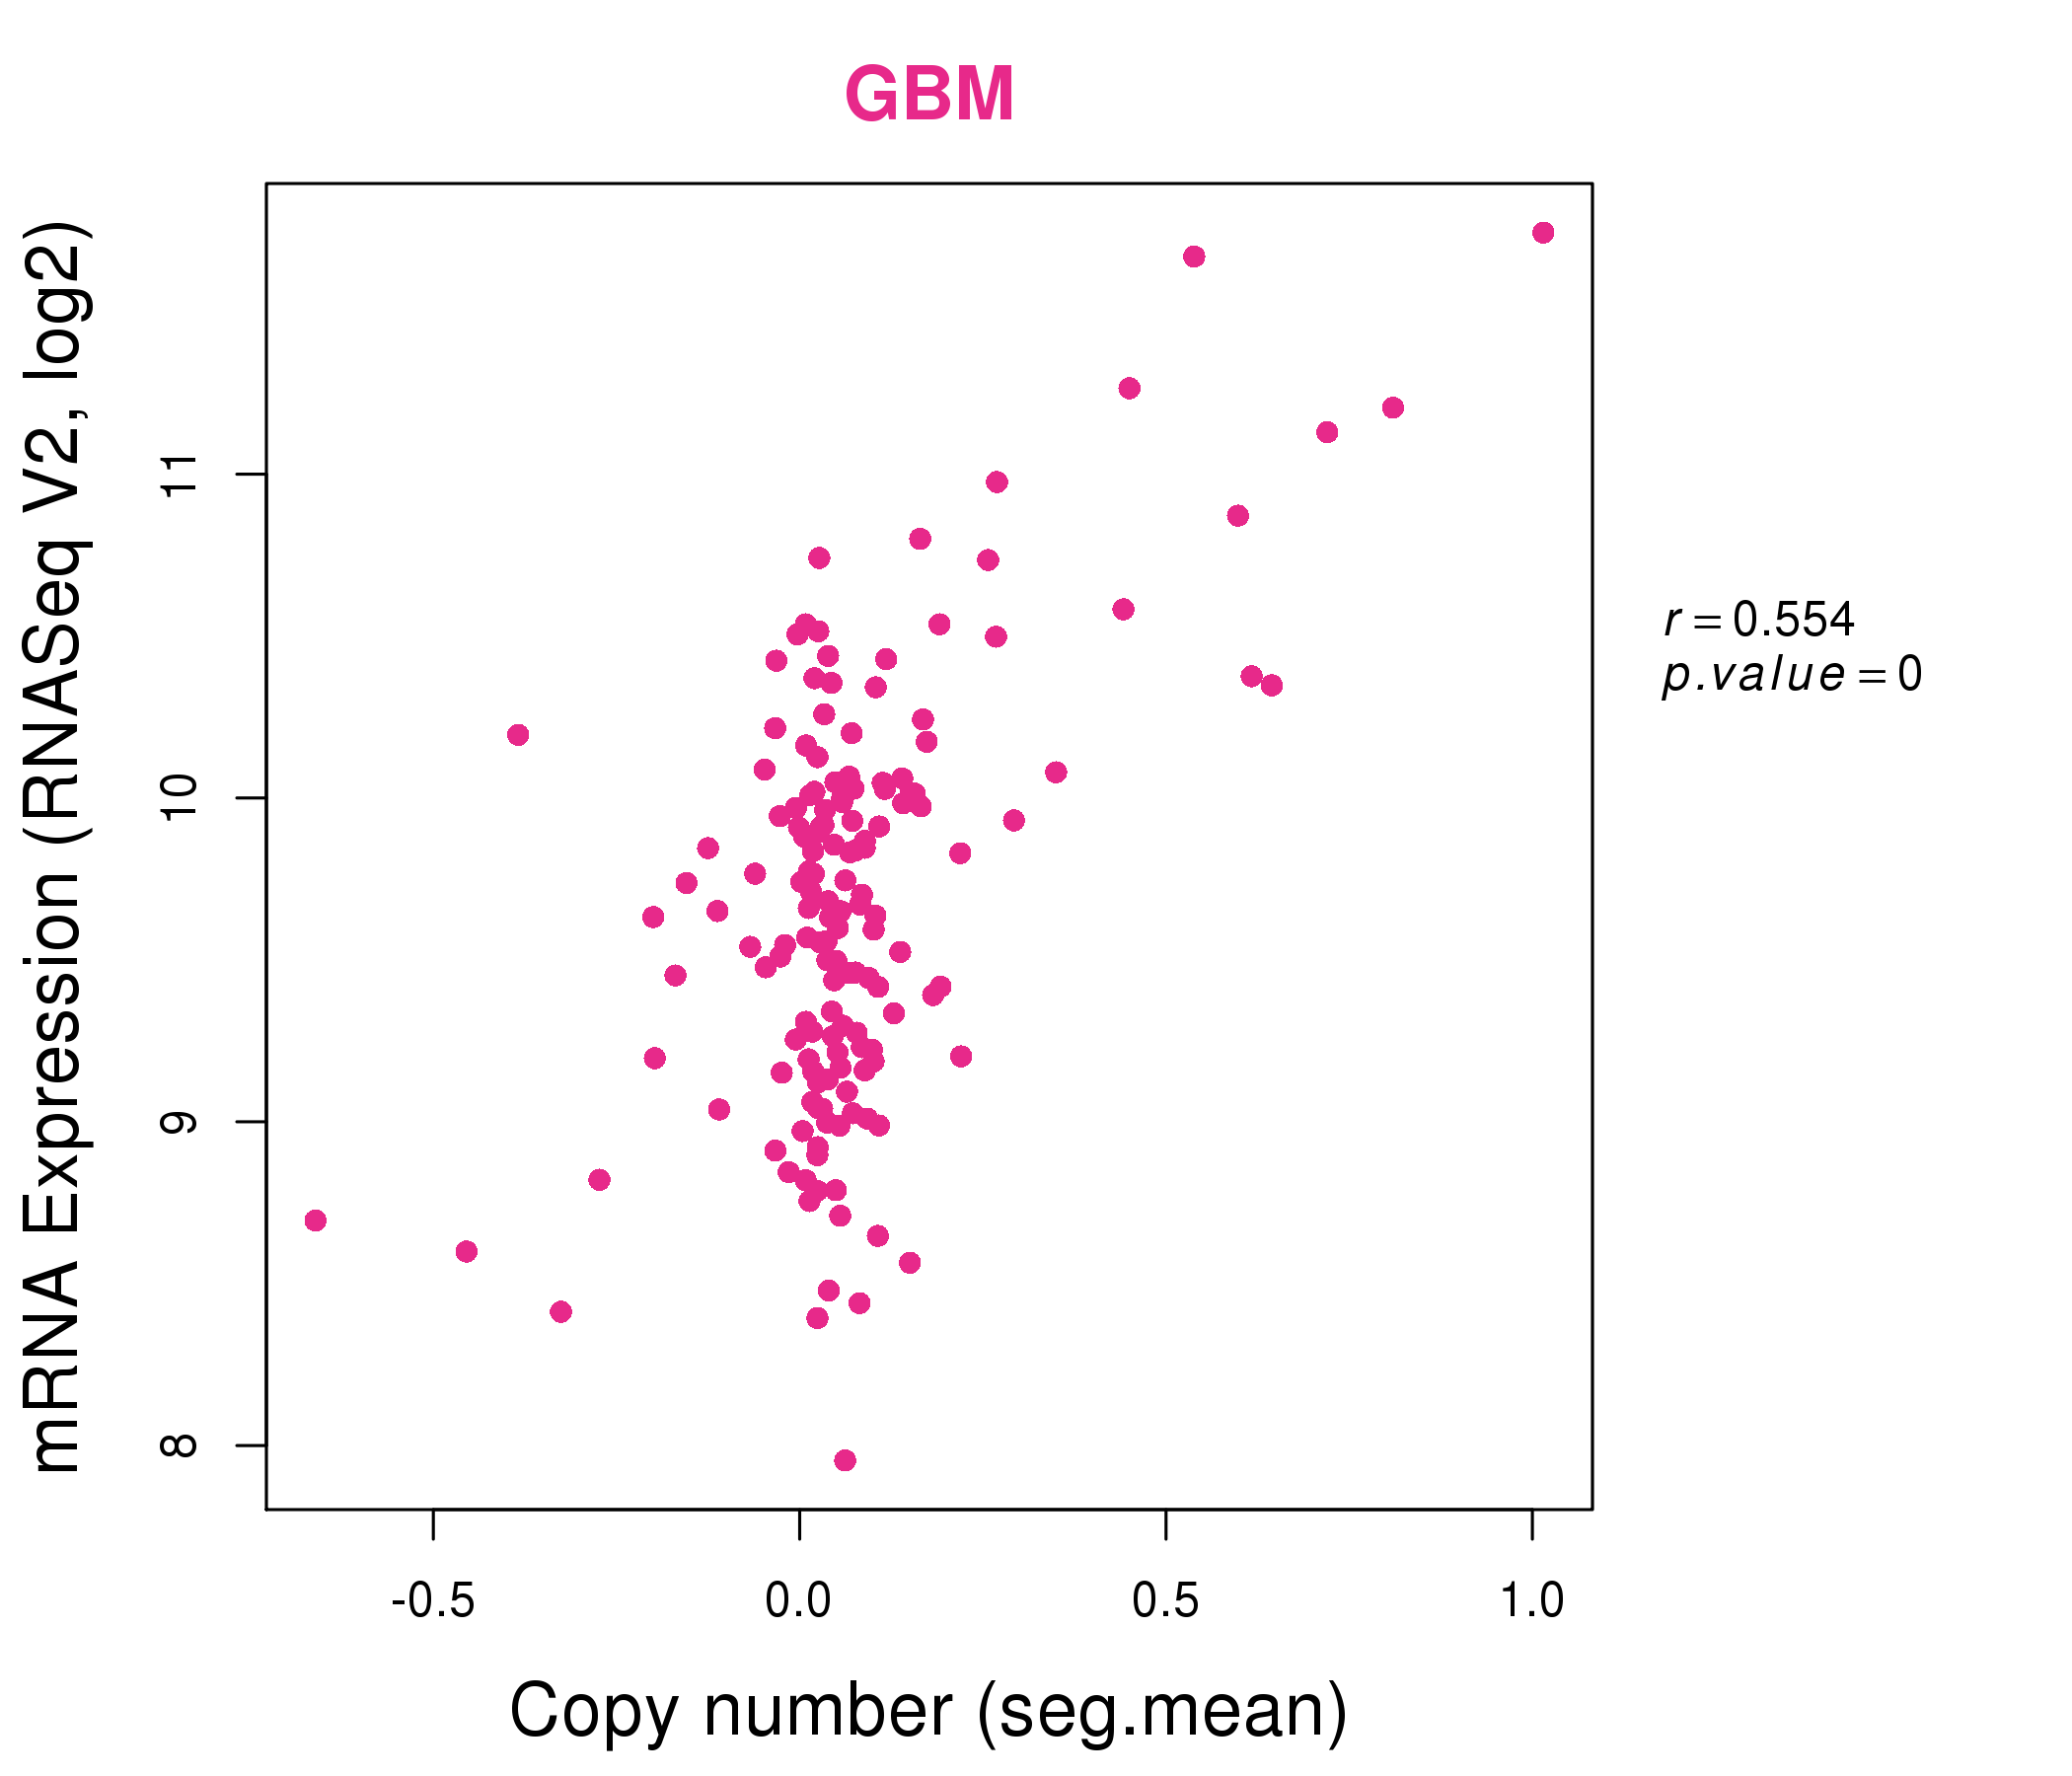
| * This plots show the correlation between CNV and gene expression. |
: Open all plots for all cancer types
 |
|
 |
|
| Top |
| Gene-Gene Network Information |
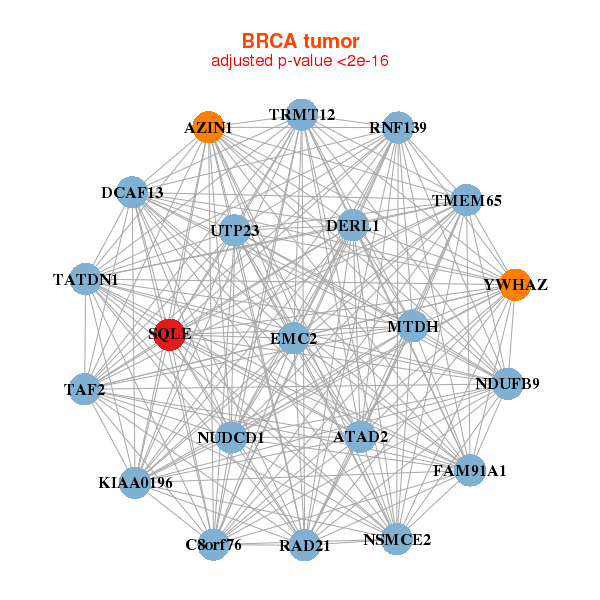
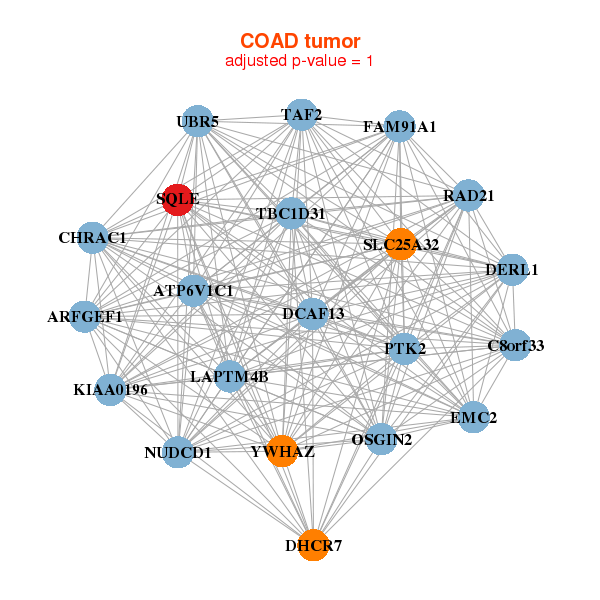
| * Co-Expression network figures were drawn using R package igraph. Only the top 20 genes with the highest correlations were shown. Red circle: input gene, orange circle: cell metabolism gene, sky circle: other gene |
: Open all plots for all cancer types
 |
|
| ATAD2,AZIN1,C8orf76,DCAF13,DERL1,FAM91A1,KIAA0196, MTDH,NDUFB9,NSMCE2,NUDCD1,RAD21,RNF139,SQLE, TAF2,TATDN1,TMEM65,TRMT12,EMC2,UTP23,YWHAZ | ABCA12,BRI3BP,RHPN1-AS1,CYP51A1,DHCR7,GGT1,HMGCR, HRASLS2,HSD17B7,CERS4,NSUN2,PIP4K2C,PPM1H,PTK6, PTPLAD1,QPRT,SLC50A1,RASGRF1,MSMO1,SEPHS2,SQLE |
 |
|
| ARFGEF1,ATP6V1C1,C8orf33,CHRAC1,DCAF13,DERL1,DHCR7, FAM91A1,KIAA0196,LAPTM4B,NUDCD1,OSGIN2,PTK2,RAD21, SLC25A32,SQLE,TAF2,EMC2,UBR5,TBC1D31,YWHAZ | ACSL3,C14orf1,C6orf223,CLOCK,CYP51A1,DHCR7,FDFT1, FDPS,FGFBP1,HMGCS1,IDI1,INSIG1,LSS,MVD, MVK,NSDHL,PCSK9,PDE11A,MSMO1,SC5D,SQLE |
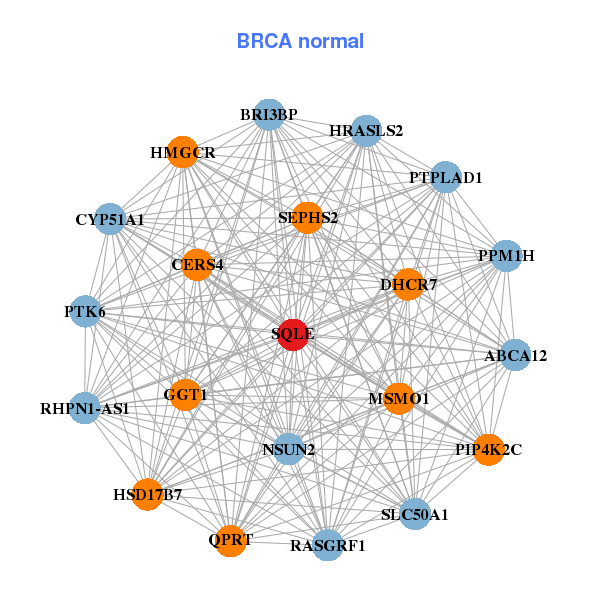
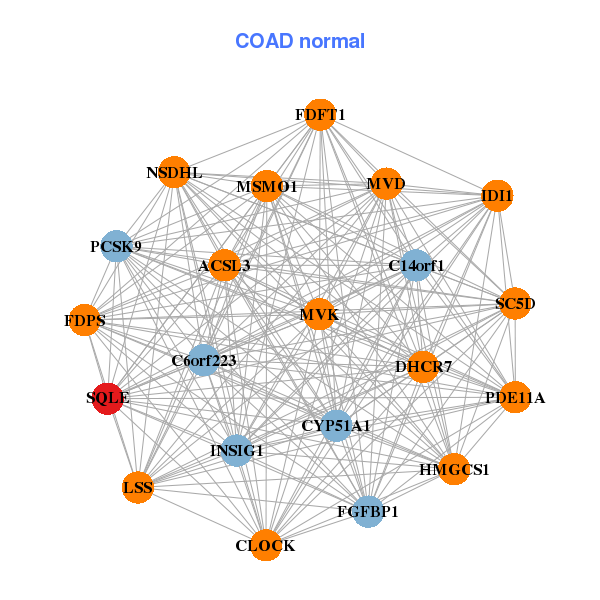
| * Co-Expression network figures were drawn using R package igraph. Only the top 20 genes with the highest correlations were shown. Red circle: input gene, orange circle: cell metabolism gene, sky circle: other gene |
: Open all plots for all cancer types
| Top |
: Open all interacting genes' information including KEGG pathway for all interacting genes from DAVID
| Top |
| Pharmacological Information for SQLE |
| There's no related Drug. |
| Top |
| Cross referenced IDs for SQLE |
| * We obtained these cross-references from Uniprot database. It covers 150 different DBs, 18 categories. http://www.uniprot.org/help/cross_references_section |
: Open all cross reference information
|
Copyright © 2016-Present - The Univsersity of Texas Health Science Center at Houston @ |