|
||||||||||||||||||||||||||||||||||||||||||||||||||||||||||||||||||||||||||||||||||||||||||||||||||||||||||||||||||||||||||||||||||||||||||||||||||||||||||||||||||||||||||||||||||||||||||||||||||||||||||||||||||||||||||||||||||||||||||||||||||||||||||||||||||||||||||||||||||||||||||||||||||||||||||||||||||||||||||
| |
| Phenotypic Information (metabolism pathway, cancer, disease, phenome) |
| |
| |
| Gene-Gene Network Information: Co-Expression Network, Interacting Genes & KEGG |
| |
|


| Gene Summary for SRP68 |
| Top |
| Phenotypic Information for SRP68(metabolism pathway, cancer, disease, phenome) |
| Cancer | CGAP: SRP68 |
| Familial Cancer Database: SRP68 | |
| * This gene is included in those cancer gene databases. |
|
|
|
|
|
| . | ||||||||||||||||||||||||||||||||||||||||||||||||||||||||||||||||||||||||||||||||||||||||||||||||||||||||||||||||||||||||||||||||||||||||||||||||||||||||||||||||||||||||||||||||||||||||||||||||||||||||||||||||||||||||||||||||||||||||||||||||||||||||||||||||||||||||||||||||||||||||||||||||||||||||||||||||||||
Oncogene 1 | Significant driver gene in | |||||||||||||||||||||||||||||||||||||||||||||||||||||||||||||||||||||||||||||||||||||||||||||||||||||||||||||||||||||||||||||||||||||||||||||||||||||||||||||||||||||||||||||||||||||||||||||||||||||||||||||||||||||||||||||||||||||||||||||||||||||||||||||||||||||||||||||||||||||||||||||||||||||||||||||||||||||||||
| cf) number; DB name 1 Oncogene; http://nar.oxfordjournals.org/content/35/suppl_1/D721.long, 2 Tumor Suppressor gene; https://bioinfo.uth.edu/TSGene/, 3 Cancer Gene Census; http://www.nature.com/nrc/journal/v4/n3/abs/nrc1299.html, 4 CancerGenes; http://nar.oxfordjournals.org/content/35/suppl_1/D721.long, 5 Network of Cancer Gene; http://ncg.kcl.ac.uk/index.php, 1Therapeutic Vulnerabilities in Cancer; http://cbio.mskcc.org/cancergenomics/statius/ |
| REACTOME_METABOLISM_OF_PROTEINS | |
| OMIM | |
| Orphanet | |
| Disease | KEGG Disease: SRP68 |
| MedGen: SRP68 (Human Medical Genetics with Condition) | |
| ClinVar: SRP68 | |
| Phenotype | MGI: SRP68 (International Mouse Phenotyping Consortium) |
| PhenomicDB: SRP68 | |
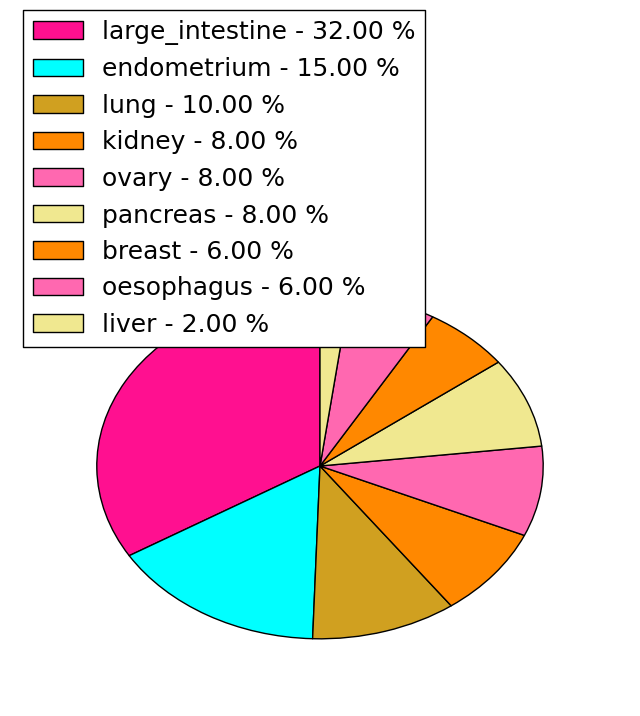
| Mutations for SRP68 |
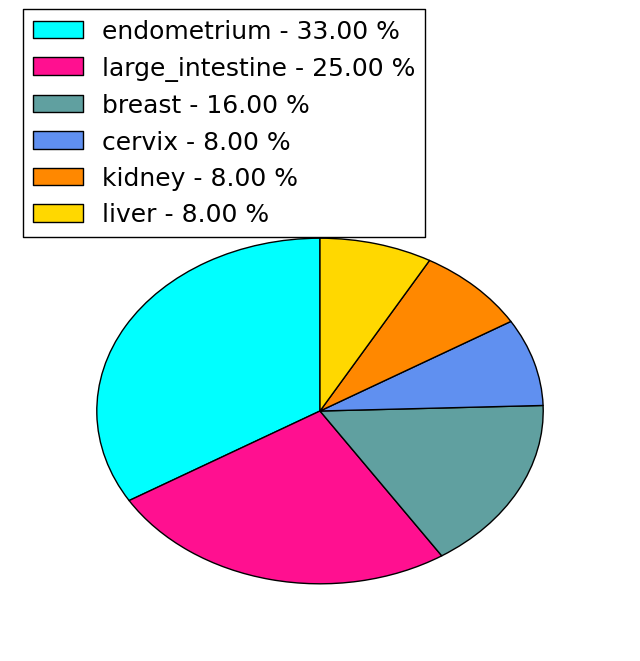
| * Under tables are showing count per each tissue to give us broad intuition about tissue specific mutation patterns.You can go to the detailed page for each mutation database's web site. |
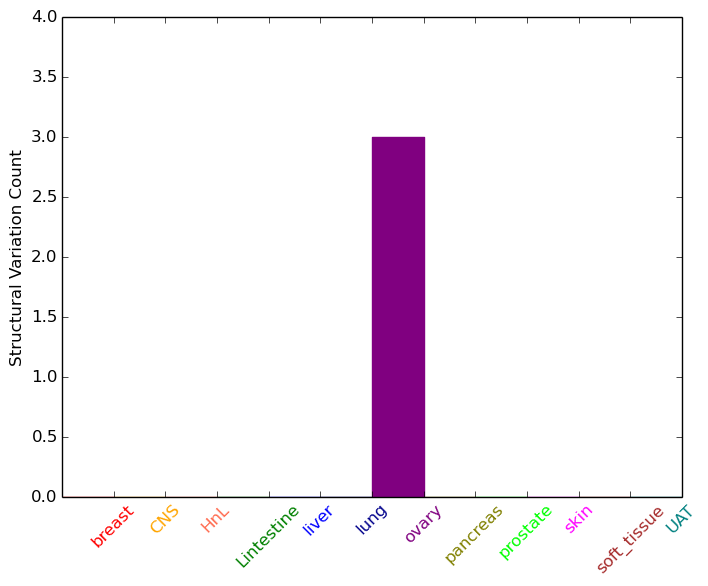
| - Statistics for Tissue and Mutation type | Top |
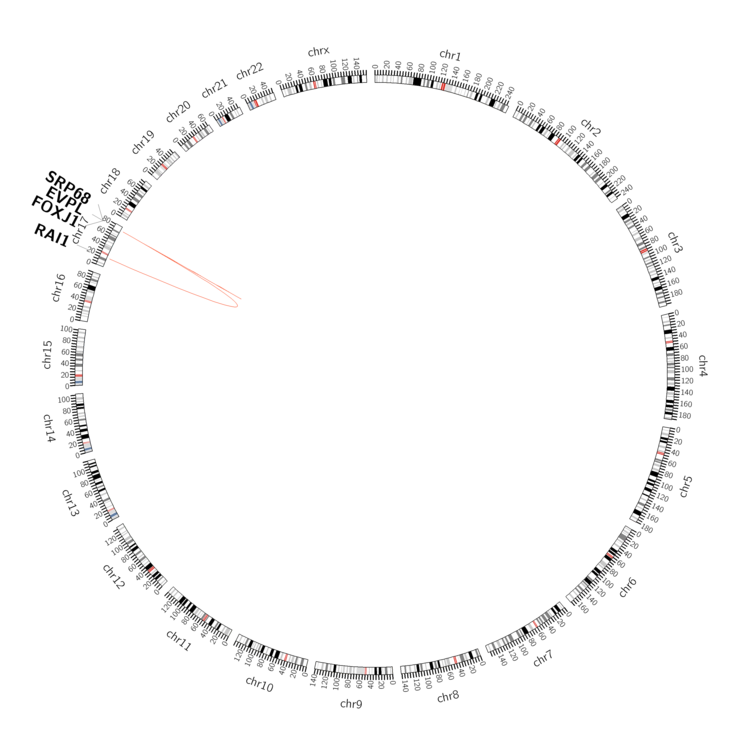 |
| - For Inter-chromosomal Variations |
| There's no inter-chromosomal structural variation. |
| - For Intra-chromosomal Variations |
| * Intra-chromosomal variantions includes 'intrachromosomal amplicon to amplicon', 'intrachromosomal amplicon to non-amplified dna', 'intrachromosomal deletion', 'intrachromosomal fold-back inversion', 'intrachromosomal inversion', 'intrachromosomal tandem duplication', 'Intrachromosomal unknown type', 'intrachromosomal with inverted orientation', 'intrachromosomal with non-inverted orientation'. |
 |
| Sample | Symbol_a | Chr_a | Start_a | End_a | Symbol_b | Chr_b | Start_b | End_b |
| ovary | SRP68 | chr17 | 74035215 | 74035235 | EVPL | chr17 | 74017611 | 74017631 |
| ovary | SRP68 | chr17 | 74045001 | 74045021 | FOXJ1 | chr17 | 74135584 | 74135604 |
| ovary | SRP68 | chr17 | 74061835 | 74061855 | RAI1 | chr17 | 17634783 | 17634803 |
| cf) Tissue number; Tissue name (1;Breast, 2;Central_nervous_system, 3;Haematopoietic_and_lymphoid_tissue, 4;Large_intestine, 5;Liver, 6;Lung, 7;Ovary, 8;Pancreas, 9;Prostate, 10;Skin, 11;Soft_tissue, 12;Upper_aerodigestive_tract) |
| * From mRNA Sanger sequences, Chitars2.0 arranged chimeric transcripts. This table shows SRP68 related fusion information. |
| ID | Head Gene | Tail Gene | Accession | Gene_a | qStart_a | qEnd_a | Chromosome_a | tStart_a | tEnd_a | Gene_a | qStart_a | qEnd_a | Chromosome_a | tStart_a | tEnd_a |
| CD365788 | DNAJA2 | 26 | 315 | 16 | 46989274 | 46989563 | SRP68 | 308 | 653 | 17 | 74044029 | 74056471 | |
| AA911044 | SRP68 | 1 | 99 | 17 | 74035187 | 74035285 | PARP1 | 95 | 325 | 1 | 226578231 | 226595529 | |
| BG119358 | SRP68 | 5 | 82 | 17 | 74035571 | 74035648 | SRP68 | 80 | 490 | 17 | 74035186 | 74035596 | |
| BG005598 | SRP68 | 114 | 332 | 17 | 74063344 | 74068473 | NEAT1 | 328 | 435 | 11 | 65190541 | 65190648 | |
| DA276739 | FAM178B | 1 | 323 | 2 | 97634769 | 97635091 | SRP68 | 324 | 575 | 17 | 74060182 | 74066525 | |
| Top |
| Mutation type/ Tissue ID | brca | cns | cerv | endome | haematopo | kidn | Lintest | liver | lung | ns | ovary | pancre | prost | skin | stoma | thyro | urina | |||
| Total # sample | 1 | 1 | 1 | |||||||||||||||||
| GAIN (# sample) | 1 | 1 | 1 | |||||||||||||||||
| LOSS (# sample) |
| cf) Tissue ID; Tissue type (1; Breast, 2; Central_nervous_system, 3; Cervix, 4; Endometrium, 5; Haematopoietic_and_lymphoid_tissue, 6; Kidney, 7; Large_intestine, 8; Liver, 9; Lung, 10; NS, 11; Ovary, 12; Pancreas, 13; Prostate, 14; Skin, 15; Stomach, 16; Thyroid, 17; Urinary_tract) |
| Top |
|
 |
| Top |
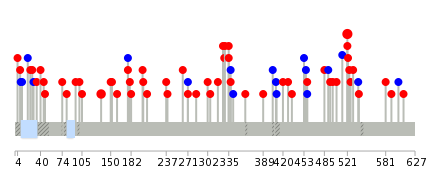
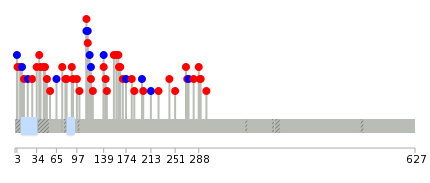
| Stat. for Non-Synonymous SNVs (# total SNVs=46) | (# total SNVs=12) |
 |  |
(# total SNVs=0) | (# total SNVs=0) |
| Top |
| * When you move the cursor on each content, you can see more deailed mutation information on the Tooltip. Those are primary_site,primary_histology,mutation(aa),pubmedID. |
| GRCh37 position | Mutation(aa) | Unique sampleID count |
| chr17:74037022-74037022 | p.R521Q | 3 |
| chr17:74046604-74046604 | p.E328K | 2 |
| chr17:74060213-74060213 | p.W135C | 2 |
| chr17:74057619-74057619 | p.E200* | 2 |
| chr17:74037023-74037023 | p.R521W | 1 |
| chr17:74053545-74053545 | p.K306R | 1 |
| chr17:74068540-74068540 | p.G11G | 1 |
| chr17:74041466-74041466 | p.N434S | 1 |
| chr17:74060074-74060074 | p.T182A | 1 |
| chr17:74035901-74035901 | p.F590L | 1 |
| Top |
|
 |
| Point Mutation/ Tissue ID | 1 | 2 | 3 | 4 | 5 | 6 | 7 | 8 | 9 | 10 | 11 | 12 | 13 | 14 | 15 | 16 | 17 | 18 | 19 | 20 |
| # sample | 6 | 3 | 1 | 12 | 1 | 5 | 3 | 1 | 3 | 5 | 4 | 9 | ||||||||
| # mutation | 7 | 3 | 1 | 12 | 1 | 5 | 3 | 1 | 3 | 5 | 4 | 10 | ||||||||
| nonsynonymous SNV | 6 | 2 | 10 | 1 | 4 | 1 | 1 | 3 | 5 | 2 | 7 | |||||||||
| synonymous SNV | 1 | 1 | 1 | 2 | 1 | 2 | 2 | 3 |
| cf) Tissue ID; Tissue type (1; BLCA[Bladder Urothelial Carcinoma], 2; BRCA[Breast invasive carcinoma], 3; CESC[Cervical squamous cell carcinoma and endocervical adenocarcinoma], 4; COAD[Colon adenocarcinoma], 5; GBM[Glioblastoma multiforme], 6; Glioma Low Grade, 7; HNSC[Head and Neck squamous cell carcinoma], 8; KICH[Kidney Chromophobe], 9; KIRC[Kidney renal clear cell carcinoma], 10; KIRP[Kidney renal papillary cell carcinoma], 11; LAML[Acute Myeloid Leukemia], 12; LUAD[Lung adenocarcinoma], 13; LUSC[Lung squamous cell carcinoma], 14; OV[Ovarian serous cystadenocarcinoma ], 15; PAAD[Pancreatic adenocarcinoma], 16; PRAD[Prostate adenocarcinoma], 17; SKCM[Skin Cutaneous Melanoma], 18:STAD[Stomach adenocarcinoma], 19:THCA[Thyroid carcinoma], 20:UCEC[Uterine Corpus Endometrial Carcinoma]) |
| Top |
| * We represented just top 10 SNVs. When you move the cursor on each content, you can see more deailed mutation information on the Tooltip. Those are primary_site, primary_histology, mutation(aa), pubmedID. |
| Genomic Position | Mutation(aa) | Unique sampleID count |
| chr17:74041394 | p.Q270H,SRP68 | 1 |
| chr17:74066468 | p.S50P,SRP68 | 1 |
| chr17:74046604 | p.T144A,SRP68 | 1 |
| chr17:74068551 | p.S45L,SRP68 | 1 |
| chr17:74035901 | p.F251L,SRP68 | 1 |
| chr17:74060080 | p.Q38K,SRP68 | 1 |
| chr17:74041399 | p.A142S,SRP68 | 1 |
| chr17:74066475 | p.E40G,SRP68 | 1 |
| chr17:74053486 | p.F242V,SRP68 | 1 |
| chr17:74068563 | p.E14G,SRP68 | 1 |
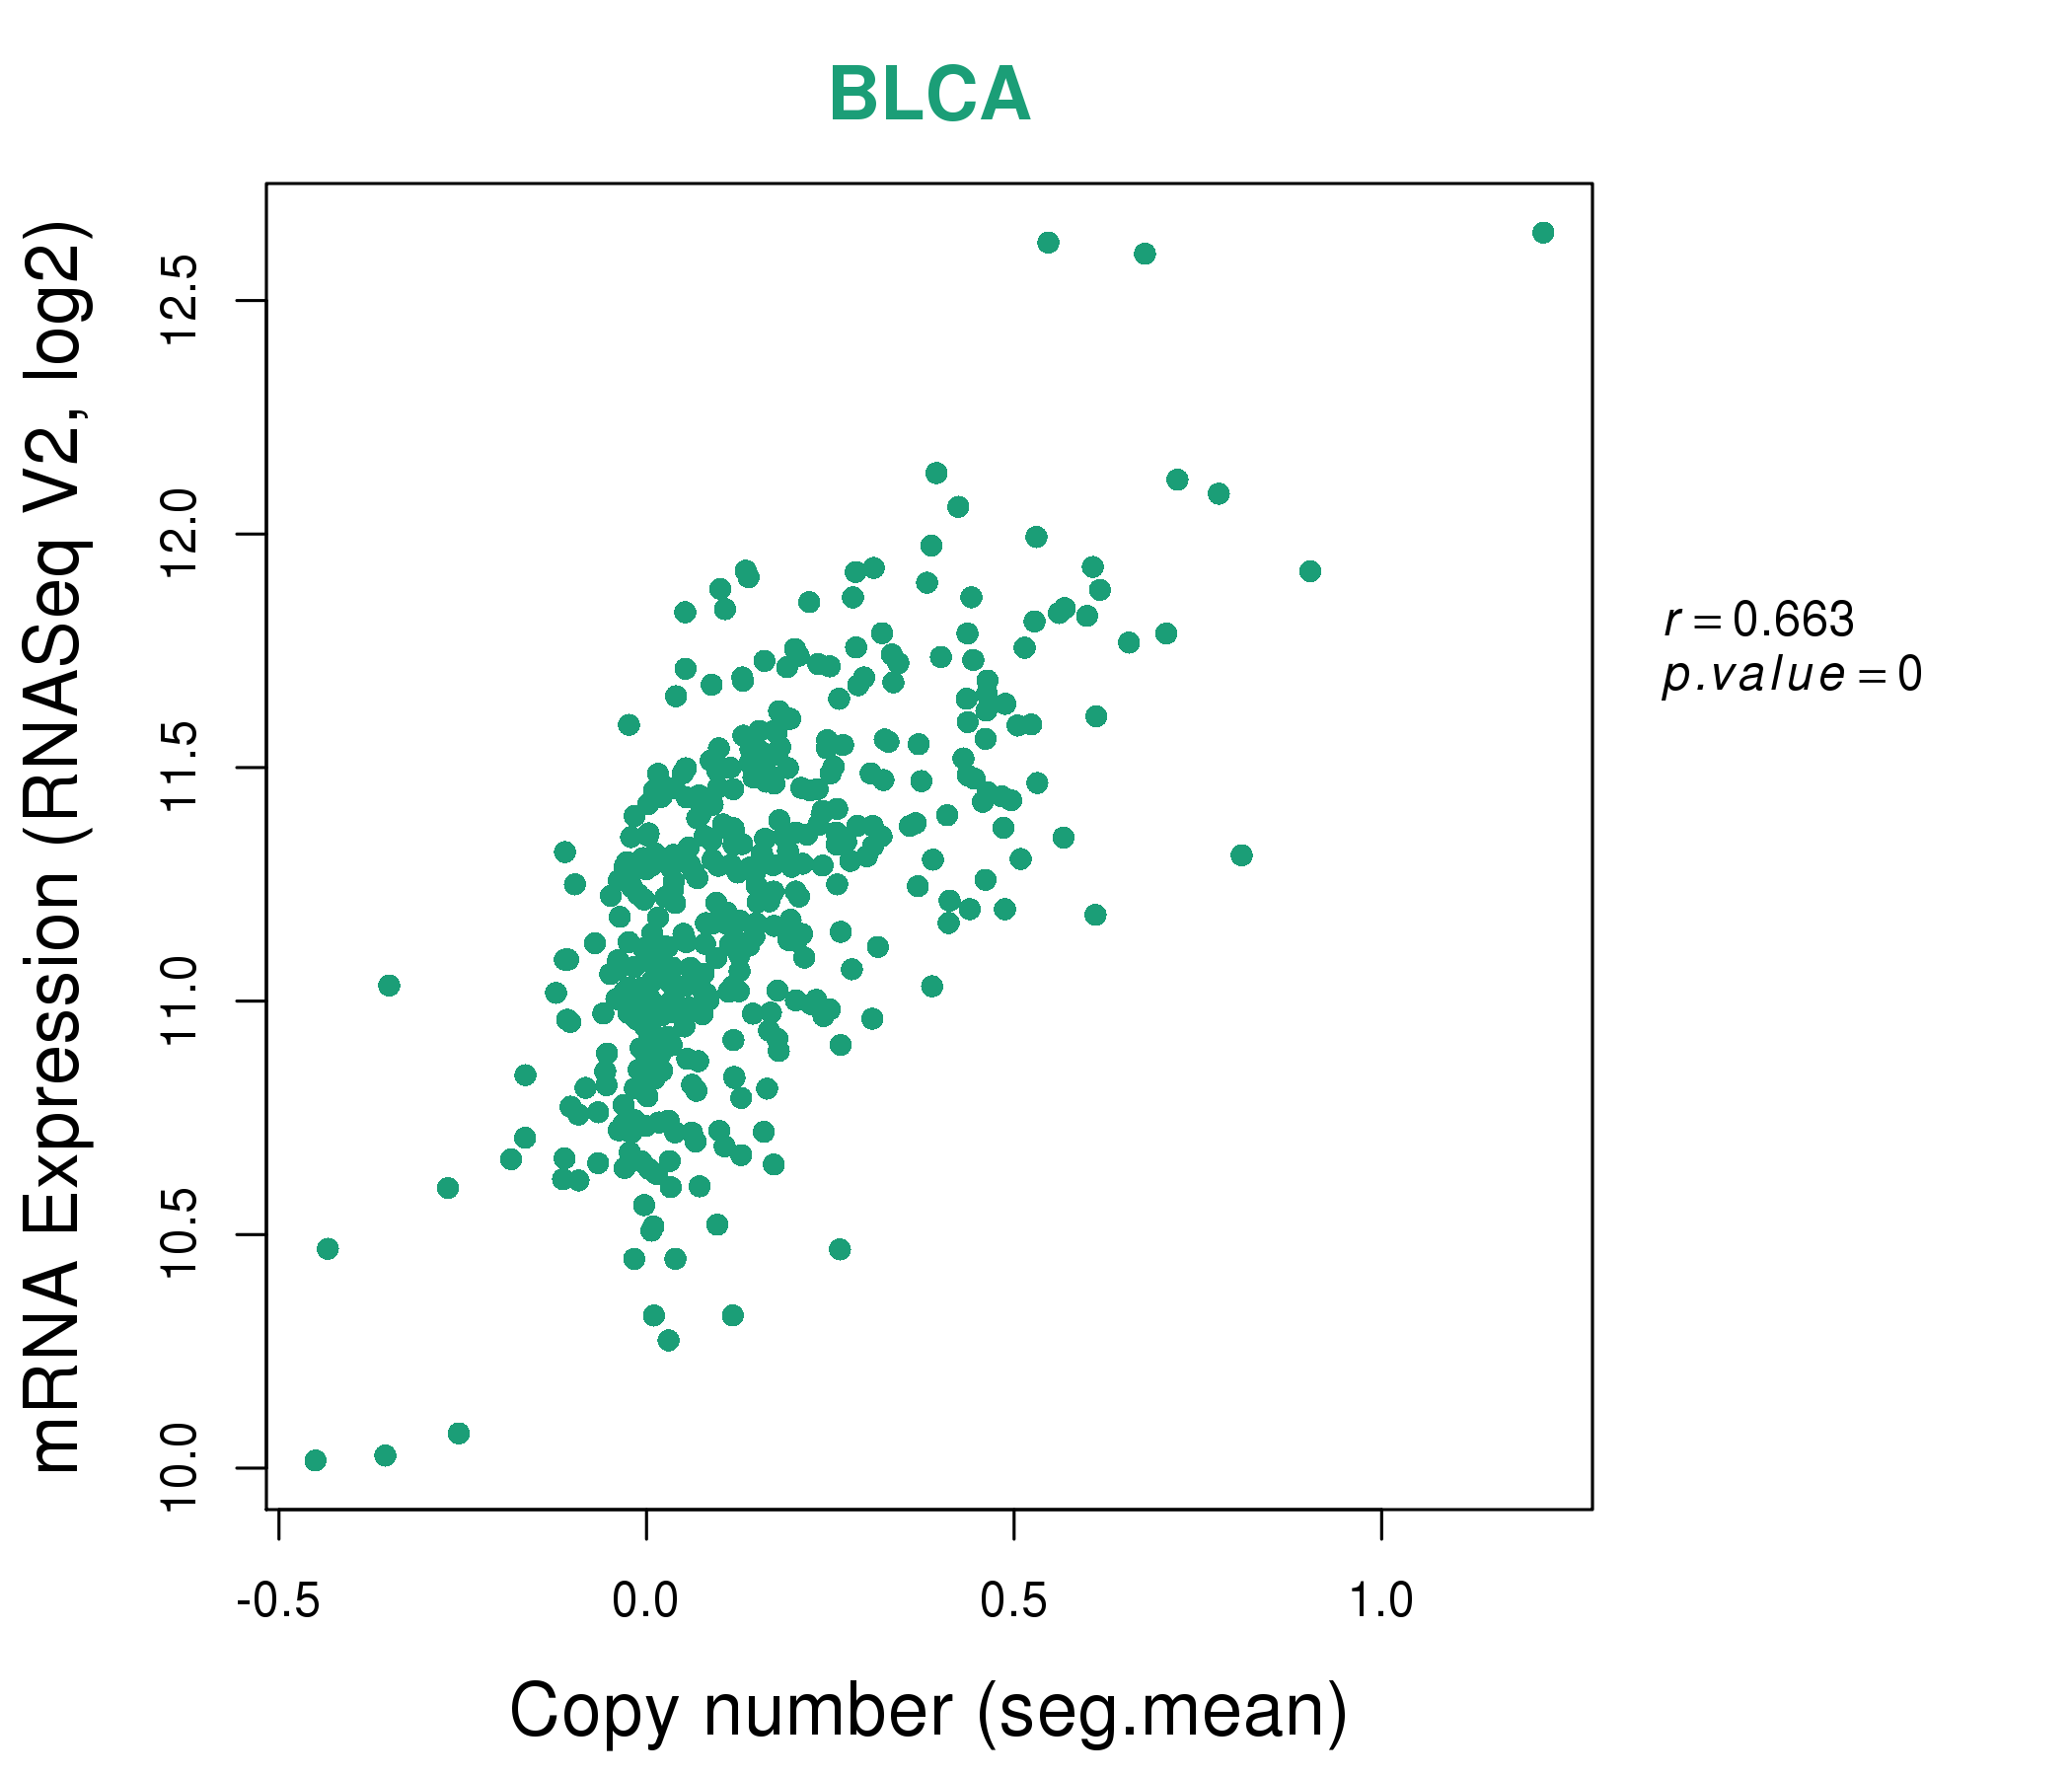
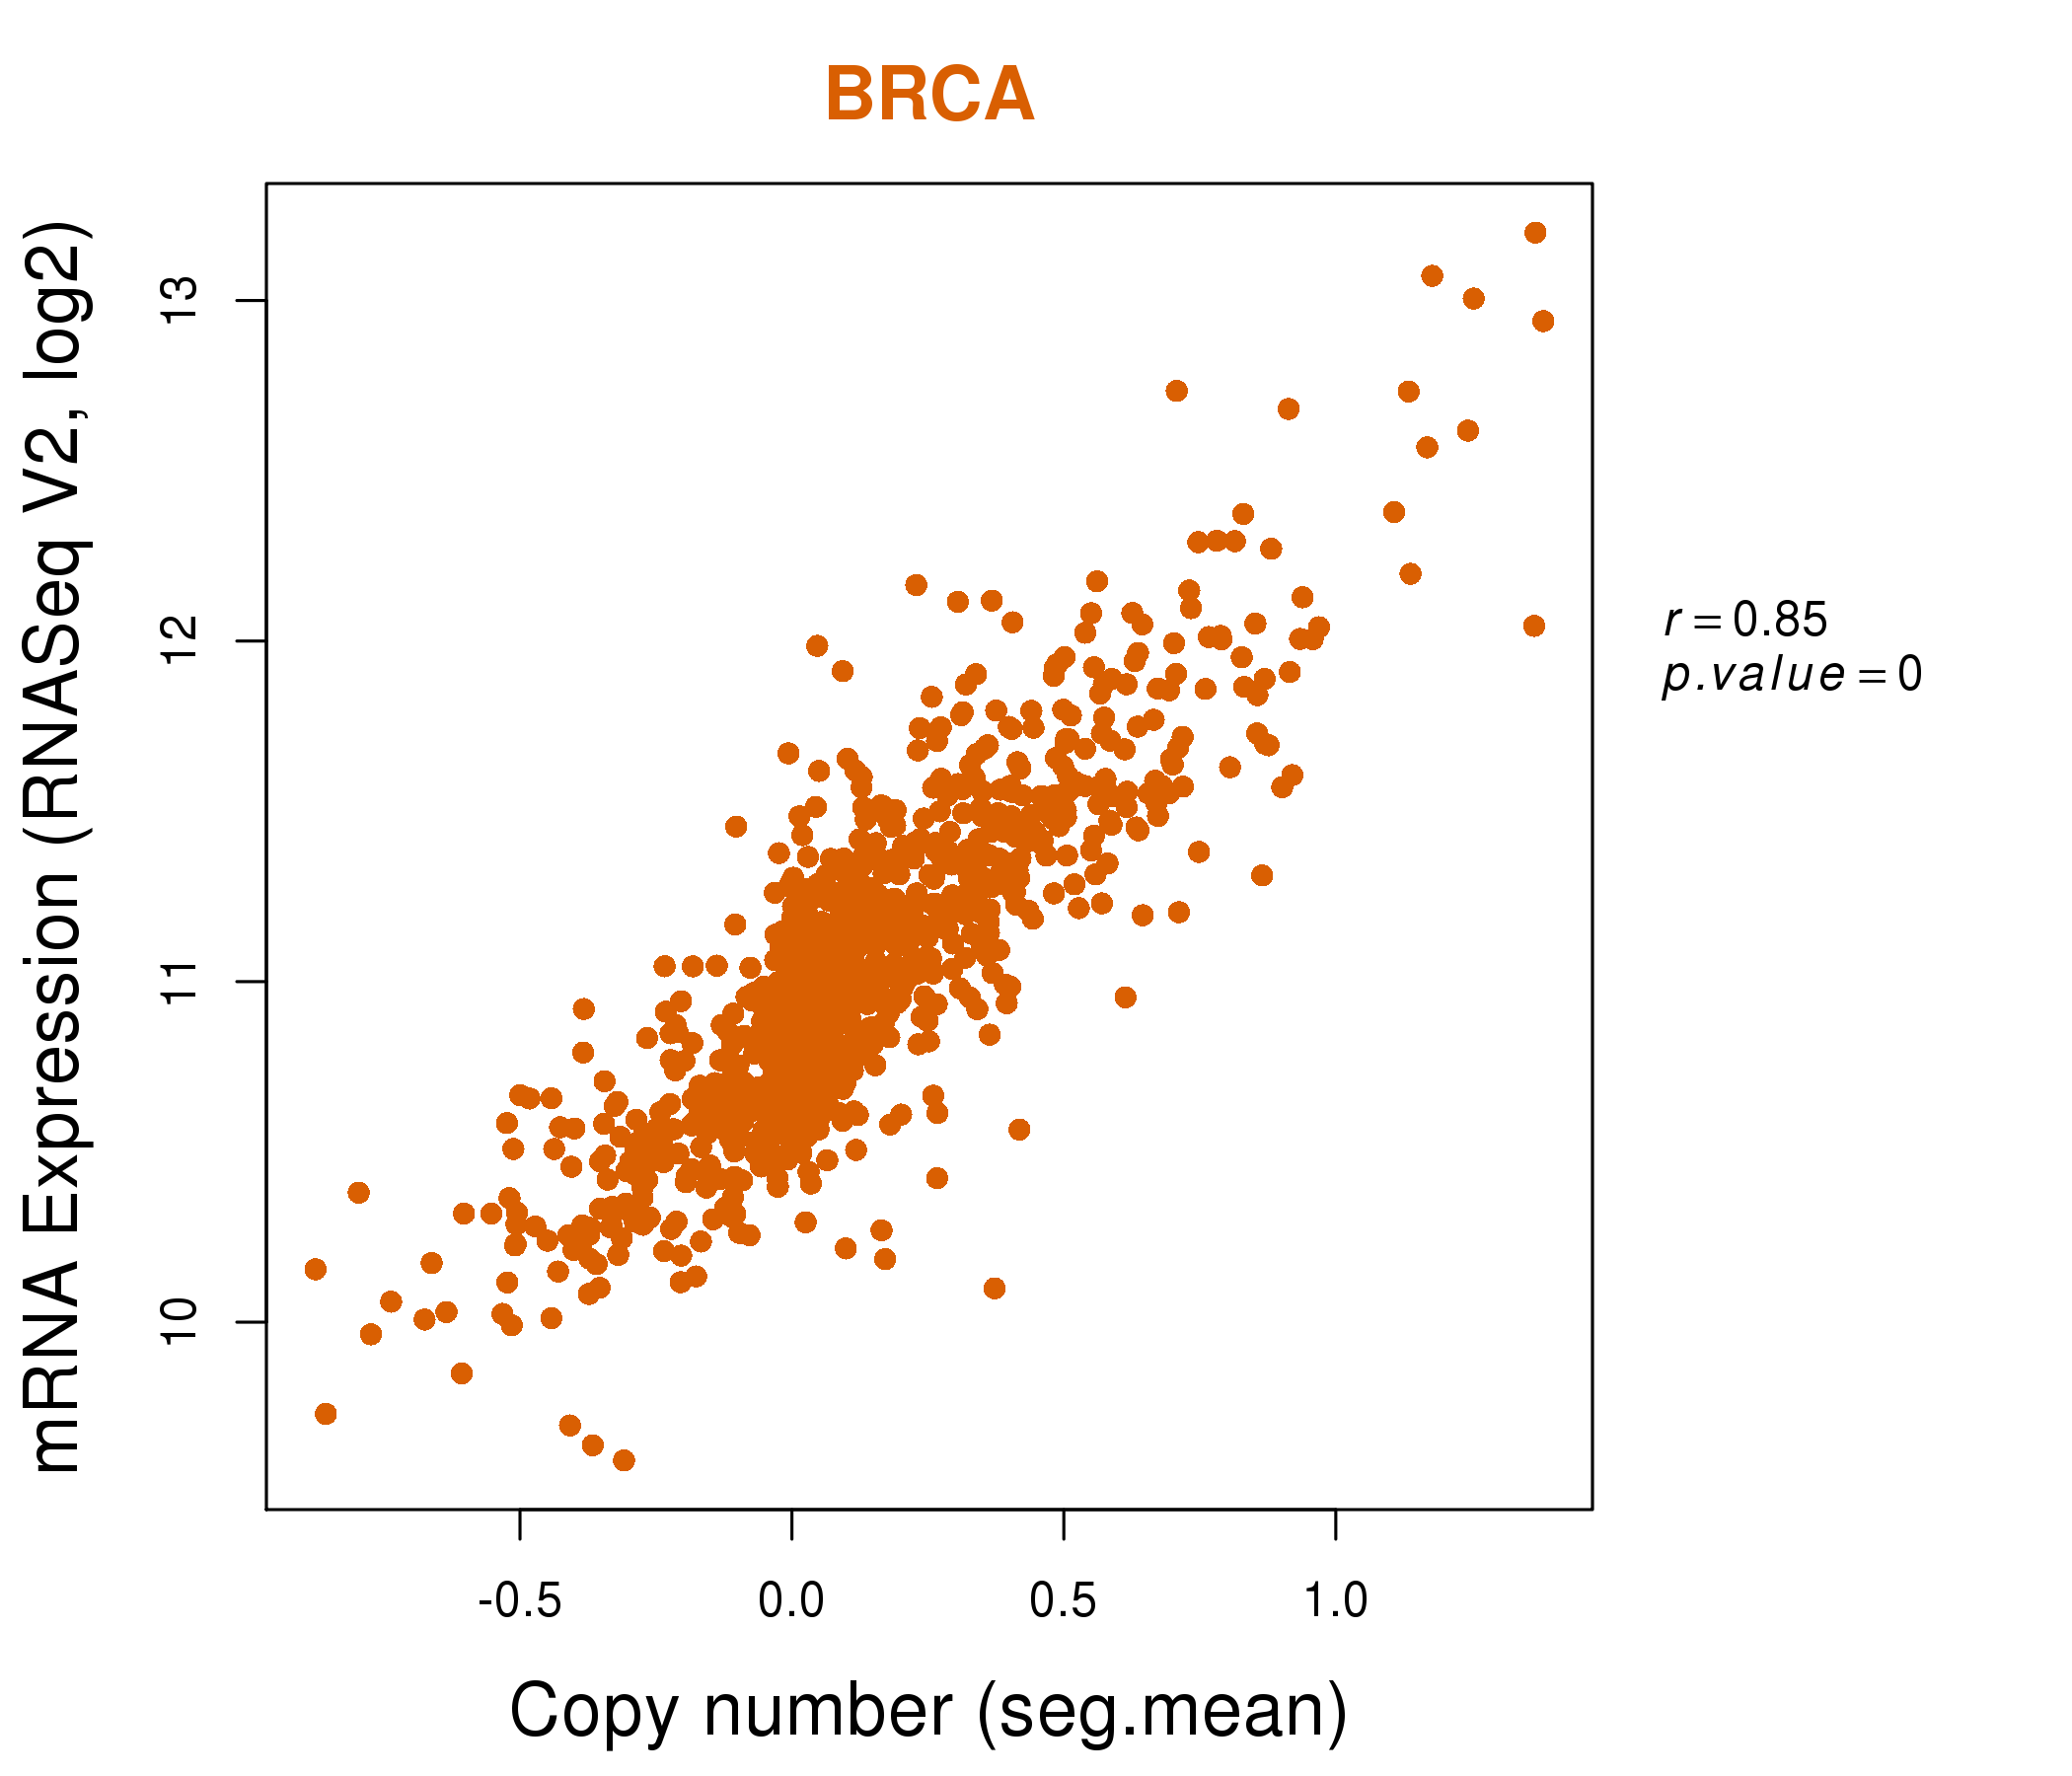
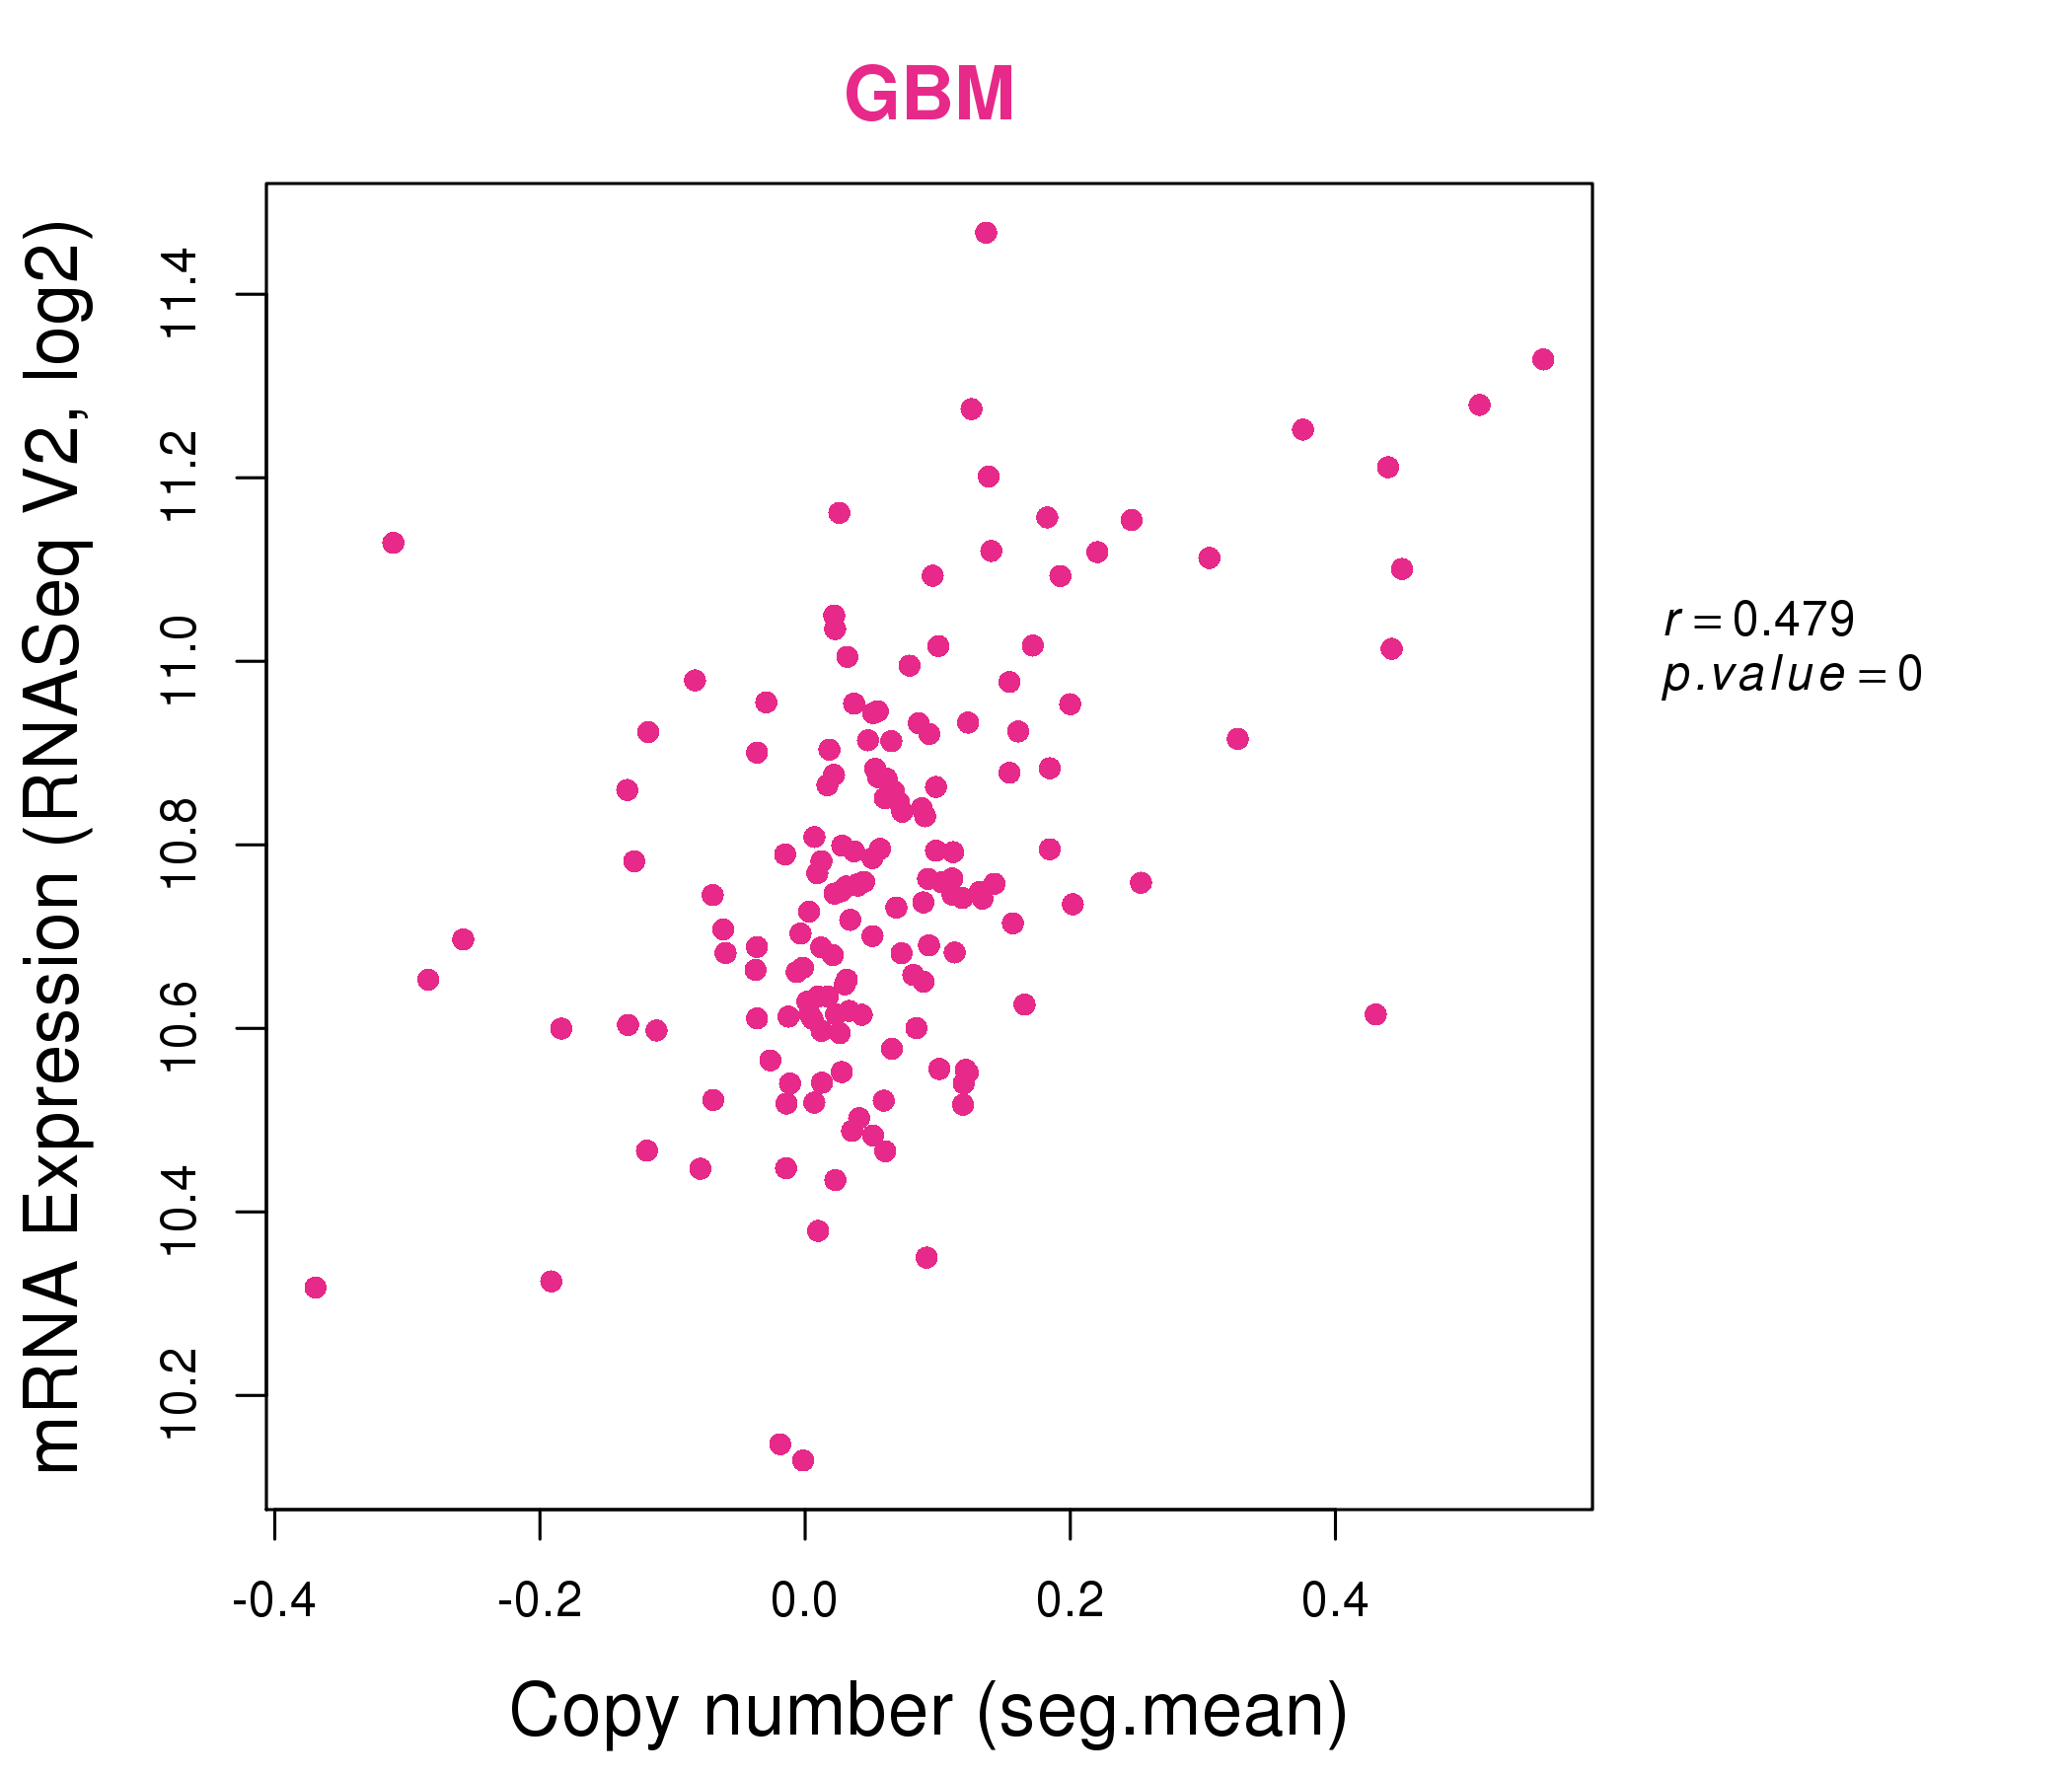
| * Copy number data were extracted from TCGA using R package TCGA-Assembler. The URLs of all public data files on TCGA DCC data server were gathered on Jan-05-2015. Function ProcessCNAData in TCGA-Assembler package was used to obtain gene-level copy number value which is calculated as the average copy number of the genomic region of a gene. |
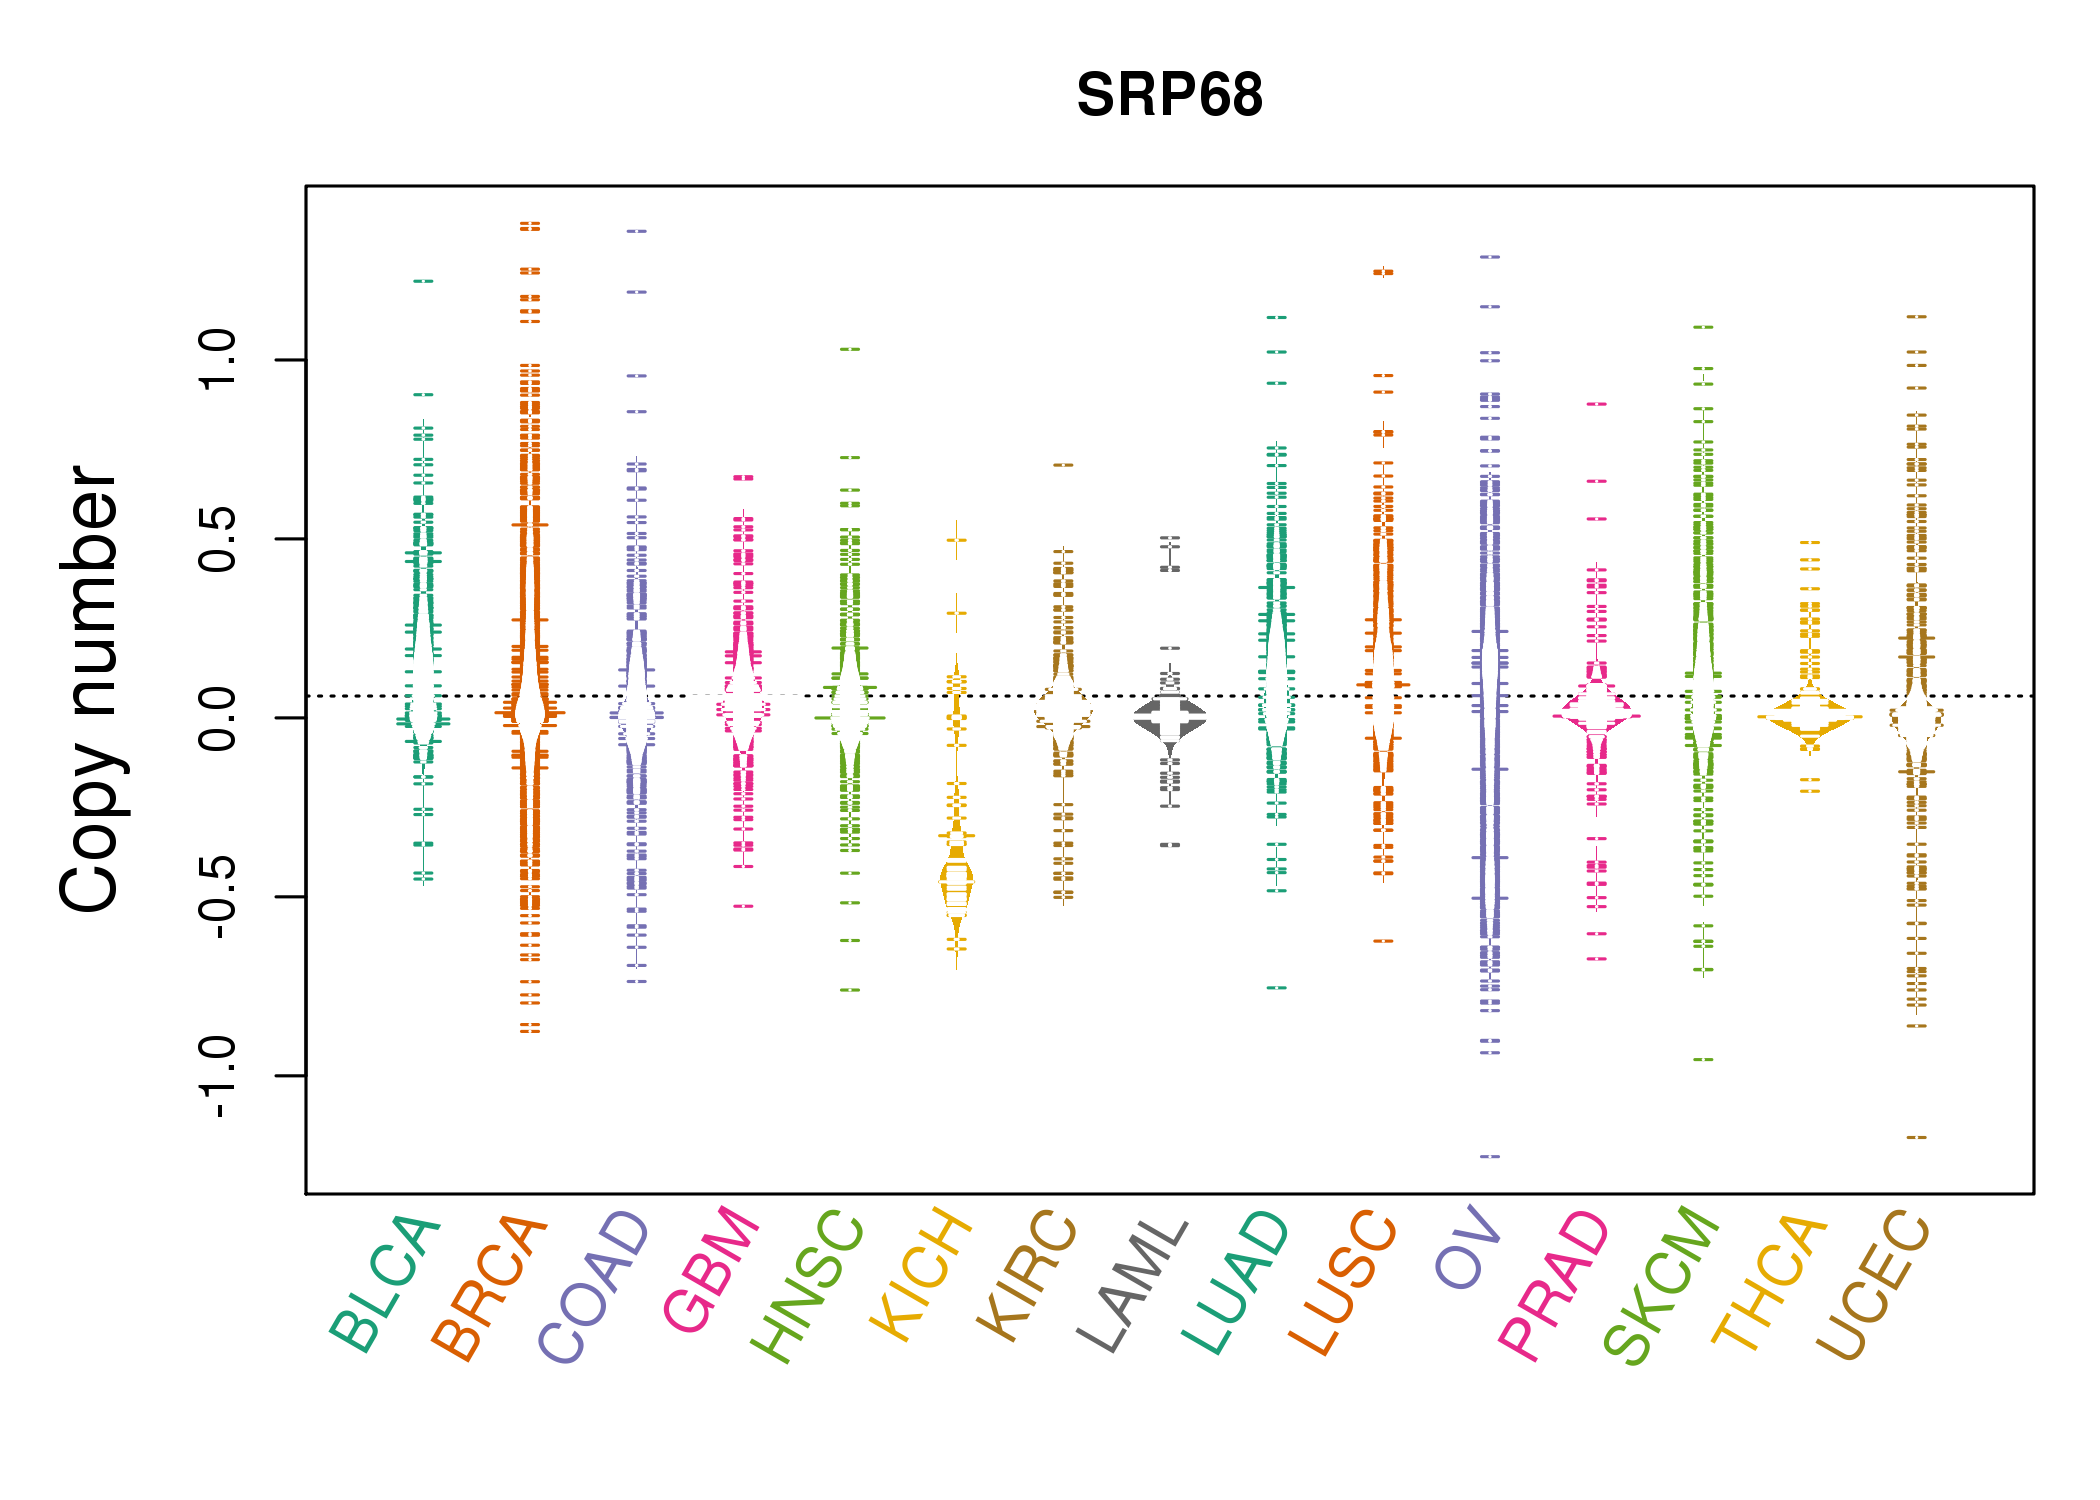 |
| cf) Tissue ID[Tissue type]: BLCA[Bladder Urothelial Carcinoma], BRCA[Breast invasive carcinoma], CESC[Cervical squamous cell carcinoma and endocervical adenocarcinoma], COAD[Colon adenocarcinoma], GBM[Glioblastoma multiforme], Glioma Low Grade, HNSC[Head and Neck squamous cell carcinoma], KICH[Kidney Chromophobe], KIRC[Kidney renal clear cell carcinoma], KIRP[Kidney renal papillary cell carcinoma], LAML[Acute Myeloid Leukemia], LUAD[Lung adenocarcinoma], LUSC[Lung squamous cell carcinoma], OV[Ovarian serous cystadenocarcinoma ], PAAD[Pancreatic adenocarcinoma], PRAD[Prostate adenocarcinoma], SKCM[Skin Cutaneous Melanoma], STAD[Stomach adenocarcinoma], THCA[Thyroid carcinoma], UCEC[Uterine Corpus Endometrial Carcinoma] |
| Top |
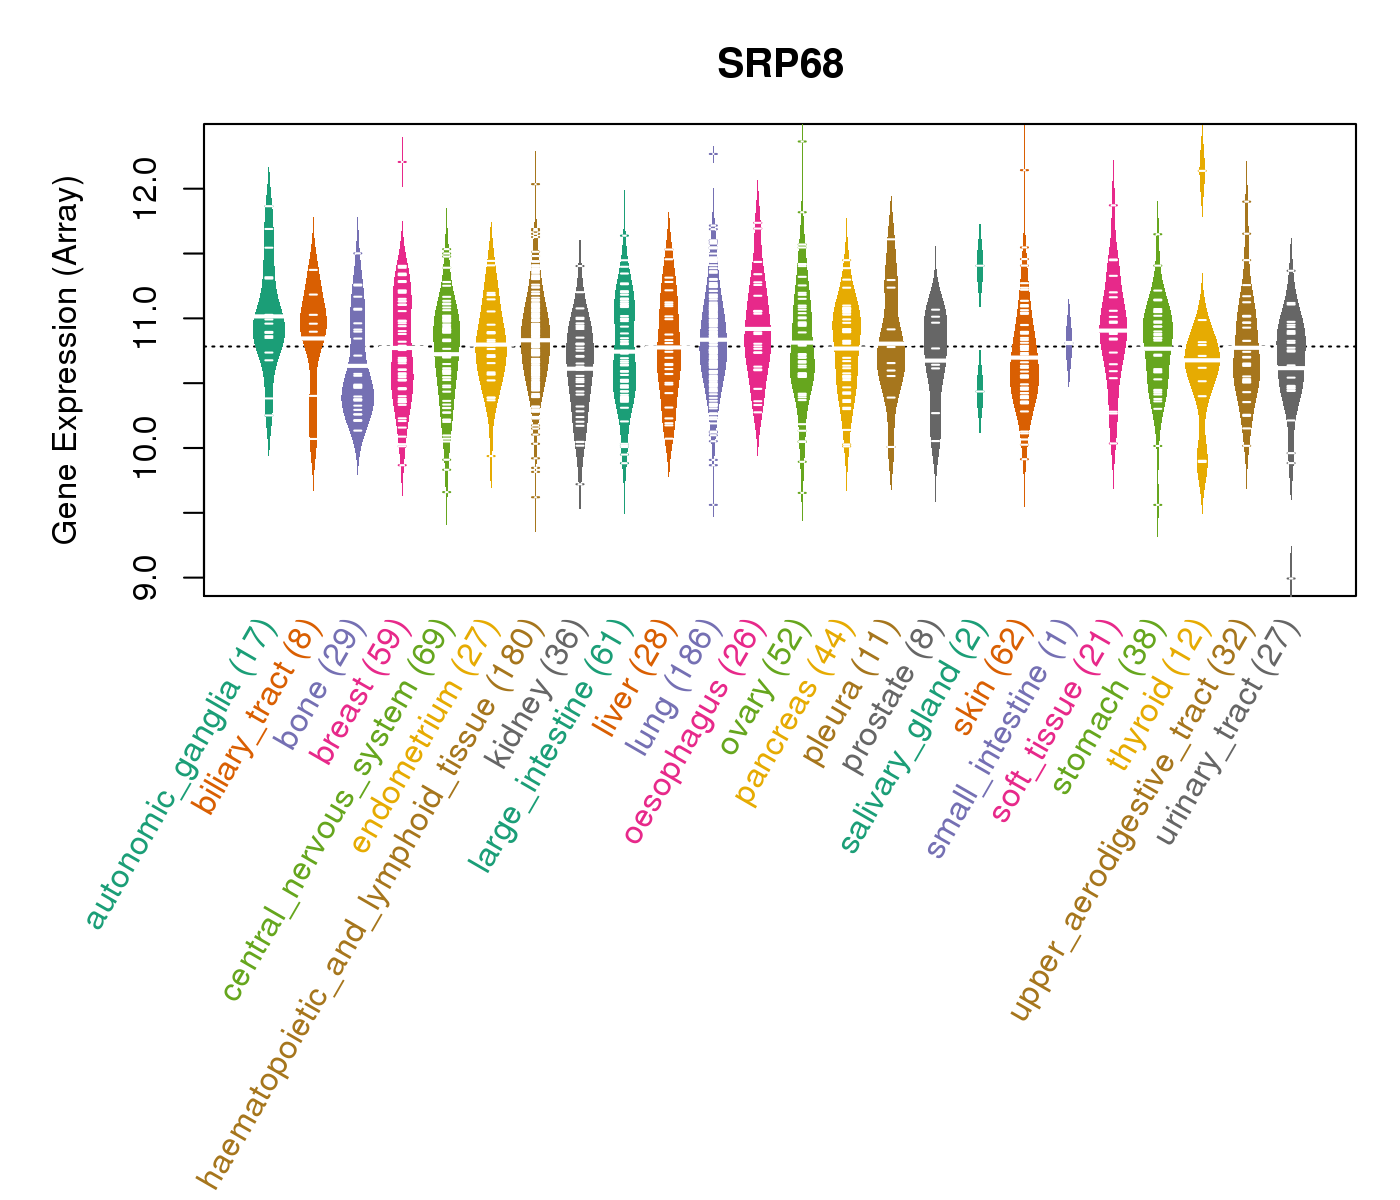
| Gene Expression for SRP68 |
| * CCLE gene expression data were extracted from CCLE_Expression_Entrez_2012-10-18.res: Gene-centric RMA-normalized mRNA expression data. |
 |
| * Normalized gene expression data of RNASeqV2 was extracted from TCGA using R package TCGA-Assembler. The URLs of all public data files on TCGA DCC data server were gathered at Jan-05-2015. Only eight cancer types have enough normal control samples for differential expression analysis. (t test, adjusted p<0.05 (using Benjamini-Hochberg FDR)) |
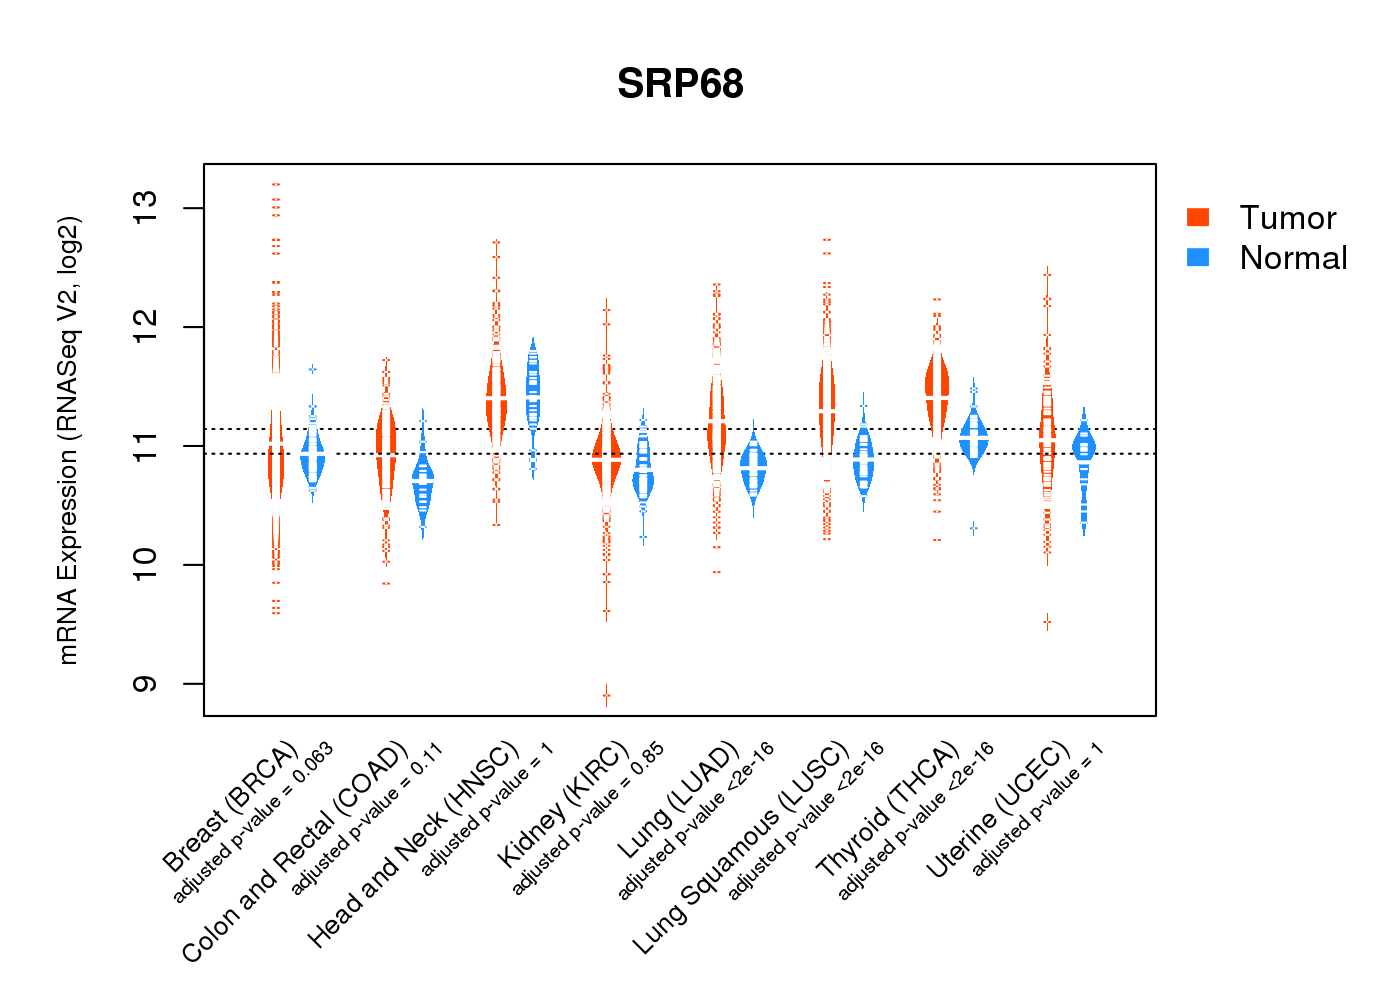 |
| Top |
| * This plots show the correlation between CNV and gene expression. |
: Open all plots for all cancer types
 |
|
 |
|
| Top |
| Gene-Gene Network Information |
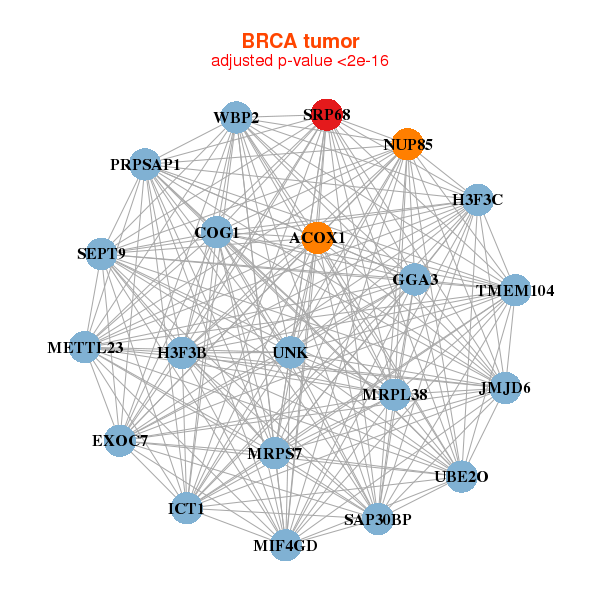
| * Co-Expression network figures were drawn using R package igraph. Only the top 20 genes with the highest correlations were shown. Red circle: input gene, orange circle: cell metabolism gene, sky circle: other gene |
: Open all plots for all cancer types
 |
|
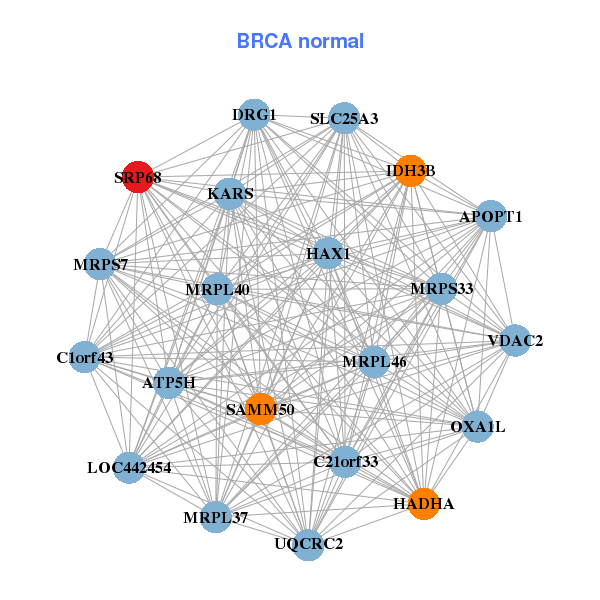
| ACOX1,METTL23,COG1,EXOC7,GGA3,H3F3B,H3F3C, ICT1,JMJD6,MIF4GD,MRPL38,MRPS7,NUP85,PRPSAP1, SAP30BP,SEPT9,SRP68,TMEM104,UBE2O,UNK,WBP2 | ATP5H,APOPT1,C1orf43,C21orf33,DRG1,HADHA,HAX1, IDH3B,KARS,LOC442454,MRPL37,MRPL40,MRPL46,MRPS33, MRPS7,OXA1L,SAMM50,SLC25A3,SRP68,UQCRC2,VDAC2 |
 |
|
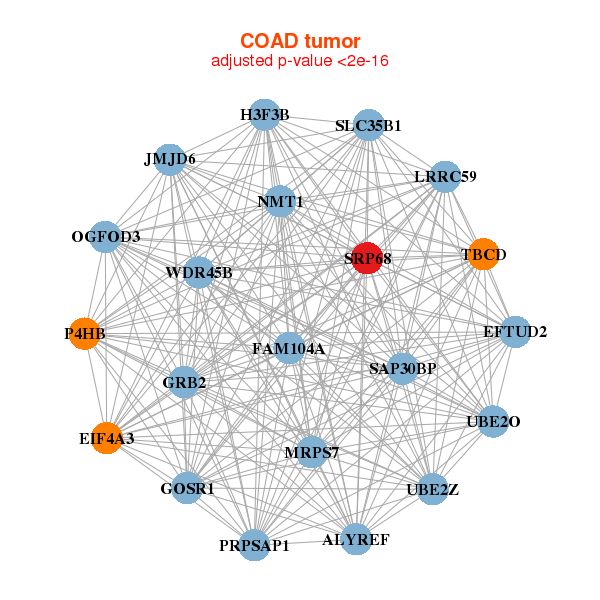
| OGFOD3,EFTUD2,EIF4A3,FAM104A,GOSR1,GRB2,H3F3B, JMJD6,LRRC59,MRPS7,NMT1,P4HB,PRPSAP1,SAP30BP, SLC35B1,SRP68,TBCD,ALYREF,UBE2O,UBE2Z,WDR45B | AARS,KIAA1549L,DDX24,EIF5B,IARS,IPO9,LDHB, LDLRAD3,MID1IP1,NUCKS1,NUDC,OGFOD1,PHF19,PLEKHO2, RECQL,SLC43A3,SRP68,TSR1,TUBB,TUBG1,USP14 |

| * Co-Expression network figures were drawn using R package igraph. Only the top 20 genes with the highest correlations were shown. Red circle: input gene, orange circle: cell metabolism gene, sky circle: other gene |
: Open all plots for all cancer types
| Top |
: Open all interacting genes' information including KEGG pathway for all interacting genes from DAVID
| Top |
| Pharmacological Information for SRP68 |
| There's no related Drug. |
| Top |
| Cross referenced IDs for SRP68 |
| * We obtained these cross-references from Uniprot database. It covers 150 different DBs, 18 categories. http://www.uniprot.org/help/cross_references_section |
: Open all cross reference information
|
Copyright © 2016-Present - The Univsersity of Texas Health Science Center at Houston @ |