|
||||||||||||||||||||||||||||||||||||||||||||||||||||||||||||||||||||||||||||||||||||||||||||||||||||||||||||||||||||||||||||||||||||||||||||||||||||||||||||||||||||||||||||||||||||||||||||||||||||||||||||||||||||||||||||||||||||||||||||||||||||||||||||||||||||||||||||||||||||||||||||||||||||||||||||||||||||||||||
| |
| Phenotypic Information (metabolism pathway, cancer, disease, phenome) |
| |
| |
| Gene-Gene Network Information: Co-Expression Network, Interacting Genes & KEGG |
| |
|


| Gene Summary for SSR1 |
| Top |
| Phenotypic Information for SSR1(metabolism pathway, cancer, disease, phenome) |
| Cancer | CGAP: SSR1 |
| Familial Cancer Database: SSR1 | |
| * This gene is included in those cancer gene databases. |
|
|
|
|
|
| . | ||||||||||||||||||||||||||||||||||||||||||||||||||||||||||||||||||||||||||||||||||||||||||||||||||||||||||||||||||||||||||||||||||||||||||||||||||||||||||||||||||||||||||||||||||||||||||||||||||||||||||||||||||||||||||||||||||||||||||||||||||||||||||||||||||||||||||||||||||||||||||||||||||||||||||||||||||||
Oncogene 1 | Significant driver gene in | |||||||||||||||||||||||||||||||||||||||||||||||||||||||||||||||||||||||||||||||||||||||||||||||||||||||||||||||||||||||||||||||||||||||||||||||||||||||||||||||||||||||||||||||||||||||||||||||||||||||||||||||||||||||||||||||||||||||||||||||||||||||||||||||||||||||||||||||||||||||||||||||||||||||||||||||||||||||||
| cf) number; DB name 1 Oncogene; http://nar.oxfordjournals.org/content/35/suppl_1/D721.long, 2 Tumor Suppressor gene; https://bioinfo.uth.edu/TSGene/, 3 Cancer Gene Census; http://www.nature.com/nrc/journal/v4/n3/abs/nrc1299.html, 4 CancerGenes; http://nar.oxfordjournals.org/content/35/suppl_1/D721.long, 5 Network of Cancer Gene; http://ncg.kcl.ac.uk/index.php, 1Therapeutic Vulnerabilities in Cancer; http://cbio.mskcc.org/cancergenomics/statius/ |
| REACTOME_METABOLISM_OF_PROTEINS | |
| OMIM | |
| Orphanet | |
| Disease | KEGG Disease: SSR1 |
| MedGen: SSR1 (Human Medical Genetics with Condition) | |
| ClinVar: SSR1 | |
| Phenotype | MGI: SSR1 (International Mouse Phenotyping Consortium) |
| PhenomicDB: SSR1 | |
| Mutations for SSR1 |
| * Under tables are showing count per each tissue to give us broad intuition about tissue specific mutation patterns.You can go to the detailed page for each mutation database's web site. |
| There's no structural variation information in COSMIC data for this gene. |
| * From mRNA Sanger sequences, Chitars2.0 arranged chimeric transcripts. This table shows SSR1 related fusion information. |
| ID | Head Gene | Tail Gene | Accession | Gene_a | qStart_a | qEnd_a | Chromosome_a | tStart_a | tEnd_a | Gene_a | qStart_a | qEnd_a | Chromosome_a | tStart_a | tEnd_a |
| BF818212 | SSR1 | 1 | 203 | 6 | 7284535 | 7284737 | AVL9 | 200 | 251 | 7 | 33042369 | 33042420 | |
| M14219 | DCN | 26 | 1292 | 12 | 91539704 | 91576454 | SSR1 | 1292 | 1778 | 6 | 7288053 | 7288539 | |
| BQ353656 | C5AR1 | 1 | 184 | 19 | 47823968 | 47824151 | SSR1 | 176 | 282 | 6 | 7288771 | 7288877 | |
| AI082662 | SSR1 | 33 | 185 | 6 | 7300760 | 7300912 | RBFOX2 | 182 | 402 | 22 | 36423124 | 36423345 | |
| BP386202 | SSR1 | 1 | 313 | 6 | 7281604 | 7281915 | PSMA1 | 314 | 500 | 11 | 14526424 | 14526610 | |
| AW392218 | SSR1 | 22 | 144 | 6 | 7288534 | 7288657 | SRPK2 | 135 | 636 | 7 | 104783707 | 104808498 | |
| BF756608 | SSR1 | 1 | 162 | 6 | 7295694 | 7299038 | NOTCH2 | 157 | 245 | 1 | 120456798 | 120456886 | |
| BE936569 | SSR1 | 87 | 308 | 6 | 7298853 | 7299072 | HPS3 | 299 | 453 | 3 | 148885009 | 148889926 | |
| BM728644 | SSR1 | 1 | 116 | 6 | 7283872 | 7283987 | SSR1 | 109 | 677 | 6 | 7285112 | 7285680 | |
| AK025753 | SSR1 | 1 | 367 | 6 | 7284071 | 7284437 | SSR1 | 363 | 2291 | 6 | 7284949 | 7286878 | |
| Top |
| Mutation type/ Tissue ID | brca | cns | cerv | endome | haematopo | kidn | Lintest | liver | lung | ns | ovary | pancre | prost | skin | stoma | thyro | urina | |||
| Total # sample | 3 | 1 | 2 | 1 | ||||||||||||||||
| GAIN (# sample) | 3 | 2 | 1 | |||||||||||||||||
| LOSS (# sample) | 1 |
| cf) Tissue ID; Tissue type (1; Breast, 2; Central_nervous_system, 3; Cervix, 4; Endometrium, 5; Haematopoietic_and_lymphoid_tissue, 6; Kidney, 7; Large_intestine, 8; Liver, 9; Lung, 10; NS, 11; Ovary, 12; Pancreas, 13; Prostate, 14; Skin, 15; Stomach, 16; Thyroid, 17; Urinary_tract) |
| Top |
|
 |
| Top |
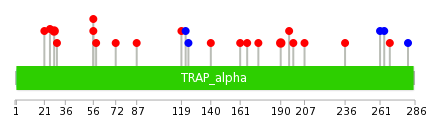
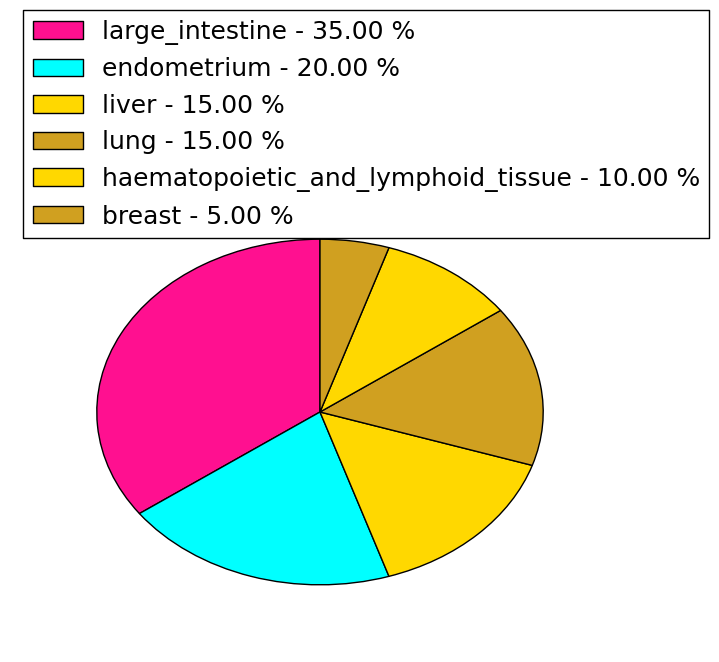
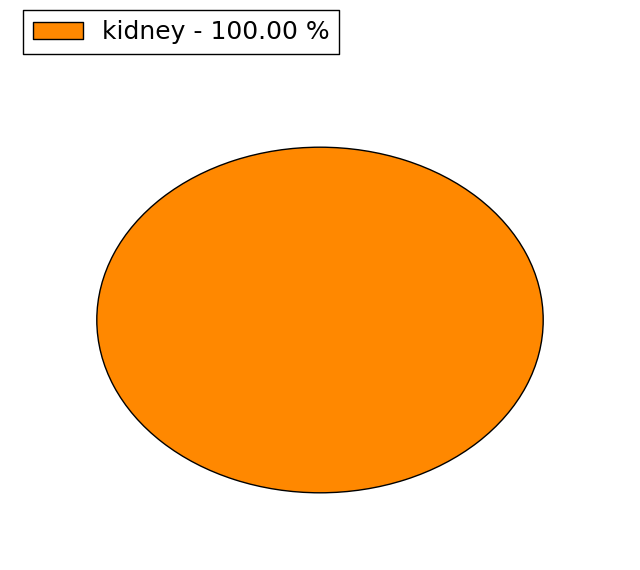
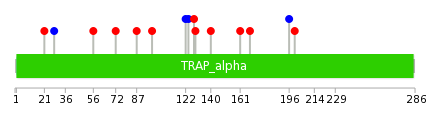
| Stat. for Non-Synonymous SNVs (# total SNVs=20) | (# total SNVs=1) |
 | 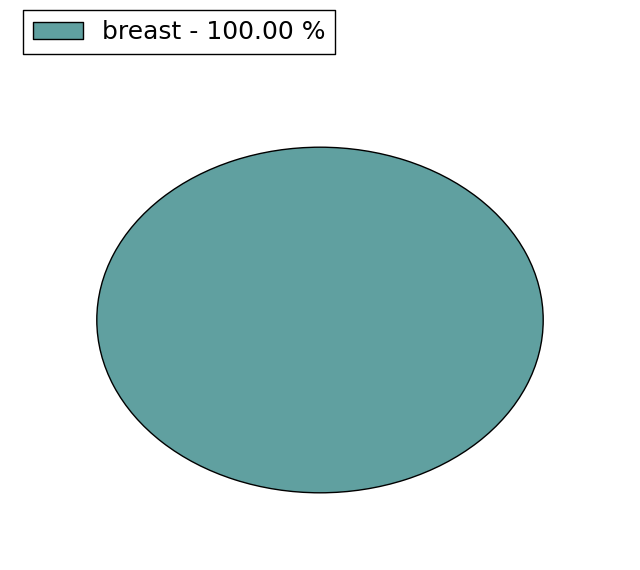 |
(# total SNVs=0) | (# total SNVs=1) |
 |
| Top |
| * When you move the cursor on each content, you can see more deailed mutation information on the Tooltip. Those are primary_site,primary_histology,mutation(aa),pubmedID. |
| GRCh37 position | Mutation(aa) | Unique sampleID count |
| chr6:7299032-7299032 | p.F190V | 2 |
| chr6:7310259-7310259 | p.L28S | 2 |
| chr6:7313280-7313280 | p.P25H | 1 |
| chr6:7298980-7298980 | p.T207I | 1 |
| chr6:7301730-7301730 | p.S119F | 1 |
| chr6:7313292-7313292 | p.F21S | 1 |
| chr6:7299004-7299004 | p.R199T | 1 |
| chr6:7303804-7303804 | p.I87V | 1 |
| chr6:7299013-7299013 | p.V196G | 1 |
| chr6:7303849-7303849 | p.D72N | 1 |
| Top |
|
 |
| Point Mutation/ Tissue ID | 1 | 2 | 3 | 4 | 5 | 6 | 7 | 8 | 9 | 10 | 11 | 12 | 13 | 14 | 15 | 16 | 17 | 18 | 19 | 20 |
| # sample | 1 | 1 | 1 | 4 | 1 | 1 | 3 | 2 | ||||||||||||
| # mutation | 1 | 1 | 1 | 4 | 1 | 1 | 3 | 3 | ||||||||||||
| nonsynonymous SNV | 1 | 1 | 4 | 1 | 1 | 3 | ||||||||||||||
| synonymous SNV | 1 | 3 |
| cf) Tissue ID; Tissue type (1; BLCA[Bladder Urothelial Carcinoma], 2; BRCA[Breast invasive carcinoma], 3; CESC[Cervical squamous cell carcinoma and endocervical adenocarcinoma], 4; COAD[Colon adenocarcinoma], 5; GBM[Glioblastoma multiforme], 6; Glioma Low Grade, 7; HNSC[Head and Neck squamous cell carcinoma], 8; KICH[Kidney Chromophobe], 9; KIRC[Kidney renal clear cell carcinoma], 10; KIRP[Kidney renal papillary cell carcinoma], 11; LAML[Acute Myeloid Leukemia], 12; LUAD[Lung adenocarcinoma], 13; LUSC[Lung squamous cell carcinoma], 14; OV[Ovarian serous cystadenocarcinoma ], 15; PAAD[Pancreatic adenocarcinoma], 16; PRAD[Prostate adenocarcinoma], 17; SKCM[Skin Cutaneous Melanoma], 18:STAD[Stomach adenocarcinoma], 19:THCA[Thyroid carcinoma], 20:UCEC[Uterine Corpus Endometrial Carcinoma]) |
| Top |
| * We represented just top 10 SNVs. When you move the cursor on each content, you can see more deailed mutation information on the Tooltip. Those are primary_site, primary_histology, mutation(aa), pubmedID. |
| Genomic Position | Mutation(aa) | Unique sampleID count |
| chr6:7301699 | p.I87V,SSR1 | 1 |
| chr6:7301714 | p.D72N,SSR1 | 1 |
| chr6:7301720 | p.V56L,SSR1 | 1 |
| chr6:7303804 | p.L28L,SSR1 | 1 |
| chr6:7290155 | p.F21S,SSR1 | 1 |
| chr6:7303849 | p.S200L,SSR1 | 1 |
| chr6:7295626 | p.I196I,SSR1 | 1 |
| chr6:7310176 | p.R168K,SSR1 | 1 |
| chr6:7295711 | p.V128G,SSR1 | 1 |
| chr6:7310258 | p.G98R,SSR1 | 1 |
| * Copy number data were extracted from TCGA using R package TCGA-Assembler. The URLs of all public data files on TCGA DCC data server were gathered on Jan-05-2015. Function ProcessCNAData in TCGA-Assembler package was used to obtain gene-level copy number value which is calculated as the average copy number of the genomic region of a gene. |
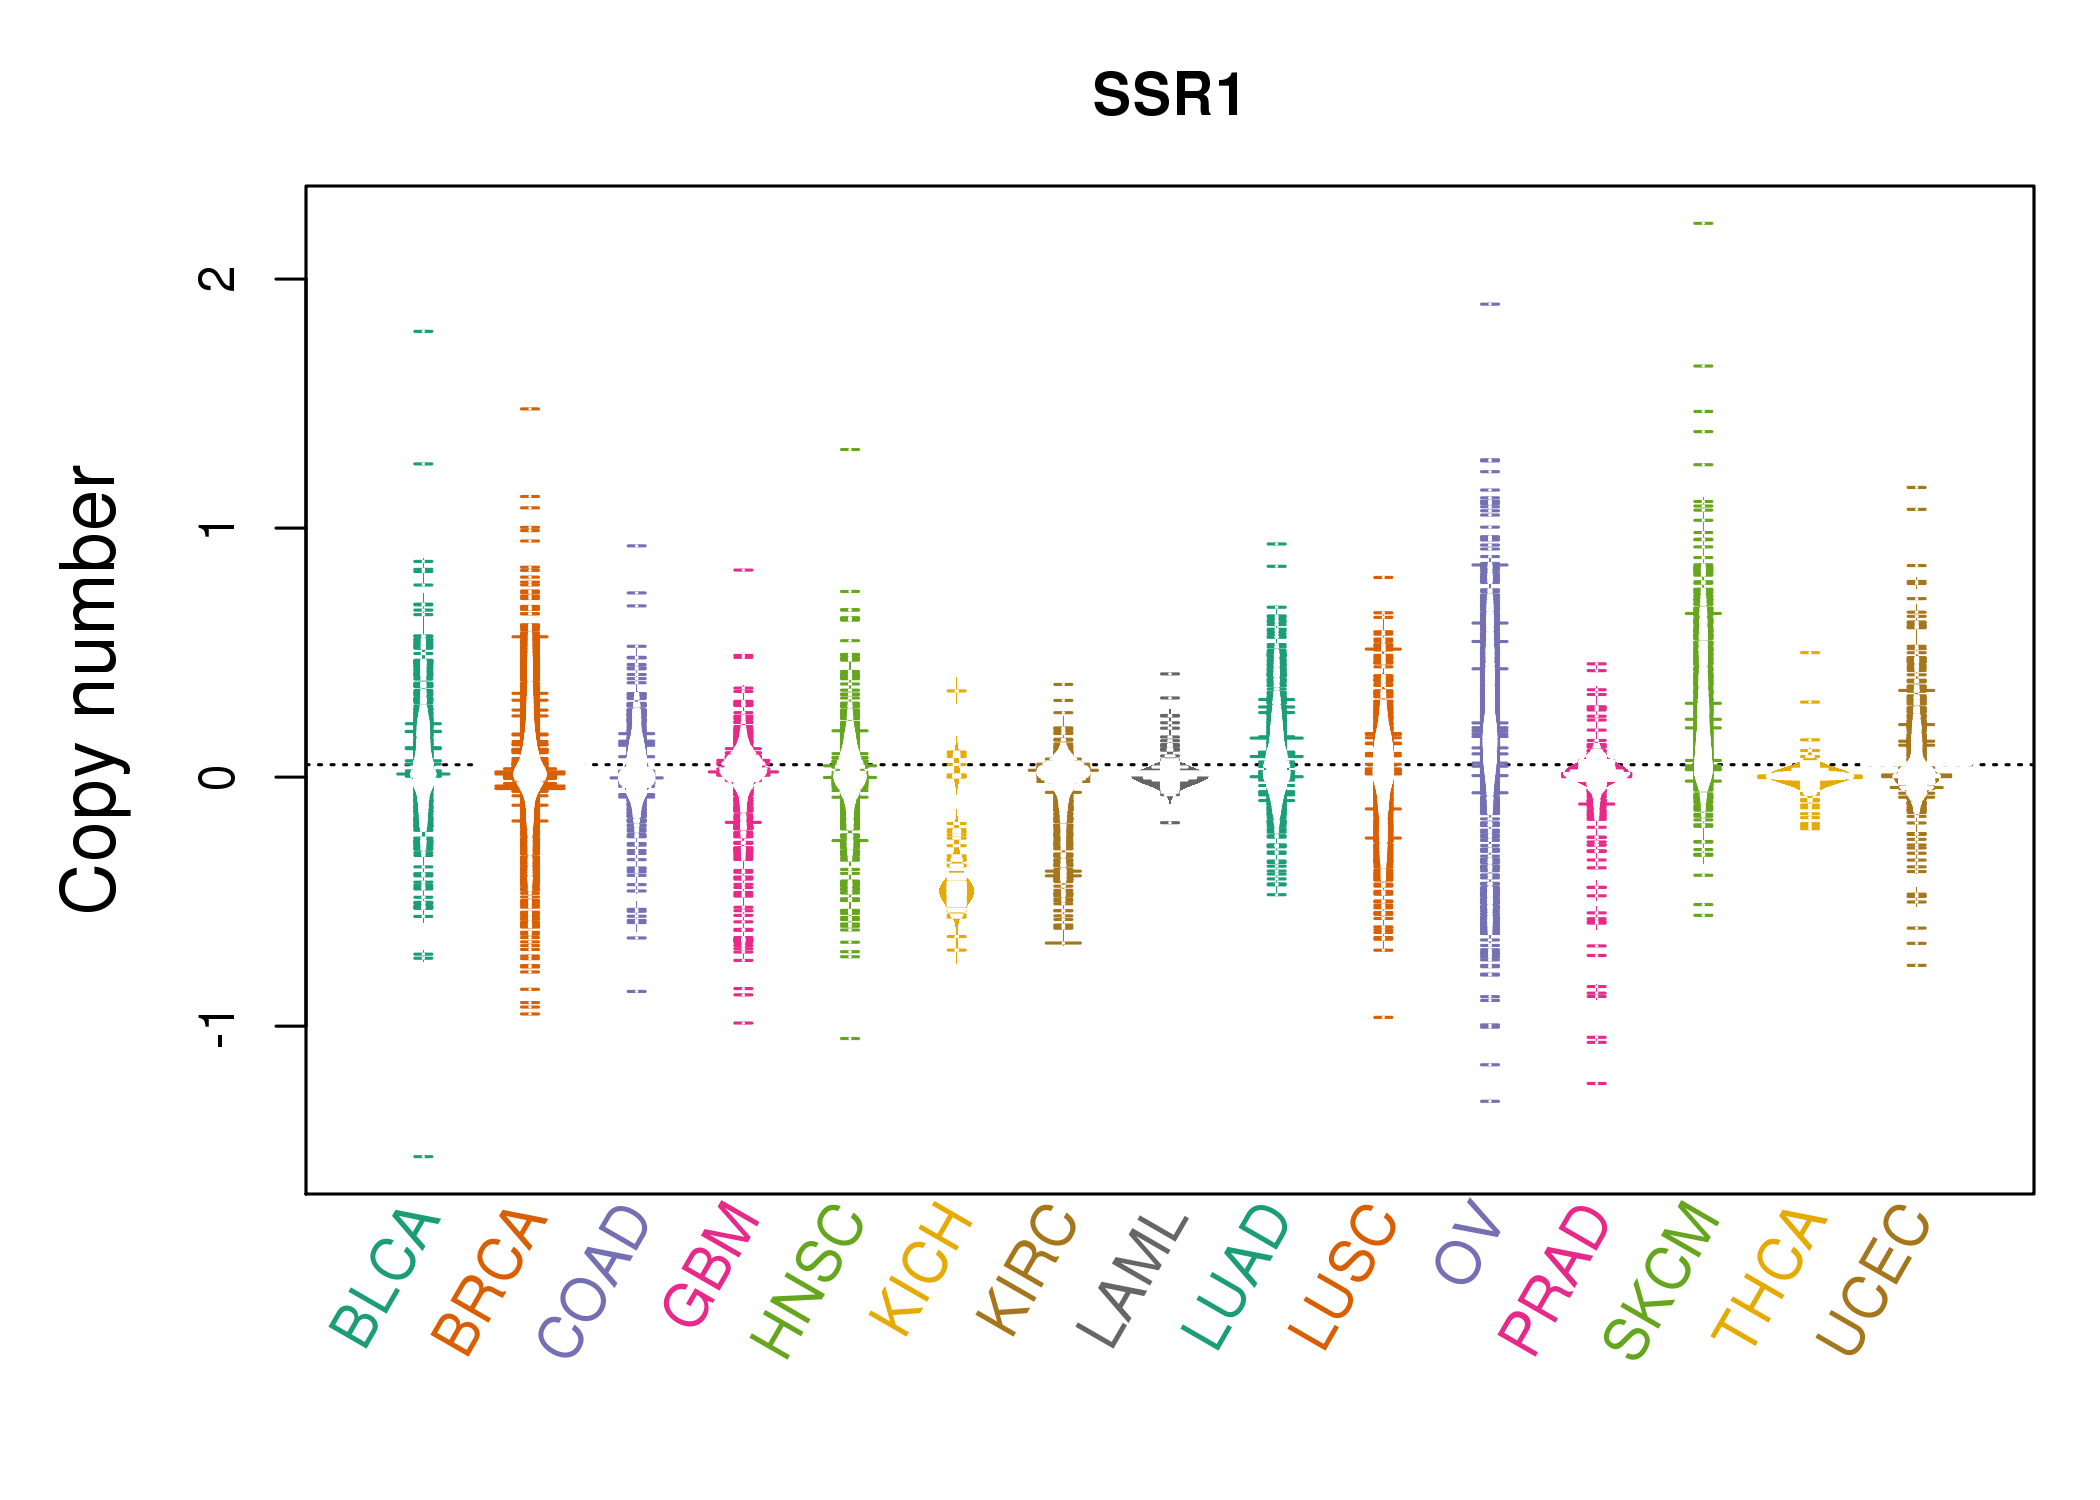 |
| cf) Tissue ID[Tissue type]: BLCA[Bladder Urothelial Carcinoma], BRCA[Breast invasive carcinoma], CESC[Cervical squamous cell carcinoma and endocervical adenocarcinoma], COAD[Colon adenocarcinoma], GBM[Glioblastoma multiforme], Glioma Low Grade, HNSC[Head and Neck squamous cell carcinoma], KICH[Kidney Chromophobe], KIRC[Kidney renal clear cell carcinoma], KIRP[Kidney renal papillary cell carcinoma], LAML[Acute Myeloid Leukemia], LUAD[Lung adenocarcinoma], LUSC[Lung squamous cell carcinoma], OV[Ovarian serous cystadenocarcinoma ], PAAD[Pancreatic adenocarcinoma], PRAD[Prostate adenocarcinoma], SKCM[Skin Cutaneous Melanoma], STAD[Stomach adenocarcinoma], THCA[Thyroid carcinoma], UCEC[Uterine Corpus Endometrial Carcinoma] |
| Top |
| Gene Expression for SSR1 |
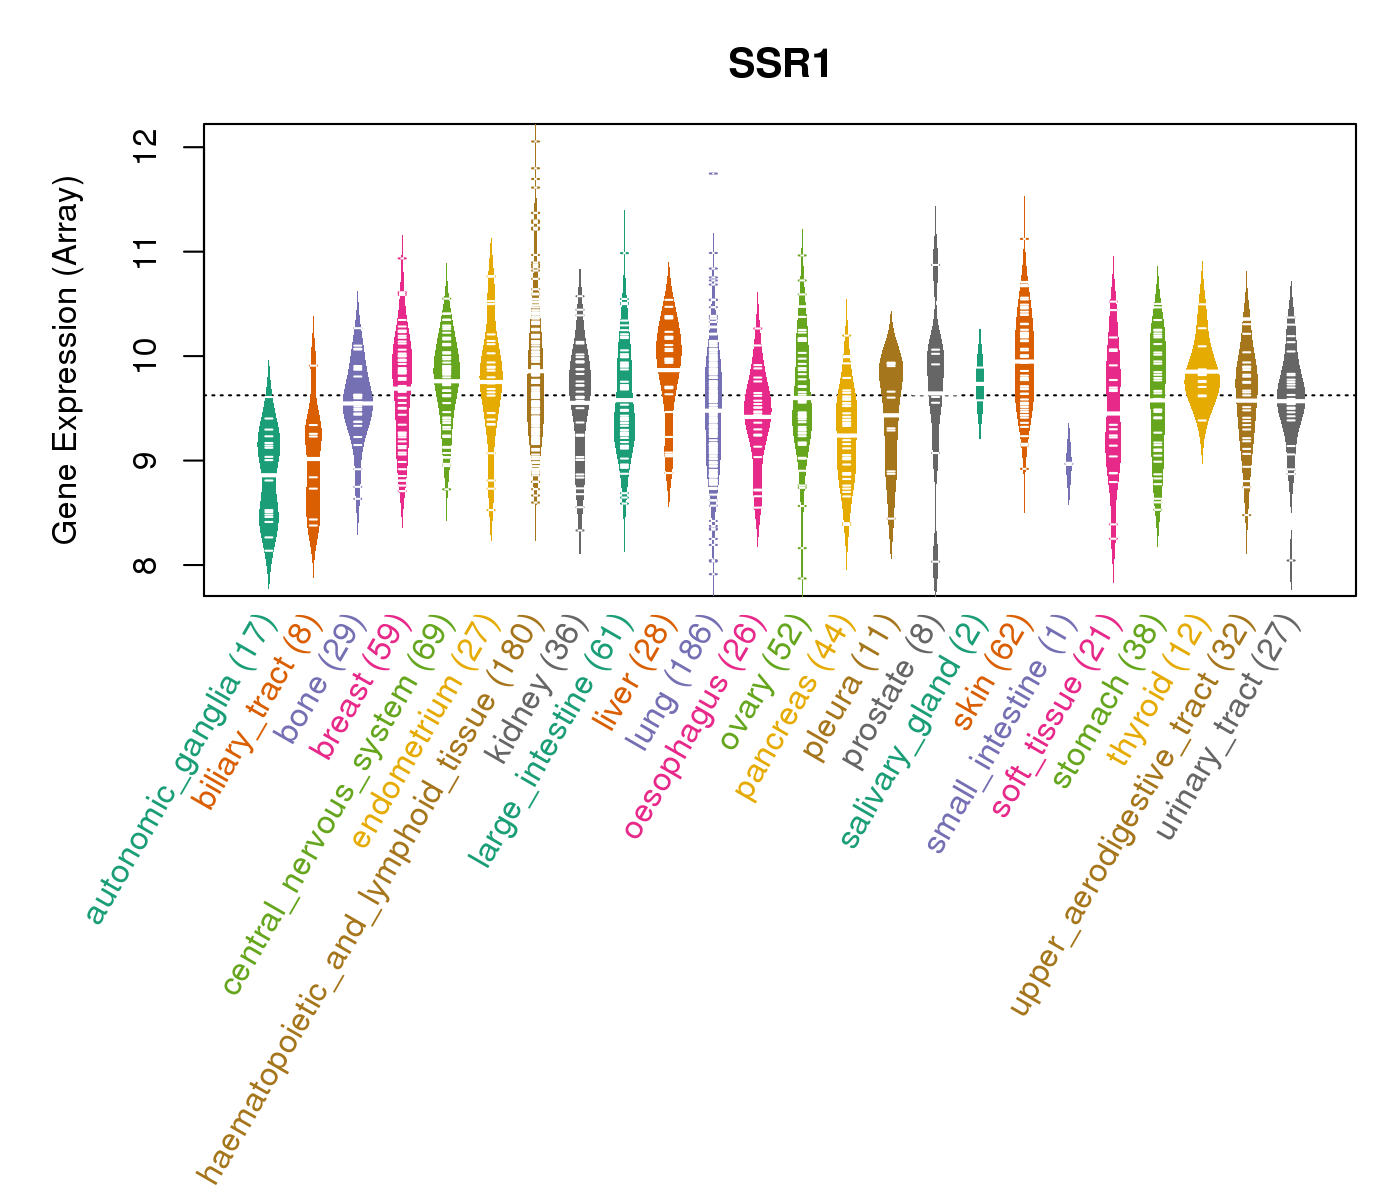
| * CCLE gene expression data were extracted from CCLE_Expression_Entrez_2012-10-18.res: Gene-centric RMA-normalized mRNA expression data. |
 |
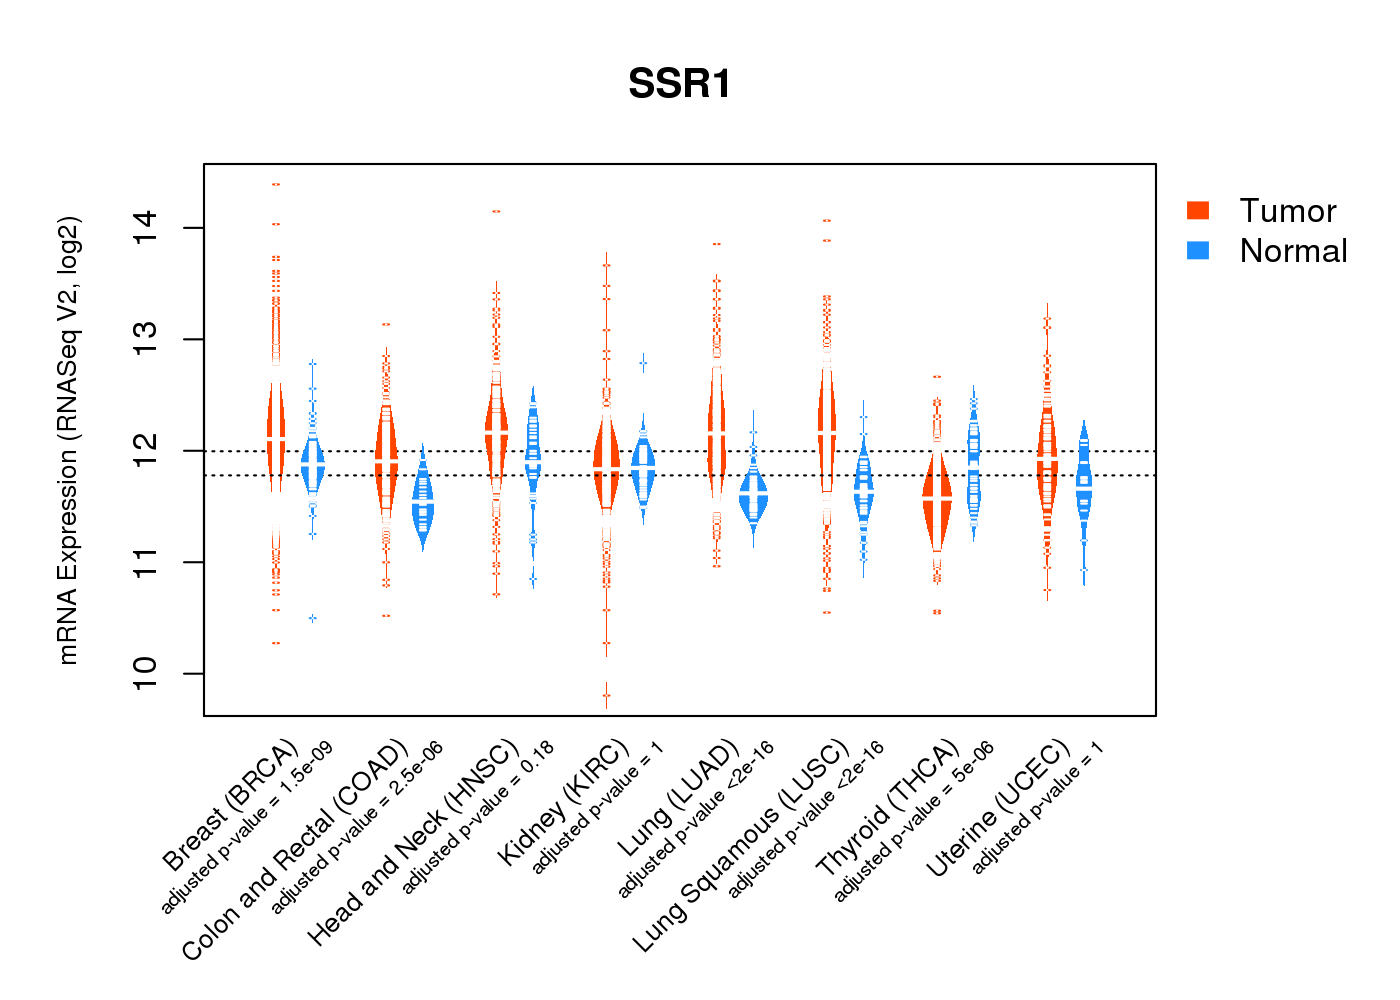
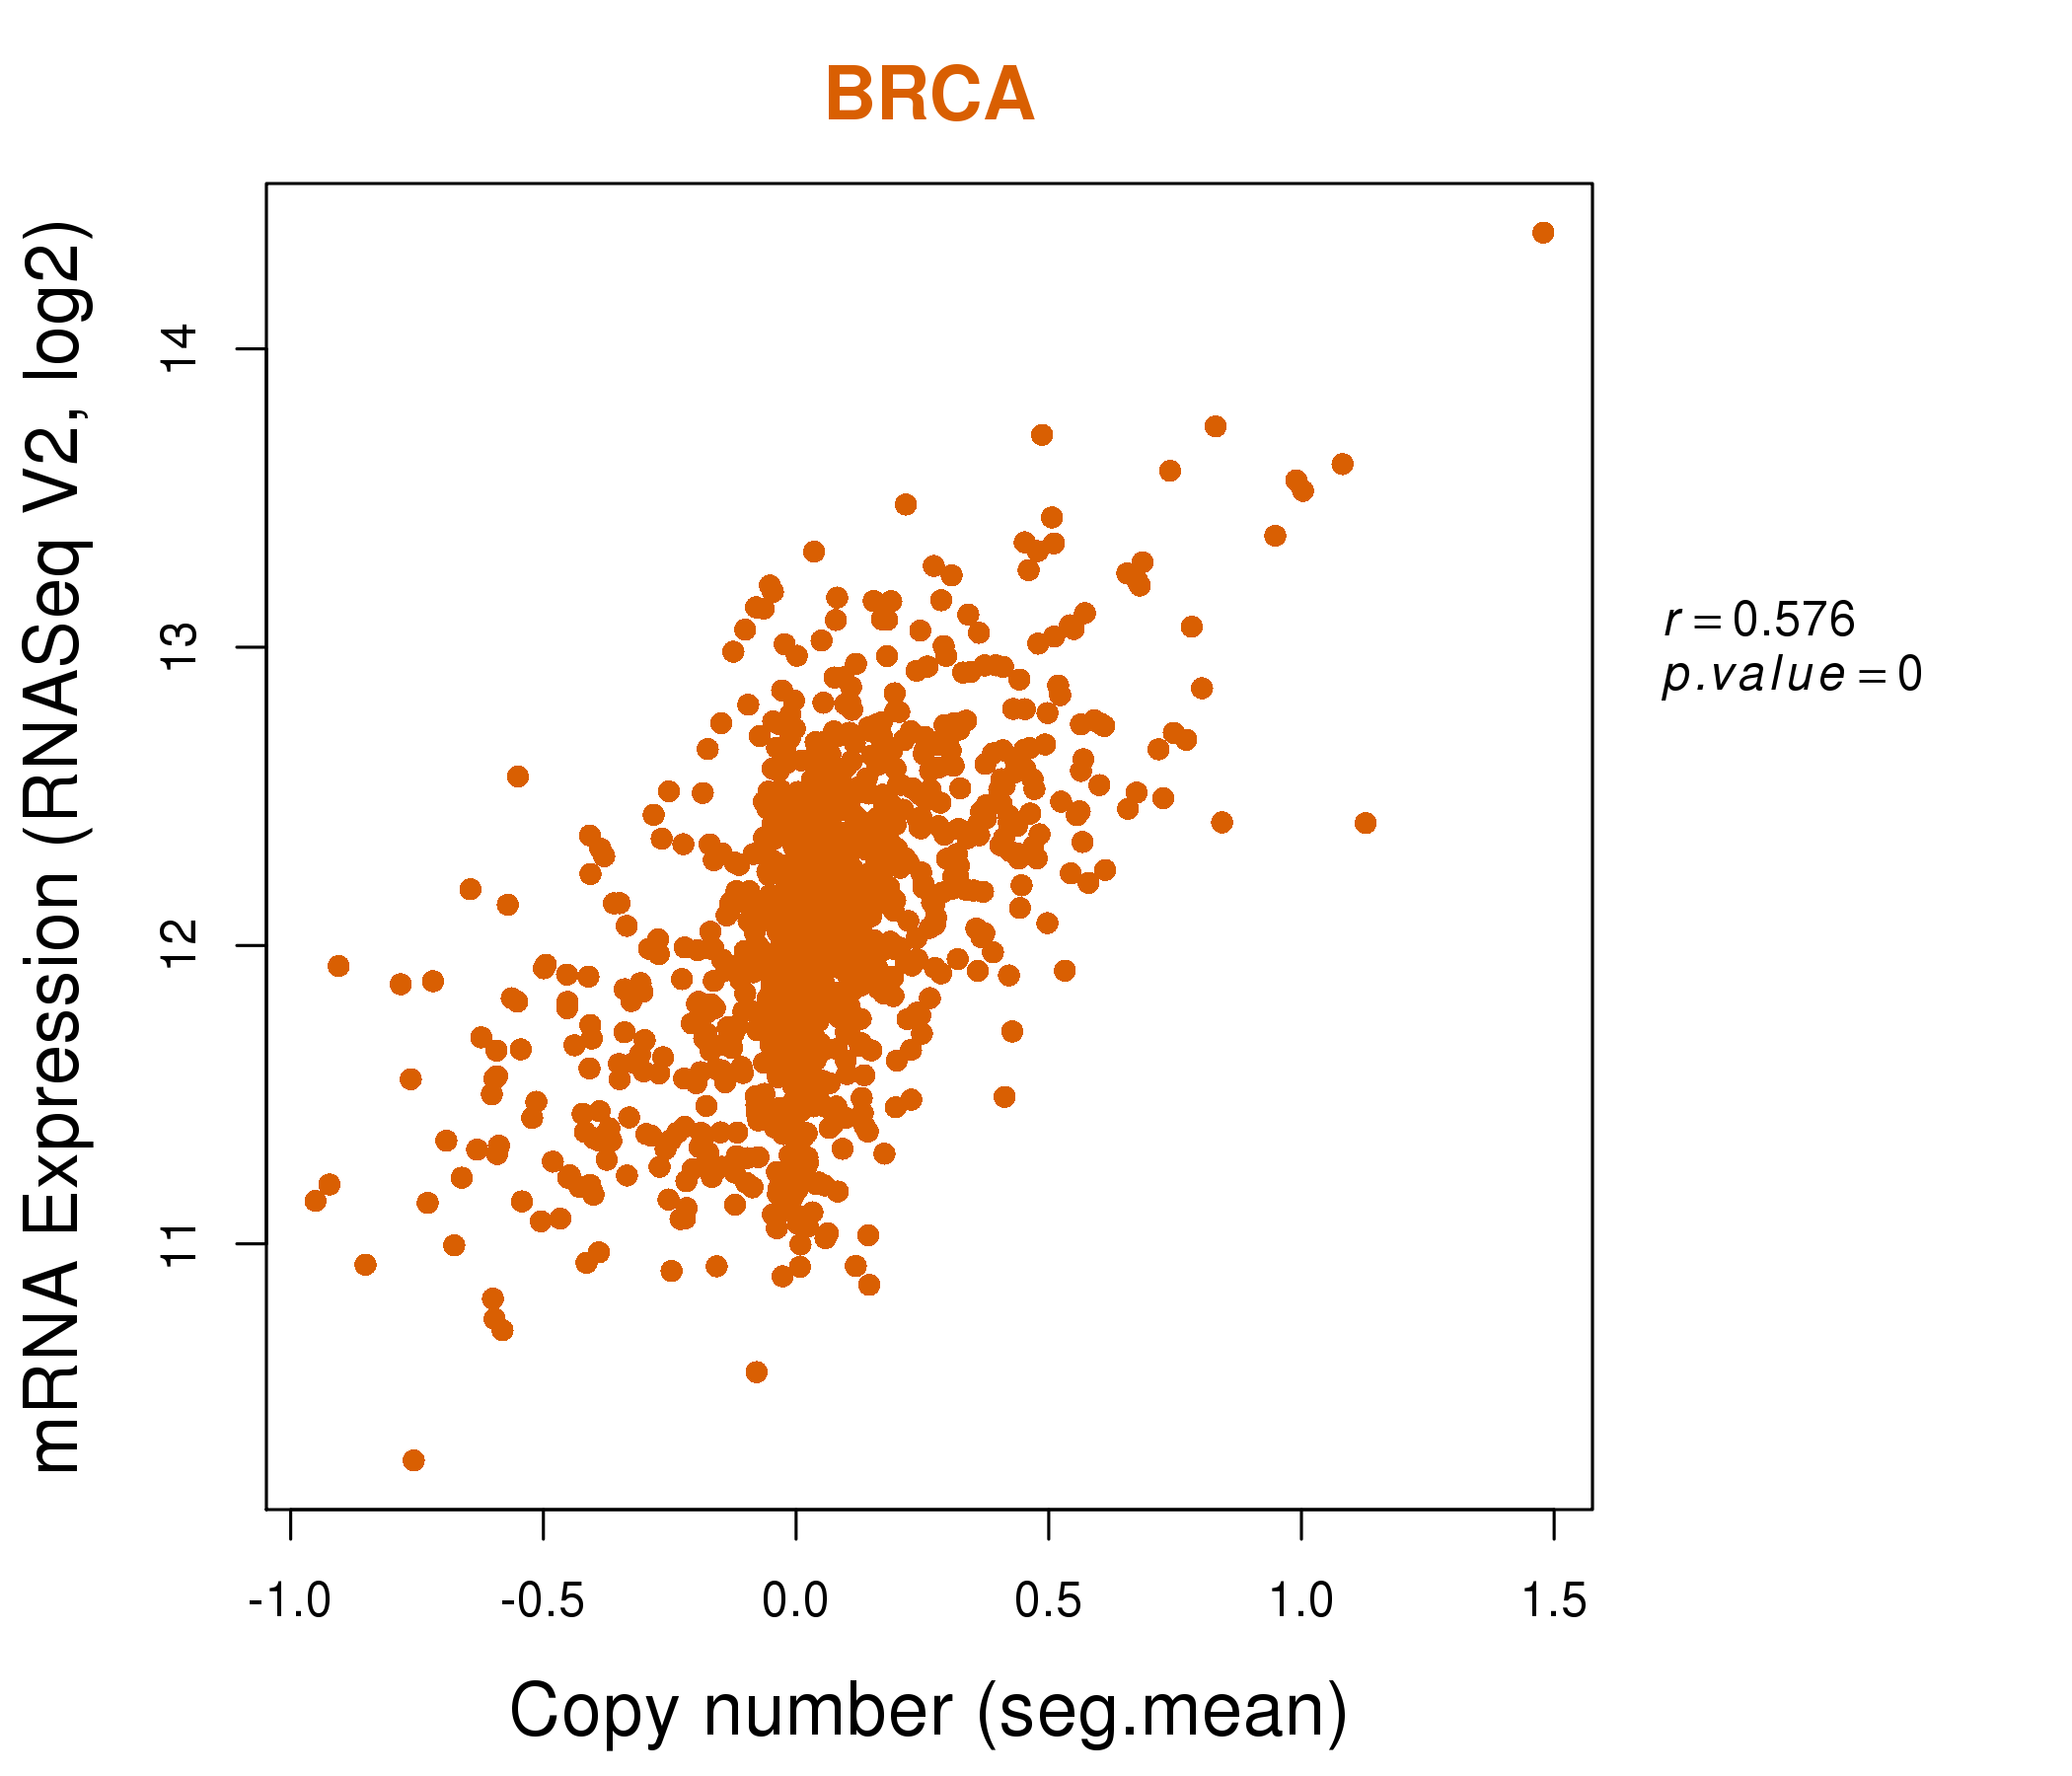
| * Normalized gene expression data of RNASeqV2 was extracted from TCGA using R package TCGA-Assembler. The URLs of all public data files on TCGA DCC data server were gathered at Jan-05-2015. Only eight cancer types have enough normal control samples for differential expression analysis. (t test, adjusted p<0.05 (using Benjamini-Hochberg FDR)) |
 |
| Top |
| * This plots show the correlation between CNV and gene expression. |
: Open all plots for all cancer types
 |
|
 |
|

| Top |
| Gene-Gene Network Information |
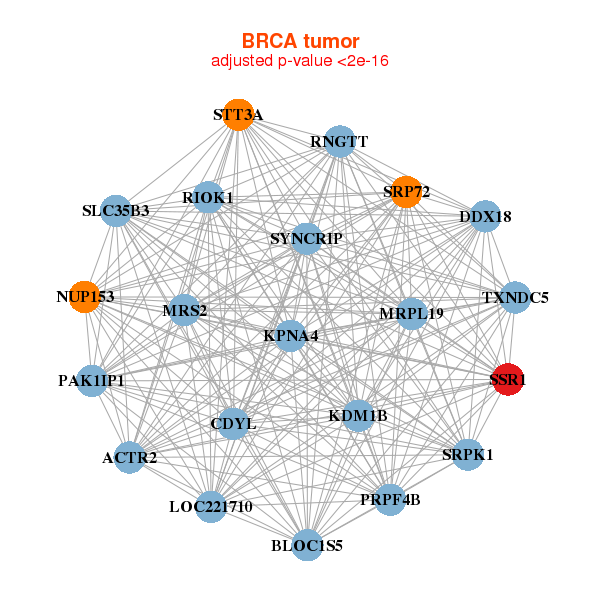
| * Co-Expression network figures were drawn using R package igraph. Only the top 20 genes with the highest correlations were shown. Red circle: input gene, orange circle: cell metabolism gene, sky circle: other gene |
: Open all plots for all cancer types
 |
|
| ACTR2,CDYL,DDX18,KDM1B,KPNA4,LOC221710,MRPL19, MRS2,BLOC1S5,NUP153,PAK1IP1,PRPF4B,RIOK1,RNGTT, SLC35B3,SRP72,SRPK1,SSR1,STT3A,SYNCRIP,TXNDC5 | BET1,HIAT1,HSPA13,NRAS,NUS1,NXT2,RAB14, SLC30A5,SPCS3,SPTLC1,SSR1,TM9SF3,TMED10,TMED2, TMED7,TMX1,TRAM1,TWF1,UBLCP1,UFM1,YIPF5 |
 |
|
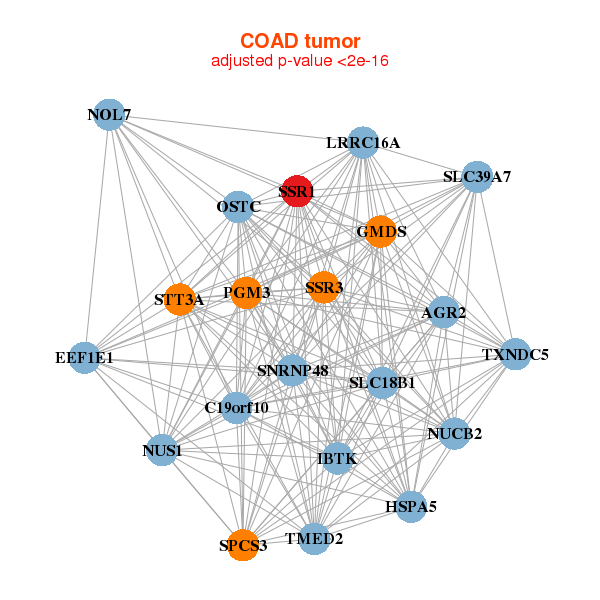
| AGR2,C19orf10,SLC18B1,EEF1E1,GMDS,HSPA5,IBTK, LRRC16A,NOL7,NUCB2,NUS1,OSTC,PGM3,SLC39A7, SNRNP48,SPCS3,SSR1,SSR3,STT3A,TMED2,TXNDC5 | CALR,CANX,CAPRIN1,CRELD2,DNAJB11,DNAJC3,ENO1, HIF1A,HSP90B1,HSPA5,HYOU1,LRRC59,PDIA3,PDIA3P1, PDIA4,PSMD12,RNF145,RPN2,SEC61A1,SSR1,STT3A |
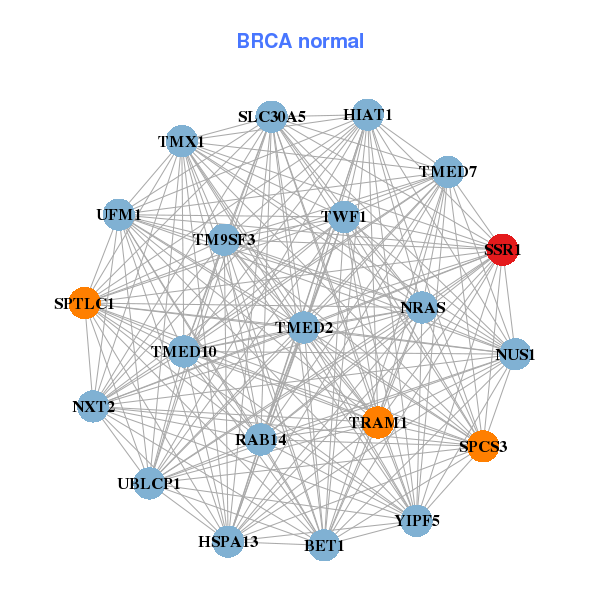
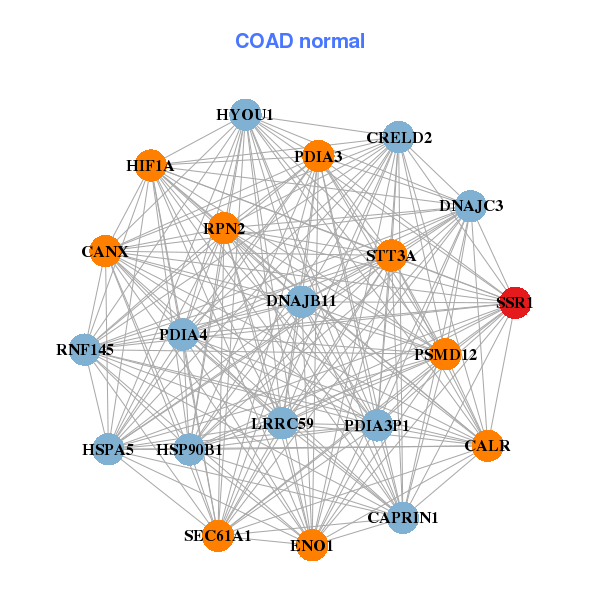
| * Co-Expression network figures were drawn using R package igraph. Only the top 20 genes with the highest correlations were shown. Red circle: input gene, orange circle: cell metabolism gene, sky circle: other gene |
: Open all plots for all cancer types
| Top |
: Open all interacting genes' information including KEGG pathway for all interacting genes from DAVID
| Top |
| Pharmacological Information for SSR1 |
| There's no related Drug. |
| Top |
| Cross referenced IDs for SSR1 |
| * We obtained these cross-references from Uniprot database. It covers 150 different DBs, 18 categories. http://www.uniprot.org/help/cross_references_section |
: Open all cross reference information
|
Copyright © 2016-Present - The Univsersity of Texas Health Science Center at Houston @ |