|
||||||||||||||||||||||||||||||||||||||||||||||||||||||||||||||||||||||||||||||||||||||||||||||||||||||||||||||||||||||||||||||||||||||||||||||||||||||||||||||||||||||||||||||||||||||||||||||||||||||||||||||||||||||||||||||||||||||||||||||||||||||||||||||||||||||||||||||||||||||||||||||||||||||||||||||||||||||||||
| |
| Phenotypic Information (metabolism pathway, cancer, disease, phenome) |
| |
| |
| Gene-Gene Network Information: Co-Expression Network, Interacting Genes & KEGG |
| |
|


| Gene Summary for SSR2 |
| Basic gene info. | Gene symbol | SSR2 |
| Gene name | signal sequence receptor, beta (translocon-associated protein beta) | |
| Synonyms | TLAP|TRAP-BETA|TRAPB | |
| Cytomap | UCSC genome browser: 1q21-q23 | |
| Genomic location | chr1 :155978838-155990758 | |
| Type of gene | protein-coding | |
| RefGenes | NM_003145.3, | |
| Ensembl id | ENSG00000163479 | |
| Description | SSR-betasignal sequence receptor subunit betatranslocon-associated protein betatranslocon-associated protein subunit beta | |
| Modification date | 20141207 | |
| dbXrefs | MIM : 600867 | |
| HGNC : HGNC | ||
| Ensembl : ENSG00000163479 | ||
| HPRD : 02923 | ||
| Vega : OTTHUMG00000017456 | ||
| Protein | UniProt: go to UniProt's Cross Reference DB Table | |
| Expression | CleanEX: HS_SSR2 | |
| BioGPS: 6746 | ||
| Gene Expression Atlas: ENSG00000163479 | ||
| The Human Protein Atlas: ENSG00000163479 | ||
| Pathway | NCI Pathway Interaction Database: SSR2 | |
| KEGG: SSR2 | ||
| REACTOME: SSR2 | ||
| ConsensusPathDB | ||
| Pathway Commons: SSR2 | ||
| Metabolism | MetaCyc: SSR2 | |
| HUMANCyc: SSR2 | ||
| Regulation | Ensembl's Regulation: ENSG00000163479 | |
| miRBase: chr1 :155,978,838-155,990,758 | ||
| TargetScan: NM_003145 | ||
| cisRED: ENSG00000163479 | ||
| Context | iHOP: SSR2 | |
| cancer metabolism search in PubMed: SSR2 | ||
| UCL Cancer Institute: SSR2 | ||
| Assigned class in ccmGDB | C | |
| Top |
| Phenotypic Information for SSR2(metabolism pathway, cancer, disease, phenome) |
| Cancer | CGAP: SSR2 |
| Familial Cancer Database: SSR2 | |
| * This gene is included in those cancer gene databases. |
|
|
|
|
|
| . | ||||||||||||||||||||||||||||||||||||||||||||||||||||||||||||||||||||||||||||||||||||||||||||||||||||||||||||||||||||||||||||||||||||||||||||||||||||||||||||||||||||||||||||||||||||||||||||||||||||||||||||||||||||||||||||||||||||||||||||||||||||||||||||||||||||||||||||||||||||||||||||||||||||||||||||||||||||
Oncogene 1 | Significant driver gene in | |||||||||||||||||||||||||||||||||||||||||||||||||||||||||||||||||||||||||||||||||||||||||||||||||||||||||||||||||||||||||||||||||||||||||||||||||||||||||||||||||||||||||||||||||||||||||||||||||||||||||||||||||||||||||||||||||||||||||||||||||||||||||||||||||||||||||||||||||||||||||||||||||||||||||||||||||||||||||
| cf) number; DB name 1 Oncogene; http://nar.oxfordjournals.org/content/35/suppl_1/D721.long, 2 Tumor Suppressor gene; https://bioinfo.uth.edu/TSGene/, 3 Cancer Gene Census; http://www.nature.com/nrc/journal/v4/n3/abs/nrc1299.html, 4 CancerGenes; http://nar.oxfordjournals.org/content/35/suppl_1/D721.long, 5 Network of Cancer Gene; http://ncg.kcl.ac.uk/index.php, 1Therapeutic Vulnerabilities in Cancer; http://cbio.mskcc.org/cancergenomics/statius/ |
| REACTOME_METABOLISM_OF_PROTEINS | |
| OMIM | |
| Orphanet | |
| Disease | KEGG Disease: SSR2 |
| MedGen: SSR2 (Human Medical Genetics with Condition) | |
| ClinVar: SSR2 | |
| Phenotype | MGI: SSR2 (International Mouse Phenotyping Consortium) |
| PhenomicDB: SSR2 | |
| Mutations for SSR2 |
| * Under tables are showing count per each tissue to give us broad intuition about tissue specific mutation patterns.You can go to the detailed page for each mutation database's web site. |
| There's no structural variation information in COSMIC data for this gene. |
| * From mRNA Sanger sequences, Chitars2.0 arranged chimeric transcripts. This table shows SSR2 related fusion information. |
| ID | Head Gene | Tail Gene | Accession | Gene_a | qStart_a | qEnd_a | Chromosome_a | tStart_a | tEnd_a | Gene_a | qStart_a | qEnd_a | Chromosome_a | tStart_a | tEnd_a |
| CA335796 | SSR2 | 1 | 230 | 1 | 155979019 | 155979248 | ZNF738 | 225 | 608 | 19 | 21561632 | 21562015 | |
| AA576517 | SSR2 | 1 | 155 | 1 | 155978843 | 155978997 | AAK1 | 151 | 437 | 2 | 69746092 | 69746377 | |
| AA372679 | SSR2 | 1 | 58 | 1 | 155979239 | 155979296 | SSR2 | 56 | 303 | 1 | 155978969 | 155979215 | |
| BF326256 | IGF2BP3 | 3 | 205 | 7 | 23436312 | 23436512 | SSR2 | 195 | 597 | 1 | 155979325 | 155988158 | |
| BE837584 | FUCA2 | 1 | 196 | 6 | 143816937 | 143823381 | SSR2 | 181 | 635 | 1 | 155979271 | 155988155 | |
| BM811163 | PAPD7 | 23 | 120 | 5 | 6753025 | 6753123 | SSR2 | 118 | 850 | 1 | 155979190 | 155990704 | |
| Top |
| Mutation type/ Tissue ID | brca | cns | cerv | endome | haematopo | kidn | Lintest | liver | lung | ns | ovary | pancre | prost | skin | stoma | thyro | urina | |||
| Total # sample | 1 | 1 | 1 | |||||||||||||||||
| GAIN (# sample) | 1 | 1 | 1 | |||||||||||||||||
| LOSS (# sample) |
| cf) Tissue ID; Tissue type (1; Breast, 2; Central_nervous_system, 3; Cervix, 4; Endometrium, 5; Haematopoietic_and_lymphoid_tissue, 6; Kidney, 7; Large_intestine, 8; Liver, 9; Lung, 10; NS, 11; Ovary, 12; Pancreas, 13; Prostate, 14; Skin, 15; Stomach, 16; Thyroid, 17; Urinary_tract) |
| Top |
|
 |
| Top |
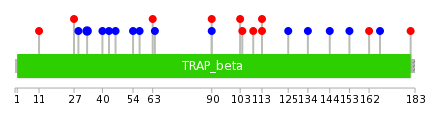
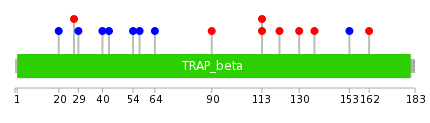
| Stat. for Non-Synonymous SNVs (# total SNVs=12) | (# total SNVs=9) |
 |  |
(# total SNVs=0) | (# total SNVs=0) |
| Top |
| * When you move the cursor on each content, you can see more deailed mutation information on the Tooltip. Those are primary_site,primary_histology,mutation(aa),pubmedID. |
| GRCh37 position | Mutation(aa) | Unique sampleID count |
| chr1:155989853-155989853 | p.E36* | 2 |
| chr1:155989860-155989860 | p.Y33Y | 2 |
| chr1:155981618-155981618 | p.R142* | 2 |
| chr1:155984806-155984806 | p.F103L | 1 |
| chr1:155989841-155989841 | p.L40L | 1 |
| chr1:155979398-155979398 | p.G162D | 1 |
| chr1:155984845-155984845 | p.S90S | 1 |
| chr1:155979424-155979424 | p.F153F | 1 |
| chr1:155984846-155984846 | p.S90F | 1 |
| chr1:155981610-155981610 | p.S144S | 1 |
| Top |
|
 |
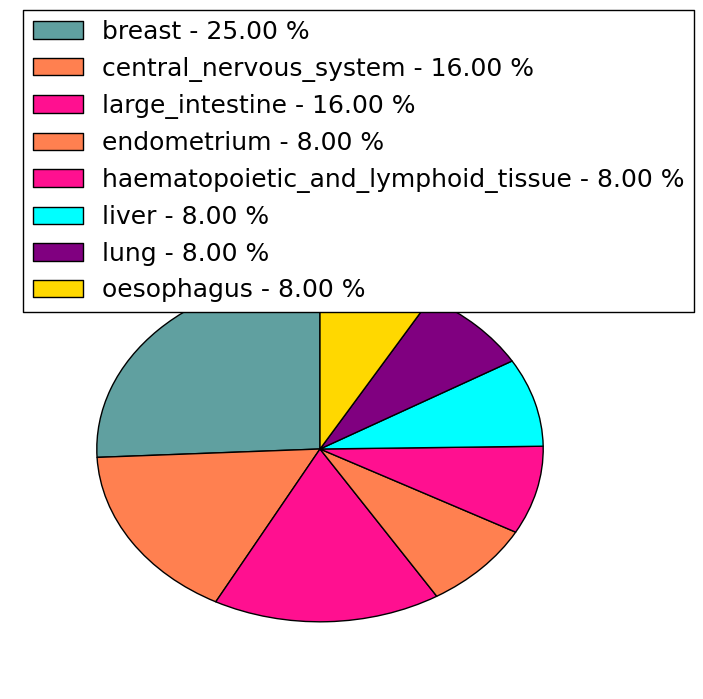
| Point Mutation/ Tissue ID | 1 | 2 | 3 | 4 | 5 | 6 | 7 | 8 | 9 | 10 | 11 | 12 | 13 | 14 | 15 | 16 | 17 | 18 | 19 | 20 |
| # sample | 1 | 1 | 1 | 2 | 2 | 1 | 1 | 3 | 3 | 1 | ||||||||||
| # mutation | 1 | 1 | 1 | 2 | 2 | 1 | 1 | 3 | 3 | 1 | ||||||||||
| nonsynonymous SNV | 1 | 2 | 1 | 1 | 2 | 1 | ||||||||||||||
| synonymous SNV | 1 | 1 | 1 | 1 | 1 | 2 | 1 |
| cf) Tissue ID; Tissue type (1; BLCA[Bladder Urothelial Carcinoma], 2; BRCA[Breast invasive carcinoma], 3; CESC[Cervical squamous cell carcinoma and endocervical adenocarcinoma], 4; COAD[Colon adenocarcinoma], 5; GBM[Glioblastoma multiforme], 6; Glioma Low Grade, 7; HNSC[Head and Neck squamous cell carcinoma], 8; KICH[Kidney Chromophobe], 9; KIRC[Kidney renal clear cell carcinoma], 10; KIRP[Kidney renal papillary cell carcinoma], 11; LAML[Acute Myeloid Leukemia], 12; LUAD[Lung adenocarcinoma], 13; LUSC[Lung squamous cell carcinoma], 14; OV[Ovarian serous cystadenocarcinoma ], 15; PAAD[Pancreatic adenocarcinoma], 16; PRAD[Prostate adenocarcinoma], 17; SKCM[Skin Cutaneous Melanoma], 18:STAD[Stomach adenocarcinoma], 19:THCA[Thyroid carcinoma], 20:UCEC[Uterine Corpus Endometrial Carcinoma]) |
| Top |
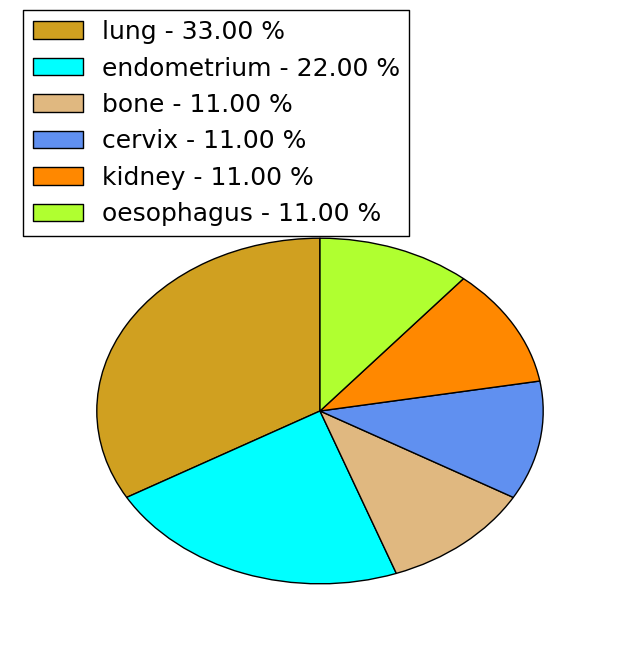
| * We represented just top 10 SNVs. When you move the cursor on each content, you can see more deailed mutation information on the Tooltip. Those are primary_site, primary_histology, mutation(aa), pubmedID. |
| Genomic Position | Mutation(aa) | Unique sampleID count |
| chr1:155989841 | p.F153F | 1 |
| chr1:155981632 | p.R137L | 1 |
| chr1:155989874 | p.Q130H | 1 |
| chr1:155981652 | p.V121L | 1 |
| chr1:155989878 | p.L113P | 1 |
| chr1:155984754 | p.L113M | 1 |
| chr1:155989899 | p.S90F | 1 |
| chr1:155984777 | p.F64F | 1 |
| chr1:155984778 | p.V57V | 1 |
| chr1:155984846 | p.A54A | 1 |
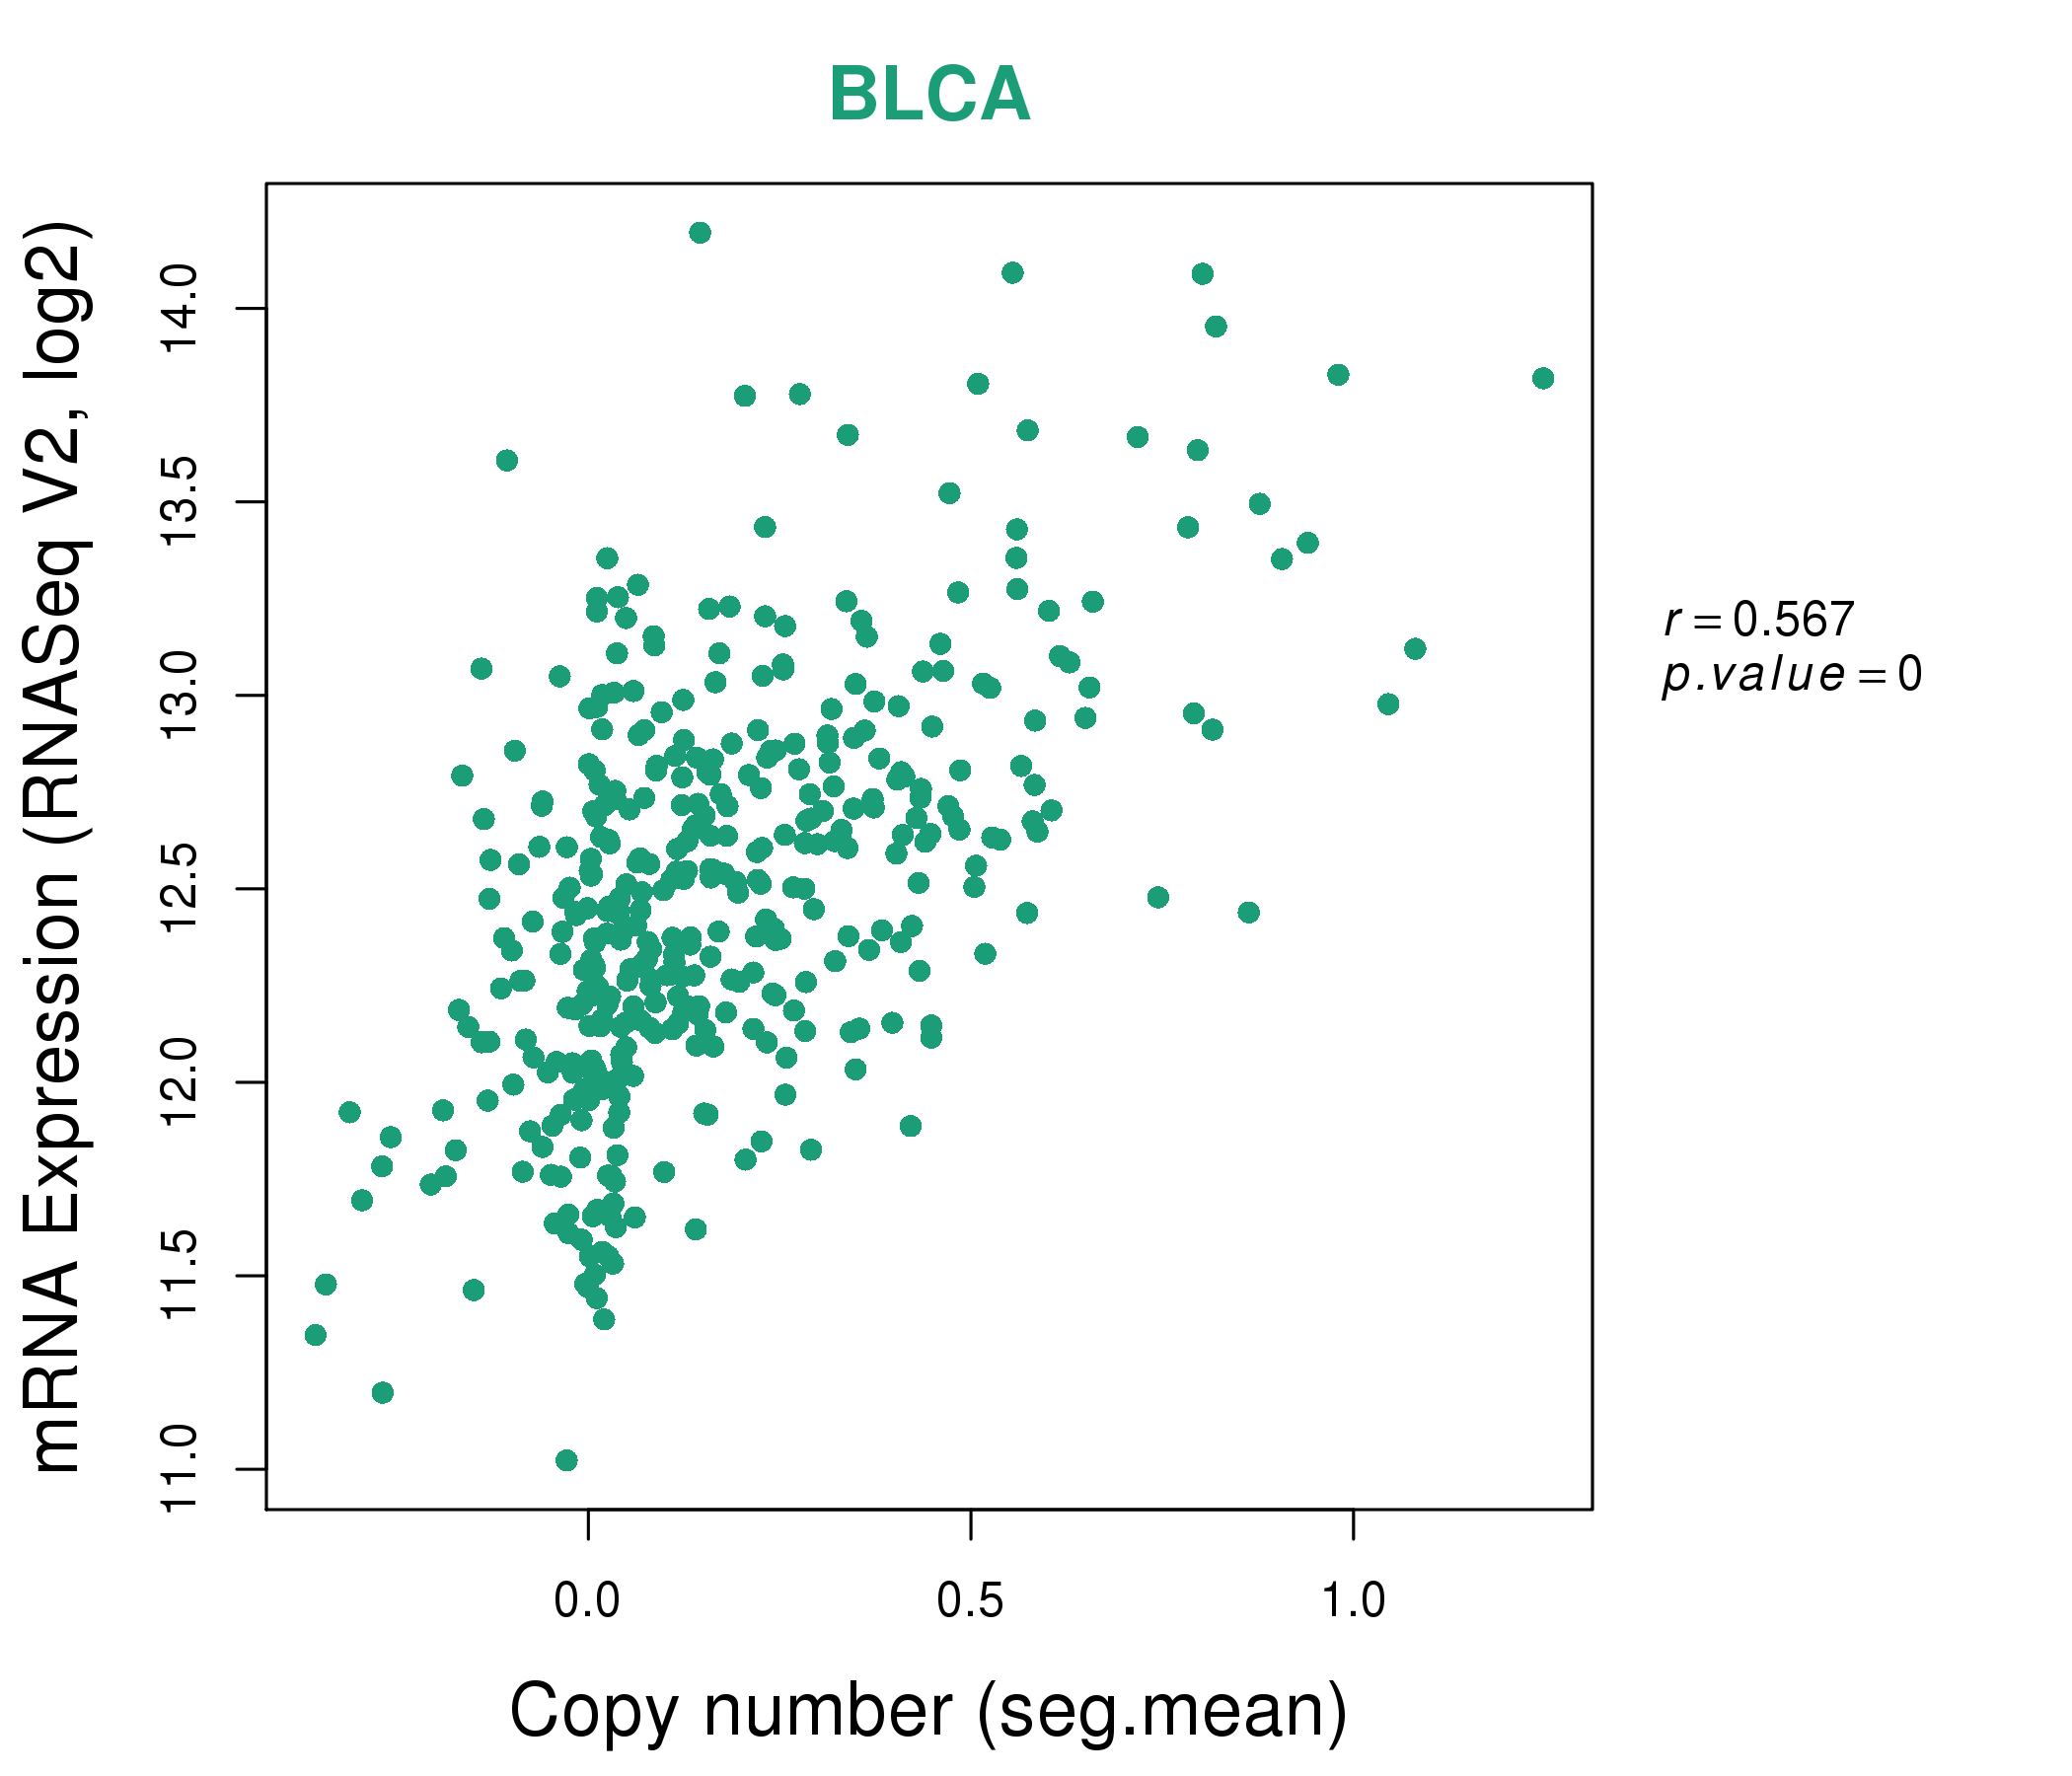
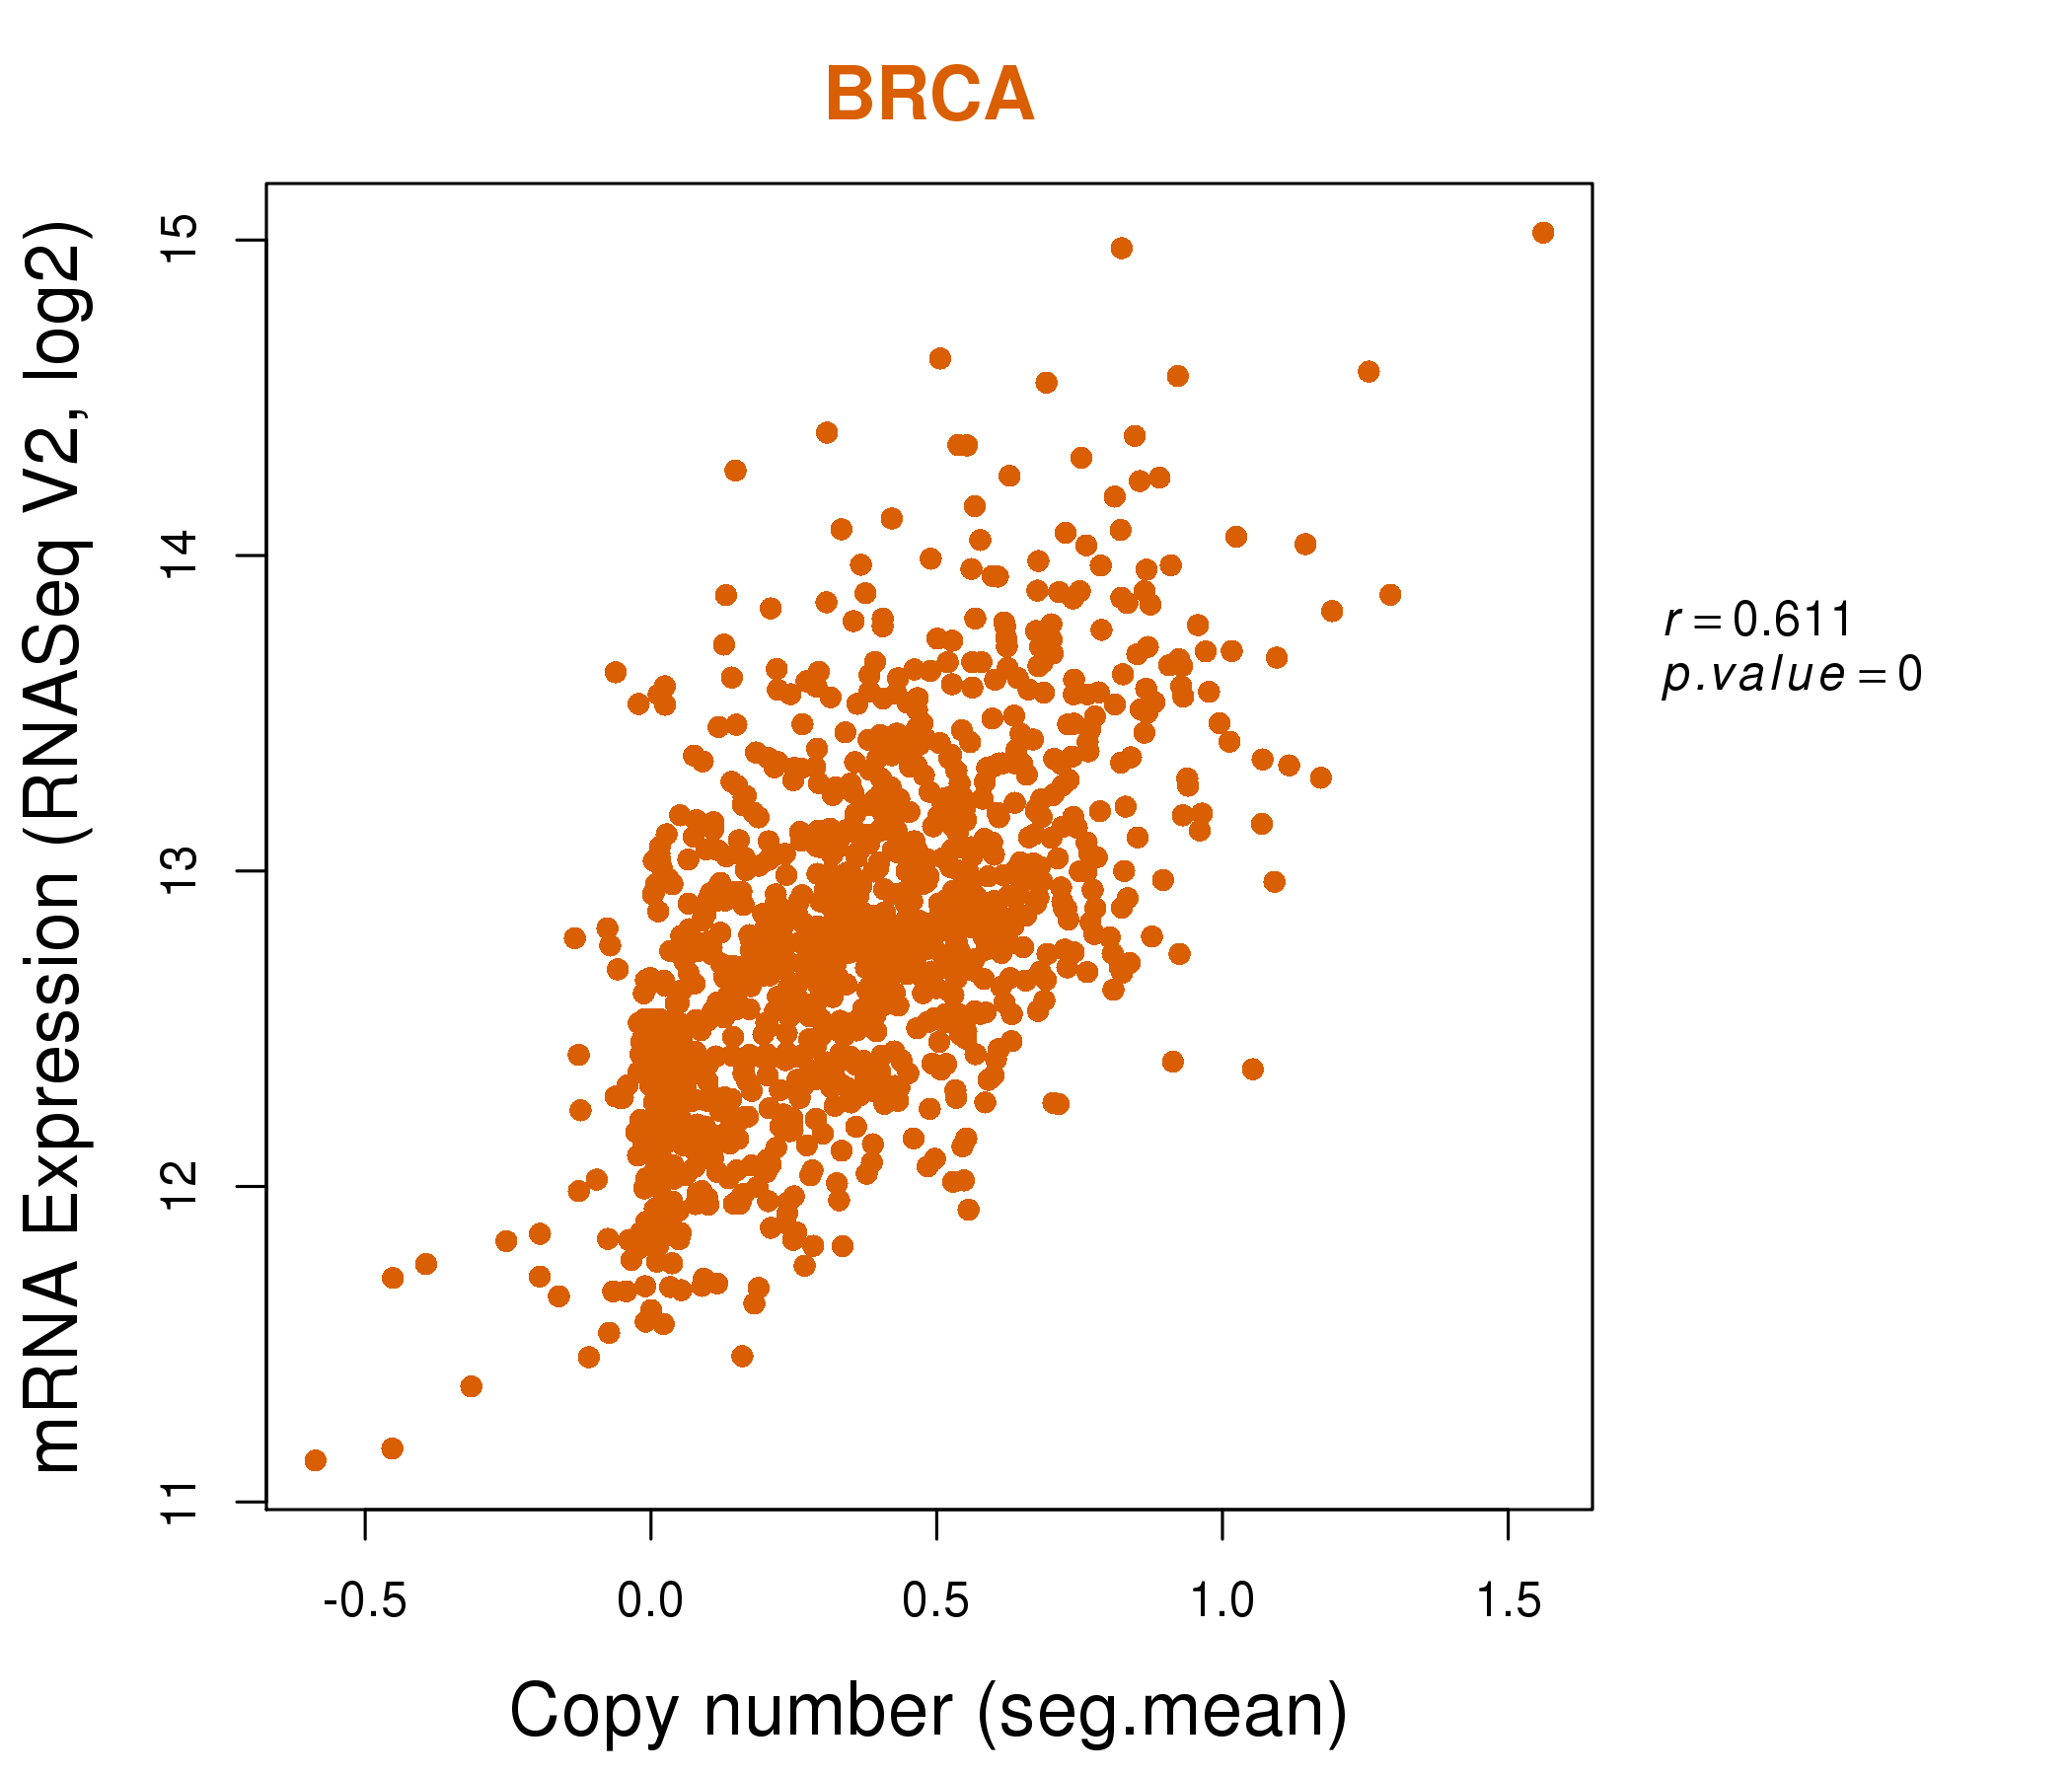
| * Copy number data were extracted from TCGA using R package TCGA-Assembler. The URLs of all public data files on TCGA DCC data server were gathered on Jan-05-2015. Function ProcessCNAData in TCGA-Assembler package was used to obtain gene-level copy number value which is calculated as the average copy number of the genomic region of a gene. |
 |
| cf) Tissue ID[Tissue type]: BLCA[Bladder Urothelial Carcinoma], BRCA[Breast invasive carcinoma], CESC[Cervical squamous cell carcinoma and endocervical adenocarcinoma], COAD[Colon adenocarcinoma], GBM[Glioblastoma multiforme], Glioma Low Grade, HNSC[Head and Neck squamous cell carcinoma], KICH[Kidney Chromophobe], KIRC[Kidney renal clear cell carcinoma], KIRP[Kidney renal papillary cell carcinoma], LAML[Acute Myeloid Leukemia], LUAD[Lung adenocarcinoma], LUSC[Lung squamous cell carcinoma], OV[Ovarian serous cystadenocarcinoma ], PAAD[Pancreatic adenocarcinoma], PRAD[Prostate adenocarcinoma], SKCM[Skin Cutaneous Melanoma], STAD[Stomach adenocarcinoma], THCA[Thyroid carcinoma], UCEC[Uterine Corpus Endometrial Carcinoma] |
| Top |
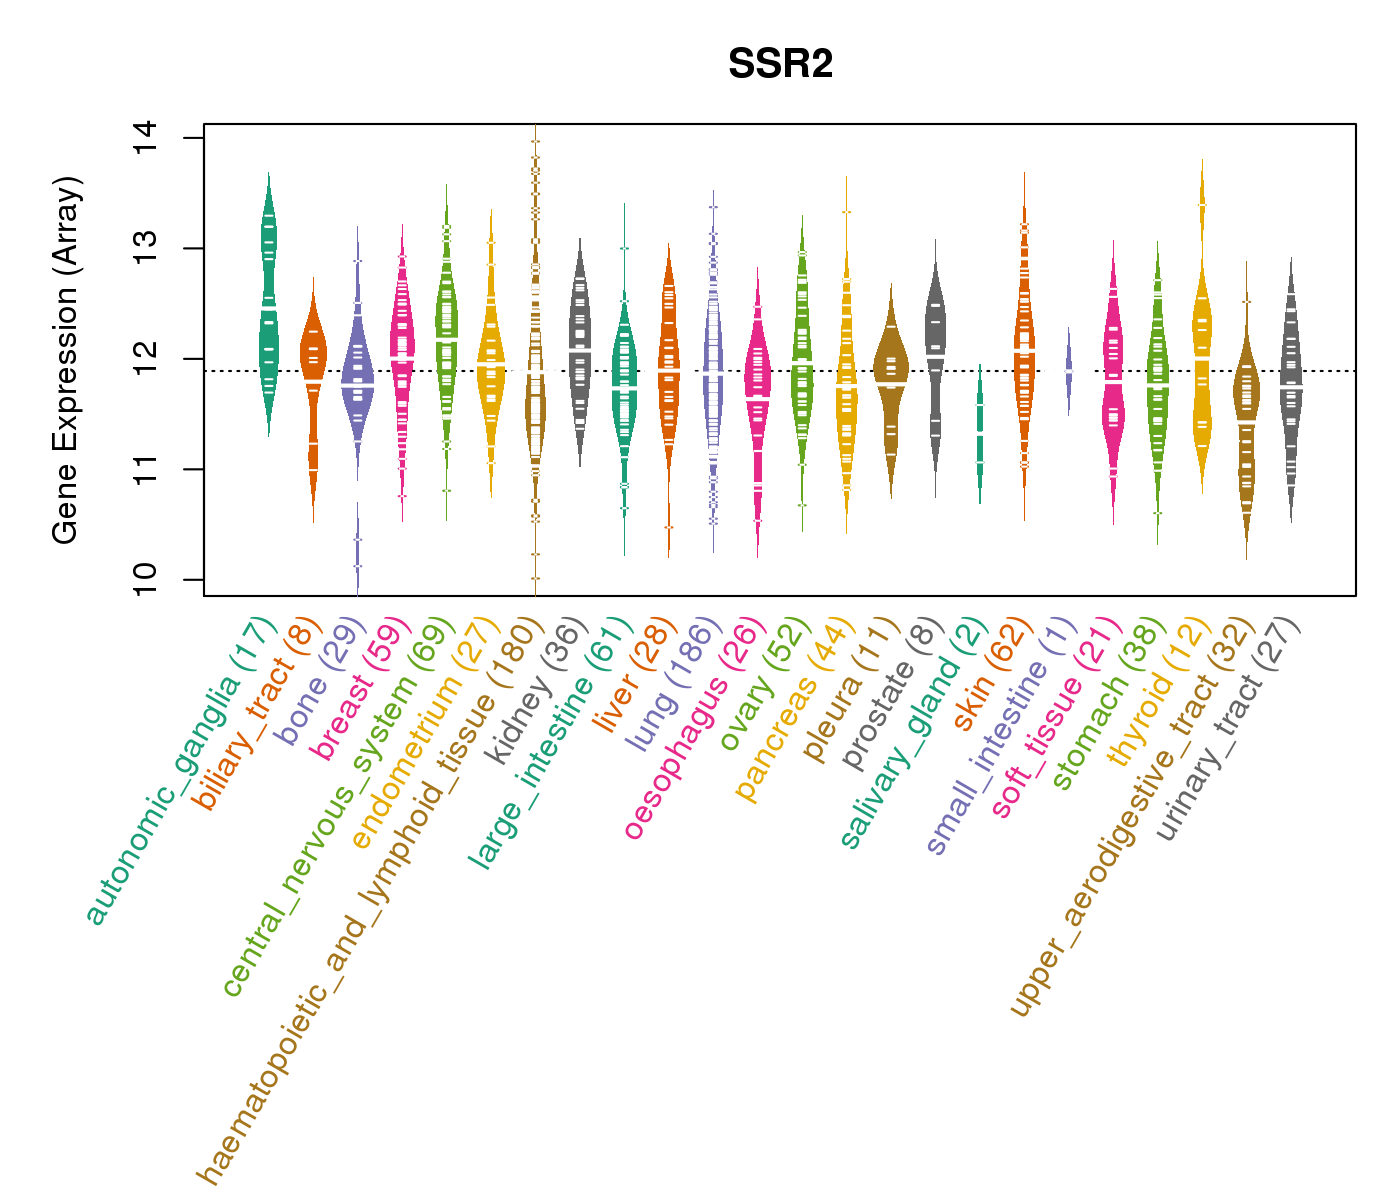
| Gene Expression for SSR2 |
| * CCLE gene expression data were extracted from CCLE_Expression_Entrez_2012-10-18.res: Gene-centric RMA-normalized mRNA expression data. |
 |
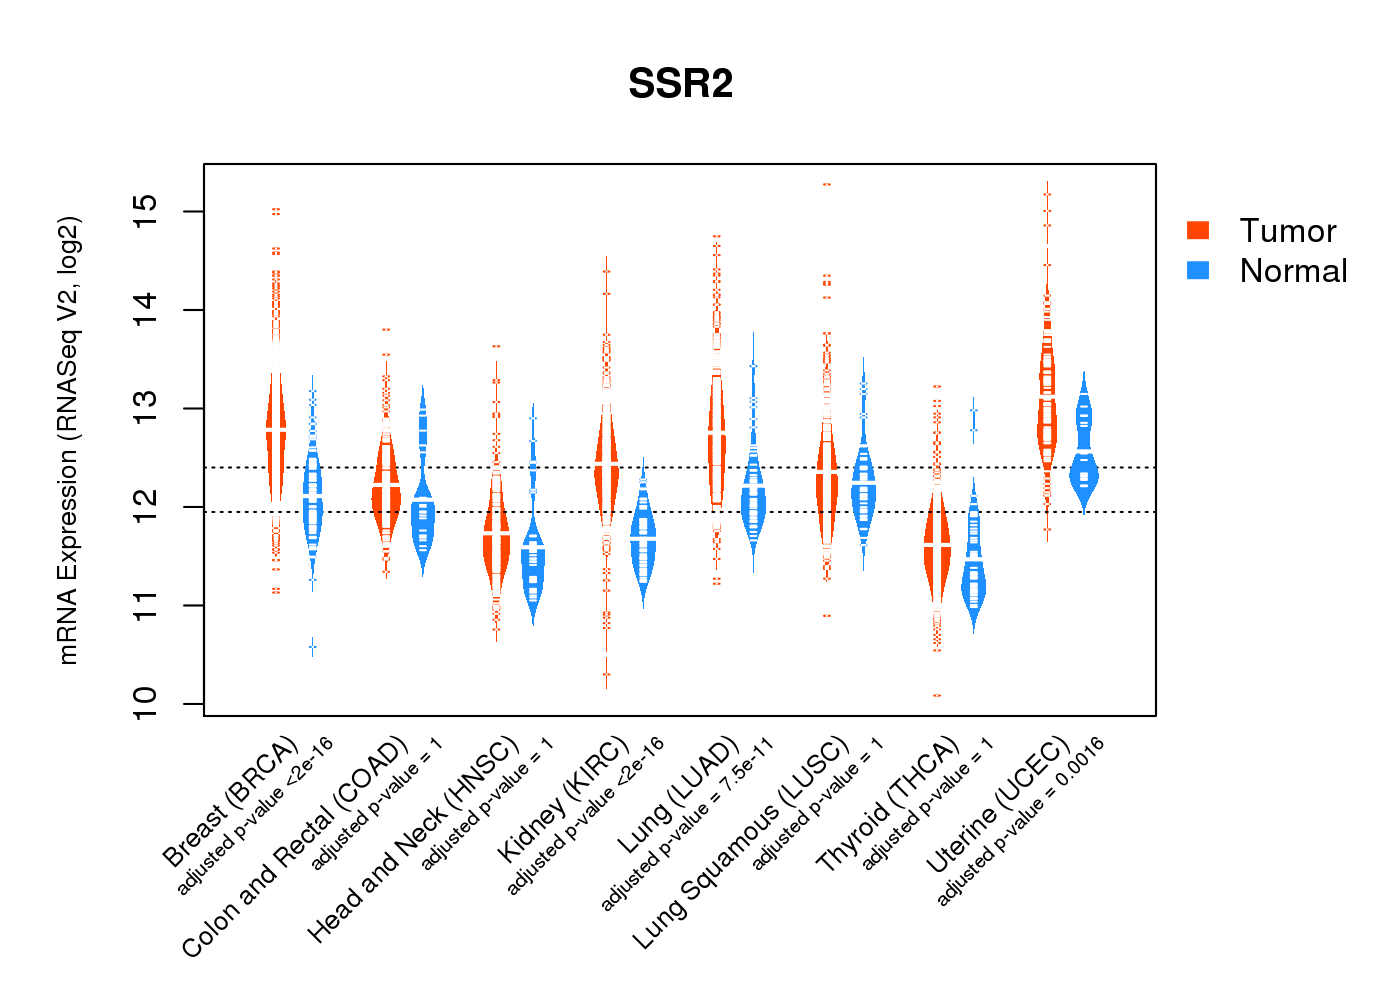
| * Normalized gene expression data of RNASeqV2 was extracted from TCGA using R package TCGA-Assembler. The URLs of all public data files on TCGA DCC data server were gathered at Jan-05-2015. Only eight cancer types have enough normal control samples for differential expression analysis. (t test, adjusted p<0.05 (using Benjamini-Hochberg FDR)) |
 |
| Top |
| * This plots show the correlation between CNV and gene expression. |
: Open all plots for all cancer types
 |
|
 |
|

| Top |
| Gene-Gene Network Information |
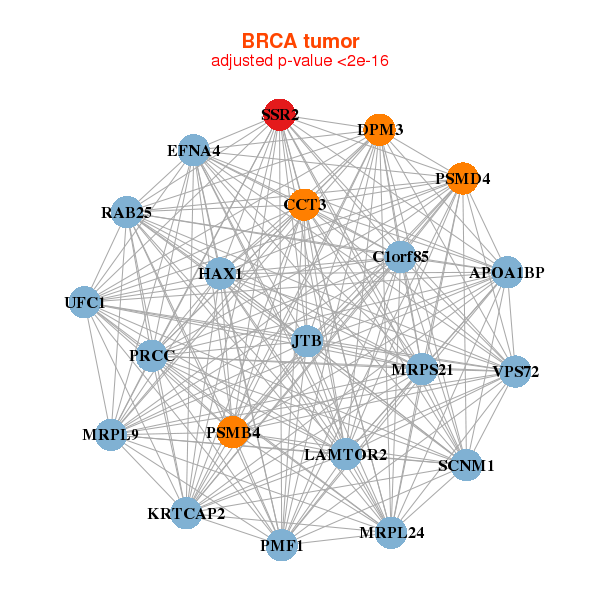
| * Co-Expression network figures were drawn using R package igraph. Only the top 20 genes with the highest correlations were shown. Red circle: input gene, orange circle: cell metabolism gene, sky circle: other gene |
: Open all plots for all cancer types
 |
|
| APOA1BP,C1orf85,CCT3,DPM3,EFNA4,HAX1,JTB, KRTCAP2,MRPL24,MRPL9,MRPS21,PMF1,PRCC,PSMB4, PSMD4,RAB25,LAMTOR2,SCNM1,SSR2,UFC1,VPS72 | BTF3,COPZ1,CUTA,DGUOK,ERGIC3,GNB2L1,LSM2, PPIA,PPIH,RPL10A,RPL24,RPL27A,RPL35A,RPL41, RPS11,RPS24,RPS4X,RPS7,RPSAP58,SNRPF,SSR2 |
 |
|
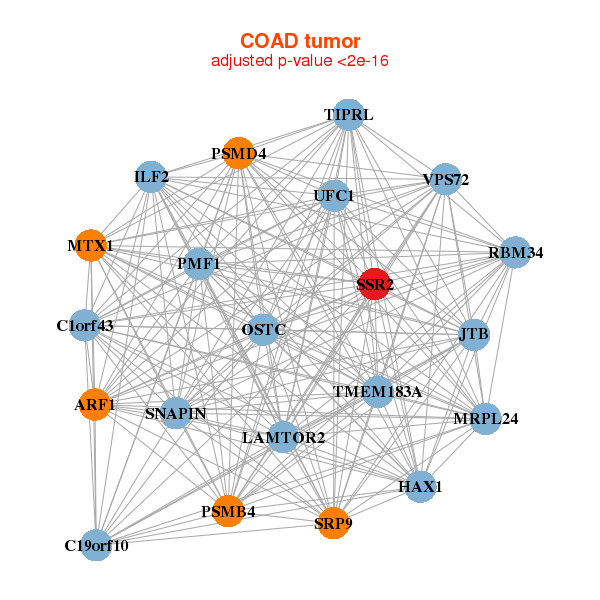
| ARF1,C19orf10,C1orf43,HAX1,ILF2,JTB,MRPL24, MTX1,OSTC,PMF1,PSMB4,PSMD4,RBM34,LAMTOR2, SNAPIN,SRP9,SSR2,TIPRL,TMEM183A,UFC1,VPS72 | ALG5,C12orf57,TIMMDC1,COPZ1,DPY30,EEF1B2,MCEE, NAA20,OSTC,RPL24,RPL27A,RPL35,RPL35A,RPL41, RPS3A,RPS6,RPSAP58,SERF2,SNRPD2,SSR2,UFC1 |
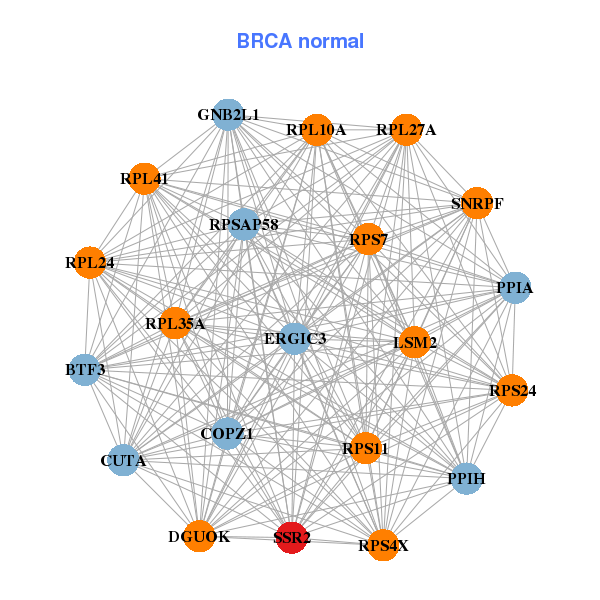
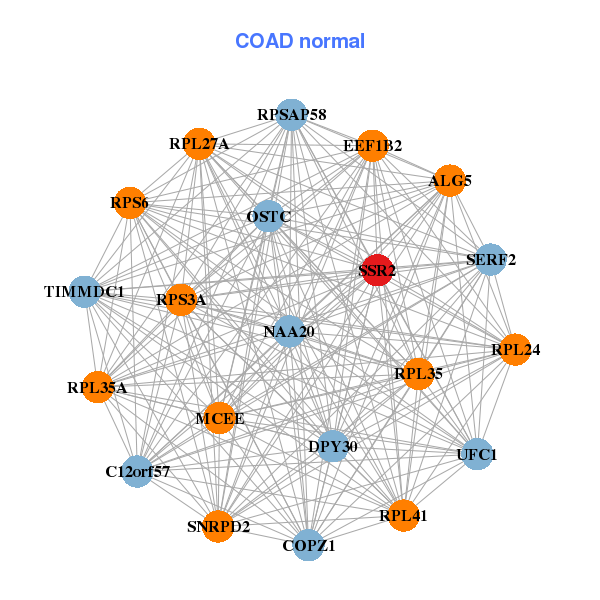
| * Co-Expression network figures were drawn using R package igraph. Only the top 20 genes with the highest correlations were shown. Red circle: input gene, orange circle: cell metabolism gene, sky circle: other gene |
: Open all plots for all cancer types
| Top |
: Open all interacting genes' information including KEGG pathway for all interacting genes from DAVID
| Top |
| Pharmacological Information for SSR2 |
| There's no related Drug. |
| Top |
| Cross referenced IDs for SSR2 |
| * We obtained these cross-references from Uniprot database. It covers 150 different DBs, 18 categories. http://www.uniprot.org/help/cross_references_section |
: Open all cross reference information
|
Copyright © 2016-Present - The Univsersity of Texas Health Science Center at Houston @ |