|
||||||||||||||||||||
| |
| Phenotypic Information (metabolism pathway, cancer, disease, phenome) |
| |
| |
| Gene-Gene Network Information: Co-Expression Network, Interacting Genes & KEGG |
| |
|


| Gene Summary for SSR3 |
| Basic gene info. | Gene symbol | SSR3 |
| Gene name | signal sequence receptor, gamma (translocon-associated protein gamma) | |
| Synonyms | TRAPG | |
| Cytomap | UCSC genome browser: 3q25.31 | |
| Genomic location | chr3 :156257928-156272973 | |
| Type of gene | protein-coding | |
| RefGenes | NM_007107.3, | |
| Ensembl id | ENSG00000114850 | |
| Description | SSR gammaSSR-gammaTRAP-complex gamma subunitTRAP-gammasignal sequence receptor subunit gammatranslocon-associated protein gamma subunittranslocon-associated protein subunit gamma | |
| Modification date | 20141207 | |
| dbXrefs | MIM : 606213 | |
| HGNC : HGNC | ||
| Ensembl : ENSG00000114850 | ||
| HPRD : 16206 | ||
| Vega : OTTHUMG00000158632 | ||
| Protein | UniProt: go to UniProt's Cross Reference DB Table | |
| Expression | CleanEX: HS_SSR3 | |
| BioGPS: 6747 | ||
| Gene Expression Atlas: ENSG00000114850 | ||
| The Human Protein Atlas: ENSG00000114850 | ||
| Pathway | NCI Pathway Interaction Database: SSR3 | |
| KEGG: SSR3 | ||
| REACTOME: SSR3 | ||
| ConsensusPathDB | ||
| Pathway Commons: SSR3 | ||
| Metabolism | MetaCyc: SSR3 | |
| HUMANCyc: SSR3 | ||
| Regulation | Ensembl's Regulation: ENSG00000114850 | |
| miRBase: chr3 :156,257,928-156,272,973 | ||
| TargetScan: NM_007107 | ||
| cisRED: ENSG00000114850 | ||
| Context | iHOP: SSR3 | |
| cancer metabolism search in PubMed: SSR3 | ||
| UCL Cancer Institute: SSR3 | ||
| Assigned class in ccmGDB | C | |
| Top |
| Phenotypic Information for SSR3(metabolism pathway, cancer, disease, phenome) |
| Cancer | CGAP: SSR3 |
| Familial Cancer Database: SSR3 | |
| * This gene is included in those cancer gene databases. |
|
|
|
|
|
| . | ||||||||||||||
Oncogene 1 | Significant driver gene in | |||||||||||||||||||
| cf) number; DB name 1 Oncogene; http://nar.oxfordjournals.org/content/35/suppl_1/D721.long, 2 Tumor Suppressor gene; https://bioinfo.uth.edu/TSGene/, 3 Cancer Gene Census; http://www.nature.com/nrc/journal/v4/n3/abs/nrc1299.html, 4 CancerGenes; http://nar.oxfordjournals.org/content/35/suppl_1/D721.long, 5 Network of Cancer Gene; http://ncg.kcl.ac.uk/index.php, 1Therapeutic Vulnerabilities in Cancer; http://cbio.mskcc.org/cancergenomics/statius/ |
| REACTOME_METABOLISM_OF_PROTEINS | |
| OMIM | |
| Orphanet | |
| Disease | KEGG Disease: SSR3 |
| MedGen: SSR3 (Human Medical Genetics with Condition) | |
| ClinVar: SSR3 | |
| Phenotype | MGI: SSR3 (International Mouse Phenotyping Consortium) |
| PhenomicDB: SSR3 | |
| Mutations for SSR3 |
| * Under tables are showing count per each tissue to give us broad intuition about tissue specific mutation patterns.You can go to the detailed page for each mutation database's web site. |
| There's no structural variation information in COSMIC data for this gene. |
| * From mRNA Sanger sequences, Chitars2.0 arranged chimeric transcripts. This table shows SSR3 related fusion information. |
| ID | Head Gene | Tail Gene | Accession | Gene_a | qStart_a | qEnd_a | Chromosome_a | tStart_a | tEnd_a | Gene_a | qStart_a | qEnd_a | Chromosome_a | tStart_a | tEnd_a |
| BP379122 | SSR3 | 2 | 408 | 3 | 156266669 | 156272897 | UBA3 | 401 | 551 | 3 | 69126984 | 69129507 | |
| AW168600 | SSR3 | 10 | 118 | 3 | 156257933 | 156258040 | MACF1 | 104 | 296 | 1 | 39881325 | 39881517 | |
| AW838201 | SSR3 | 1 | 159 | 3 | 156260819 | 156260977 | SSR3 | 157 | 394 | 3 | 156259374 | 156259611 | |
| AI159851 | SSR3 | 1 | 226 | 3 | 156257933 | 156258158 | KIF3B | 224 | 467 | 20 | 30920942 | 30921185 | |
| AI973221 | SSR3 | 1 | 170 | 3 | 156259099 | 156259268 | CPEB4 | 163 | 399 | 5 | 173384876 | 173385112 | |
| AW838512 | SSR3 | 19 | 307 | 3 | 156260688 | 156260977 | SSR3 | 305 | 404 | 3 | 156259374 | 156259473 | |
| BQ772087 | SSR3 | 19 | 314 | 3 | 156259100 | 156259394 | PRPF6 | 311 | 756 | 20 | 62613241 | 62613686 | |
| AI096496 | SSR3 | 1 | 224 | 3 | 156257935 | 156258158 | KIF3B | 222 | 500 | 20 | 30920907 | 30921185 | |
| AW994363 | SSR3 | 1 | 478 | 3 | 156261017 | 156272827 | SATB1 | 475 | 665 | 3 | 18419661 | 18428351 | |
| AI380153 | SSR3 | 1 | 222 | 3 | 156257937 | 156258158 | KIF3B | 220 | 429 | 20 | 30920976 | 30921185 | |
| Top |
| There's no copy number variation information in COSMIC data for this gene. |
| Top |
|
 |
| Top |
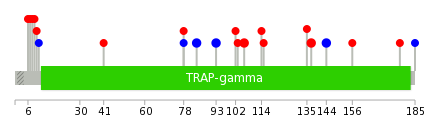
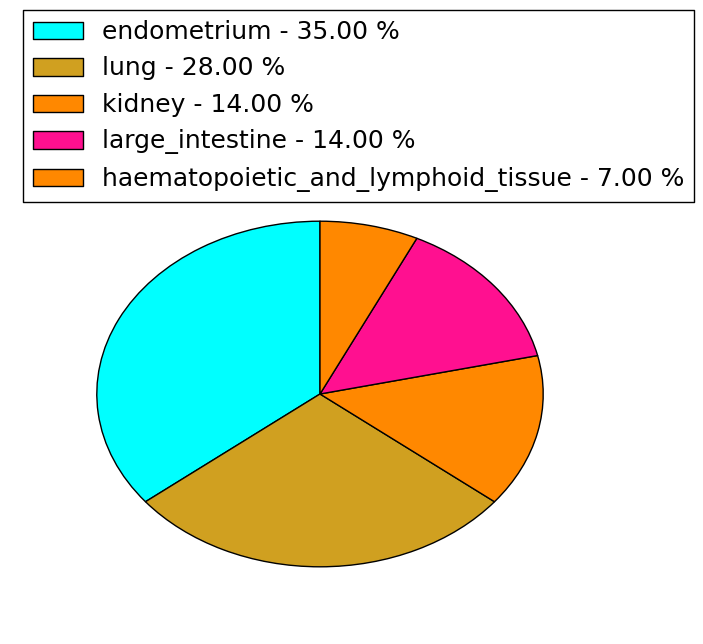
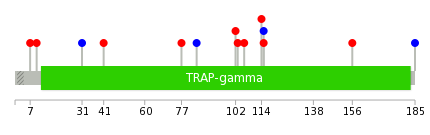
| Stat. for Non-Synonymous SNVs (# total SNVs=14) | (# total SNVs=6) |
 |  |
(# total SNVs=0) | (# total SNVs=0) |
| Top |
| * When you move the cursor on each content, you can see more deailed mutation information on the Tooltip. Those are primary_site,primary_histology,mutation(aa),pubmedID. |
| GRCh37 position | Mutation(aa) | Unique sampleID count |
| chr3:156266737-156266737 | p.E106K | 2 |
| chr3:156266774-156266774 | p.E93E | 2 |
| chr3:156271452-156271452 | p.L84L | 2 |
| chr3:156262158-156262158 | p.L144L | 2 |
| chr3:156271470-156271470 | p.K78N | 2 |
| chr3:156262178-156262178 | p.S137C | 2 |
| chr3:156266713-156266713 | p.R114W | 1 |
| chr3:156272854-156272854 | p.Q9* | 1 |
| chr3:156272856-156272856 | p.K8I | 1 |
| chr3:156260995-156260995 | p.K185K | 1 |
| Top |
|
 |
| Point Mutation/ Tissue ID | 1 | 2 | 3 | 4 | 5 | 6 | 7 | 8 | 9 | 10 | 11 | 12 | 13 | 14 | 15 | 16 | 17 | 18 | 19 | 20 |
| # sample | 1 | 1 | 1 | 1 | 2 | 1 | 1 | 4 | ||||||||||||
| # mutation | 1 | 1 | 1 | 1 | 3 | 1 | 1 | 4 | ||||||||||||
| nonsynonymous SNV | 1 | 1 | 2 | 1 | 1 | 4 | ||||||||||||||
| synonymous SNV | 1 | 1 | 1 |
| cf) Tissue ID; Tissue type (1; BLCA[Bladder Urothelial Carcinoma], 2; BRCA[Breast invasive carcinoma], 3; CESC[Cervical squamous cell carcinoma and endocervical adenocarcinoma], 4; COAD[Colon adenocarcinoma], 5; GBM[Glioblastoma multiforme], 6; Glioma Low Grade, 7; HNSC[Head and Neck squamous cell carcinoma], 8; KICH[Kidney Chromophobe], 9; KIRC[Kidney renal clear cell carcinoma], 10; KIRP[Kidney renal papillary cell carcinoma], 11; LAML[Acute Myeloid Leukemia], 12; LUAD[Lung adenocarcinoma], 13; LUSC[Lung squamous cell carcinoma], 14; OV[Ovarian serous cystadenocarcinoma ], 15; PAAD[Pancreatic adenocarcinoma], 16; PRAD[Prostate adenocarcinoma], 17; SKCM[Skin Cutaneous Melanoma], 18:STAD[Stomach adenocarcinoma], 19:THCA[Thyroid carcinoma], 20:UCEC[Uterine Corpus Endometrial Carcinoma]) |
| Top |
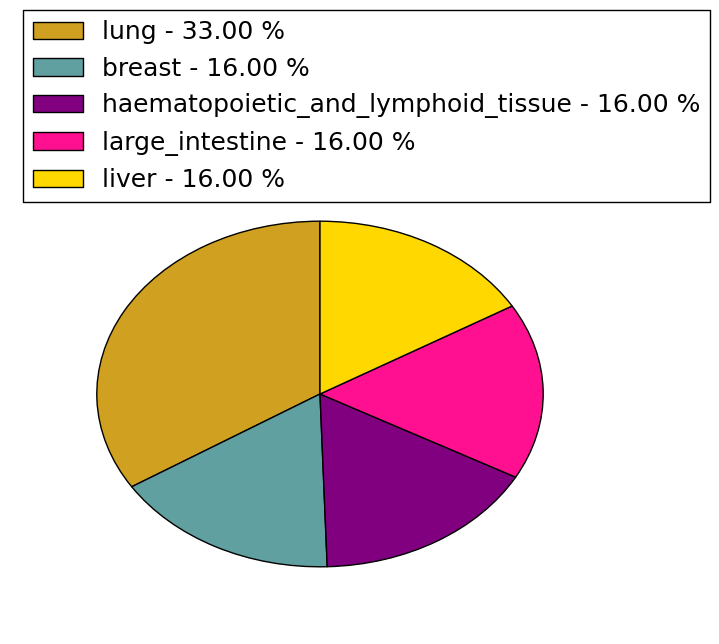
| * We represented just top 10 SNVs. When you move the cursor on each content, you can see more deailed mutation information on the Tooltip. Those are primary_site, primary_histology, mutation(aa), pubmedID. |
| Genomic Position | Mutation(aa) | Unique sampleID count |
| chr3:156266708 | p.K115K | 2 |
| chr3:156272757 | p.K185K | 1 |
| chr3:156272786 | p.I156V | 1 |
| chr3:156260995 | p.R114W | 1 |
| chr3:156272850 | p.E106K | 1 |
| chr3:156262122 | p.K103T | 1 |
| chr3:156272859 | p.R102Q | 1 |
| chr3:156266713 | p.L84L | 1 |
| chr3:156266737 | p.Y77C | 1 |
| chr3:156266745 | p.A41V | 1 |
| * Copy number data were extracted from TCGA using R package TCGA-Assembler. The URLs of all public data files on TCGA DCC data server were gathered on Jan-05-2015. Function ProcessCNAData in TCGA-Assembler package was used to obtain gene-level copy number value which is calculated as the average copy number of the genomic region of a gene. |
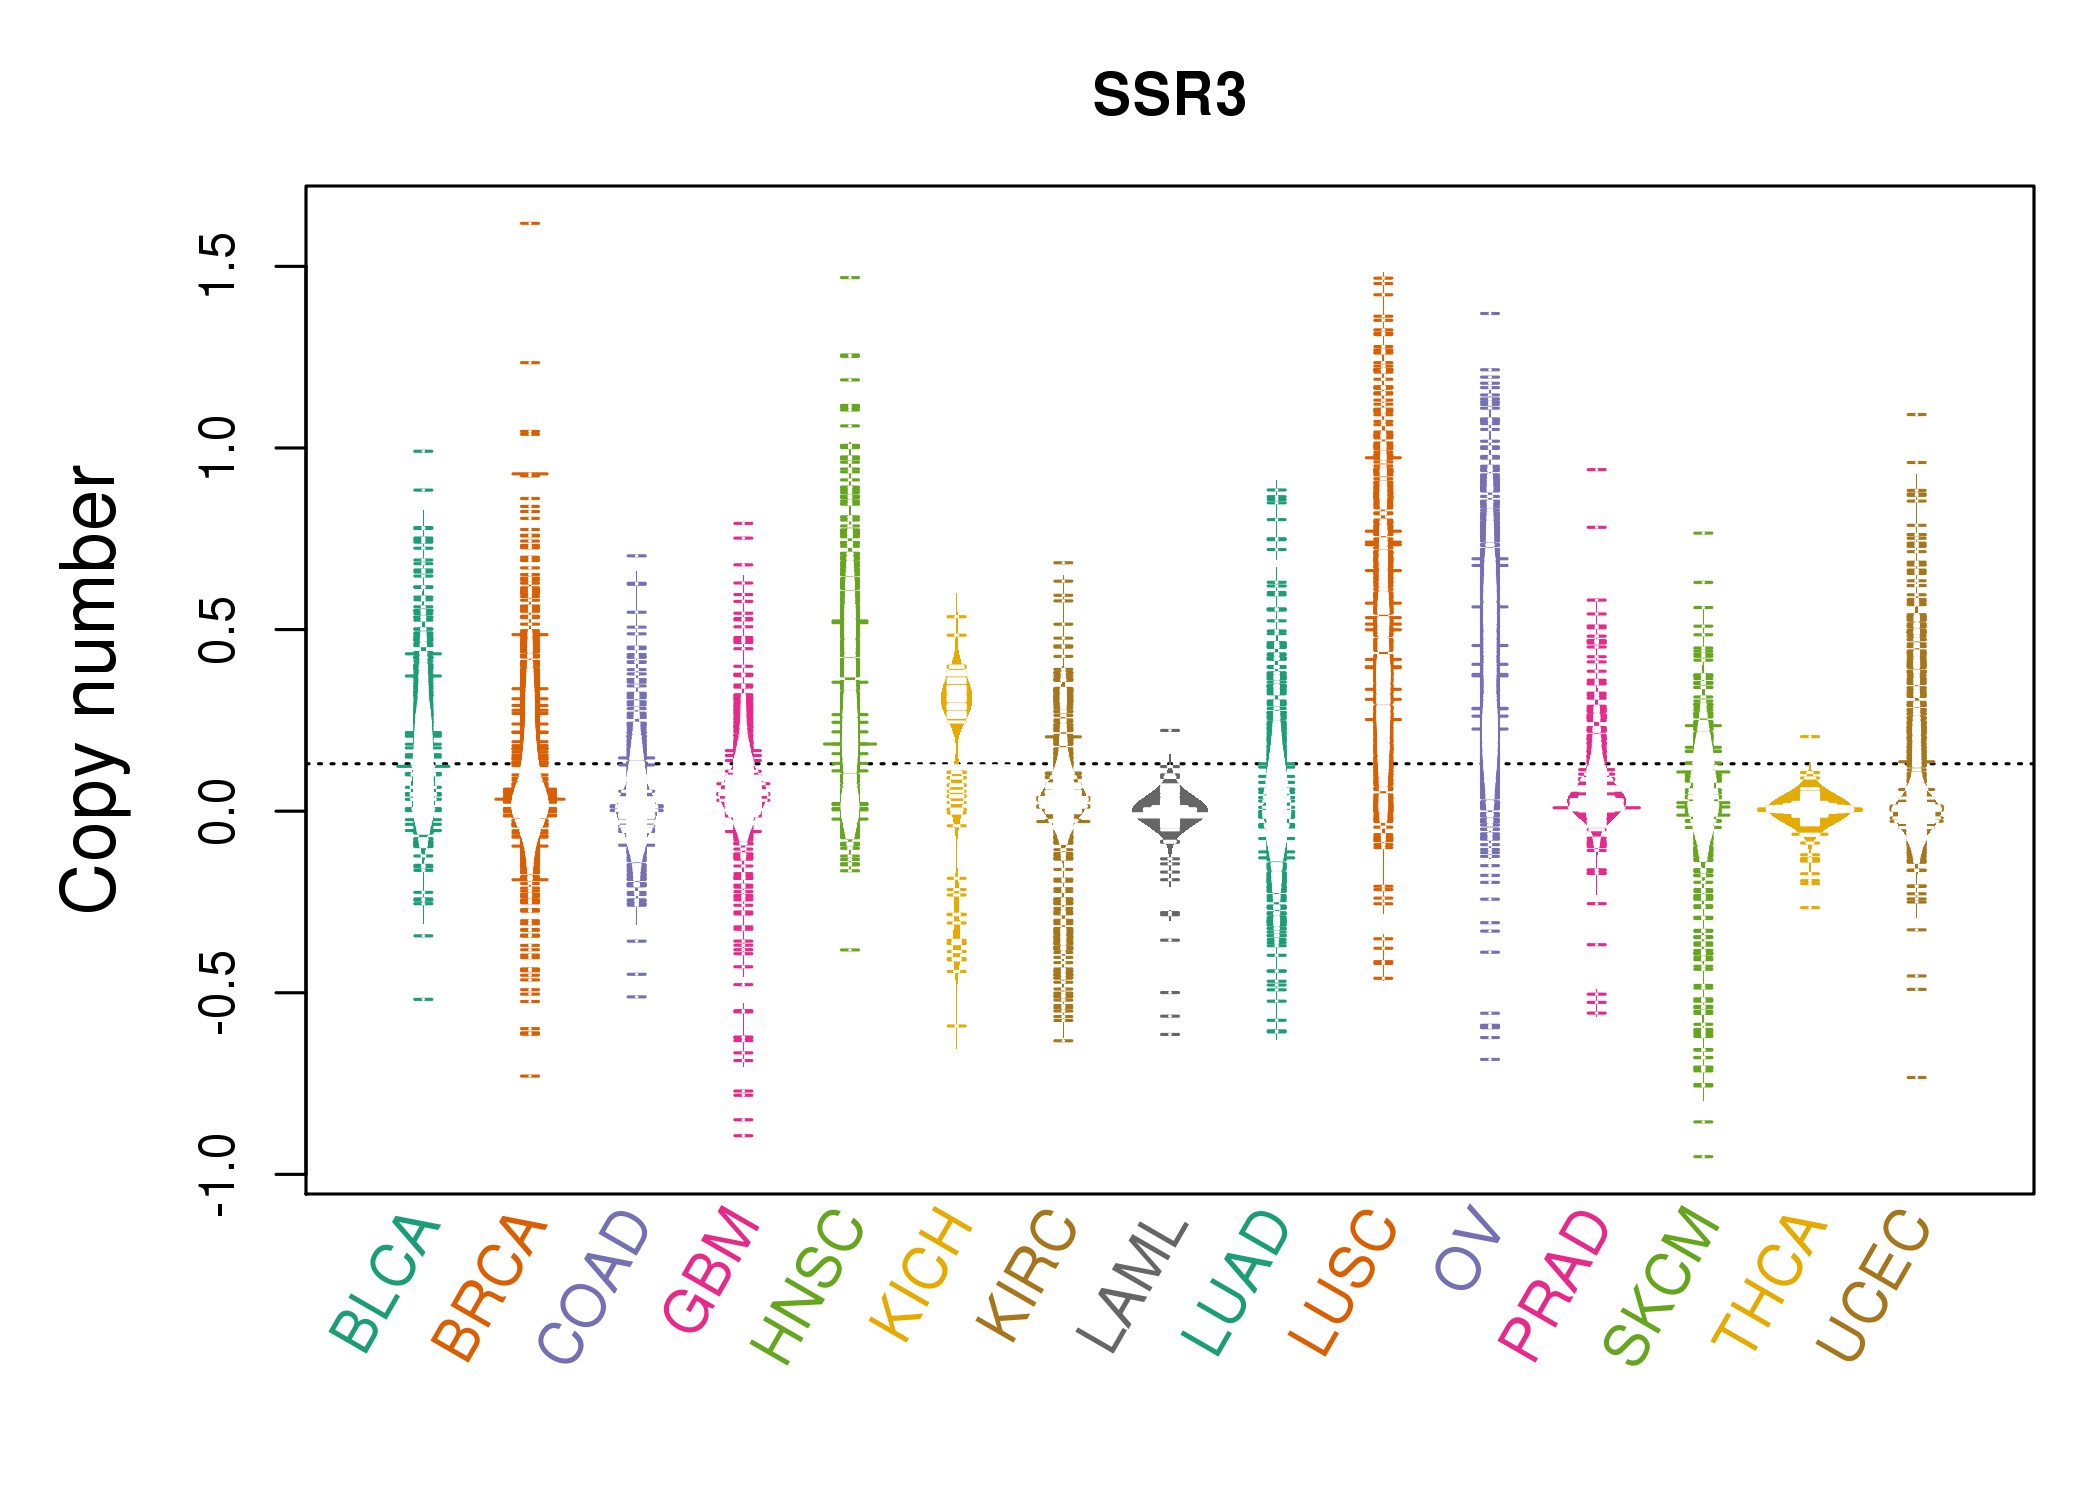 |
| cf) Tissue ID[Tissue type]: BLCA[Bladder Urothelial Carcinoma], BRCA[Breast invasive carcinoma], CESC[Cervical squamous cell carcinoma and endocervical adenocarcinoma], COAD[Colon adenocarcinoma], GBM[Glioblastoma multiforme], Glioma Low Grade, HNSC[Head and Neck squamous cell carcinoma], KICH[Kidney Chromophobe], KIRC[Kidney renal clear cell carcinoma], KIRP[Kidney renal papillary cell carcinoma], LAML[Acute Myeloid Leukemia], LUAD[Lung adenocarcinoma], LUSC[Lung squamous cell carcinoma], OV[Ovarian serous cystadenocarcinoma ], PAAD[Pancreatic adenocarcinoma], PRAD[Prostate adenocarcinoma], SKCM[Skin Cutaneous Melanoma], STAD[Stomach adenocarcinoma], THCA[Thyroid carcinoma], UCEC[Uterine Corpus Endometrial Carcinoma] |
| Top |
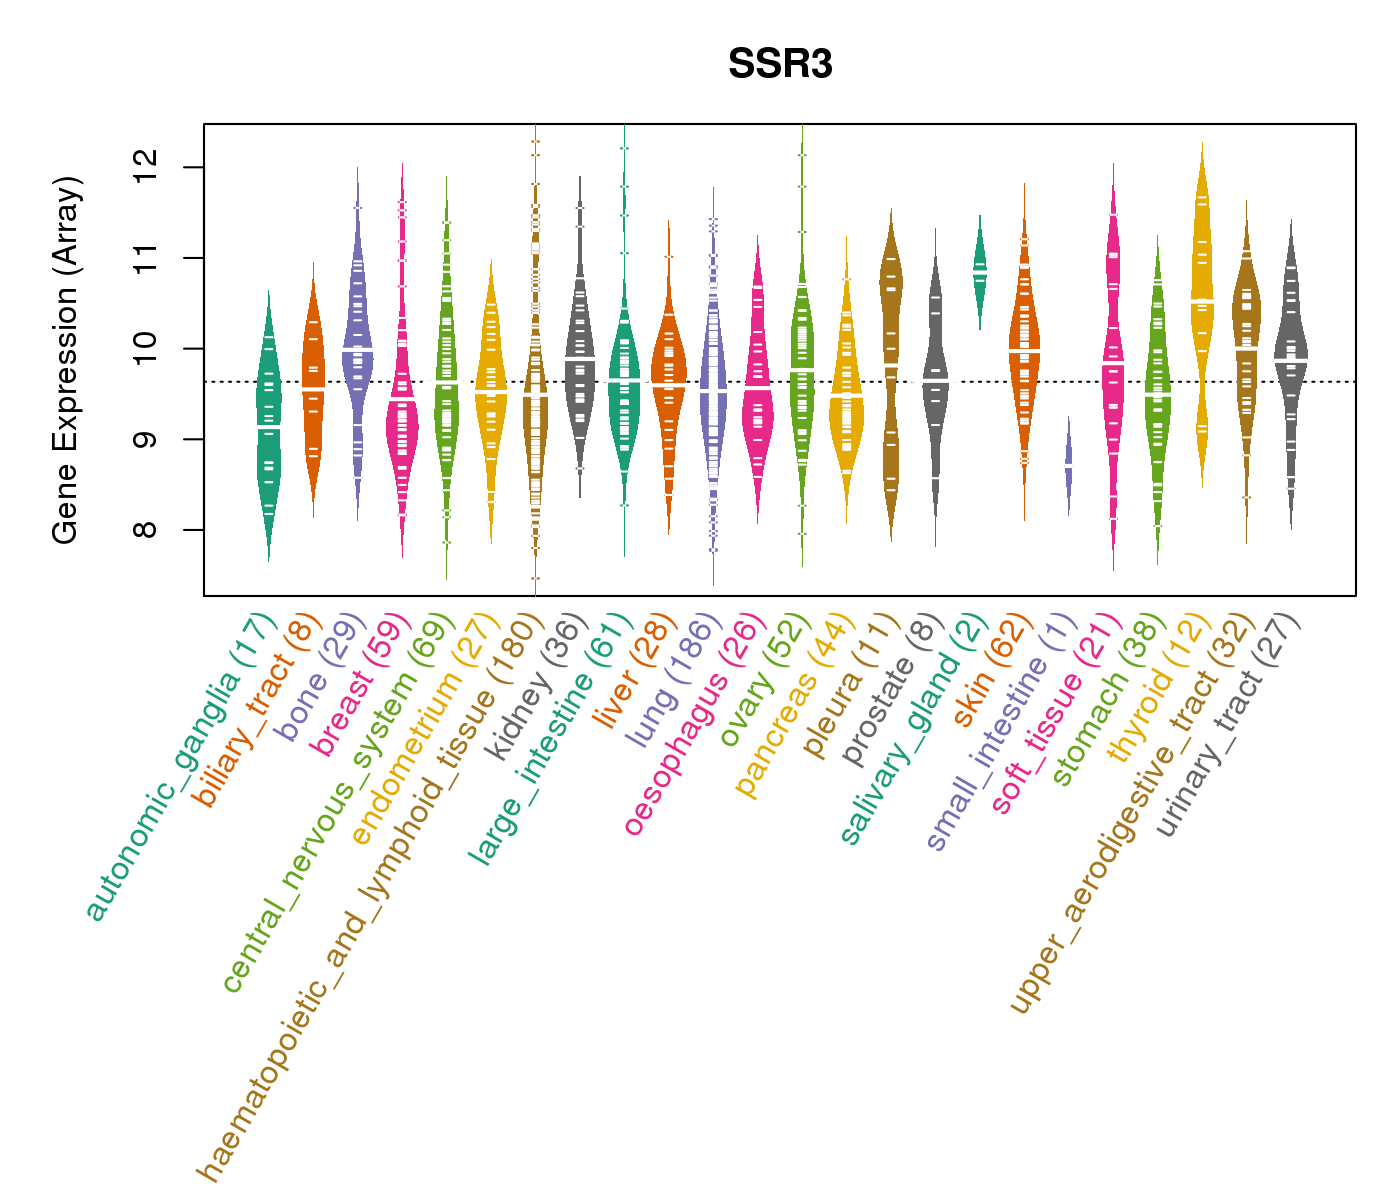
| Gene Expression for SSR3 |
| * CCLE gene expression data were extracted from CCLE_Expression_Entrez_2012-10-18.res: Gene-centric RMA-normalized mRNA expression data. |
 |
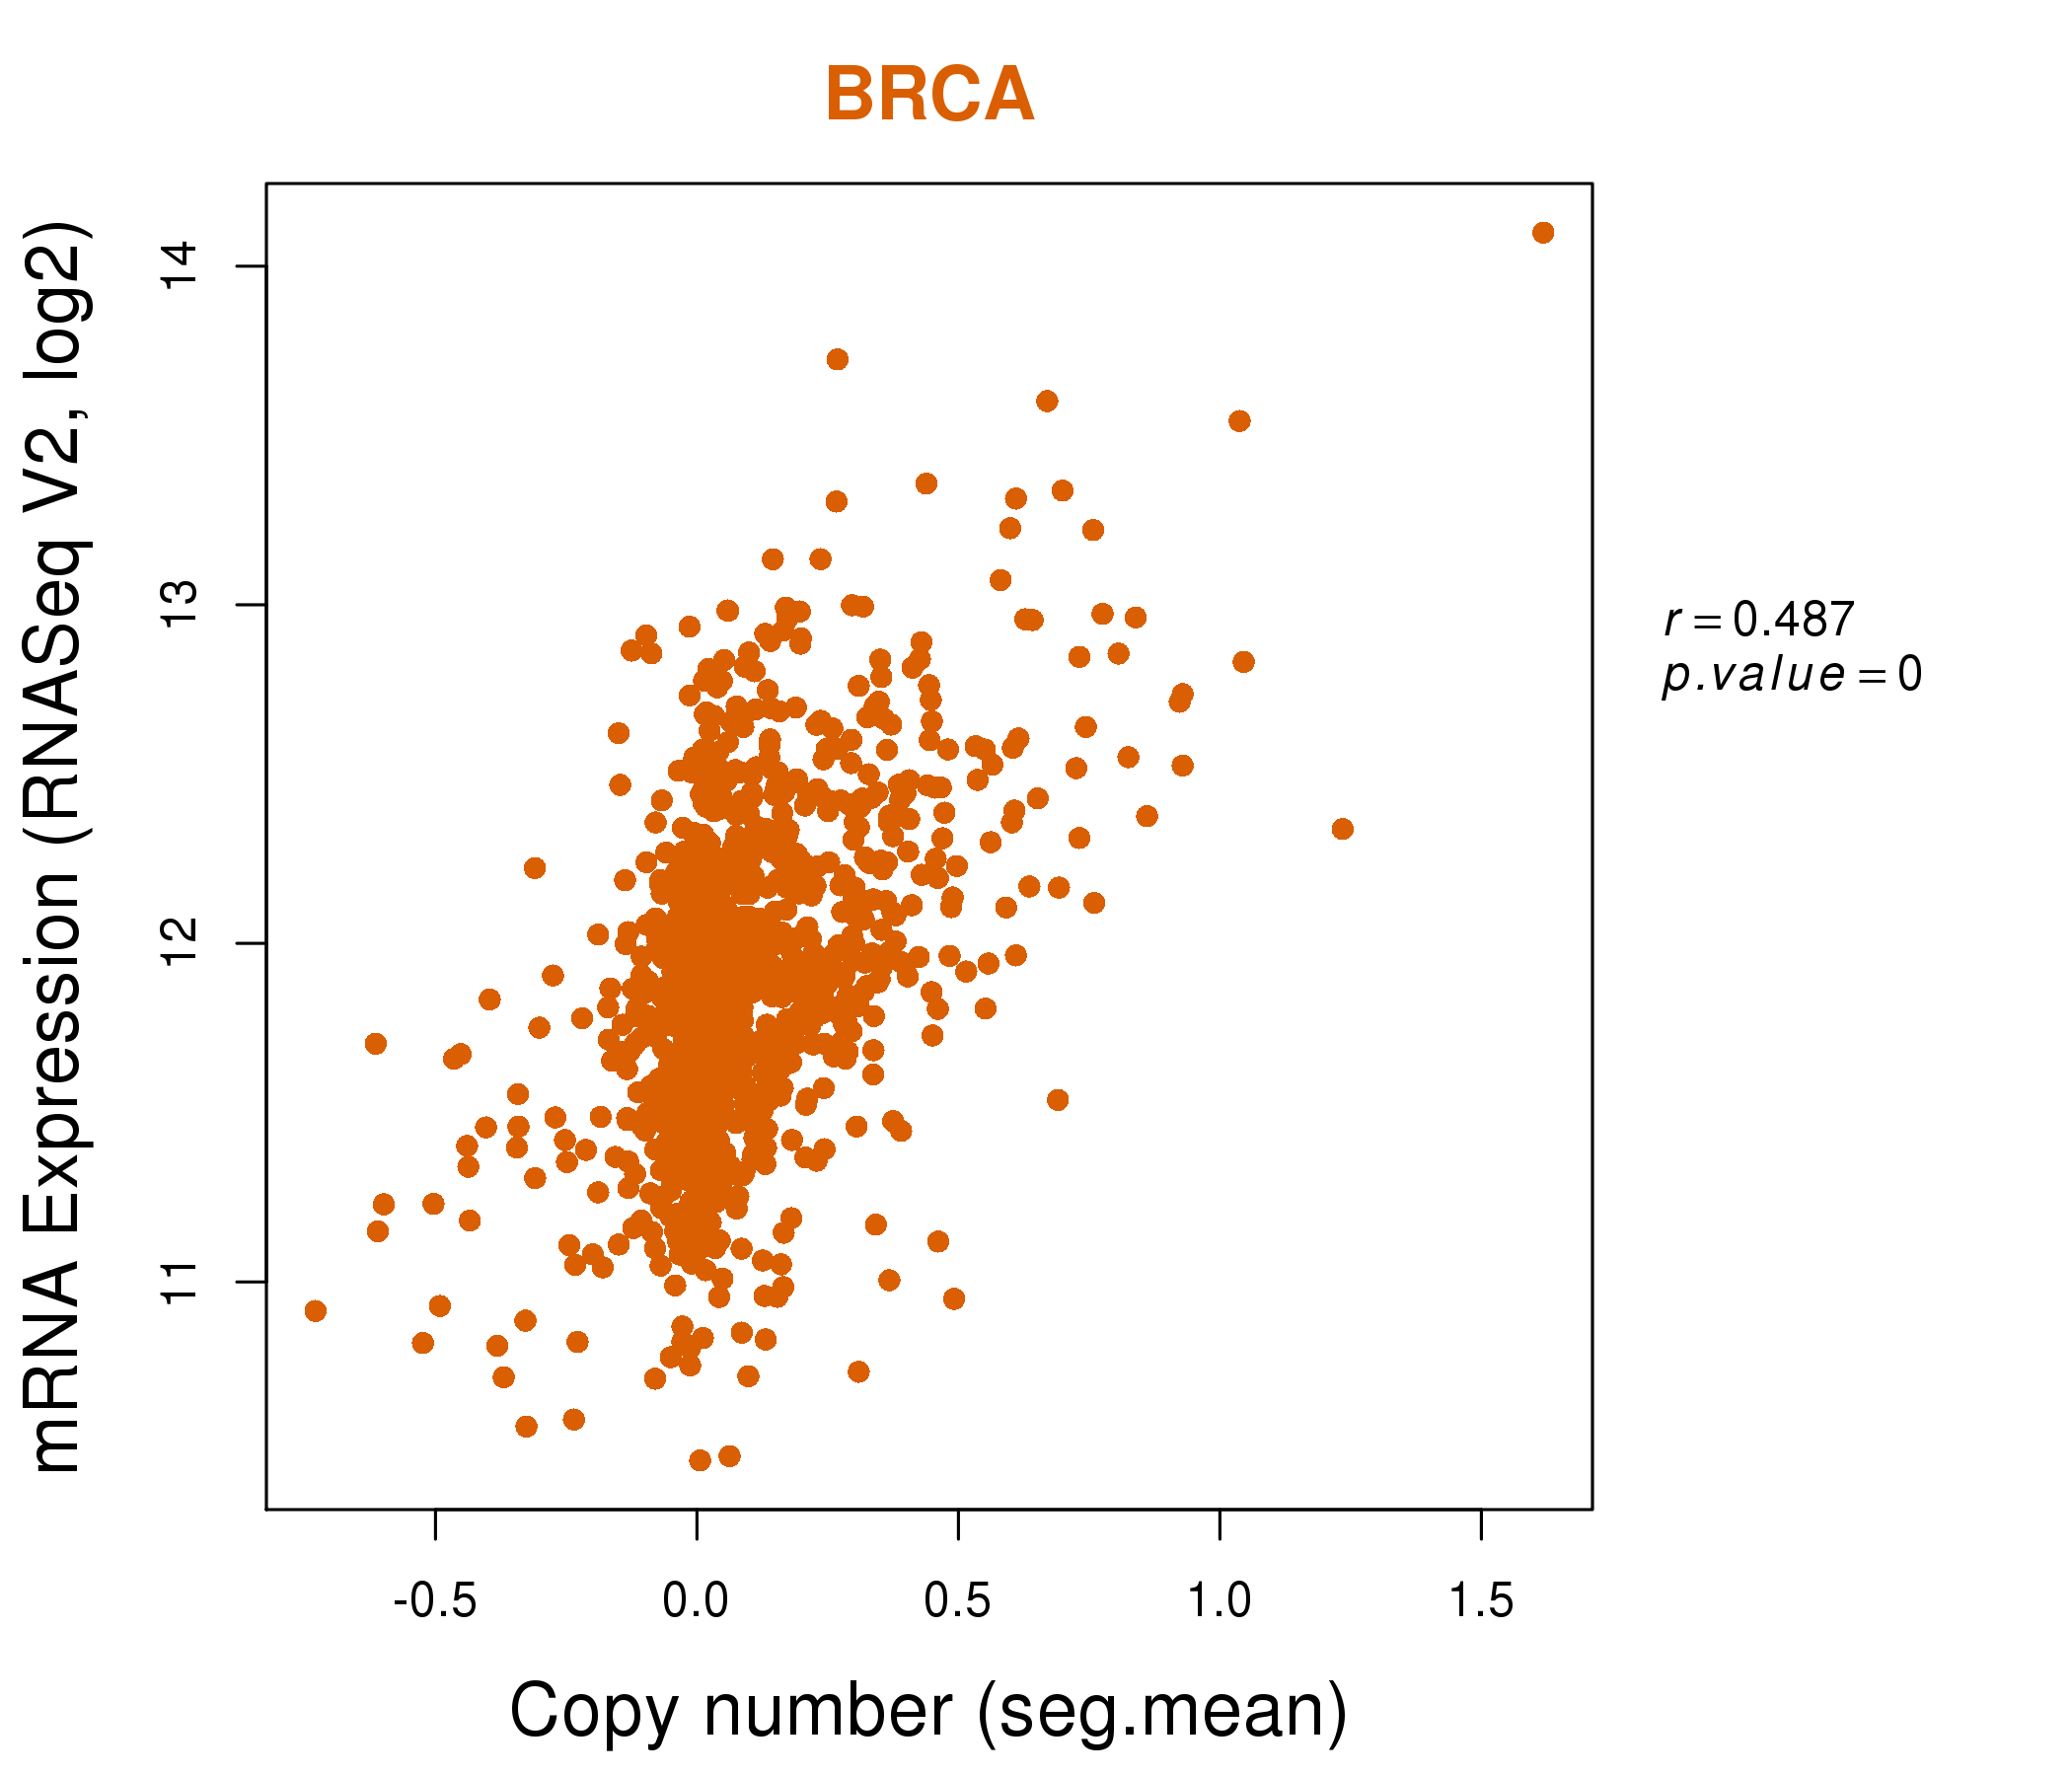
| * Normalized gene expression data of RNASeqV2 was extracted from TCGA using R package TCGA-Assembler. The URLs of all public data files on TCGA DCC data server were gathered at Jan-05-2015. Only eight cancer types have enough normal control samples for differential expression analysis. (t test, adjusted p<0.05 (using Benjamini-Hochberg FDR)) |
 |
| Top |
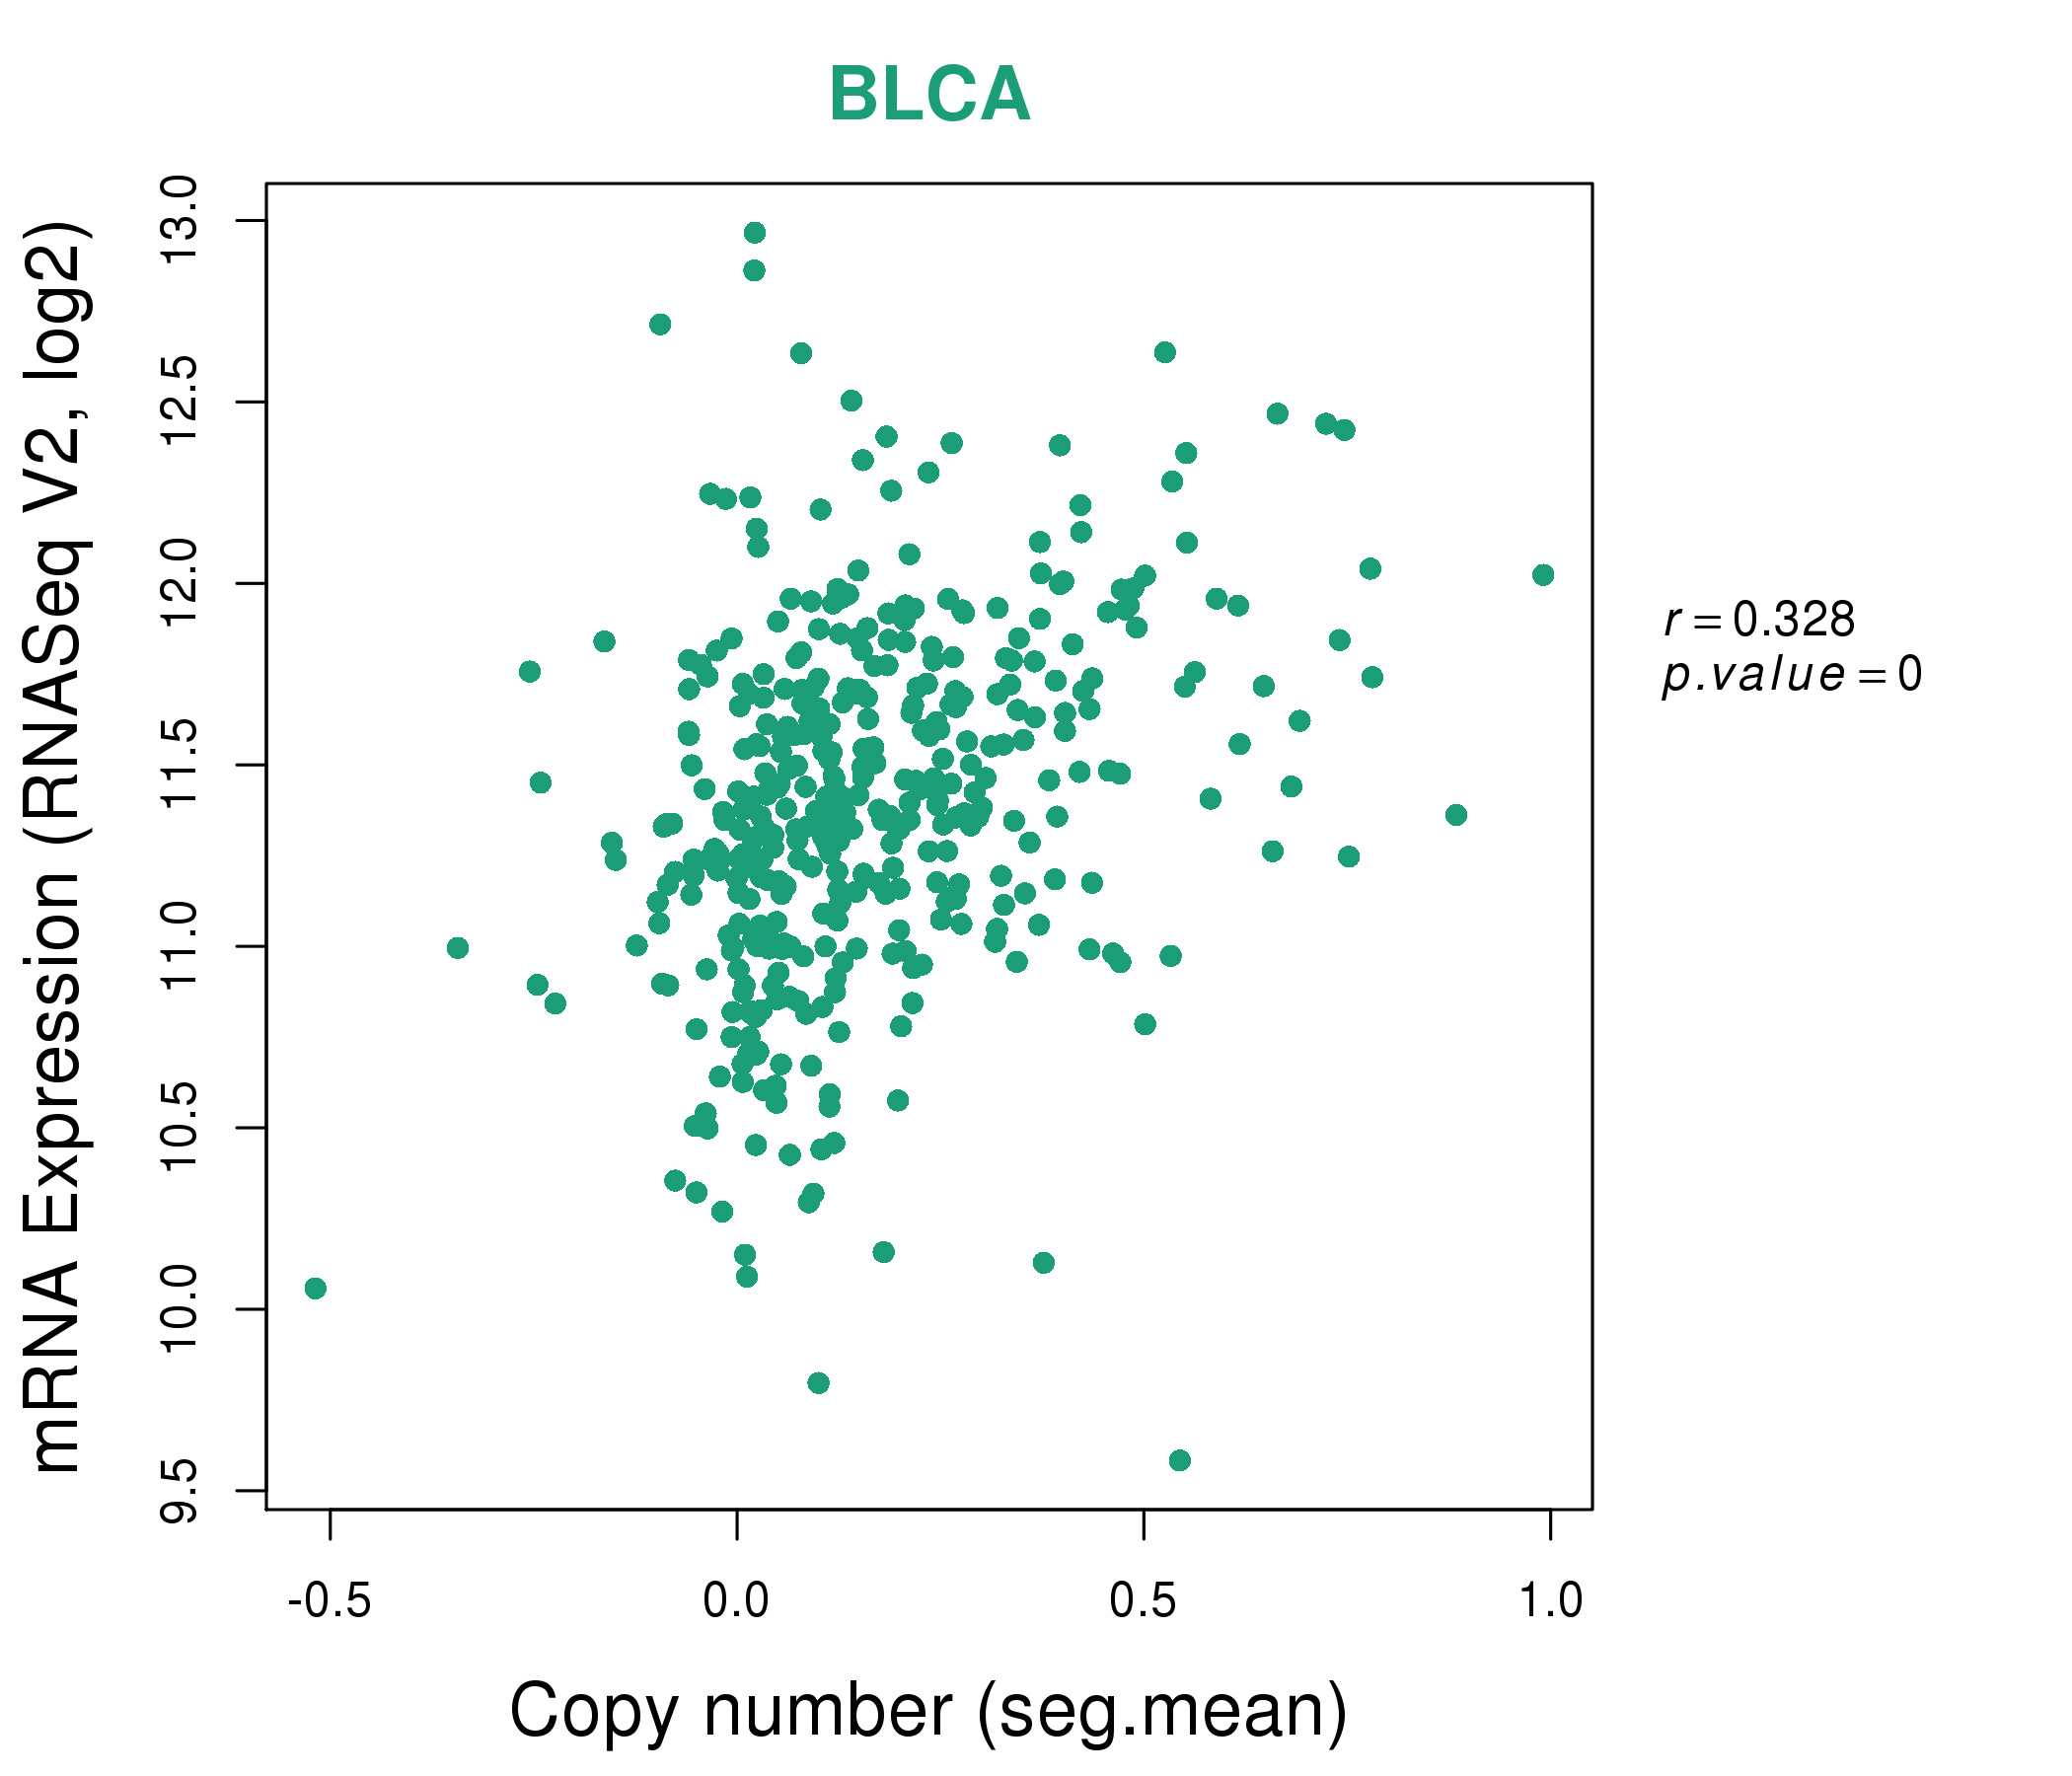
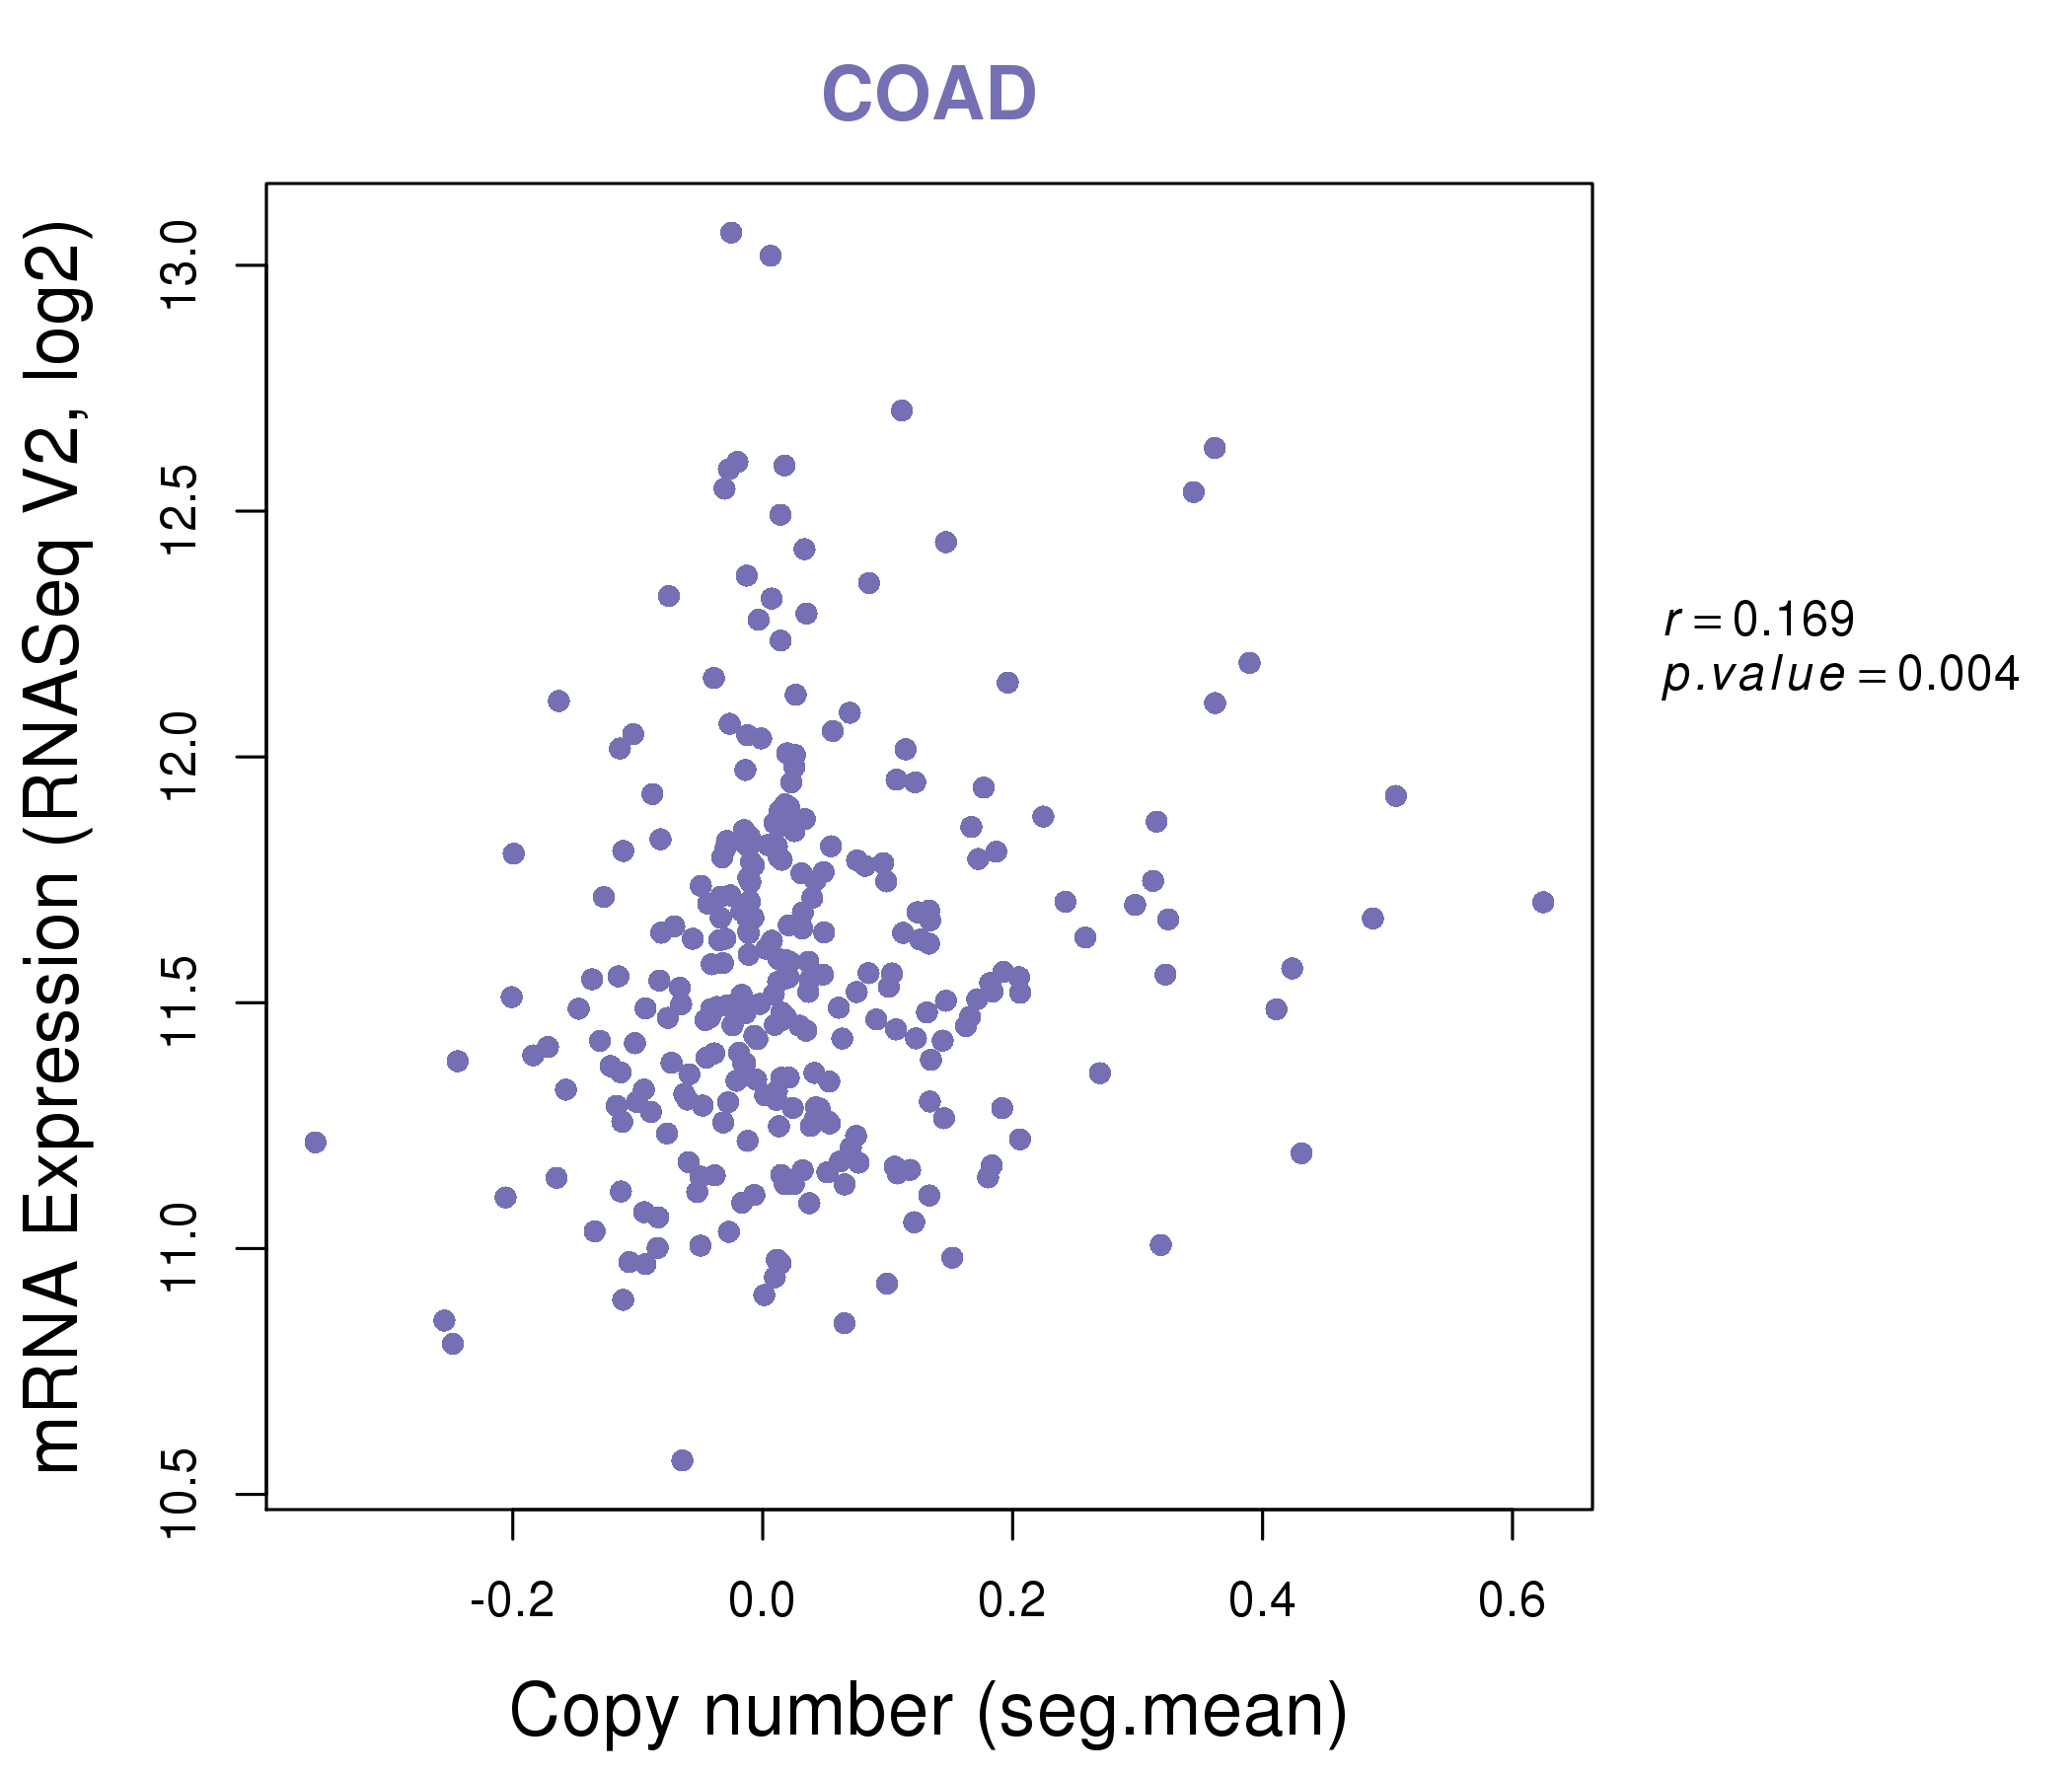
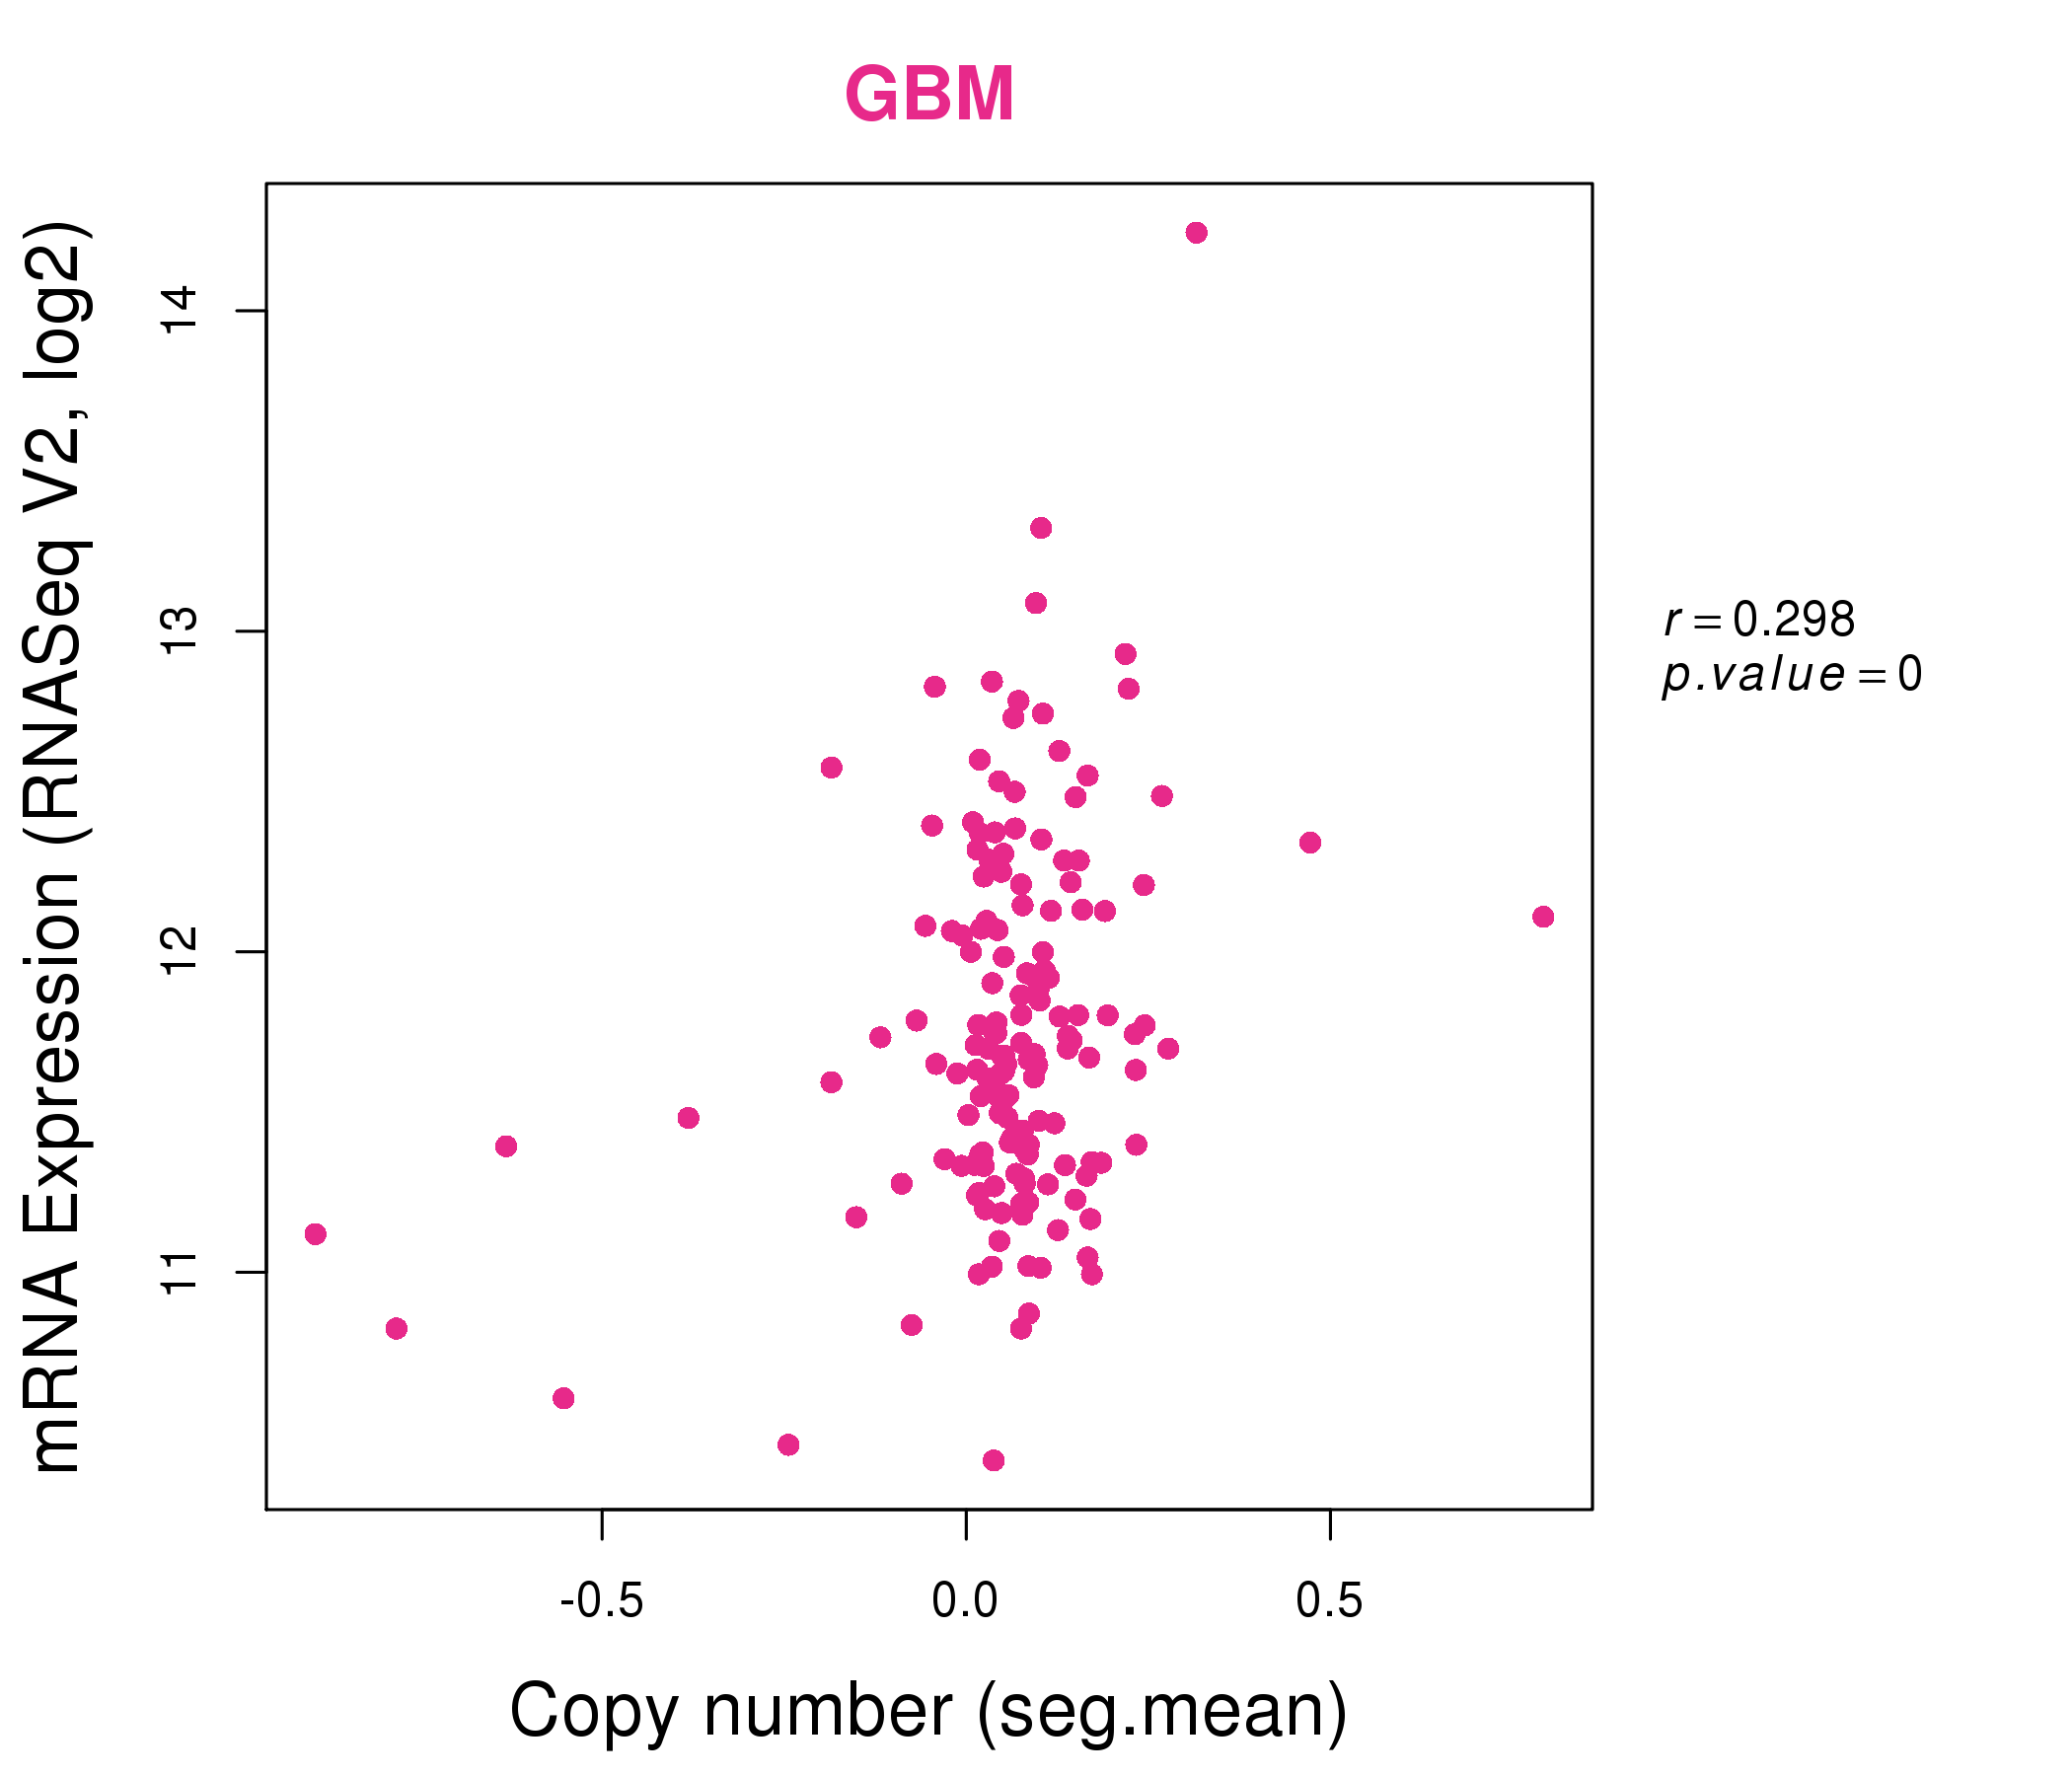
| * This plots show the correlation between CNV and gene expression. |
: Open all plots for all cancer types
 |
|
 |
|
| Top |
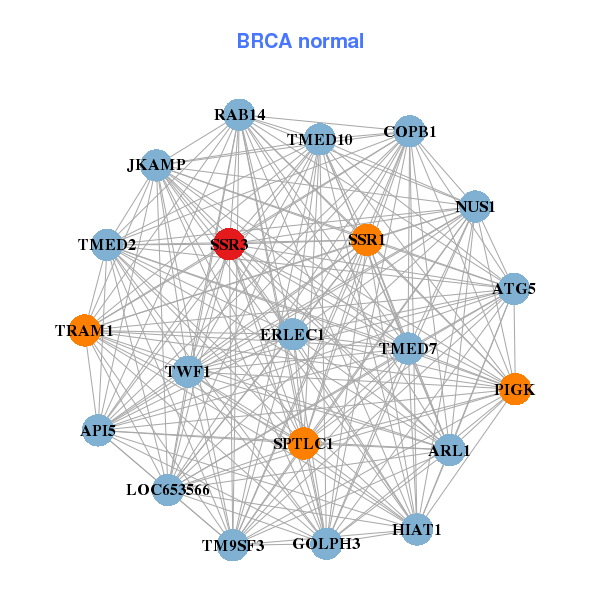
| Gene-Gene Network Information |
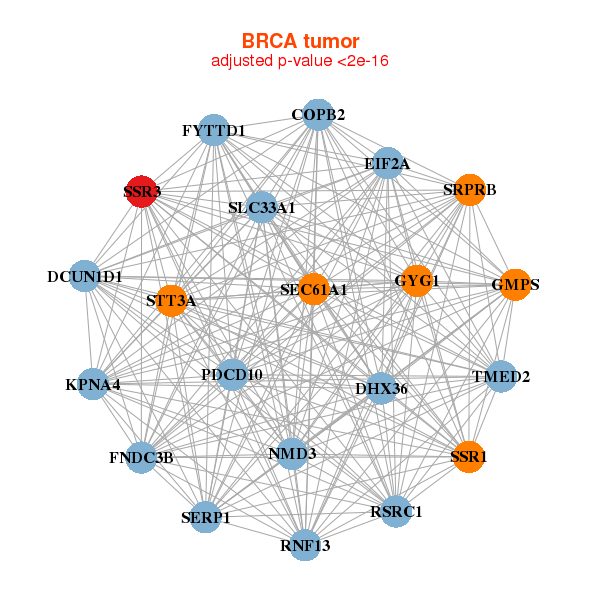
| * Co-Expression network figures were drawn using R package igraph. Only the top 20 genes with the highest correlations were shown. Red circle: input gene, orange circle: cell metabolism gene, sky circle: other gene |
: Open all plots for all cancer types
 |
|
| COPB2,DCUN1D1,DHX36,EIF2A,FNDC3B,FYTTD1,GMPS, GYG1,KPNA4,NMD3,PDCD10,RNF13,RSRC1,SEC61A1, SERP1,SLC33A1,SRPRB,SSR1,SSR3,STT3A,TMED2 | API5,ARL1,ATG5,COPB1,ERLEC1,GOLPH3,HIAT1, JKAMP,LOC653566,NUS1,PIGK,RAB14,SPTLC1,SSR1, SSR3,TM9SF3,TMED10,TMED2,TMED7,TRAM1,TWF1 |
 |
|
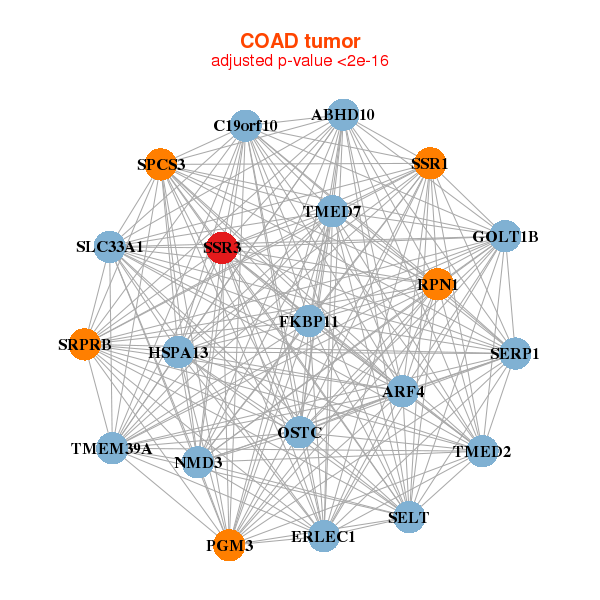
| ABHD10,ARF4,C19orf10,ERLEC1,FKBP11,GOLT1B,HSPA13, NMD3,OSTC,PGM3,RPN1,SELT,SERP1,SLC33A1, SPCS3,SRPRB,SSR1,SSR3,TMED2,TMED7,TMEM39A | ALG5,ANXA7,EMC7,C19orf10,CISD2,ERLEC1,HAUS1, NAA20,NUP37,OSTC,PRDX4,PREB,RAN,RPL26L1, SEC11C,SNRNP40,SRPRB,SSR3,TMED2,TMEM165,TOMM5 |
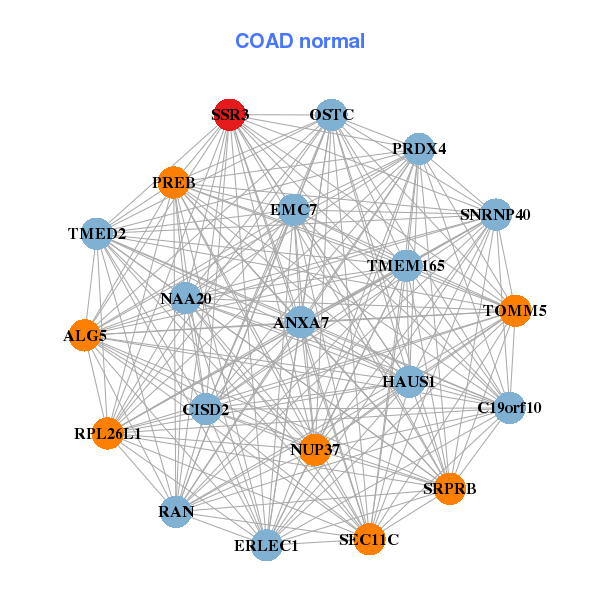
| * Co-Expression network figures were drawn using R package igraph. Only the top 20 genes with the highest correlations were shown. Red circle: input gene, orange circle: cell metabolism gene, sky circle: other gene |
: Open all plots for all cancer types
| Top |
: Open all interacting genes' information including KEGG pathway for all interacting genes from DAVID
| Top |
| Pharmacological Information for SSR3 |
| There's no related Drug. |
| Top |
| Cross referenced IDs for SSR3 |
| * We obtained these cross-references from Uniprot database. It covers 150 different DBs, 18 categories. http://www.uniprot.org/help/cross_references_section |
: Open all cross reference information
|
Copyright © 2016-Present - The Univsersity of Texas Health Science Center at Houston @ |