|
||||||||||||||||||||
| |
| Phenotypic Information (metabolism pathway, cancer, disease, phenome) |
| |
| |
| Gene-Gene Network Information: Co-Expression Network, Interacting Genes & KEGG |
| |
|


| Gene Summary for ZFP36L1 |
| Basic gene info. | Gene symbol | ZFP36L1 |
| Gene name | ZFP36 ring finger protein-like 1 | |
| Synonyms | BRF1|Berg36|ERF-1|ERF1|RNF162B|TIS11B|cMG1 | |
| Cytomap | UCSC genome browser: 14q22-q24 | |
| Genomic location | chr14 :69254371-69262960 | |
| Type of gene | protein-coding | |
| RefGenes | NM_001244698.1, NM_001244701.1,NM_004926.3, | |
| Ensembl id | ENSG00000185650 | |
| Description | EGF-response factor 1butyrate response factor 1early response factor Berg36zinc finger protein 36, C3H type-like 1zinc finger protein 36, C3H1 type-like 1zinc finger protein, C3H type, 36-like 1 | |
| Modification date | 20141222 | |
| dbXrefs | MIM : 601064 | |
| HGNC : HGNC | ||
| Ensembl : ENSG00000185650 | ||
| HPRD : 03041 | ||
| Vega : OTTHUMG00000171385 | ||
| Protein | UniProt: Q07352 go to UniProt's Cross Reference DB Table | |
| Expression | CleanEX: HS_ZFP36L1 | |
| BioGPS: 677 | ||
| Gene Expression Atlas: ENSG00000185650 | ||
| The Human Protein Atlas: ENSG00000185650 | ||
| Pathway | NCI Pathway Interaction Database: ZFP36L1 | |
| KEGG: ZFP36L1 | ||
| REACTOME: ZFP36L1 | ||
| ConsensusPathDB | ||
| Pathway Commons: ZFP36L1 | ||
| Metabolism | MetaCyc: ZFP36L1 | |
| HUMANCyc: ZFP36L1 | ||
| Regulation | Ensembl's Regulation: ENSG00000185650 | |
| miRBase: chr14 :69,254,371-69,262,960 | ||
| TargetScan: NM_001244698 | ||
| cisRED: ENSG00000185650 | ||
| Context | iHOP: ZFP36L1 | |
| cancer metabolism search in PubMed: ZFP36L1 | ||
| UCL Cancer Institute: ZFP36L1 | ||
| Assigned class in ccmGDB | B - This gene belongs to cancer gene. | |
| Top |
| Phenotypic Information for ZFP36L1(metabolism pathway, cancer, disease, phenome) |
| Cancer | CGAP: ZFP36L1 |
| Familial Cancer Database: ZFP36L1 | |
| * This gene is included in those cancer gene databases. |
|
|
|
|
|
| . | ||||||||||||||
Oncogene 1 | ||||||||||||||||||||
| cf) number; DB name 1 Oncogene; http://nar.oxfordjournals.org/content/35/suppl_1/D721.long, 2 Tumor Suppressor gene; https://bioinfo.uth.edu/TSGene/, 3 Cancer Gene Census; http://www.nature.com/nrc/journal/v4/n3/abs/nrc1299.html, 4 CancerGenes; http://nar.oxfordjournals.org/content/35/suppl_1/D721.long, 5 Network of Cancer Gene; http://ncg.kcl.ac.uk/index.php, 6 http://www.nature.com/nature/journal/vaop/ncurrent/full/nature12965.html, 7 http://www.nature.com/nature/journal/v490/n7418/full/nature11412.html, 8Therapeutic Vulnerabilities in Cancer; http://cbio.mskcc.org/cancergenomics/statius/ |
| REACTOME_METABOLISM_OF_MRNA REACTOME_METABOLISM_OF_RNA | |
| OMIM | 601064; gene. |
| Orphanet | |
| Disease | KEGG Disease: ZFP36L1 |
| MedGen: ZFP36L1 (Human Medical Genetics with Condition) | |
| ClinVar: ZFP36L1 | |
| Phenotype | MGI: ZFP36L1 (International Mouse Phenotyping Consortium) |
| PhenomicDB: ZFP36L1 | |
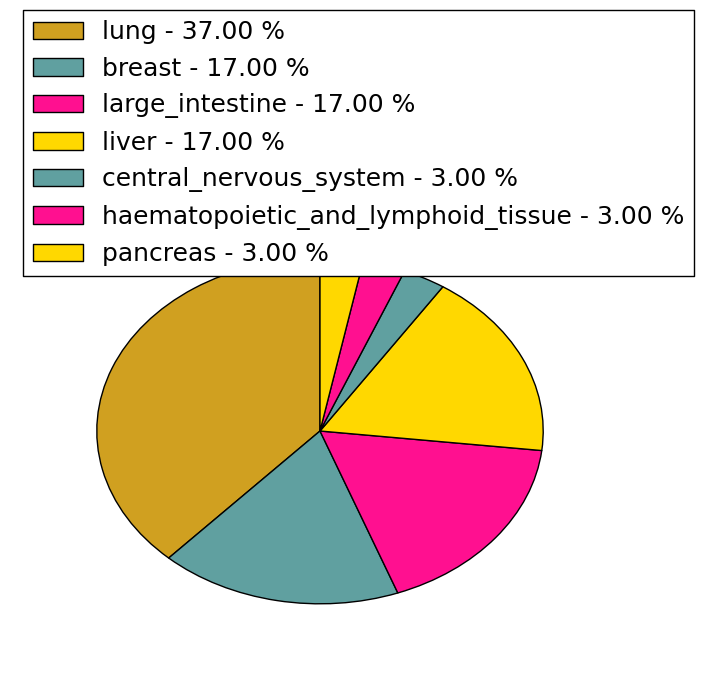
| Mutations for ZFP36L1 |
| * Under tables are showing count per each tissue to give us broad intuition about tissue specific mutation patterns.You can go to the detailed page for each mutation database's web site. |
| - Statistics for Tissue and Mutation type | Top |
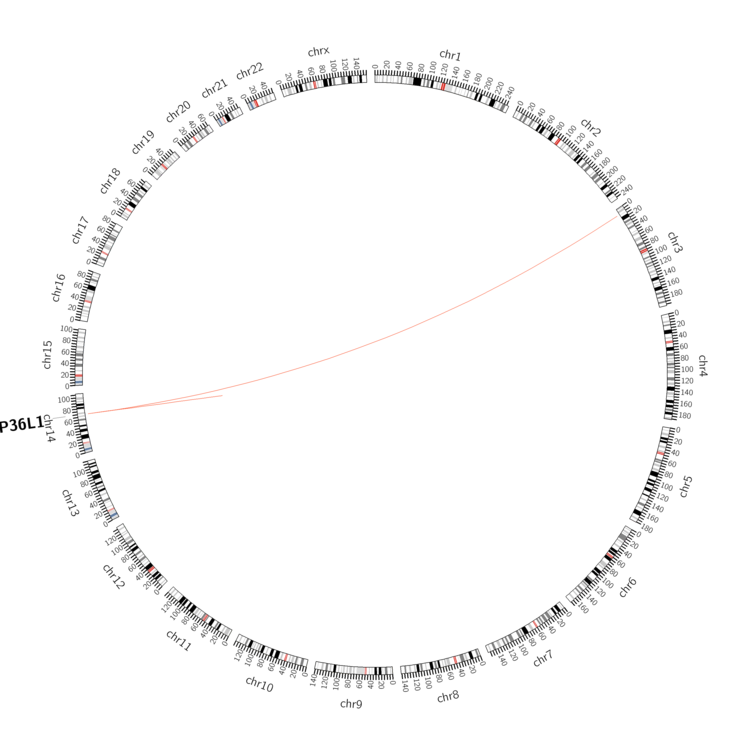 |
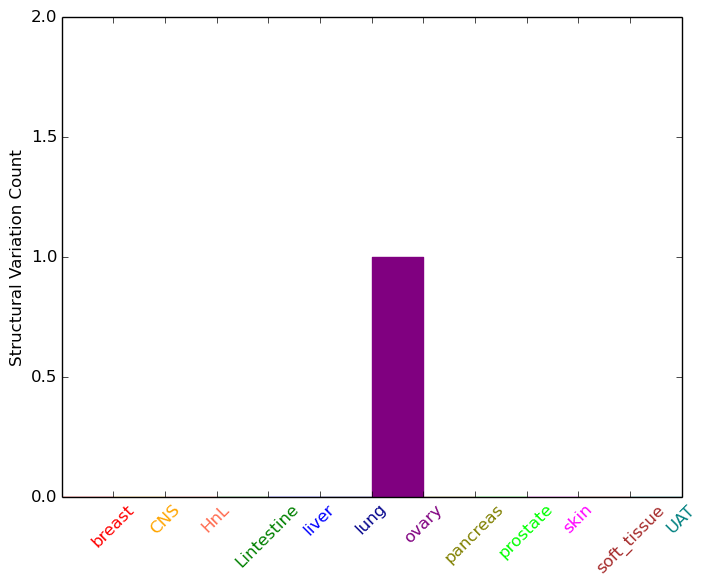
| - For Inter-chromosomal Variations |
| * Inter-chromosomal variantions includes 'interchromosomal amplicon to amplicon', 'interchromosomal amplicon to non-amplified dna', 'interchromosomal insertion', 'Interchromosomal unknown type'. |
 |
| - For Intra-chromosomal Variations |
| * Intra-chromosomal variantions includes 'intrachromosomal amplicon to amplicon', 'intrachromosomal amplicon to non-amplified dna', 'intrachromosomal deletion', 'intrachromosomal fold-back inversion', 'intrachromosomal inversion', 'intrachromosomal tandem duplication', 'Intrachromosomal unknown type', 'intrachromosomal with inverted orientation', 'intrachromosomal with non-inverted orientation'. |
 |
| Sample | Symbol_a | Chr_a | Start_a | End_a | Symbol_b | Chr_b | Start_b | End_b |
| ovary | ZFP36L1 | chr14 | 69257970 | 69257990 | ZFP36L1 | chr14 | 69258394 | 69258414 |
| cf) Tissue number; Tissue name (1;Breast, 2;Central_nervous_system, 3;Haematopoietic_and_lymphoid_tissue, 4;Large_intestine, 5;Liver, 6;Lung, 7;Ovary, 8;Pancreas, 9;Prostate, 10;Skin, 11;Soft_tissue, 12;Upper_aerodigestive_tract) |
| * From mRNA Sanger sequences, Chitars2.0 arranged chimeric transcripts. This table shows ZFP36L1 related fusion information. |
| ID | Head Gene | Tail Gene | Accession | Gene_a | qStart_a | qEnd_a | Chromosome_a | tStart_a | tEnd_a | Gene_a | qStart_a | qEnd_a | Chromosome_a | tStart_a | tEnd_a |
| DA746032 | ZFP36L1 | 1 | 118 | 14 | 69261839 | 69261956 | SMG6 | 116 | 563 | 17 | 1968369 | 1972227 | |
| BE811922 | ZFP36L1 | 1 | 185 | 14 | 69257716 | 69257903 | LARGE | 173 | 349 | 22 | 33777798 | 33777972 | |
| CN312778 | TTC26 | 1 | 291 | 7 | 138818525 | 138822663 | ZFP36L1 | 286 | 681 | 14 | 69256161 | 69256556 | |
| AF123320 | CRIPT | 930 | 2020 | 2 | 46844409 | 46852137 | ZFP36L1 | 2021 | 2272 | 14 | 69255311 | 69255582 | |
| BG568132 | ZFP36L1 | 56 | 196 | 14 | 69255014 | 69255154 | FGB | 191 | 543 | 4 | 155491882 | 155492233 | |
| BF382756 | ZFP36L1 | 1 | 439 | 14 | 69255654 | 69256090 | TMED9 | 434 | 635 | 5 | 177022906 | 177023107 | |
| Top |
| There's no copy number variation information in COSMIC data for this gene. |
| Top |
|
 |
| Top |
| Stat. for Non-Synonymous SNVs (# total SNVs=29) | (# total SNVs=6) |
 | 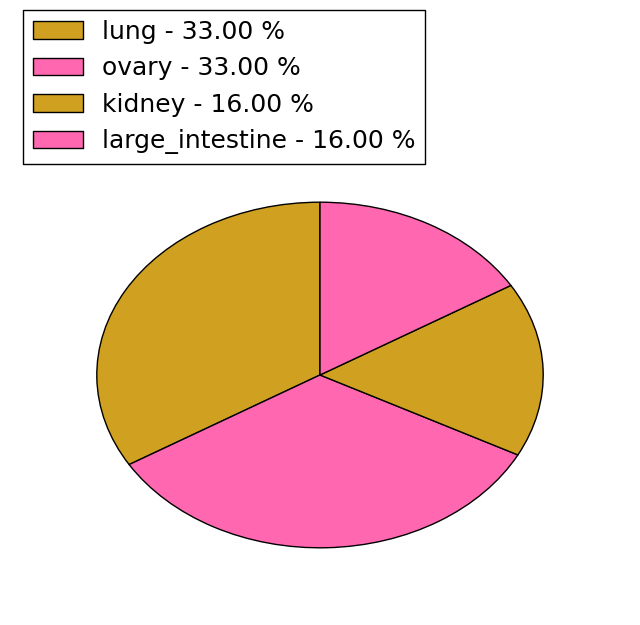 |
(# total SNVs=6) | (# total SNVs=4) |
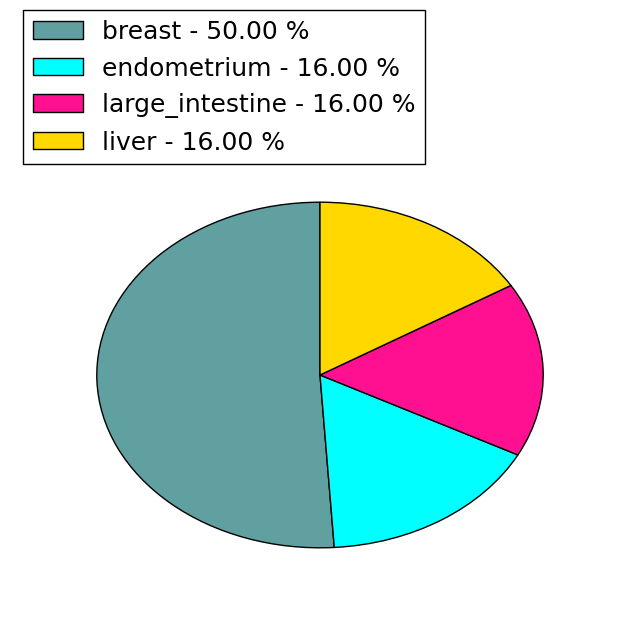 | 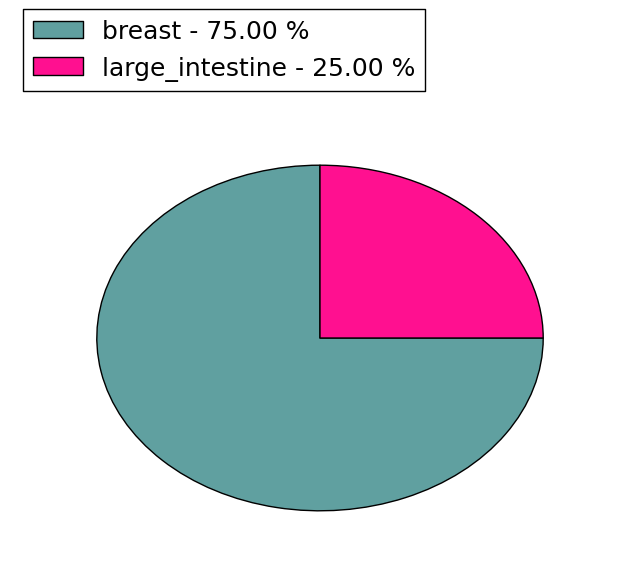 |
| Top |
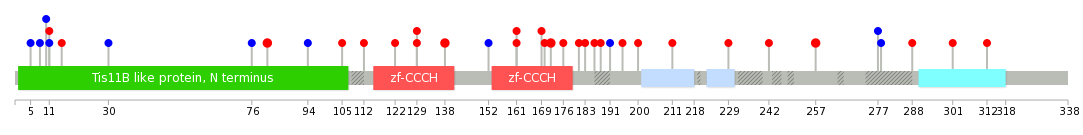
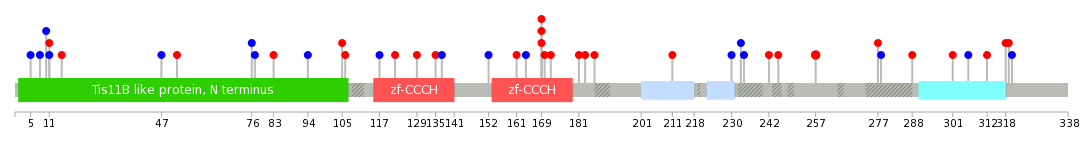
| * When you move the cursor on each content, you can see more deailed mutation information on the Tooltip. Those are primary_site,primary_histology,mutation(aa),pubmedID. |
| GRCh37 position | Mutation(aa) | Unique sampleID count |
| chr14:69256498-69256498 | p.E257K | 4 |
| chr14:69257025-69257025 | p.S81fs*67 | 3 |
| chr14:69256907-69256907 | p.C120* | 2 |
| chr14:69259623-69259623 | p.F11L | 2 |
| chr14:69256854-69256854 | p.A138E | 2 |
| chr14:69256753-69256753 | p.R172C | 2 |
| chr14:69256784-69256784 | p.F161L | 1 |
| chr14:69259613-69259613 | p.E15K | 1 |
| chr14:69256436-69256436 | p.F277F | 1 |
| chr14:69256720-69256720 | p.R183G | 1 |
| Top |
|
 |
| Point Mutation/ Tissue ID | 1 | 2 | 3 | 4 | 5 | 6 | 7 | 8 | 9 | 10 | 11 | 12 | 13 | 14 | 15 | 16 | 17 | 18 | 19 | 20 |
| # sample | 3 | 3 | 1 | 4 | 1 | 6 | 1 | 2 | 11 | 3 | 2 | 1 | 3 | 5 | ||||||
| # mutation | 3 | 3 | 2 | 4 | 1 | 6 | 1 | 2 | 10 | 3 | 2 | 1 | 3 | 5 | ||||||
| nonsynonymous SNV | 3 | 3 | 1 | 3 | 1 | 2 | 1 | 6 | 3 | 3 | 2 | |||||||||
| synonymous SNV | 1 | 1 | 4 | 1 | 1 | 4 | 2 | 1 | 3 |
| cf) Tissue ID; Tissue type (1; BLCA[Bladder Urothelial Carcinoma], 2; BRCA[Breast invasive carcinoma], 3; CESC[Cervical squamous cell carcinoma and endocervical adenocarcinoma], 4; COAD[Colon adenocarcinoma], 5; GBM[Glioblastoma multiforme], 6; Glioma Low Grade, 7; HNSC[Head and Neck squamous cell carcinoma], 8; KICH[Kidney Chromophobe], 9; KIRC[Kidney renal clear cell carcinoma], 10; KIRP[Kidney renal papillary cell carcinoma], 11; LAML[Acute Myeloid Leukemia], 12; LUAD[Lung adenocarcinoma], 13; LUSC[Lung squamous cell carcinoma], 14; OV[Ovarian serous cystadenocarcinoma ], 15; PAAD[Pancreatic adenocarcinoma], 16; PRAD[Prostate adenocarcinoma], 17; SKCM[Skin Cutaneous Melanoma], 18:STAD[Stomach adenocarcinoma], 19:THCA[Thyroid carcinoma], 20:UCEC[Uterine Corpus Endometrial Carcinoma]) |
| Top |
| * We represented just top 10 SNVs. When you move the cursor on each content, you can see more deailed mutation information on the Tooltip. Those are primary_site, primary_histology, mutation(aa), pubmedID. |
| Genomic Position | Mutation(aa) | Unique sampleID count |
| chr14:69259623 | p.F11L,ZFP36L1 | 2 |
| chr14:69256498 | p.E257K,ZFP36L1 | 2 |
| chr14:69256761 | p.Y169C,ZFP36L1 | 2 |
| chr14:69256856 | p.L278L,ZFP36L1 | 1 |
| chr14:69256365 | p.I164I,ZFP36L1 | 1 |
| chr14:69257126 | p.F277L,ZFP36L1 | 1 |
| chr14:69256711 | p.F161L,ZFP36L1 | 1 |
| chr14:69256863 | p.I10I,ZFP36L1 | 1 |
| chr14:69256404 | p.K152K,ZFP36L1 | 1 |
| chr14:69259613 | p.A8A,ZFP36L1 | 1 |
| * Copy number data were extracted from TCGA using R package TCGA-Assembler. The URLs of all public data files on TCGA DCC data server were gathered on Jan-05-2015. Function ProcessCNAData in TCGA-Assembler package was used to obtain gene-level copy number value which is calculated as the average copy number of the genomic region of a gene. |
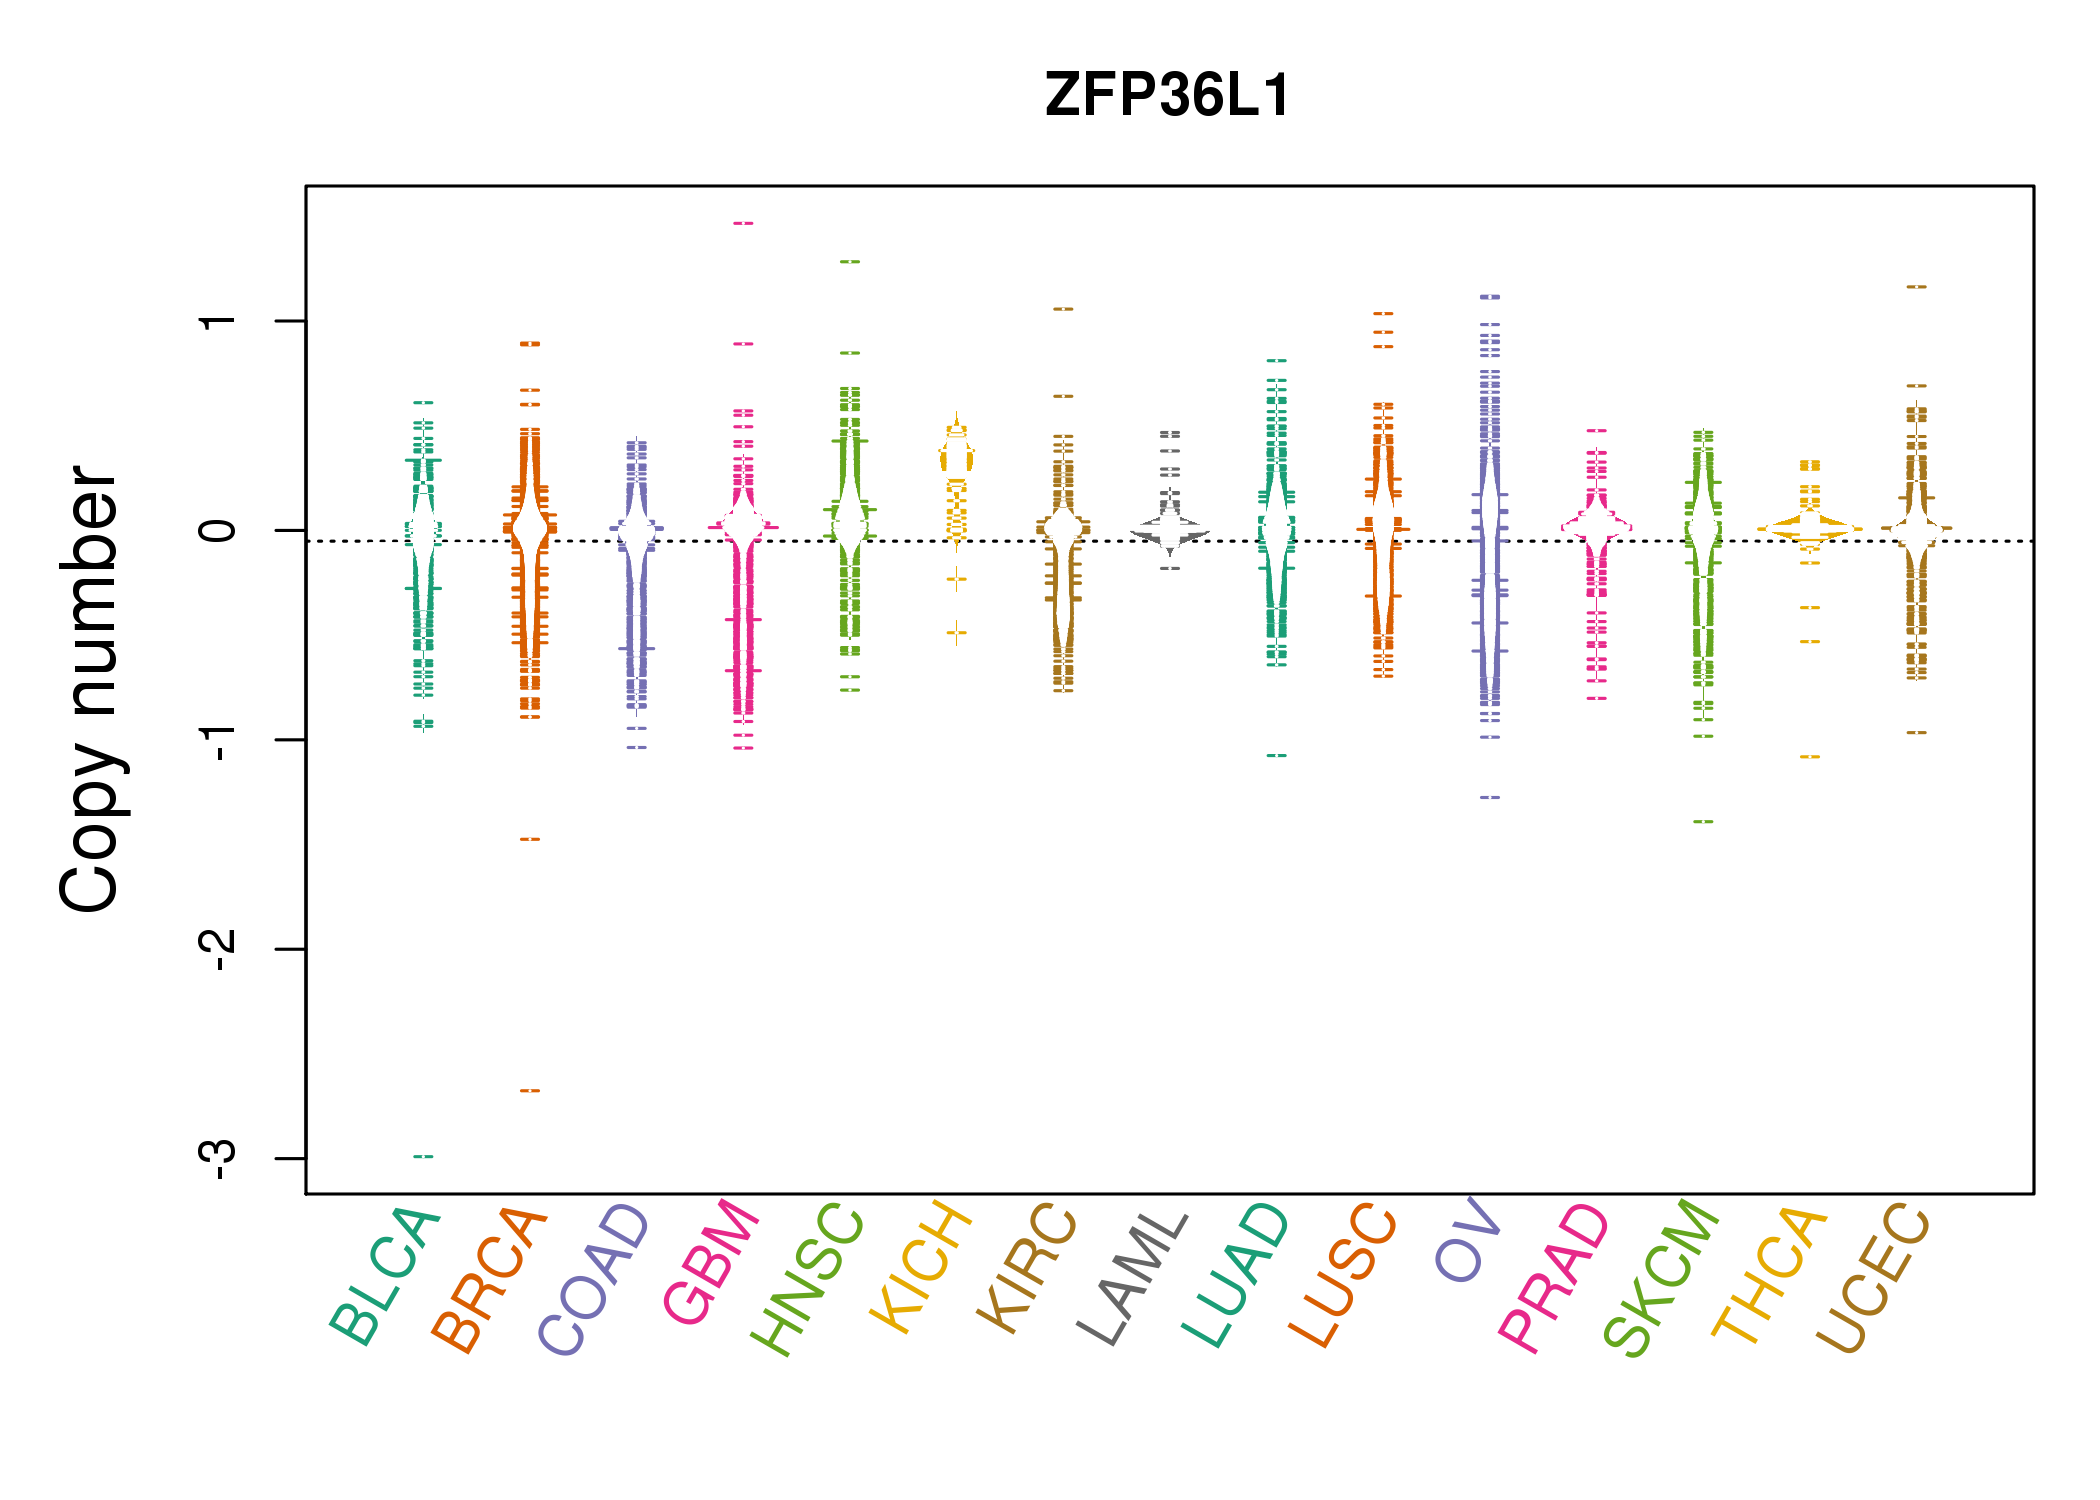 |
| cf) Tissue ID[Tissue type]: BLCA[Bladder Urothelial Carcinoma], BRCA[Breast invasive carcinoma], CESC[Cervical squamous cell carcinoma and endocervical adenocarcinoma], COAD[Colon adenocarcinoma], GBM[Glioblastoma multiforme], Glioma Low Grade, HNSC[Head and Neck squamous cell carcinoma], KICH[Kidney Chromophobe], KIRC[Kidney renal clear cell carcinoma], KIRP[Kidney renal papillary cell carcinoma], LAML[Acute Myeloid Leukemia], LUAD[Lung adenocarcinoma], LUSC[Lung squamous cell carcinoma], OV[Ovarian serous cystadenocarcinoma ], PAAD[Pancreatic adenocarcinoma], PRAD[Prostate adenocarcinoma], SKCM[Skin Cutaneous Melanoma], STAD[Stomach adenocarcinoma], THCA[Thyroid carcinoma], UCEC[Uterine Corpus Endometrial Carcinoma] |
| Top |
| Gene Expression for ZFP36L1 |
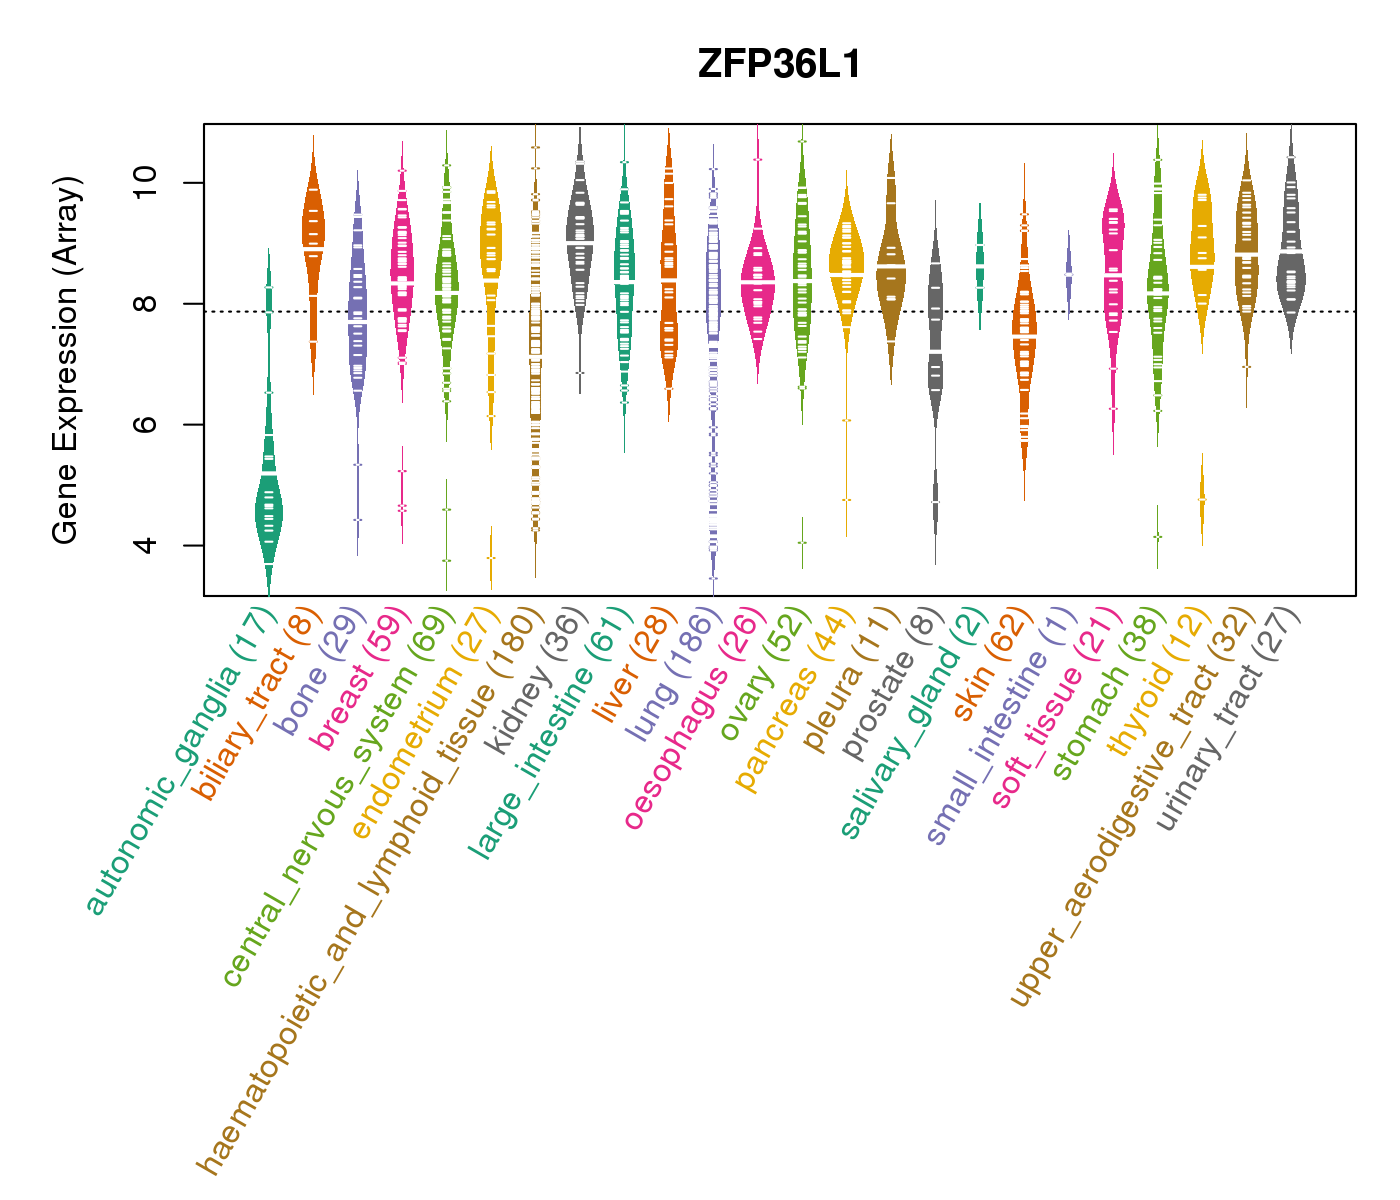
| * CCLE gene expression data were extracted from CCLE_Expression_Entrez_2012-10-18.res: Gene-centric RMA-normalized mRNA expression data. |
 |
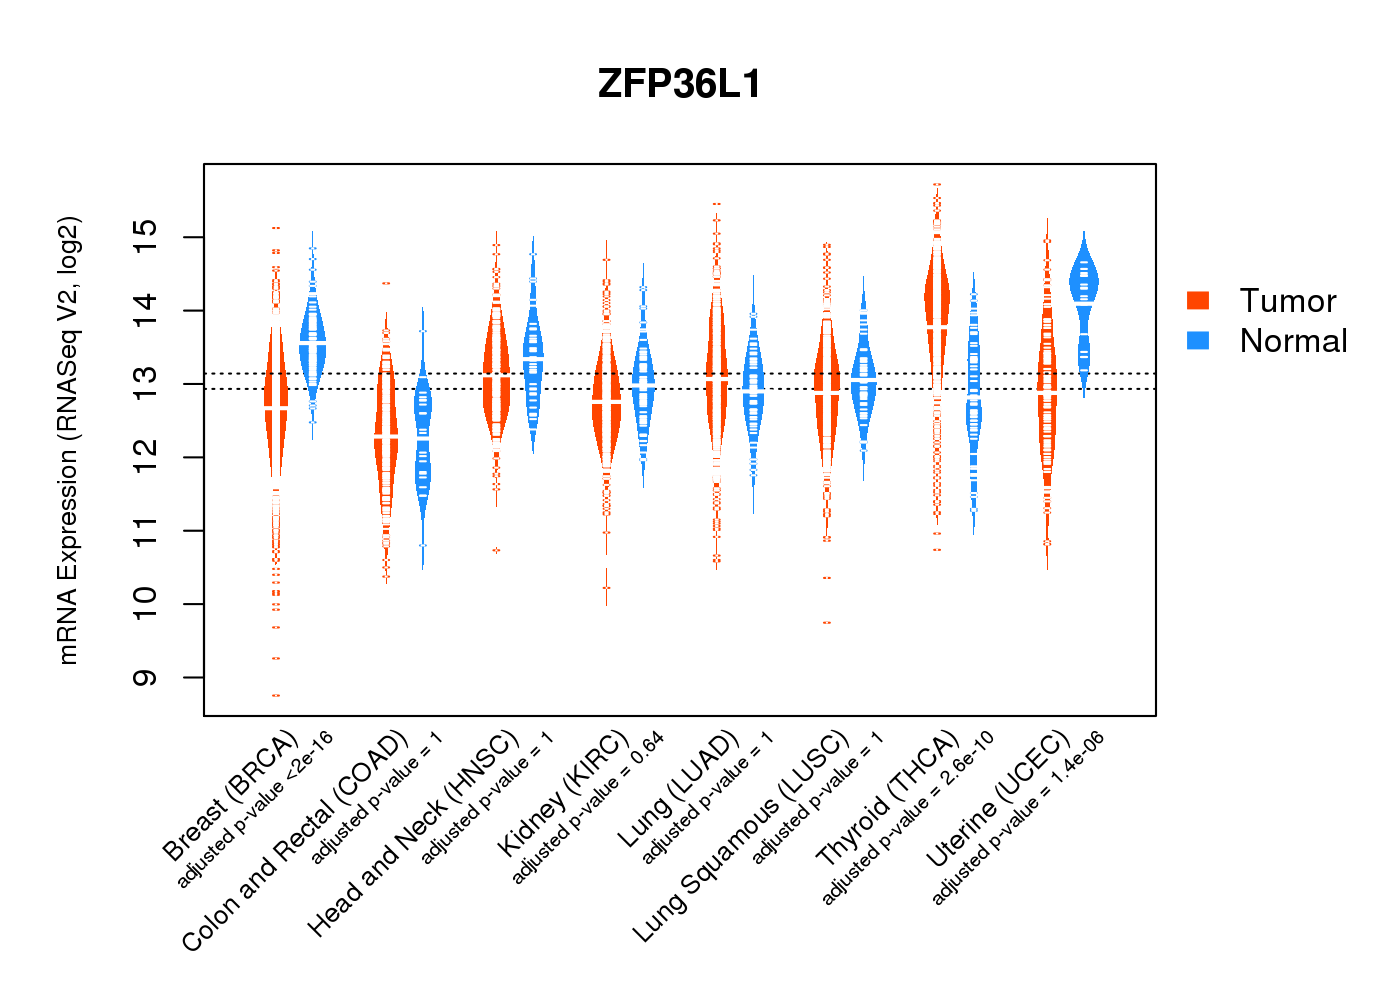
| * Normalized gene expression data of RNASeqV2 was extracted from TCGA using R package TCGA-Assembler. The URLs of all public data files on TCGA DCC data server were gathered at Jan-05-2015. Only eight cancer types have enough normal control samples for differential expression analysis. (t test, adjusted p<0.05 (using Benjamini-Hochberg FDR)) |
 |
| Top |
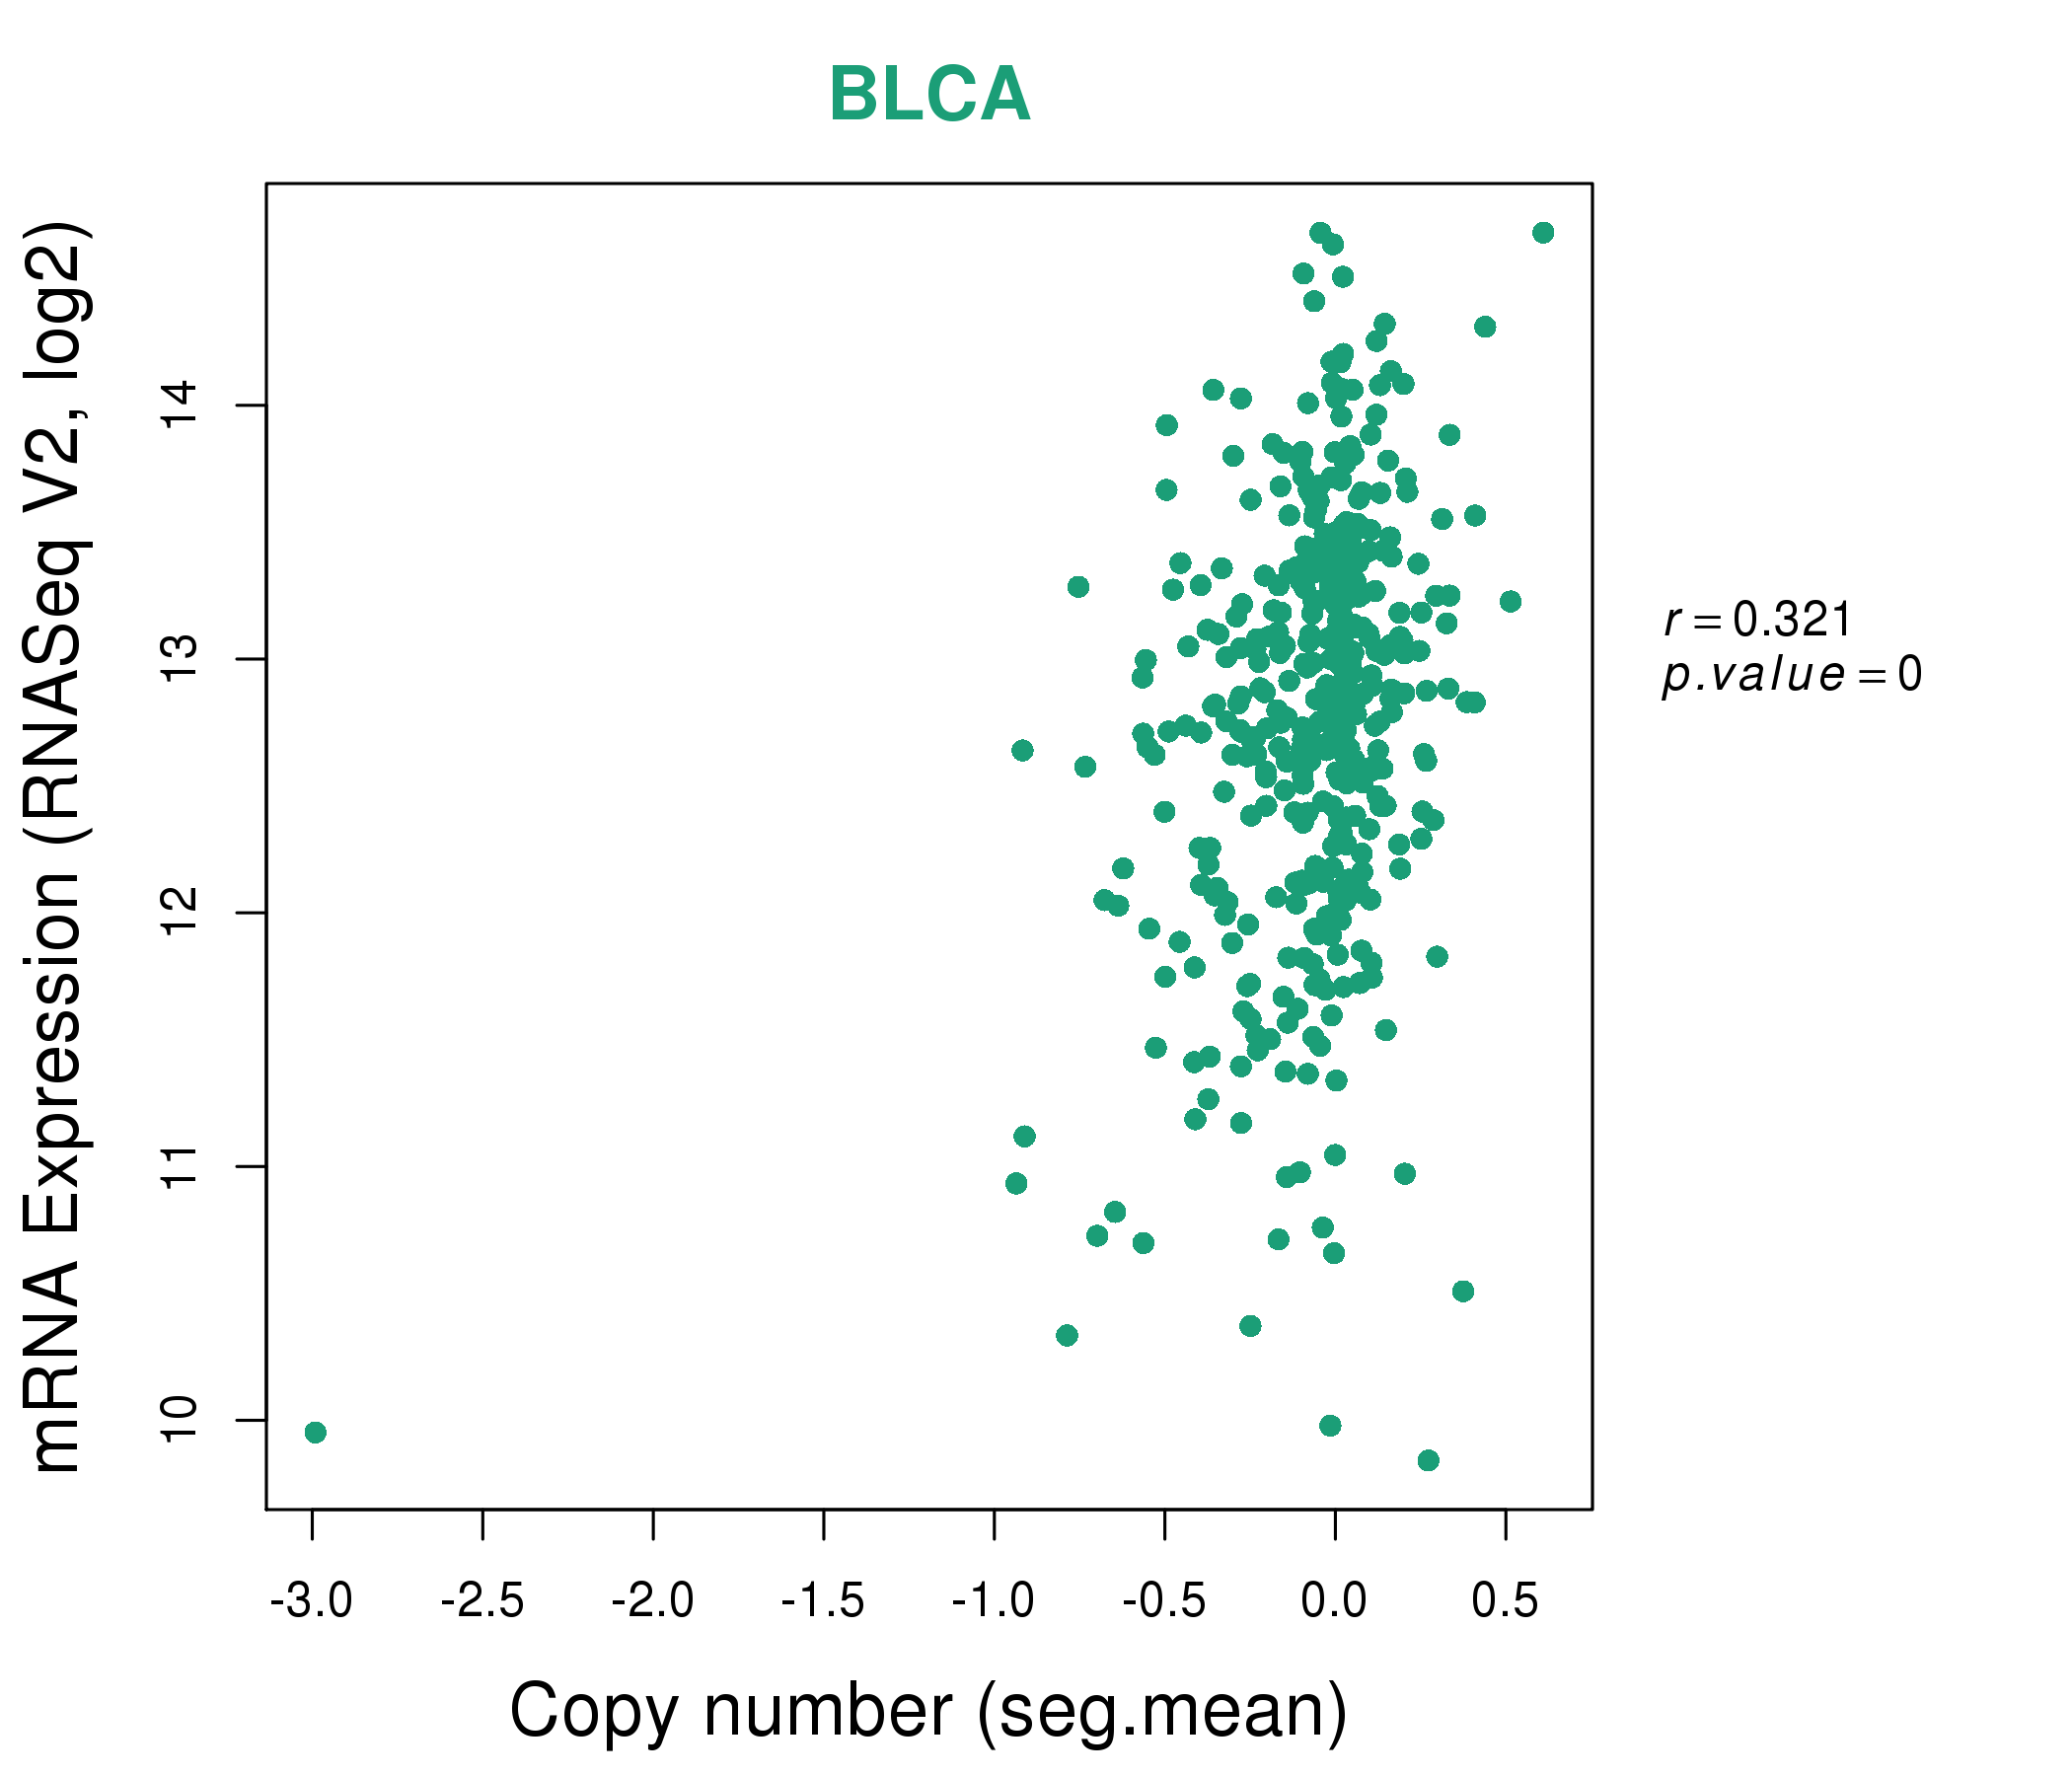
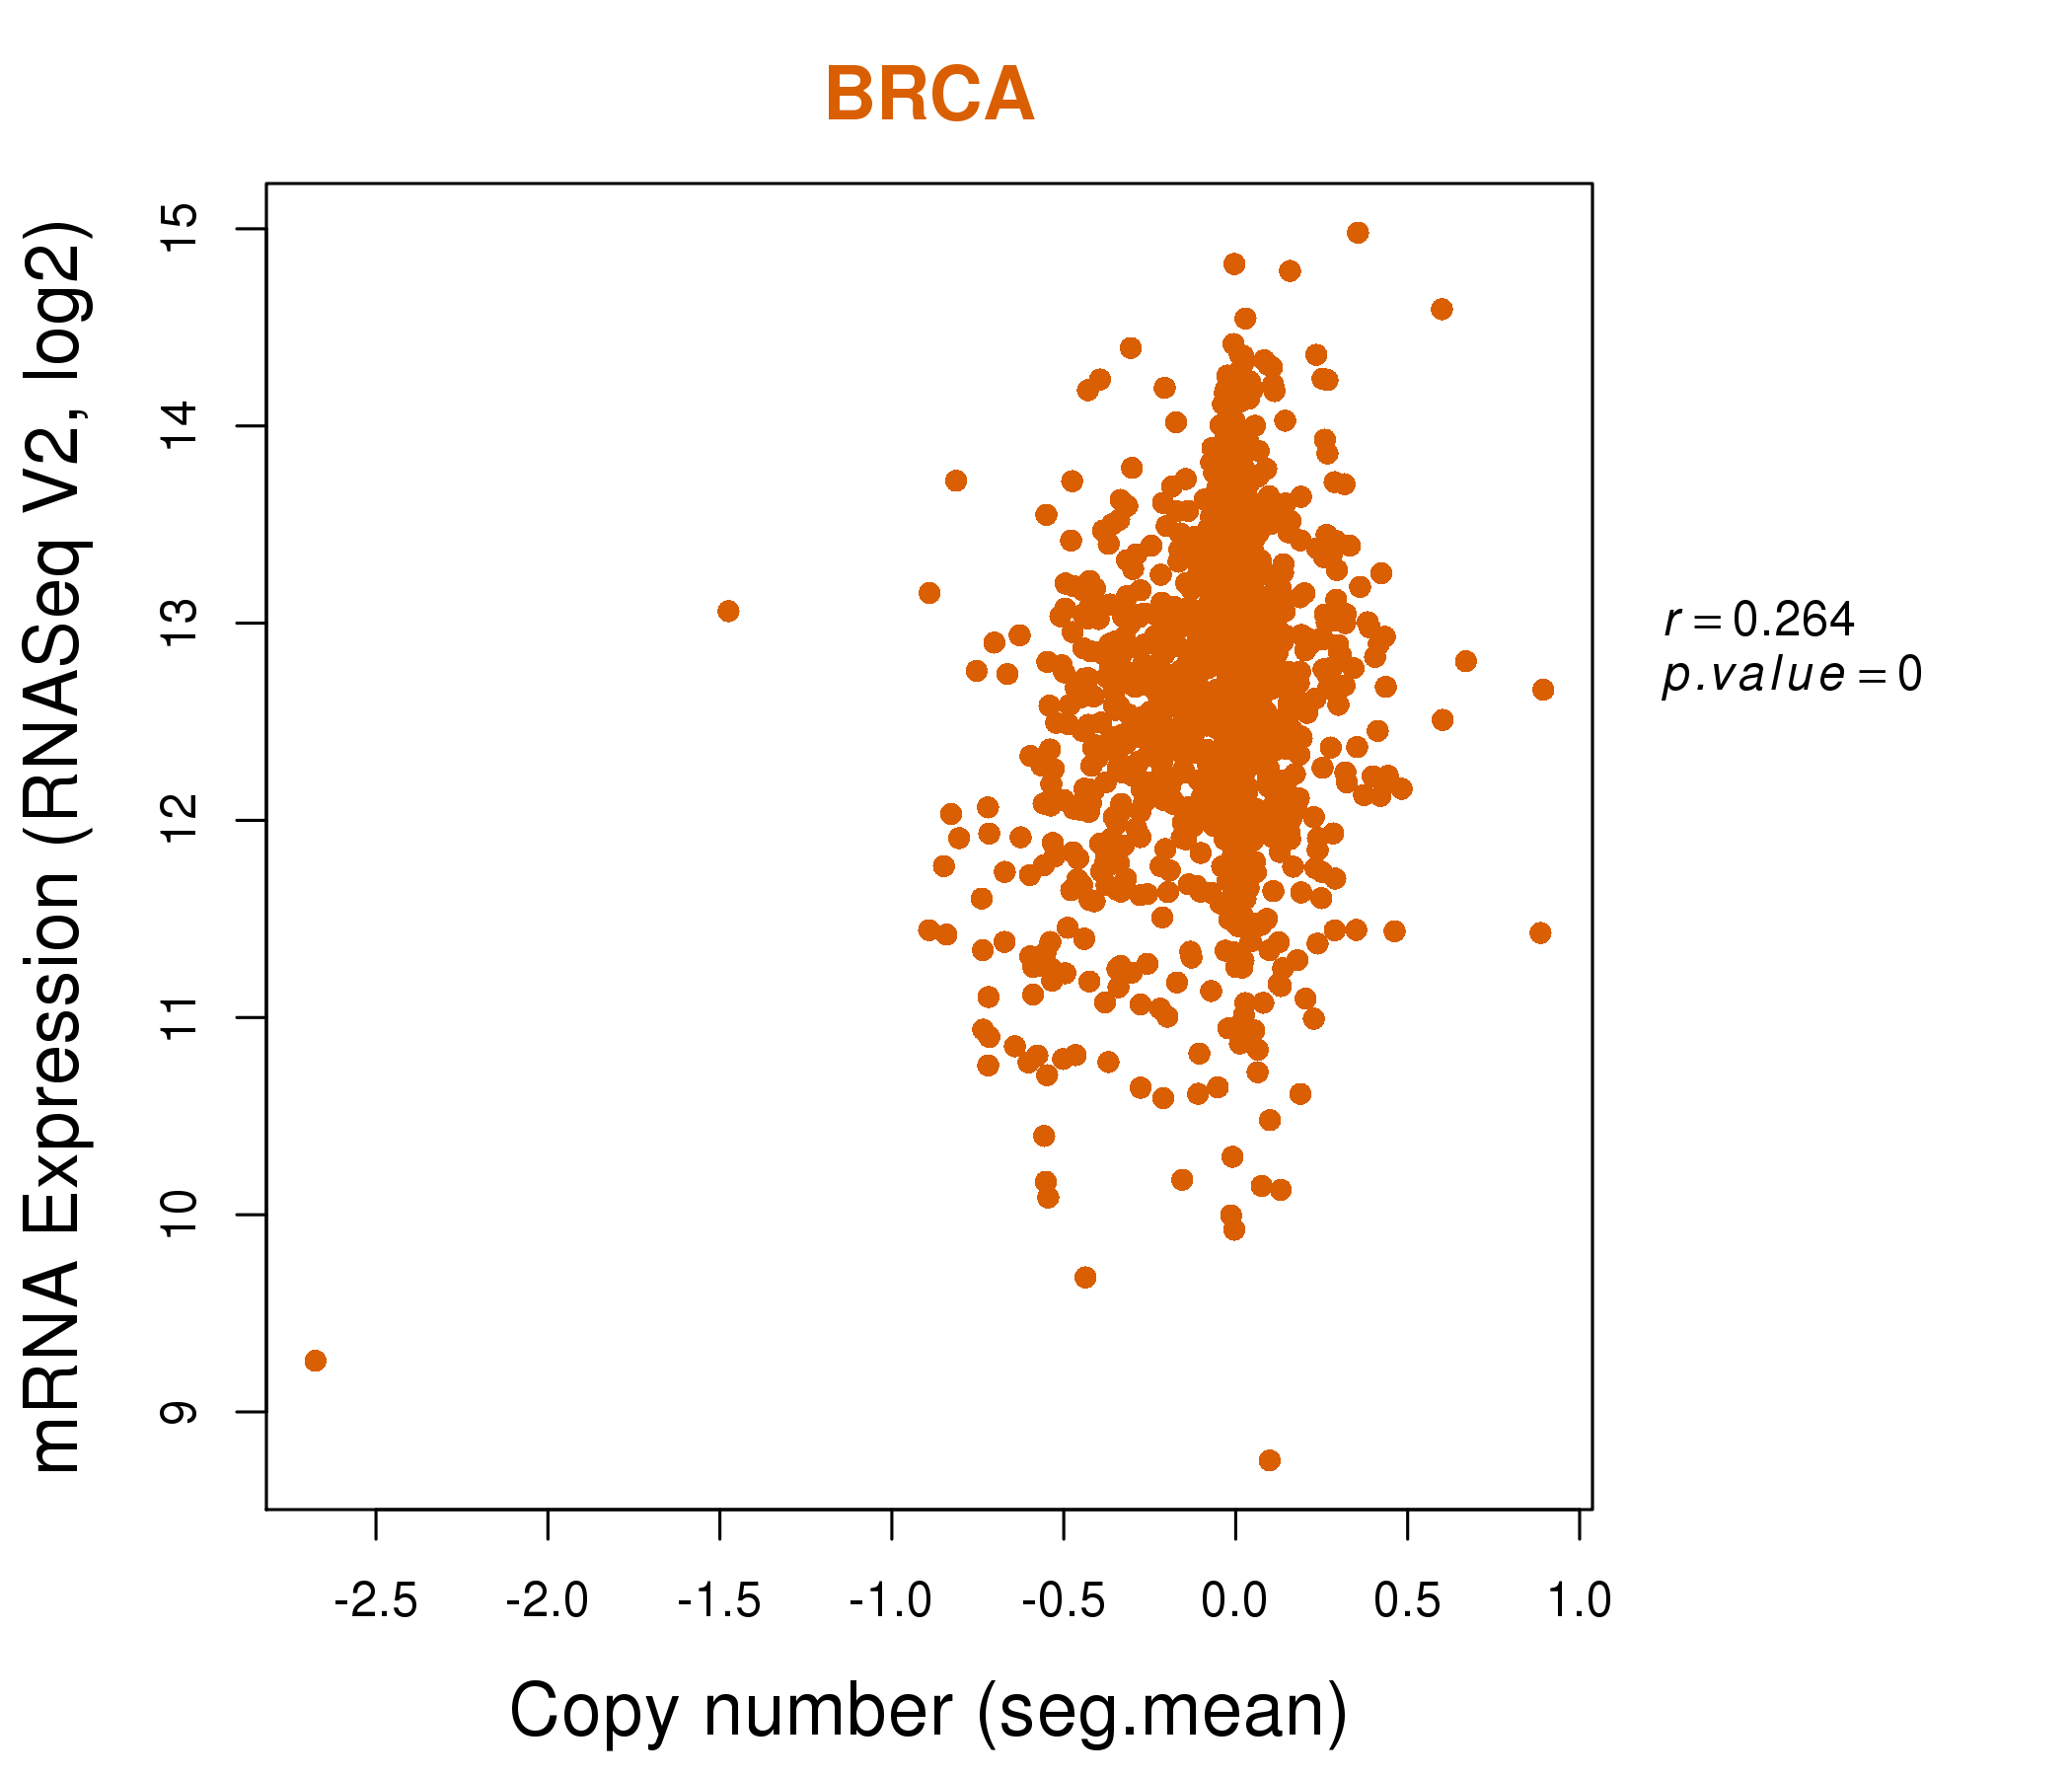
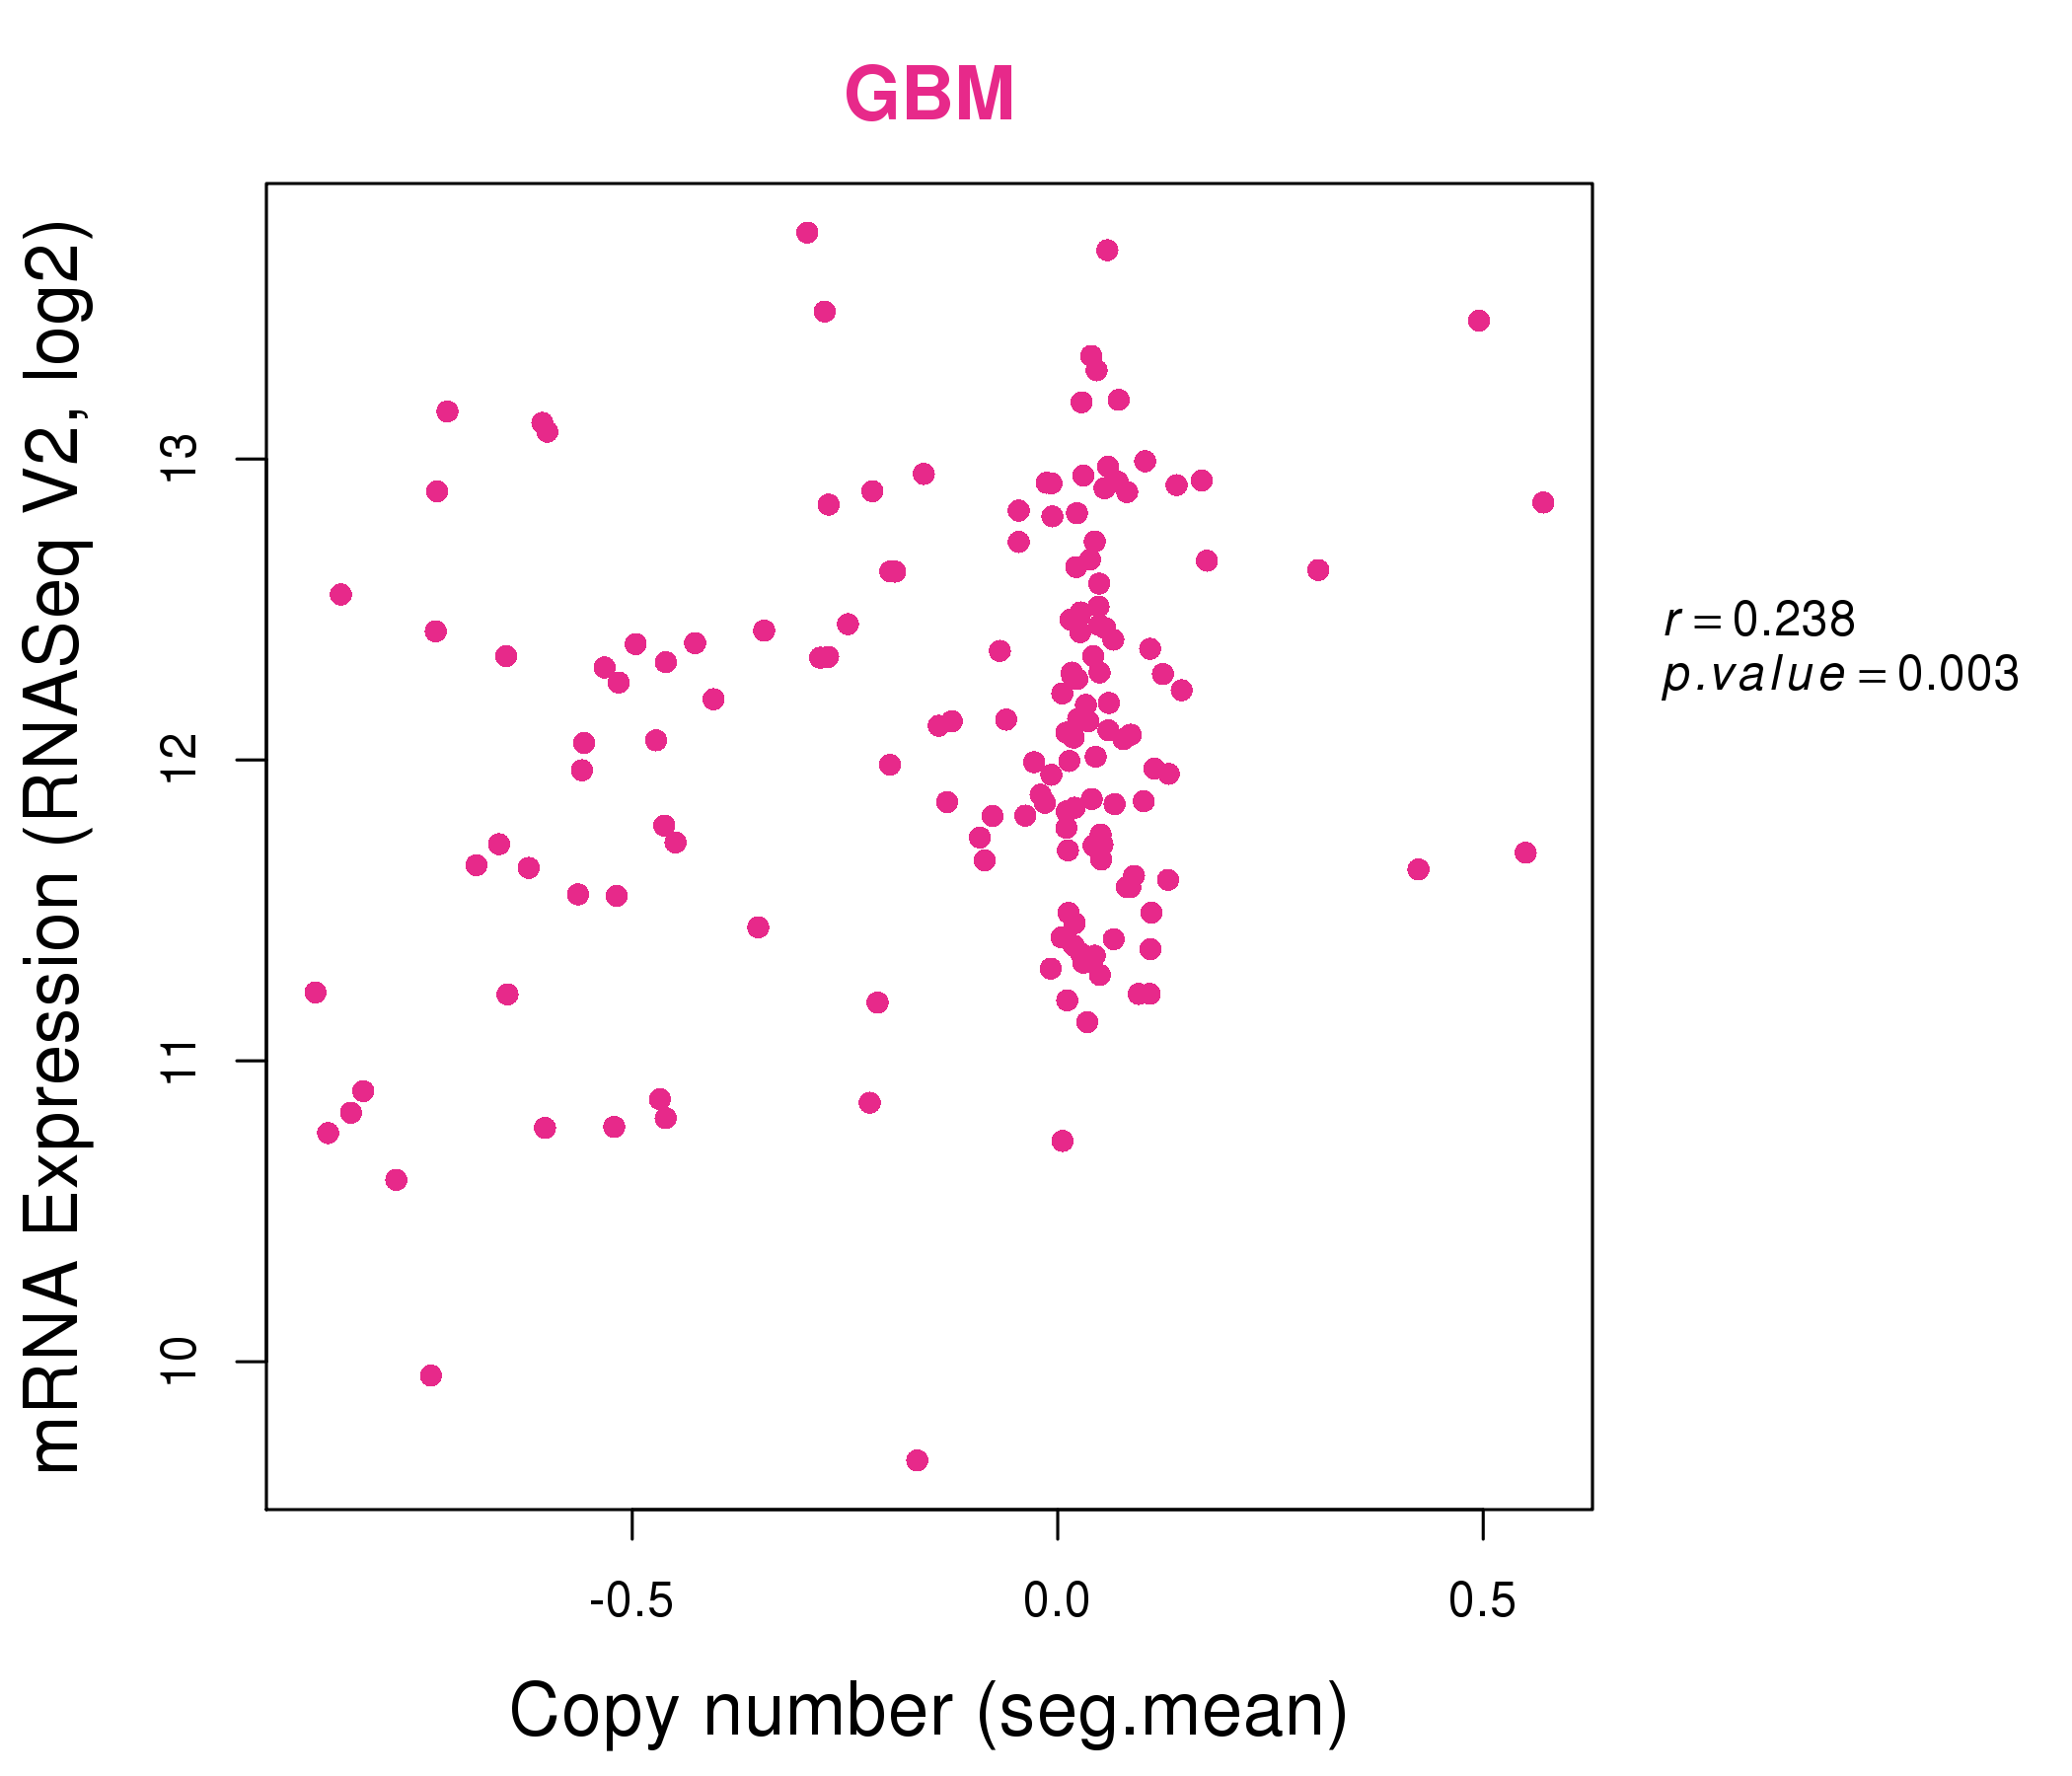
| * This plots show the correlation between CNV and gene expression. |
: Open all plots for all cancer types
 |
|
 |
|
| Top |
| Gene-Gene Network Information |
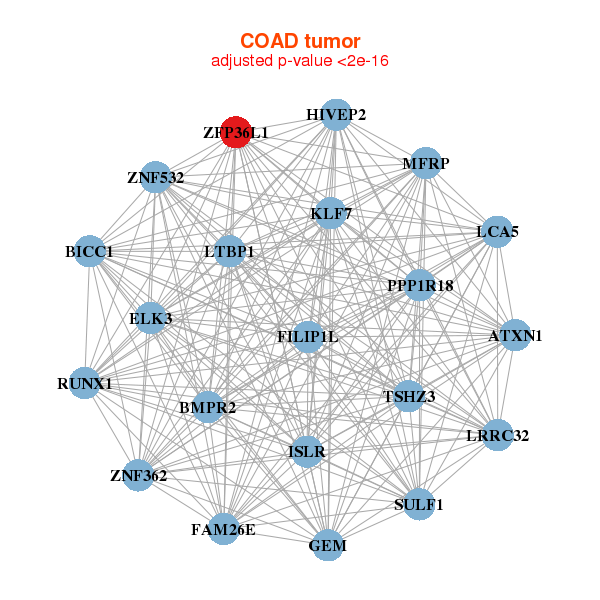
| * Co-Expression network figures were drawn using R package igraph. Only the top 20 genes with the highest correlations were shown. Red circle: input gene, orange circle: cell metabolism gene, sky circle: other gene |
: Open all plots for all cancer types
 |
|
| CYR61,EGR1,EVC,GAS7,GEM,GLI2,GPR124, ITPRIP,JUN,LRP1,MFAP4,PEAR1,PHLDB1,PODN, RHOJ,TGFB3,TSHZ3,YAP1,ZFP36,ZFP36L1,ZFP36L2 | ATF3,BCL10,CHIC2,CXCL2,DUSP1,DUSP5,EGR1, FOS,ID2,LPAR6,NFKBIZ,NR4A2,PTGS2,RAB2B, SERTAD2,TBPL1,TMEM170A,TNFSF10,TUBD1,TUBE1,ZFP36L1 |
 |
|
| ATXN1,BICC1,BMPR2,ELK3,FAM26E,FILIP1L,GEM, HIVEP2,ISLR,PPP1R18,KLF7,LCA5,LRRC32,LTBP1, MFRP,RUNX1,SULF1,TSHZ3,ZFP36L1,ZNF362,ZNF532 | CHST3,DLG2,DZIP1,EFS,HSPA12A,IPW,MPPED2, NCAM1,NLGN2,NLGN3,NPR2,PEG3,PLXNB3,PRIMA1, SCN2B,SLC4A3,TCF7L1,TRO,WASF1,WHAMMP2,ZFP36L1 |

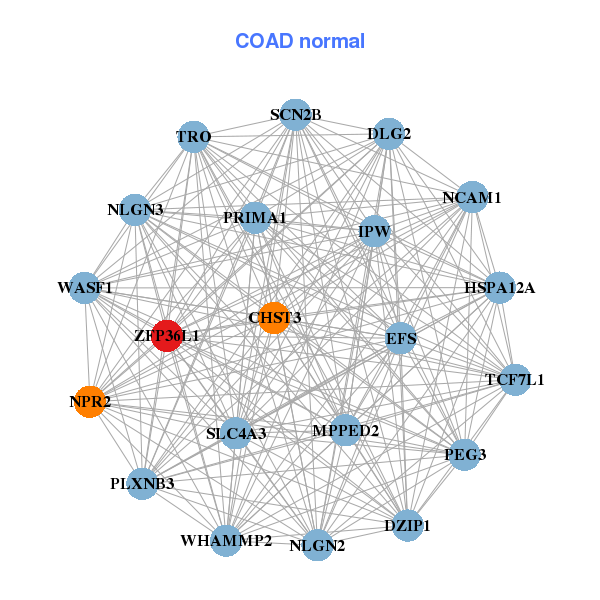
| * Co-Expression network figures were drawn using R package igraph. Only the top 20 genes with the highest correlations were shown. Red circle: input gene, orange circle: cell metabolism gene, sky circle: other gene |
: Open all plots for all cancer types
| Top |
: Open all interacting genes' information including KEGG pathway for all interacting genes from DAVID
| Top |
| Pharmacological Information for ZFP36L1 |
| There's no related Drug. |
| Top |
| Cross referenced IDs for ZFP36L1 |
| * We obtained these cross-references from Uniprot database. It covers 150 different DBs, 18 categories. http://www.uniprot.org/help/cross_references_section |
: Open all cross reference information
|
Copyright © 2016-Present - The Univsersity of Texas Health Science Center at Houston @ |