|
||||||||||||||||||||||||||||||||||||||||||||||||||||||||||||||||||||||||||||||||||||||||||||||||||||||||||||||||||||||||||||||||||||||||||||||||||||||||||||||||||||||||||||||||||||||||||||||||||||||||||||||||||||||||||||||||||||||||||||||||||||||||||||||||||||||||||||||||||||||||||||||||||||||||||||||||||||||||||
| |
| Phenotypic Information (metabolism pathway, cancer, disease, phenome) |
| |
| |
| Gene-Gene Network Information: Co-Expression Network, Interacting Genes & KEGG |
| |
|


| Gene Summary for STAR |
| Basic gene info. | Gene symbol | STAR |
| Gene name | steroidogenic acute regulatory protein | |
| Synonyms | STARD1 | |
| Cytomap | UCSC genome browser: 8p11.2 | |
| Genomic location | chr8 :38000217-38008600 | |
| Type of gene | protein-coding | |
| RefGenes | NM_000349.2, NM_001007243.1, | |
| Ensembl id | ENSG00000147465 | |
| Description | START domain containing 1START domain-containing protein 1StAR-related lipid transfer (START) domain containing 1cholesterol traffickermitochondrial steroid acute regulatory proteinsteroid acute regulatory proteinsteroidogenic acute regulatorsteroi | |
| Modification date | 20141207 | |
| dbXrefs | MIM : 600617 | |
| HGNC : HGNC | ||
| HPRD : 02794 | ||
| Protein | UniProt: go to UniProt's Cross Reference DB Table | |
| Expression | CleanEX: HS_STAR | |
| BioGPS: 6770 | ||
| Gene Expression Atlas: ENSG00000147465 | ||
| The Human Protein Atlas: ENSG00000147465 | ||
| Pathway | NCI Pathway Interaction Database: STAR | |
| KEGG: STAR | ||
| REACTOME: STAR | ||
| ConsensusPathDB | ||
| Pathway Commons: STAR | ||
| Metabolism | MetaCyc: STAR | |
| HUMANCyc: STAR | ||
| Regulation | Ensembl's Regulation: ENSG00000147465 | |
| miRBase: chr8 :38,000,217-38,008,600 | ||
| TargetScan: NM_000349 | ||
| cisRED: ENSG00000147465 | ||
| Context | iHOP: STAR | |
| cancer metabolism search in PubMed: STAR | ||
| UCL Cancer Institute: STAR | ||
| Assigned class in ccmGDB | C | |
| Top |
| Phenotypic Information for STAR(metabolism pathway, cancer, disease, phenome) |
| Cancer | CGAP: STAR |
| Familial Cancer Database: STAR | |
| * This gene is included in those cancer gene databases. |
|
|
|
|
|
| . | ||||||||||||||||||||||||||||||||||||||||||||||||||||||||||||||||||||||||||||||||||||||||||||||||||||||||||||||||||||||||||||||||||||||||||||||||||||||||||||||||||||||||||||||||||||||||||||||||||||||||||||||||||||||||||||||||||||||||||||||||||||||||||||||||||||||||||||||||||||||||||||||||||||||||||||||||||||
Oncogene 1 | Significant driver gene in | |||||||||||||||||||||||||||||||||||||||||||||||||||||||||||||||||||||||||||||||||||||||||||||||||||||||||||||||||||||||||||||||||||||||||||||||||||||||||||||||||||||||||||||||||||||||||||||||||||||||||||||||||||||||||||||||||||||||||||||||||||||||||||||||||||||||||||||||||||||||||||||||||||||||||||||||||||||||||
| cf) number; DB name 1 Oncogene; http://nar.oxfordjournals.org/content/35/suppl_1/D721.long, 2 Tumor Suppressor gene; https://bioinfo.uth.edu/TSGene/, 3 Cancer Gene Census; http://www.nature.com/nrc/journal/v4/n3/abs/nrc1299.html, 4 CancerGenes; http://nar.oxfordjournals.org/content/35/suppl_1/D721.long, 5 Network of Cancer Gene; http://ncg.kcl.ac.uk/index.php, 1Therapeutic Vulnerabilities in Cancer; http://cbio.mskcc.org/cancergenomics/statius/ |
| REACTOME_METABOLISM_OF_STEROID_HORMONES_AND_VITAMINS_A_AND_D REACTOME_METABOLISM_OF_LIPIDS_AND_LIPOPROTEINS | |
| OMIM | |
| Orphanet | |
| Disease | KEGG Disease: STAR |
| MedGen: STAR (Human Medical Genetics with Condition) | |
| ClinVar: STAR | |
| Phenotype | MGI: STAR (International Mouse Phenotyping Consortium) |
| PhenomicDB: STAR | |
| Mutations for STAR |
| * Under tables are showing count per each tissue to give us broad intuition about tissue specific mutation patterns.You can go to the detailed page for each mutation database's web site. |
| There's no structural variation information in COSMIC data for this gene. |
| * From mRNA Sanger sequences, Chitars2.0 arranged chimeric transcripts. This table shows STAR related fusion information. |
| ID | Head Gene | Tail Gene | Accession | Gene_a | qStart_a | qEnd_a | Chromosome_a | tStart_a | tEnd_a | Gene_a | qStart_a | qEnd_a | Chromosome_a | tStart_a | tEnd_a |
| BP196904 | STAR | 1 | 351 | 8 | 38005805 | 38008468 | MAP7 | 346 | 579 | 6 | 136862458 | 136862691 | |
| AV705820 | ELL3 | 1 | 112 | 15 | 44084511 | 44085212 | STAR | 112 | 593 | 8 | 38003812 | 38008344 | |
| AV703221 | GPI | 1 | 212 | 19 | 34893033 | 34893244 | STAR | 213 | 411 | 8 | 38001350 | 38001602 | |
| DA569262 | STAR | 1 | 470 | 8 | 38001809 | 38008570 | STAR | 460 | 665 | 8 | 38006158 | 38008365 | |
| Top |
| Mutation type/ Tissue ID | brca | cns | cerv | endome | haematopo | kidn | Lintest | liver | lung | ns | ovary | pancre | prost | skin | stoma | thyro | urina | |||
| Total # sample | 1 | 1 | ||||||||||||||||||
| GAIN (# sample) | 1 | 1 | ||||||||||||||||||
| LOSS (# sample) |
| cf) Tissue ID; Tissue type (1; Breast, 2; Central_nervous_system, 3; Cervix, 4; Endometrium, 5; Haematopoietic_and_lymphoid_tissue, 6; Kidney, 7; Large_intestine, 8; Liver, 9; Lung, 10; NS, 11; Ovary, 12; Pancreas, 13; Prostate, 14; Skin, 15; Stomach, 16; Thyroid, 17; Urinary_tract) |
| Top |
|
 |
| Top |
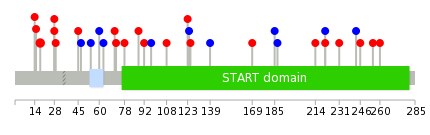
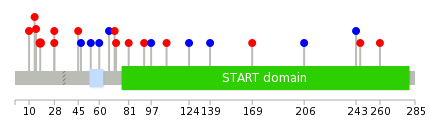
| Stat. for Non-Synonymous SNVs (# total SNVs=19) | (# total SNVs=8) |
 |  |
(# total SNVs=0) | (# total SNVs=1) |
 |
| Top |
| * When you move the cursor on each content, you can see more deailed mutation information on the Tooltip. Those are primary_site,primary_histology,mutation(aa),pubmedID. |
| GRCh37 position | Mutation(aa) | Unique sampleID count |
| chr8:38008285-38008285 | p.R18C | 2 |
| chr8:38002823-38002823 | p.G221S | 1 |
| chr8:38005720-38005720 | p.Q102* | 1 |
| chr8:38006196-38006196 | p.T47T | 1 |
| chr8:38003490-38003490 | p.G214D | 1 |
| chr8:38005733-38005733 | p.K97K | 1 |
| chr8:38006204-38006204 | p.P45T | 1 |
| chr8:38003570-38003570 | p.V187V | 1 |
| chr8:38005748-38005748 | p.N92K | 1 |
| chr8:38006211-38006212 | p.T44fs*3 | 1 |
| Top |
|
 |
| Point Mutation/ Tissue ID | 1 | 2 | 3 | 4 | 5 | 6 | 7 | 8 | 9 | 10 | 11 | 12 | 13 | 14 | 15 | 16 | 17 | 18 | 19 | 20 |
| # sample | 3 | 1 | 3 | 1 | 3 | 4 | 2 | 1 | 1 | 1 | 4 | |||||||||
| # mutation | 3 | 1 | 3 | 1 | 3 | 4 | 2 | 1 | 1 | 1 | 5 | |||||||||
| nonsynonymous SNV | 1 | 1 | 1 | 3 | 4 | 1 | 1 | 4 | ||||||||||||
| synonymous SNV | 2 | 1 | 2 | 1 | 1 | 1 | 1 |
| cf) Tissue ID; Tissue type (1; BLCA[Bladder Urothelial Carcinoma], 2; BRCA[Breast invasive carcinoma], 3; CESC[Cervical squamous cell carcinoma and endocervical adenocarcinoma], 4; COAD[Colon adenocarcinoma], 5; GBM[Glioblastoma multiforme], 6; Glioma Low Grade, 7; HNSC[Head and Neck squamous cell carcinoma], 8; KICH[Kidney Chromophobe], 9; KIRC[Kidney renal clear cell carcinoma], 10; KIRP[Kidney renal papillary cell carcinoma], 11; LAML[Acute Myeloid Leukemia], 12; LUAD[Lung adenocarcinoma], 13; LUSC[Lung squamous cell carcinoma], 14; OV[Ovarian serous cystadenocarcinoma ], 15; PAAD[Pancreatic adenocarcinoma], 16; PRAD[Prostate adenocarcinoma], 17; SKCM[Skin Cutaneous Melanoma], 18:STAD[Stomach adenocarcinoma], 19:THCA[Thyroid carcinoma], 20:UCEC[Uterine Corpus Endometrial Carcinoma]) |
| Top |
| * We represented just top 10 SNVs. When you move the cursor on each content, you can see more deailed mutation information on the Tooltip. Those are primary_site, primary_histology, mutation(aa), pubmedID. |
| Genomic Position | Mutation(aa) | Unique sampleID count |
| chr8:38008285 | p.R18C | 2 |
| chr8:38003900 | p.E81K | 1 |
| chr8:38006204 | p.E72K | 1 |
| chr8:38003950 | p.Q71H | 1 |
| chr8:38006254 | p.L67L | 1 |
| chr8:38005733 | p.G60G | 1 |
| chr8:38006255 | p.R54R | 1 |
| chr8:38005748 | p.L260M | 1 |
| chr8:38005783 | p.T47T | 1 |
| chr8:38008293 | p.D246N | 1 |
| * Copy number data were extracted from TCGA using R package TCGA-Assembler. The URLs of all public data files on TCGA DCC data server were gathered on Jan-05-2015. Function ProcessCNAData in TCGA-Assembler package was used to obtain gene-level copy number value which is calculated as the average copy number of the genomic region of a gene. |
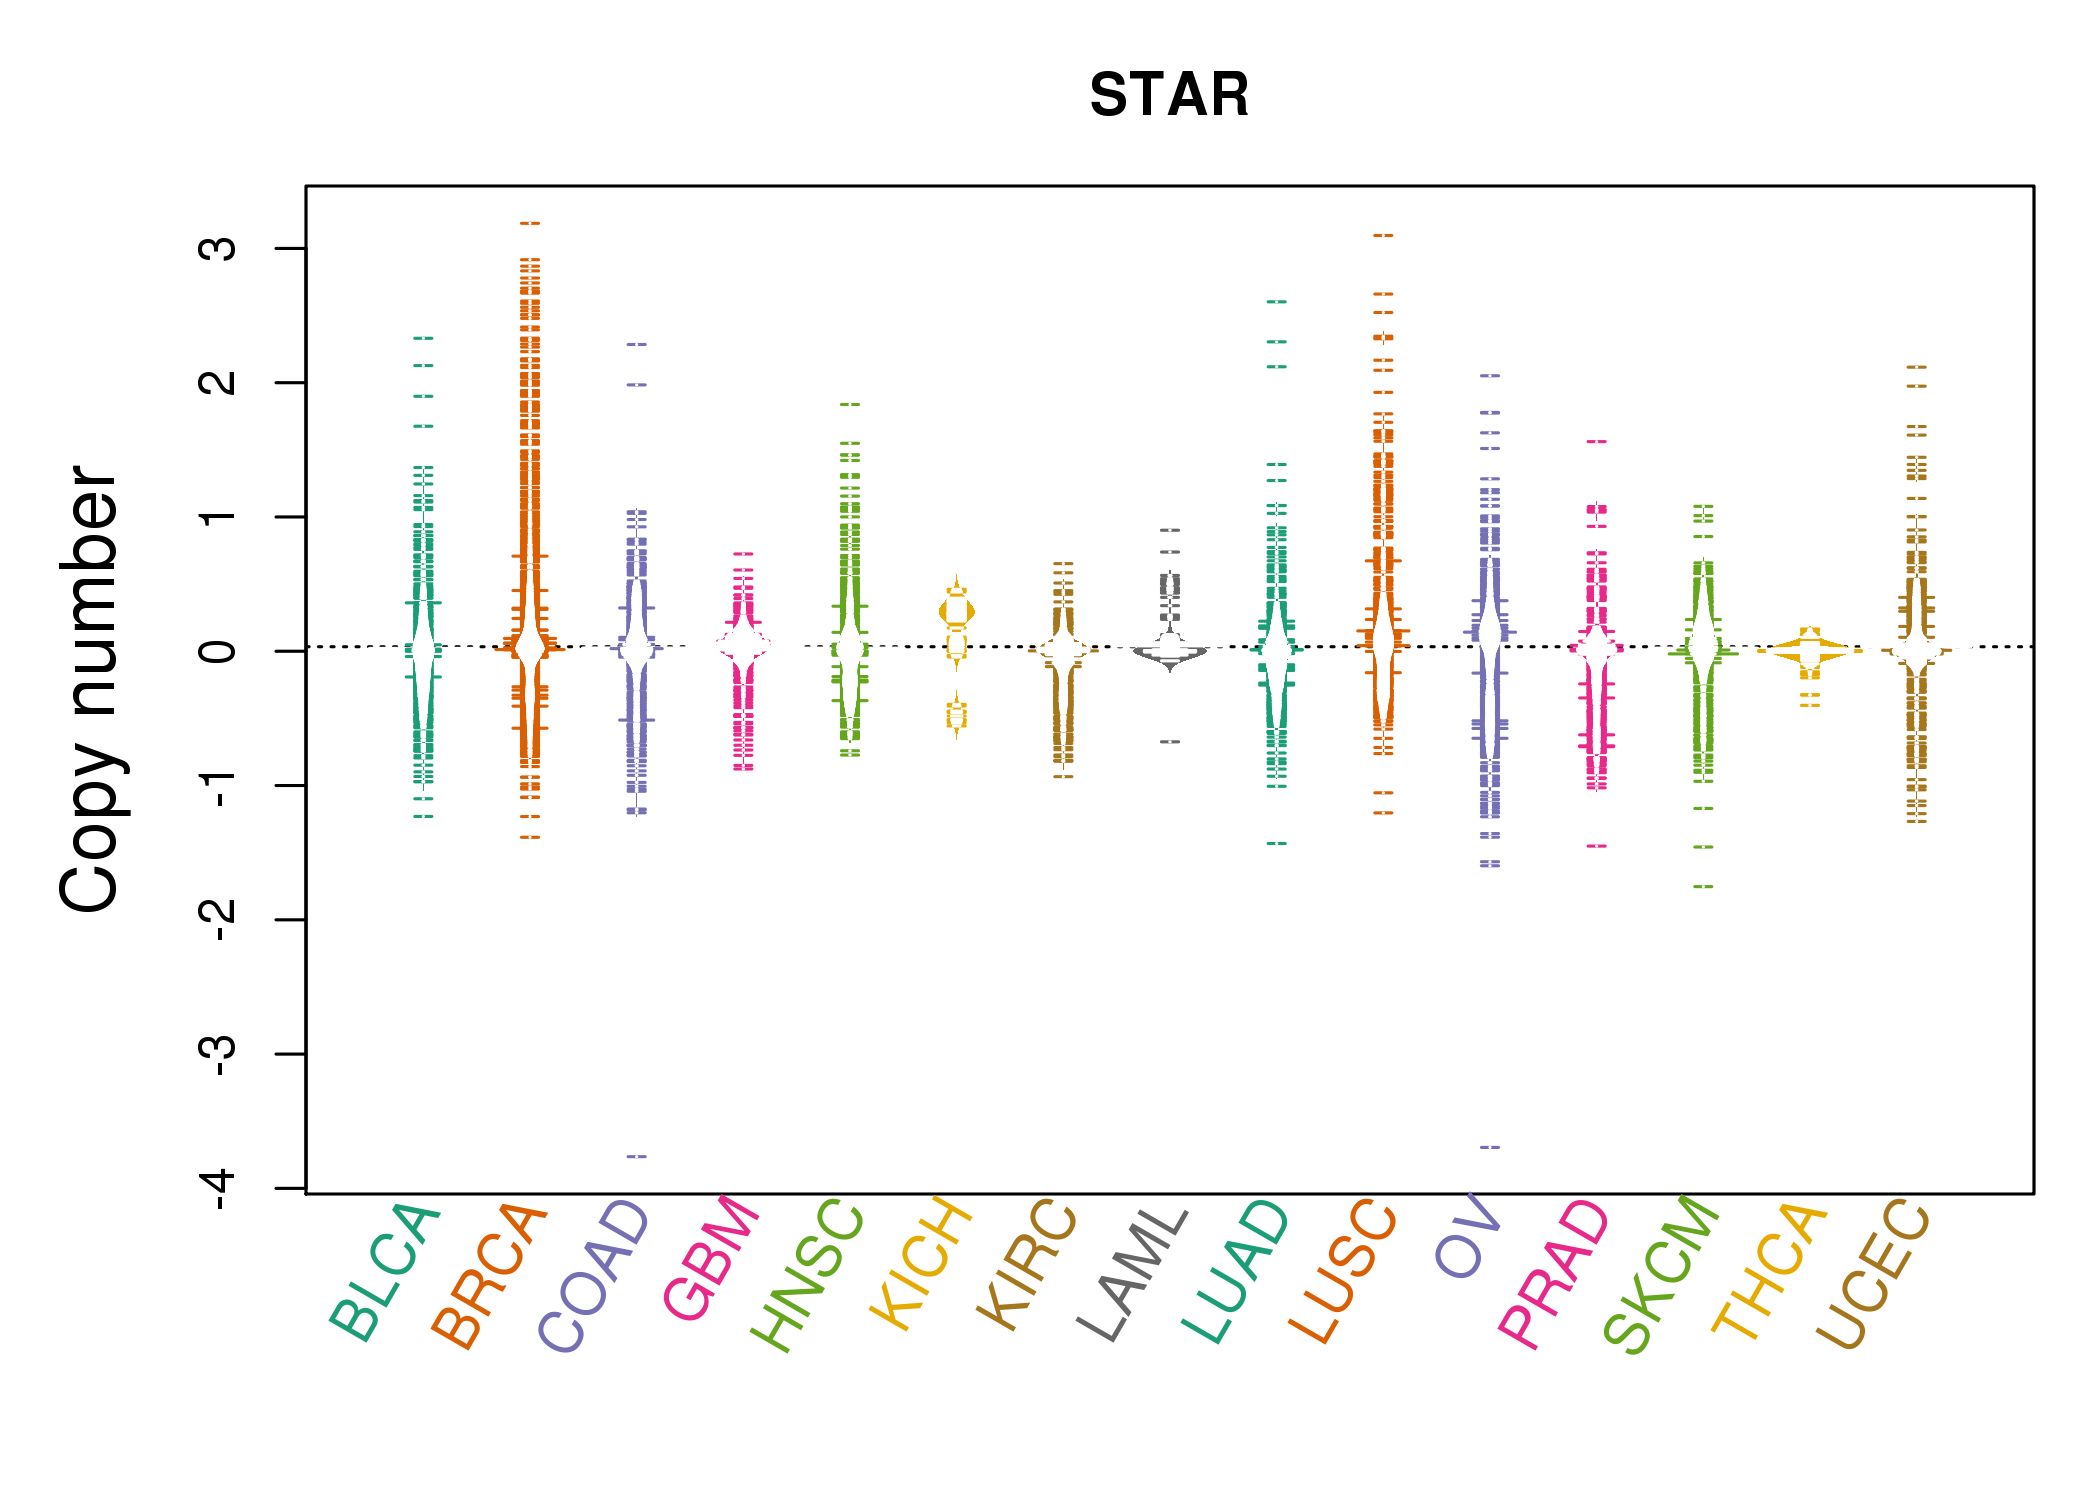 |
| cf) Tissue ID[Tissue type]: BLCA[Bladder Urothelial Carcinoma], BRCA[Breast invasive carcinoma], CESC[Cervical squamous cell carcinoma and endocervical adenocarcinoma], COAD[Colon adenocarcinoma], GBM[Glioblastoma multiforme], Glioma Low Grade, HNSC[Head and Neck squamous cell carcinoma], KICH[Kidney Chromophobe], KIRC[Kidney renal clear cell carcinoma], KIRP[Kidney renal papillary cell carcinoma], LAML[Acute Myeloid Leukemia], LUAD[Lung adenocarcinoma], LUSC[Lung squamous cell carcinoma], OV[Ovarian serous cystadenocarcinoma ], PAAD[Pancreatic adenocarcinoma], PRAD[Prostate adenocarcinoma], SKCM[Skin Cutaneous Melanoma], STAD[Stomach adenocarcinoma], THCA[Thyroid carcinoma], UCEC[Uterine Corpus Endometrial Carcinoma] |
| Top |
| Gene Expression for STAR |
| * CCLE gene expression data were extracted from CCLE_Expression_Entrez_2012-10-18.res: Gene-centric RMA-normalized mRNA expression data. |
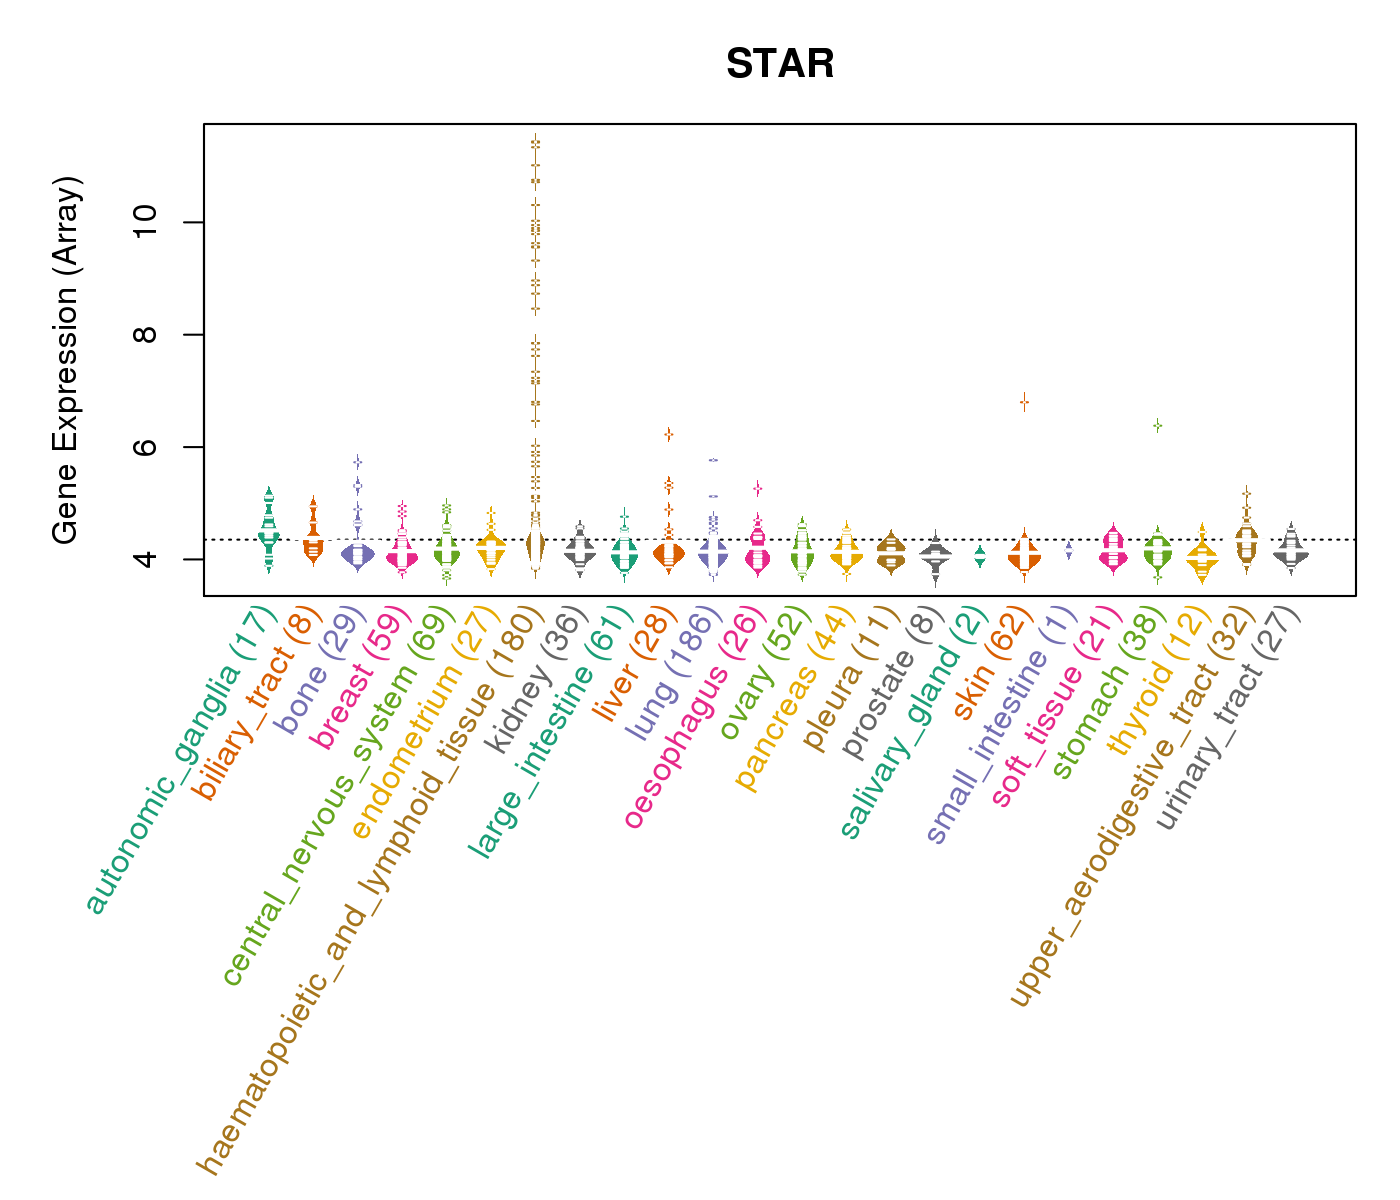 |
| * Normalized gene expression data of RNASeqV2 was extracted from TCGA using R package TCGA-Assembler. The URLs of all public data files on TCGA DCC data server were gathered at Jan-05-2015. Only eight cancer types have enough normal control samples for differential expression analysis. (t test, adjusted p<0.05 (using Benjamini-Hochberg FDR)) |
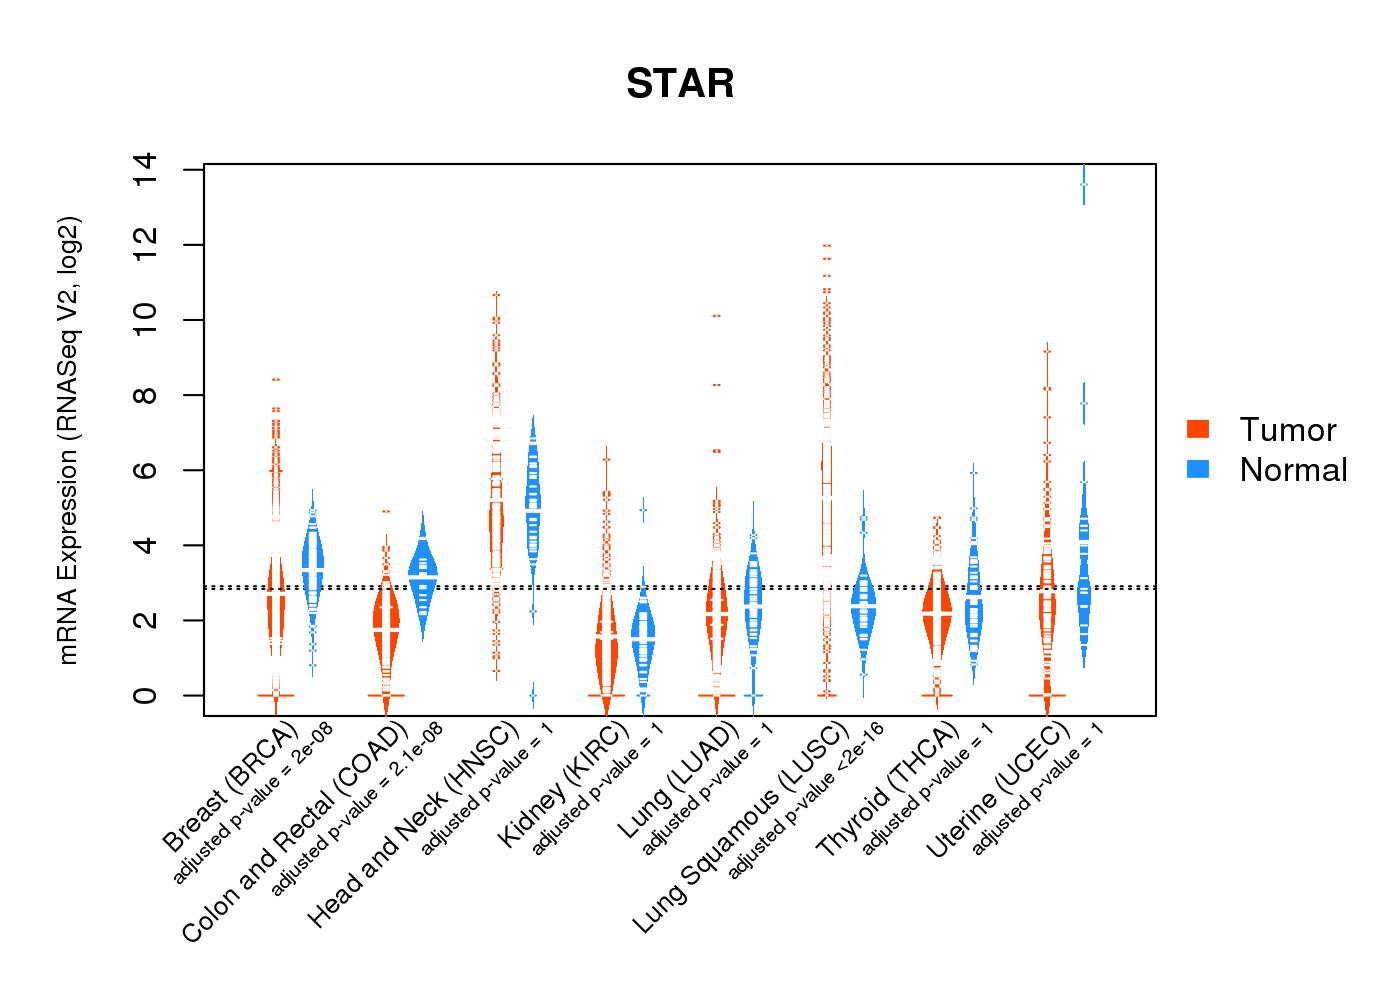 |
| Top |
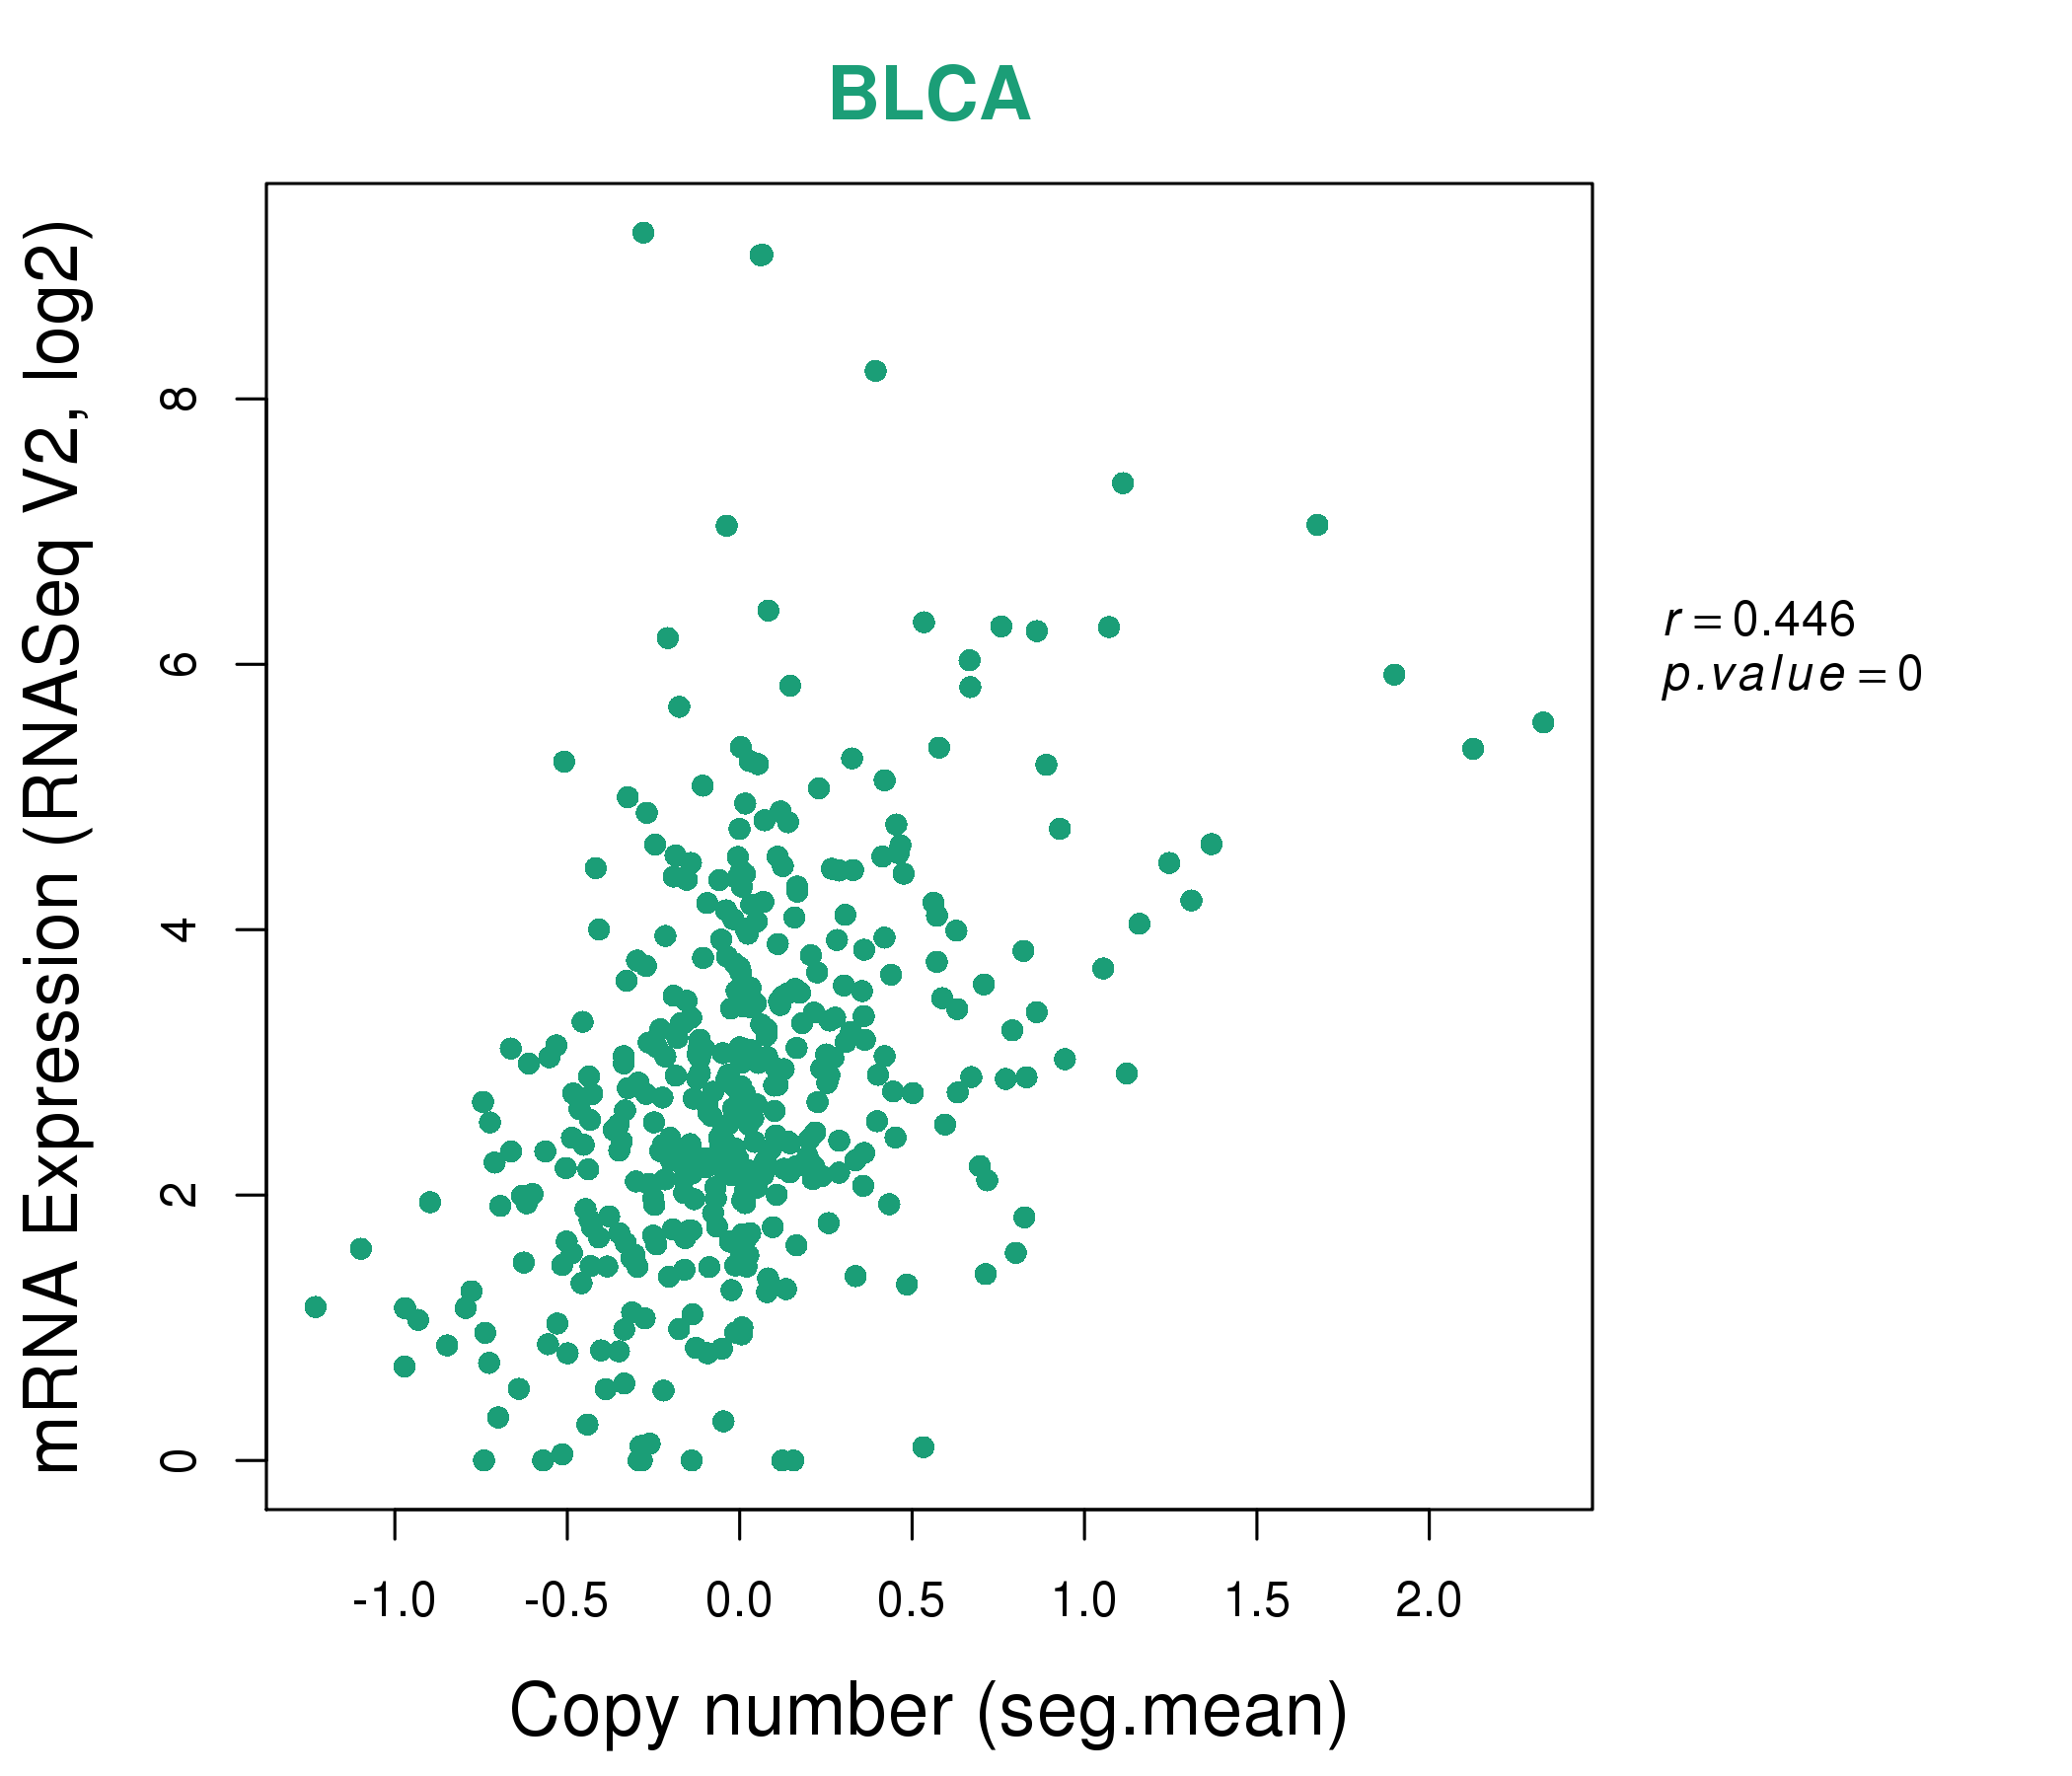
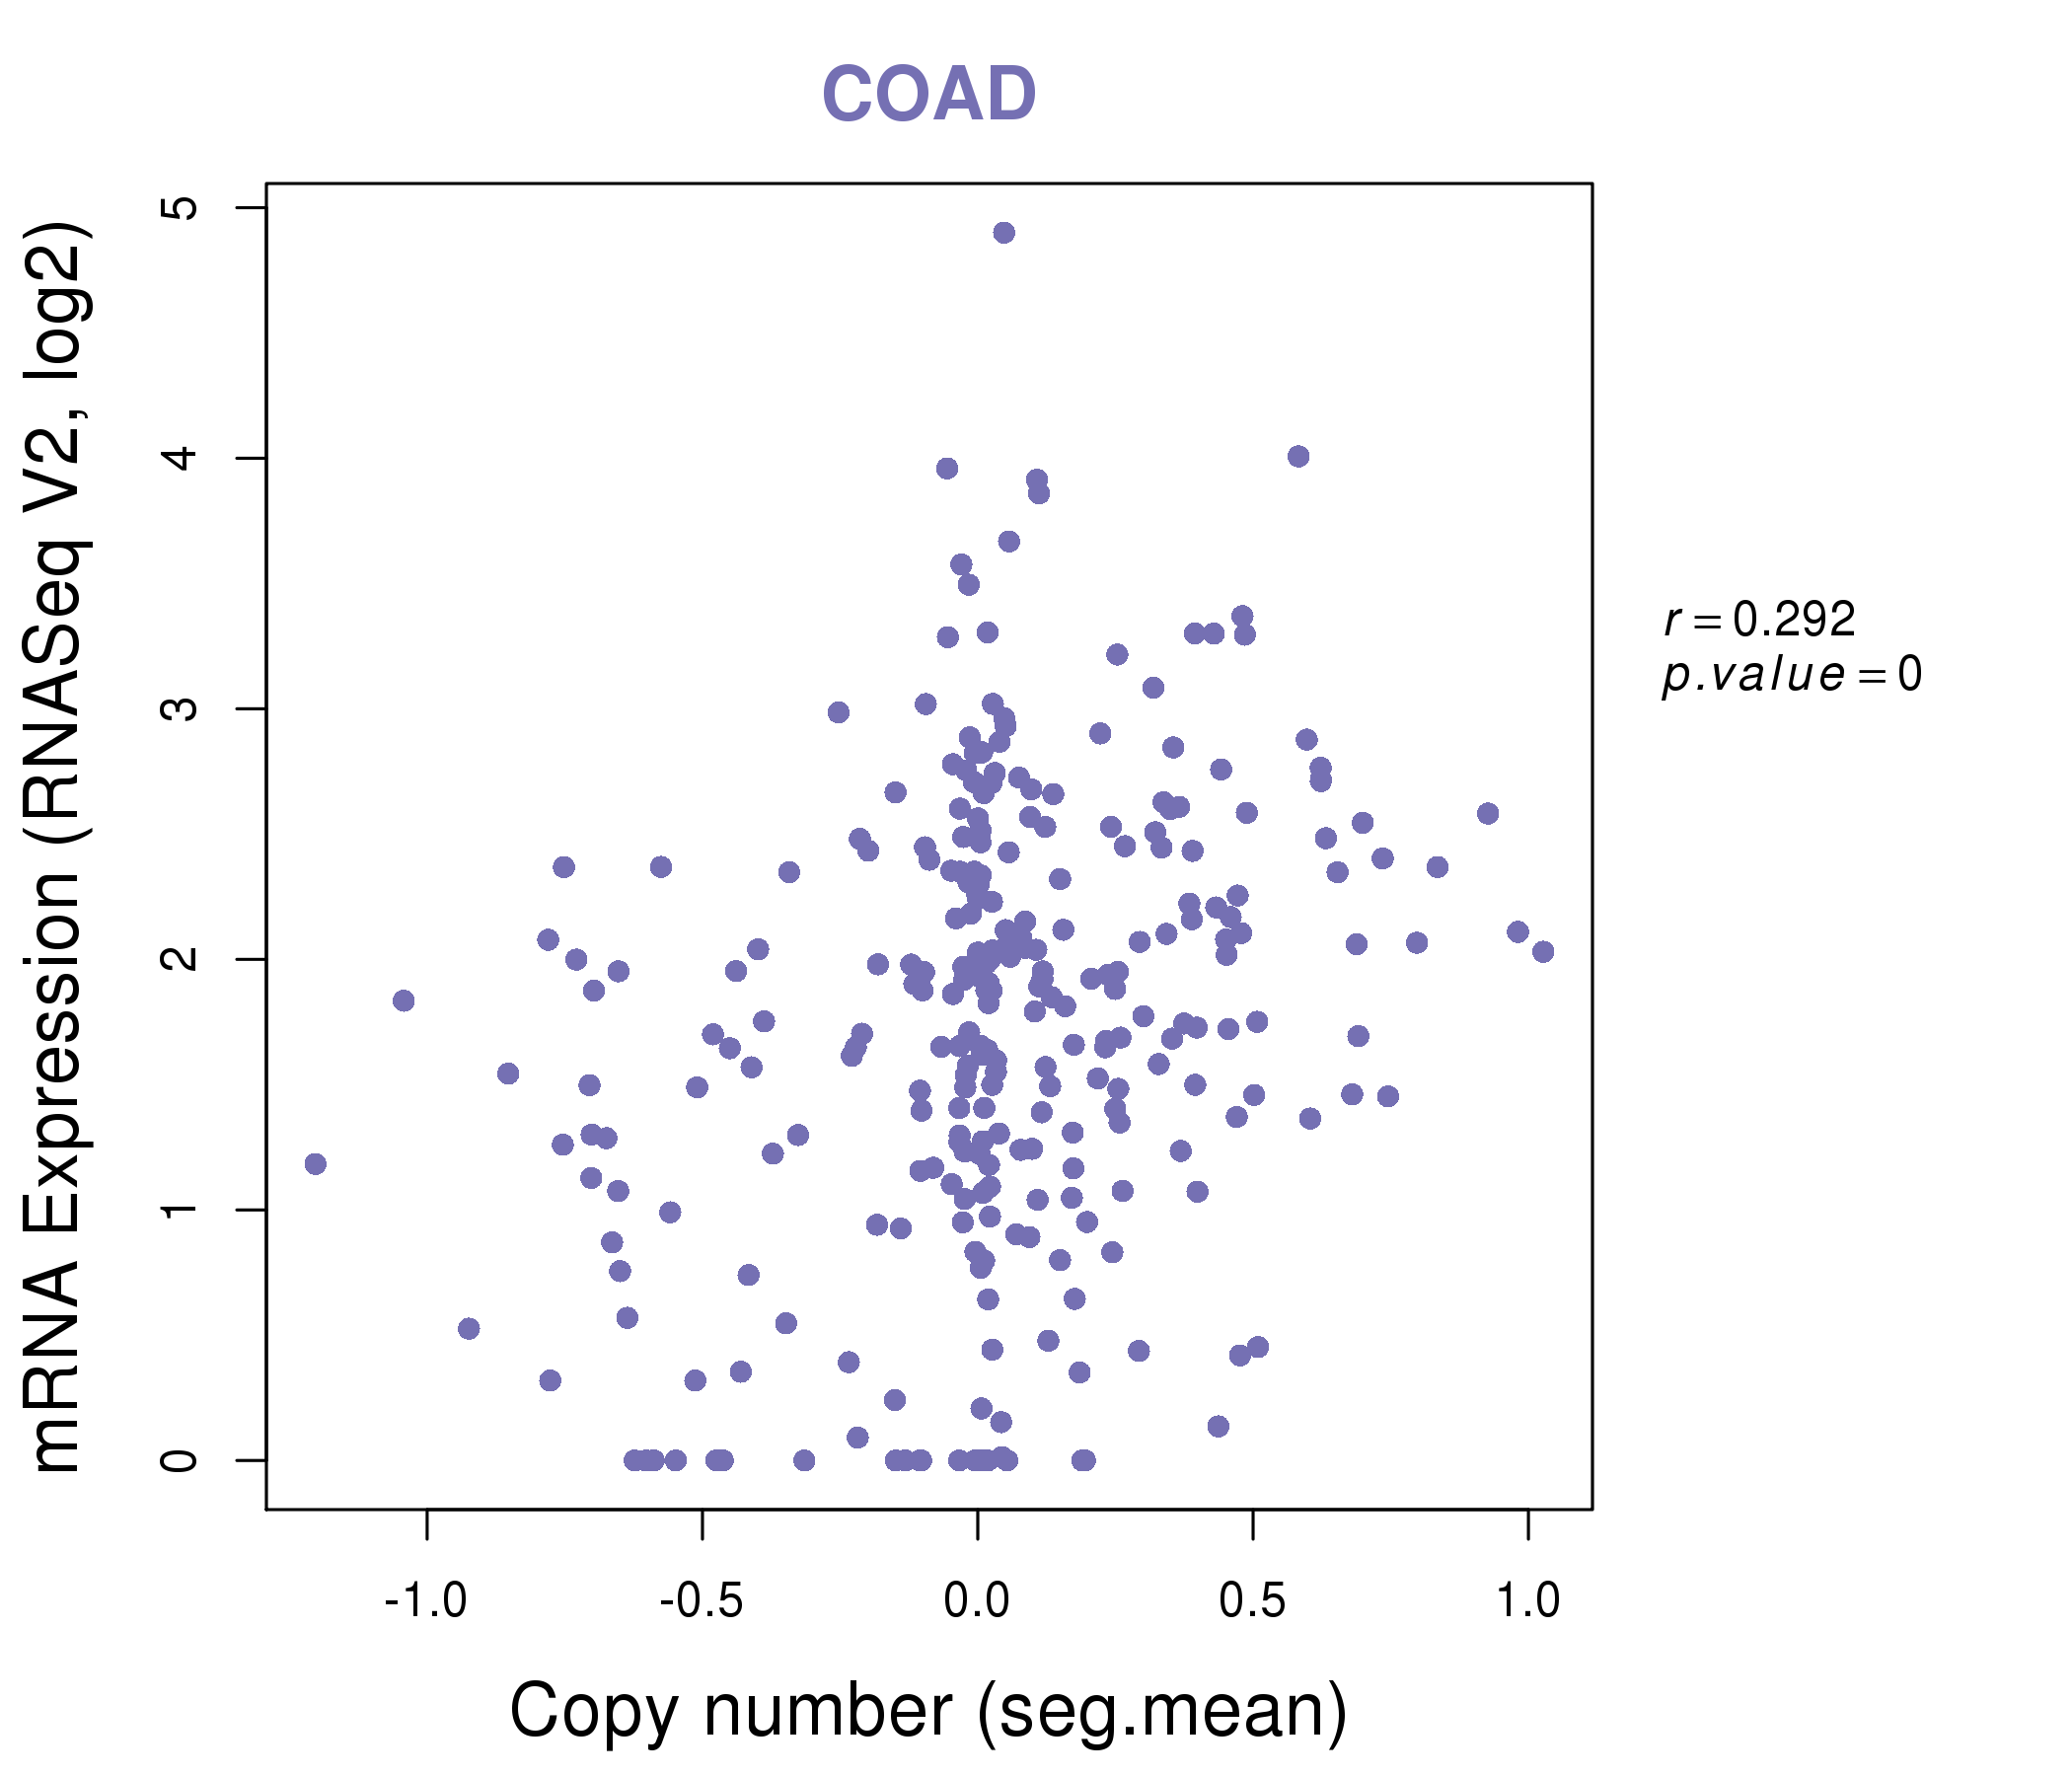
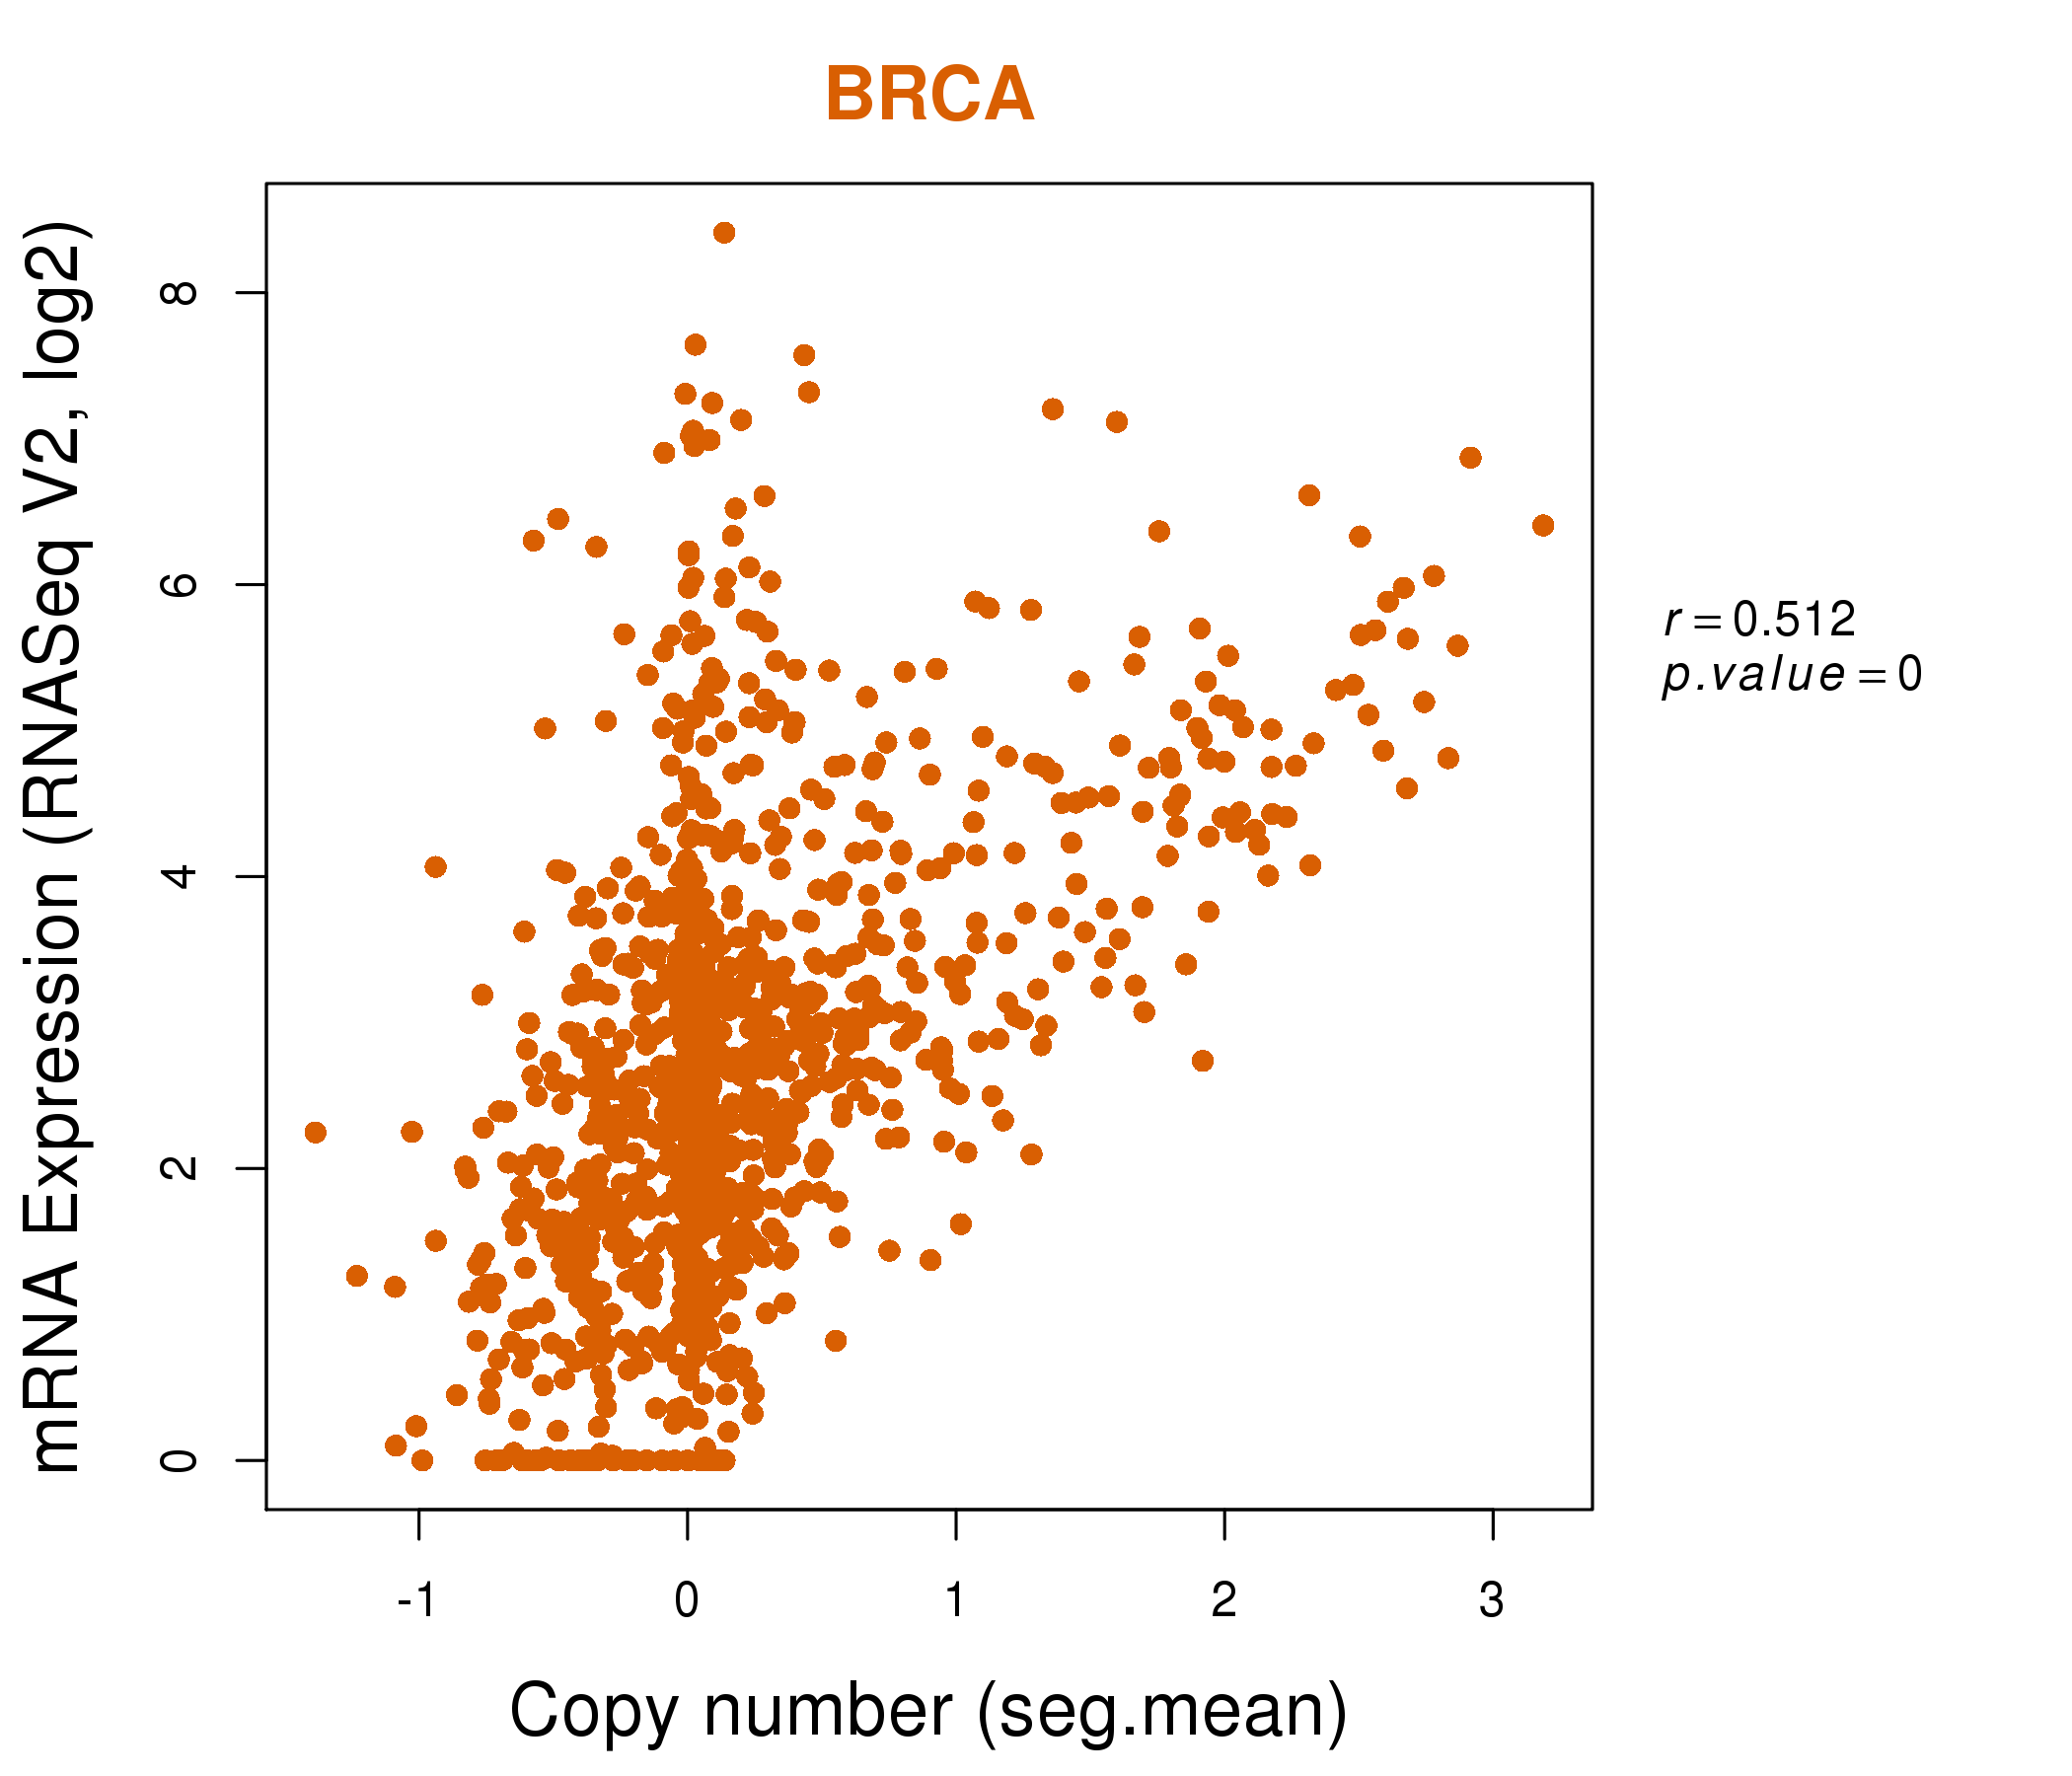
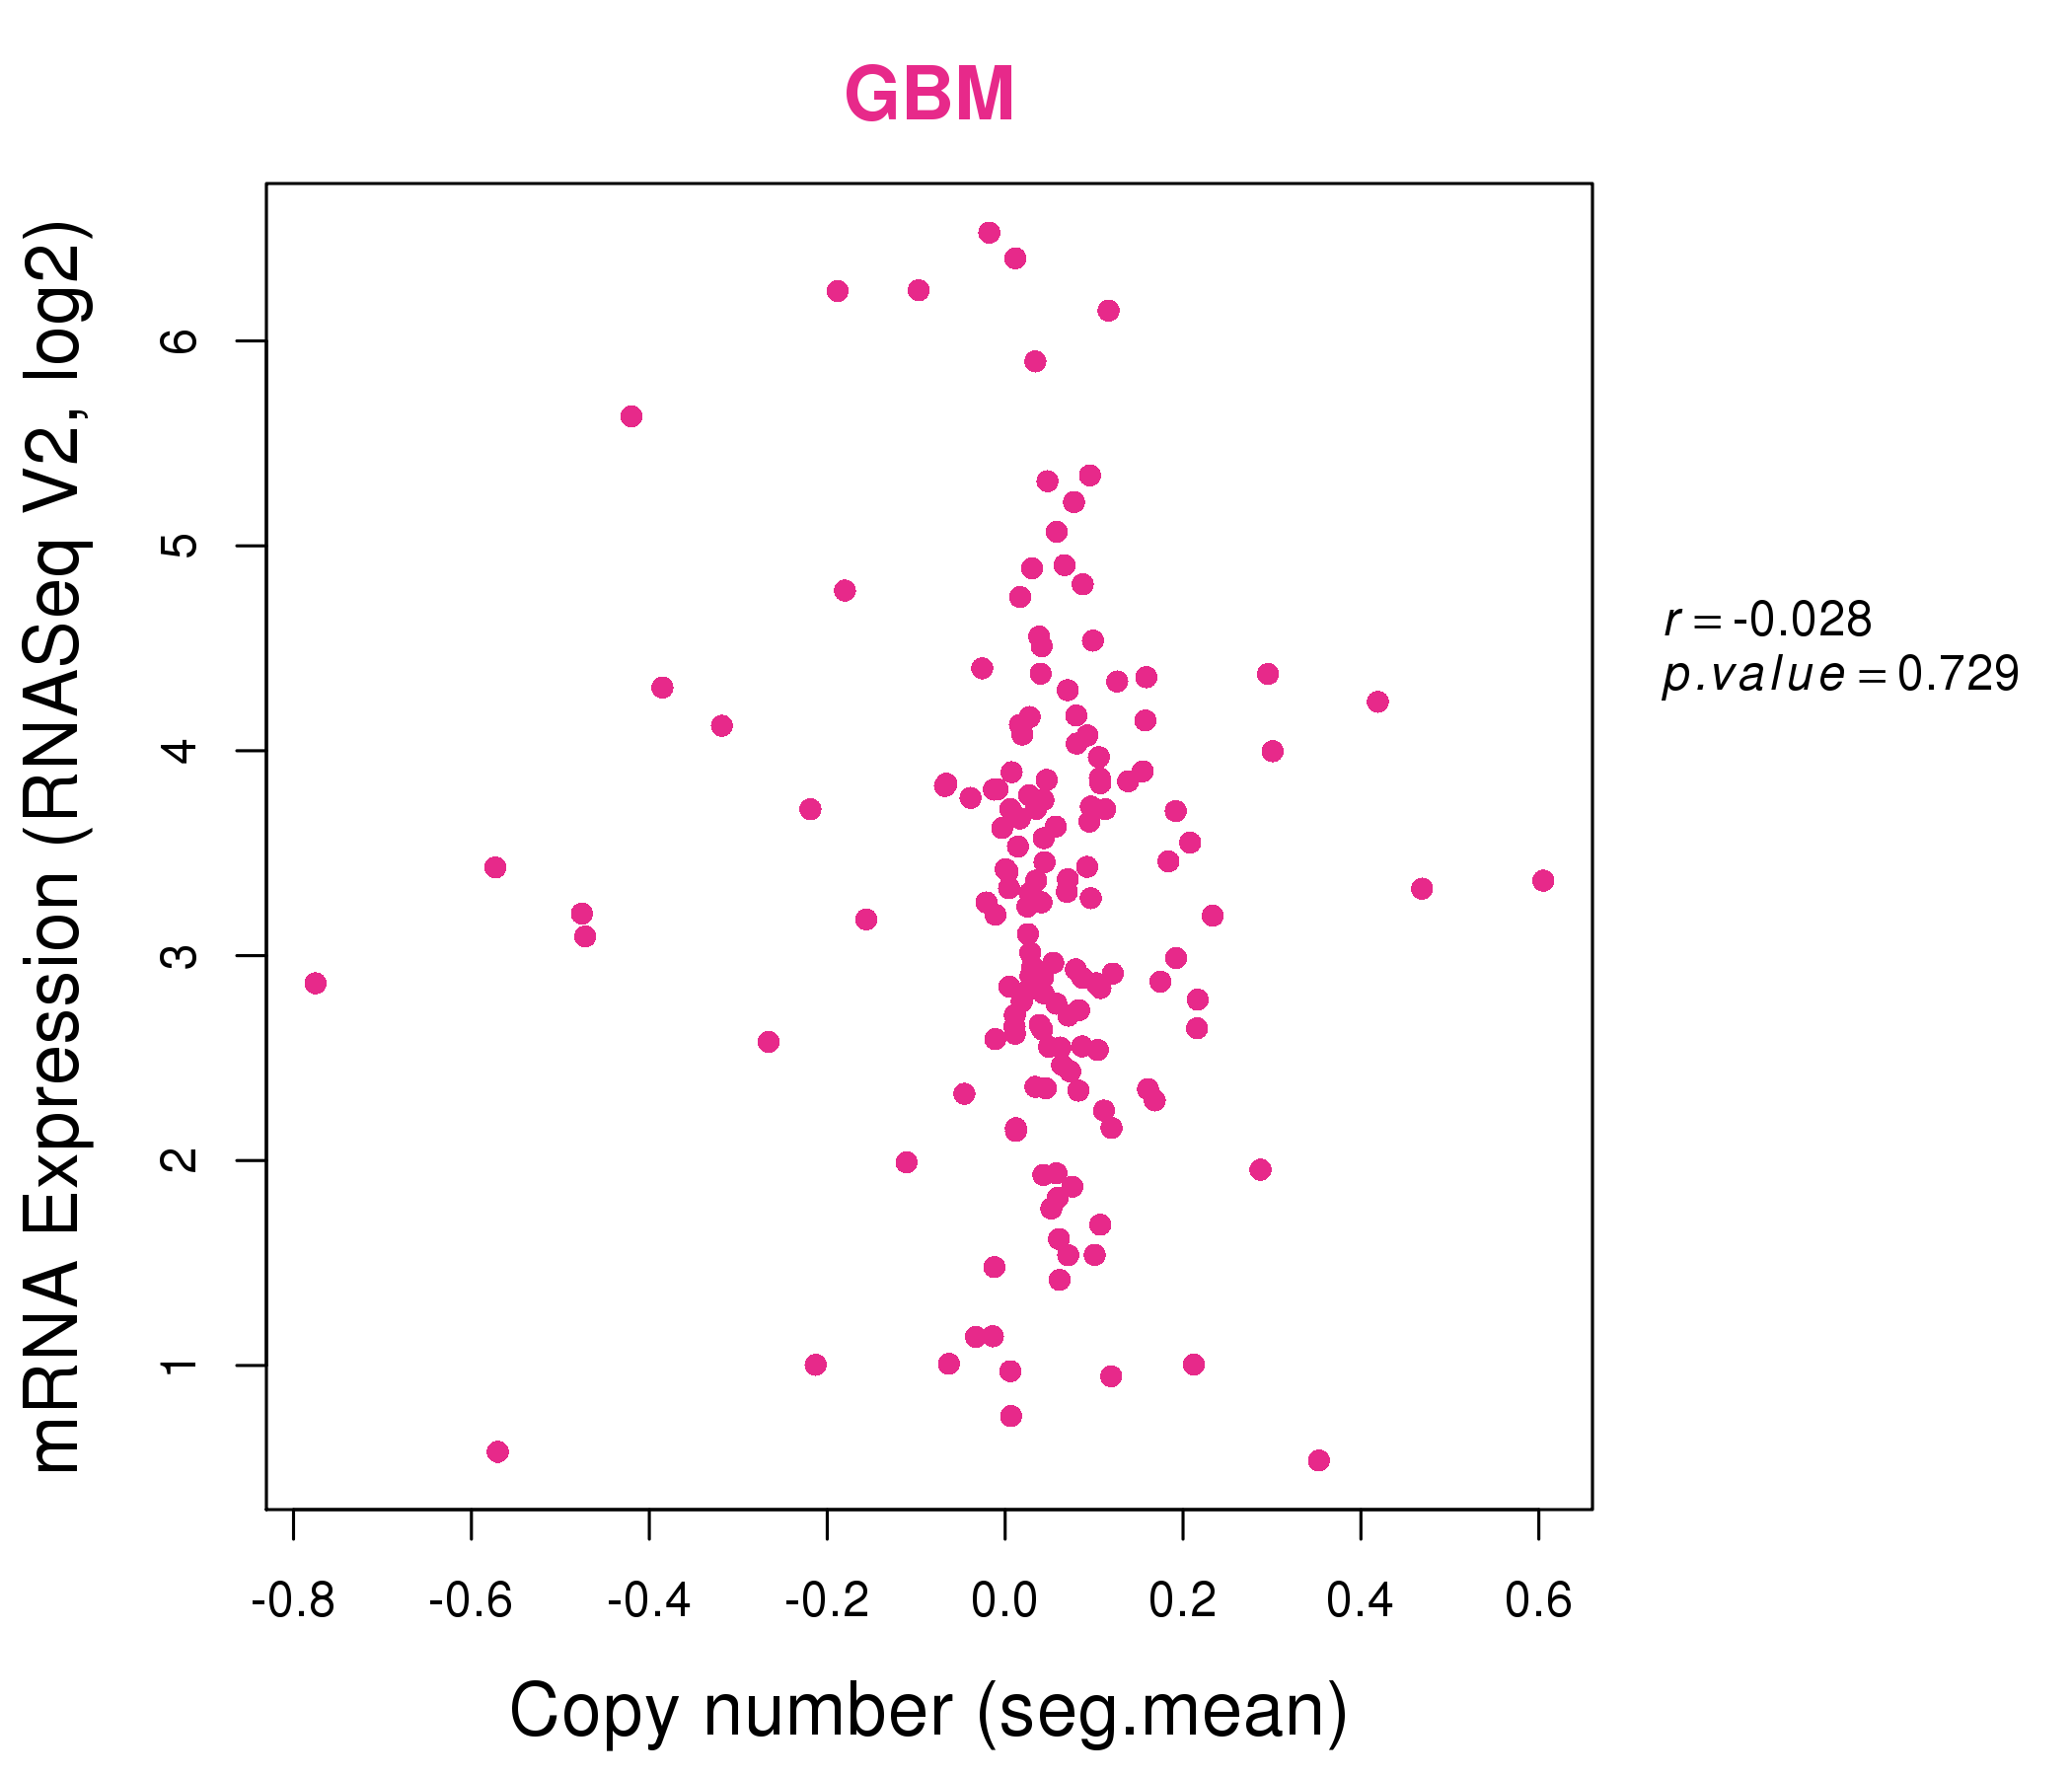
| * This plots show the correlation between CNV and gene expression. |
: Open all plots for all cancer types
 |
|
 |
|
| Top |
| Gene-Gene Network Information |
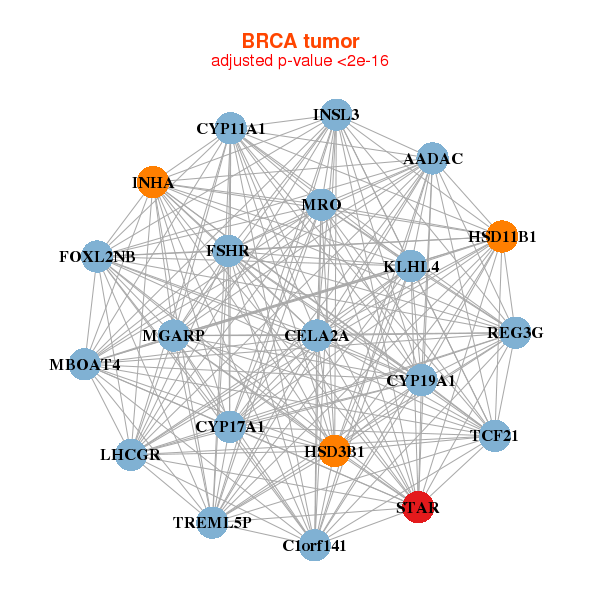
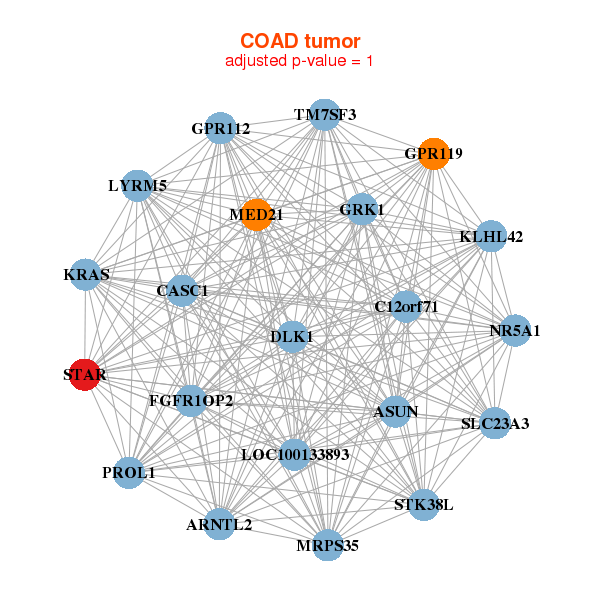
| * Co-Expression network figures were drawn using R package igraph. Only the top 20 genes with the highest correlations were shown. Red circle: input gene, orange circle: cell metabolism gene, sky circle: other gene |
: Open all plots for all cancer types
 |
|
| C18orf54,C1orf94,ADTRP,CCKBR,CD70,DCBLD1,ELOVL4, FAM19A3,FAM81A,FETUB,H2BFXP,LRRC8D,LINC00092,PCBP4, RSPO4,SOAT2,STARD6,TLX1NB,TUBB2B,UNC93A,WBSCR28 | BCAN,C1QTNF4,C8orf74,CCDC70,DPPA2,FLJ46361,GJA10, GLT6D1,KCNK4,KRTAP4-2,KRTAP9-4,MGC16703,LINC00029,NTRK3, OR2T2,OR4A5,OR5F1,OR8H2,OR9G9,PIWIL3,PLA2G1B, RAB9BP1,SNORA32,STARD6, |
 |
|
| ADAM3A,CT47A1,CYP3A4,DKK4,GCG,ITGA2B,KRTAP19-8, MBD3L1,C7orf62,MOG,MT1F,MT1G,MT1H,MYOZ2, NKX2-6,NRG1,CFAP221,SNORA14A,STARD6,TMPRSS11BNL,XAGE2 | C11orf40,CGB7,HHLA1,HORMAD2,IQCA1,LOC145474,OR11H12, OR1B1,OR2AK2,PPP3R2,RDH8,SNORA54,SNORA5B,SPINK9, SSX3,STARD6,TAS2R41,TAS |
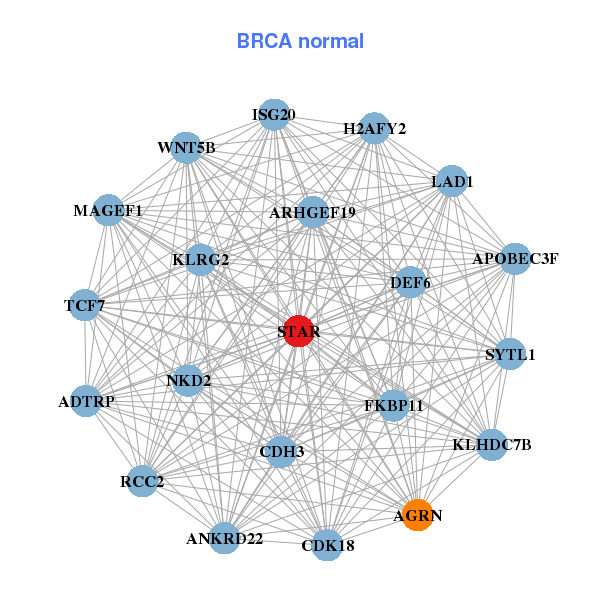
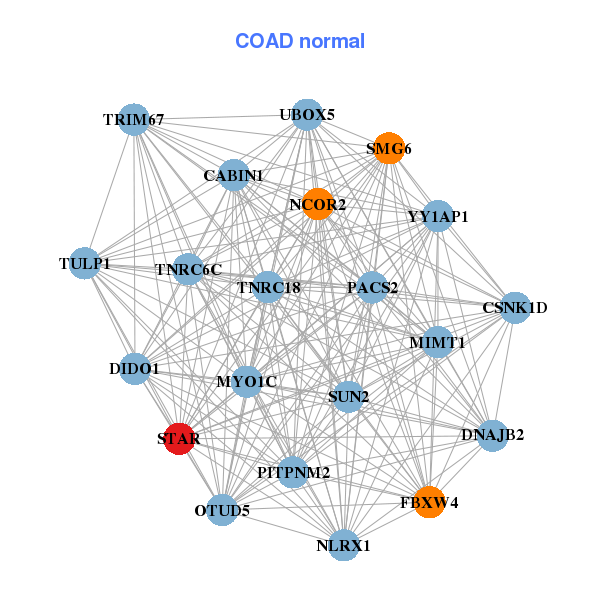
| * Co-Expression network figures were drawn using R package igraph. Only the top 20 genes with the highest correlations were shown. Red circle: input gene, orange circle: cell metabolism gene, sky circle: other gene |
: Open all plots for all cancer types
| Top |
: Open all interacting genes' information including KEGG pathway for all interacting genes from DAVID
| Top |
| Pharmacological Information for STAR |
| There's no related Drug. |
| Top |
| Cross referenced IDs for STAR |
| * We obtained these cross-references from Uniprot database. It covers 150 different DBs, 18 categories. http://www.uniprot.org/help/cross_references_section |
: Open all cross reference information
|
Copyright © 2016-Present - The Univsersity of Texas Health Science Center at Houston @ |