|
||||||||||||||||||||||||||||||||||||||||||||||||||||||||||||||||||||||||||||||||||||||||||||||||||||||||||||||||||||||||||||||||||||||||||||||||||||||||||||||||||||||||||||||||||||||||||||||||||||||||||||||||||||||||||||||||||||||||||||||||||||||||||||||||||||||||||||||||||||||||||||||||||||||||||||||||||||||||||||||||||||||||||||||||||||||||||||||||
| |
| Phenotypic Information (metabolism pathway, cancer, disease, phenome) |
| |
| |
| Gene-Gene Network Information: Co-Expression Network, Interacting Genes & KEGG |
| |
|


| Gene Summary for STK11 |
| Basic gene info. | Gene symbol | STK11 |
| Gene name | serine/threonine kinase 11 | |
| Synonyms | LKB1|PJS|hLKB1 | |
| Cytomap | UCSC genome browser: 19p13.3 | |
| Genomic location | chr19 :1205797-1228434 | |
| Type of gene | protein-coding | |
| RefGenes | NM_000455.4, | |
| Ensembl id | ENSG00000118046 | |
| Description | liver kinase B1polarization-related protein LKB1renal carcinoma antigen NY-REN-19serine/threonine-protein kinase 11serine/threonine-protein kinase LKB1serine/threonine-protein kinase STK11 | |
| Modification date | 20141222 | |
| dbXrefs | MIM : 602216 | |
| HGNC : HGNC | ||
| Ensembl : ENSG00000118046 | ||
| HPRD : 03740 | ||
| Protein | UniProt: Q15831 go to UniProt's Cross Reference DB Table | |
| Expression | CleanEX: HS_STK11 | |
| BioGPS: 6794 | ||
| Gene Expression Atlas: ENSG00000118046 | ||
| The Human Protein Atlas: ENSG00000118046 | ||
| Pathway | NCI Pathway Interaction Database: STK11 | |
| KEGG: STK11 | ||
| REACTOME: STK11 | ||
| ConsensusPathDB | ||
| Pathway Commons: STK11 | ||
| Metabolism | MetaCyc: STK11 | |
| HUMANCyc: STK11 | ||
| Regulation | Ensembl's Regulation: ENSG00000118046 | |
| miRBase: chr19 :1,205,797-1,228,434 | ||
| TargetScan: NM_000455 | ||
| cisRED: ENSG00000118046 | ||
| Context | iHOP: STK11 | |
| cancer metabolism search in PubMed: STK11 | ||
| UCL Cancer Institute: STK11 | ||
| Assigned class in ccmGDB | A - This gene has a literature evidence and it belongs to cancer gene. | |
| References showing role of STK11 in cancer cell metabolism | 1. Shackelford DB, Abt E, Gerken L, Vasquez DS, Seki A, et al. (2013) LKB1 inactivation dictates therapeutic response of non-small cell lung cancer to the metabolism drug phenformin. Cancer cell 23: 143-158. go to article 2. Liu Y, Marks K, Cowley GS, Carretero J, Liu Q, et al. (2013) Metabolic and functional genomic studies identify deoxythymidylate kinase as a target in LKB1-mutant lung cancer. Cancer discovery 3: 870-879. go to article 3. Dupuy F, Griss T, Blagih J, Bridon G, Avizonis D, et al. (2013) LKB1 is a central regulator of tumor initiation and pro-growth metabolism in ErbB2-mediated breast cancer. Cancer Metab 1: 18. go to article | |
| Top |
| Phenotypic Information for STK11(metabolism pathway, cancer, disease, phenome) |
| Cancer | CGAP: STK11 |
| Familial Cancer Database: STK11 | |
| * This gene is included in those cancer gene databases. |
|
|
|
|
|
|
| ||||||||||||||||||||||||||||||||||||||||||||||||||||||||||||||||||||||||||||||||||||||||||||||||||||||||||||||||||||||||||||||||||||||||||||||||||||||||||||||||||||||||||||||||||||||||||||||||||||||||||||||||||||||||||||||||||||||||||||||||||||||||||||||||||||||||||||||||||||||||||||||||||||||||||||||||||||||||||||||||||||||||||||||||||||||||||
Oncogene 1 | Significant driver gene in LUAD 6, | |||||||||||||||||||||||||||||||||||||||||||||||||||||||||||||||||||||||||||||||||||||||||||||||||||||||||||||||||||||||||||||||||||||||||||||||||||||||||||||||||||||||||||||||||||||||||||||||||||||||||||||||||||||||||||||||||||||||||||||||||||||||||||||||||||||||||||||||||||||||||||||||||||||||||||||||||||||||||||||||||||||||||||||||||||||||||||||||
| cf) number; DB name 1 Oncogene; http://nar.oxfordjournals.org/content/35/suppl_1/D721.long, 2 Tumor Suppressor gene; https://bioinfo.uth.edu/TSGene/, 3 Cancer Gene Census; http://www.nature.com/nrc/journal/v4/n3/abs/nrc1299.html, 4 CancerGenes; http://nar.oxfordjournals.org/content/35/suppl_1/D721.long, 5 Network of Cancer Gene; http://ncg.kcl.ac.uk/index.php, 6 http://www.sciencedirect.com/science/article/pii/S0092867412010227, 7Therapeutic Vulnerabilities in Cancer; http://cbio.mskcc.org/cancergenomics/statius/ |
| REACTOME_INTEGRATION_OF_ENERGY_METABOLISM | |
| OMIM | 175200; phenotype. 273300; phenotype. 602216; gene. |
| Orphanet | 2869; Peutz-Jeghers syndrome. |
| Disease | KEGG Disease: STK11 |
| MedGen: STK11 (Human Medical Genetics with Condition) | |
| ClinVar: STK11 | |
| Phenotype | MGI: STK11 (International Mouse Phenotyping Consortium) |
| PhenomicDB: STK11 | |
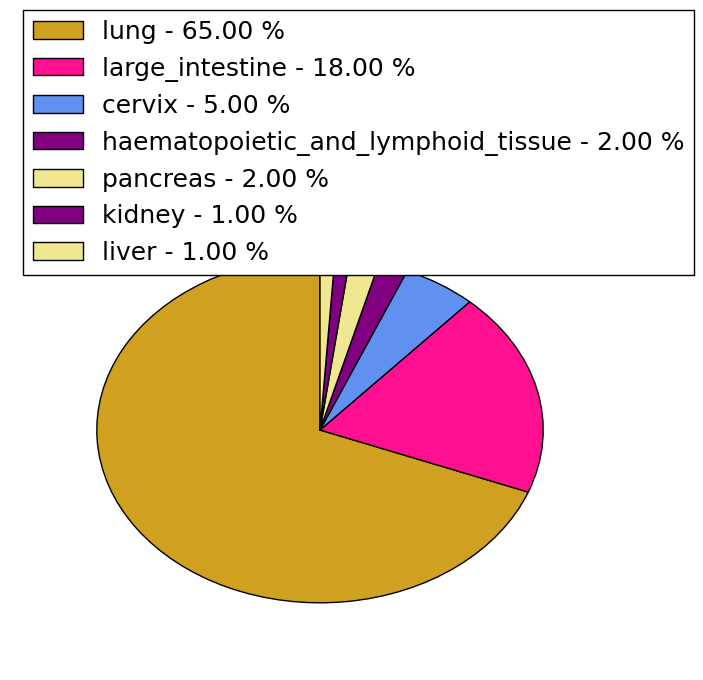
| Mutations for STK11 |
| * Under tables are showing count per each tissue to give us broad intuition about tissue specific mutation patterns.You can go to the detailed page for each mutation database's web site. |
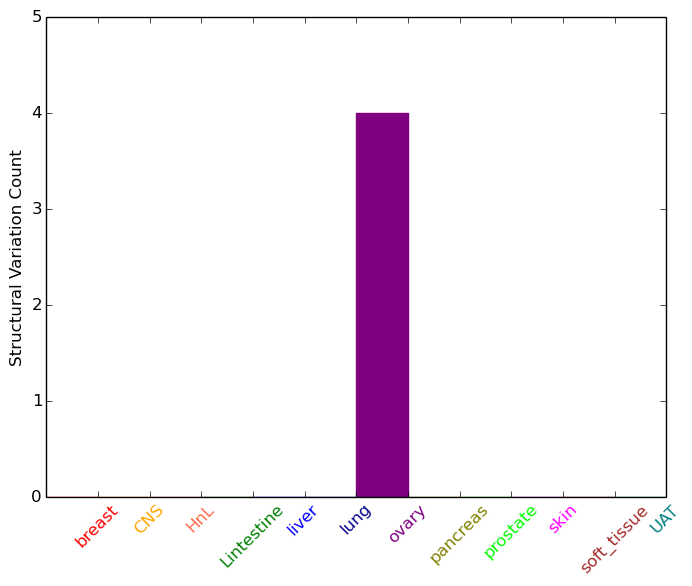
| - Statistics for Tissue and Mutation type | Top |
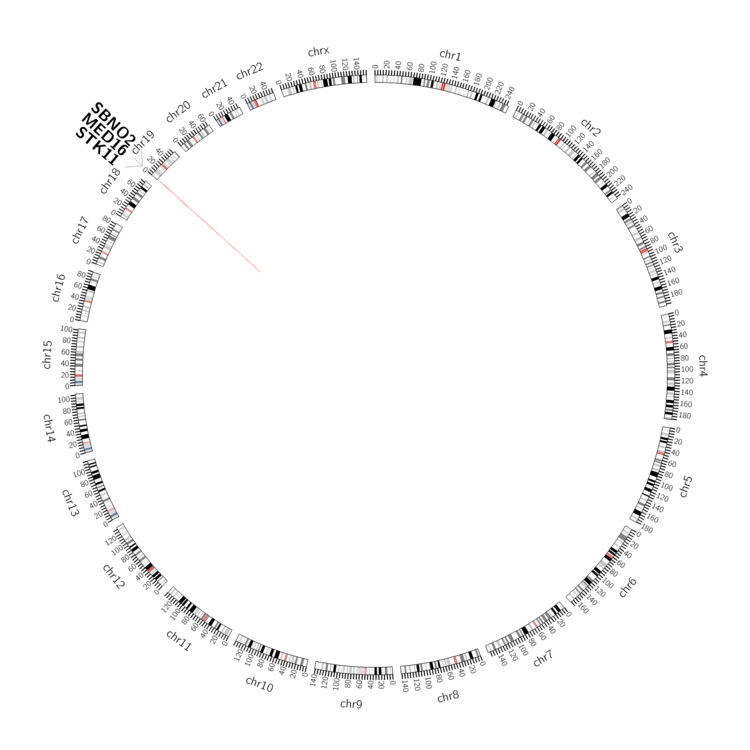 |
| - For Inter-chromosomal Variations |
| There's no inter-chromosomal structural variation. |
| - For Intra-chromosomal Variations |
| * Intra-chromosomal variantions includes 'intrachromosomal amplicon to amplicon', 'intrachromosomal amplicon to non-amplified dna', 'intrachromosomal deletion', 'intrachromosomal fold-back inversion', 'intrachromosomal inversion', 'intrachromosomal tandem duplication', 'Intrachromosomal unknown type', 'intrachromosomal with inverted orientation', 'intrachromosomal with non-inverted orientation'. |
 |
| Sample | Symbol_a | Chr_a | Start_a | End_a | Symbol_b | Chr_b | Start_b | End_b |
| ovary | STK11 | chr19 | 1213436 | 1213456 | MED16 | chr19 | 870704 | 870724 |
| ovary | STK11 | chr19 | 1215366 | 1215386 | STK11 | chr19 | 1223894 | 1223914 |
| ovary | STK11 | chr19 | 1224761 | 1224781 | SBNO2 | chr19 | 1138520 | 1138540 |
| cf) Tissue number; Tissue name (1;Breast, 2;Central_nervous_system, 3;Haematopoietic_and_lymphoid_tissue, 4;Large_intestine, 5;Liver, 6;Lung, 7;Ovary, 8;Pancreas, 9;Prostate, 10;Skin, 11;Soft_tissue, 12;Upper_aerodigestive_tract) |
| * From mRNA Sanger sequences, Chitars2.0 arranged chimeric transcripts. This table shows STK11 related fusion information. |
| ID | Head Gene | Tail Gene | Accession | Gene_a | qStart_a | qEnd_a | Chromosome_a | tStart_a | tEnd_a | Gene_a | qStart_a | qEnd_a | Chromosome_a | tStart_a | tEnd_a |
| AI968661 | RPP14 | 1 | 195 | 3 | 58305165 | 58305359 | STK11 | 190 | 312 | 19 | 1224618 | 1224740 | |
| AI365374 | RPP14 | 1 | 195 | 3 | 58305165 | 58305359 | STK11 | 190 | 446 | 19 | 1224484 | 1224740 | |
| Top |
| Mutation type/ Tissue ID | brca | cns | cerv | endome | haematopo | kidn | Lintest | liver | lung | ns | ovary | pancre | prost | skin | stoma | thyro | urina | |||
| Total # sample | 1 | |||||||||||||||||||
| GAIN (# sample) | ||||||||||||||||||||
| LOSS (# sample) | 1 |
| cf) Tissue ID; Tissue type (1; Breast, 2; Central_nervous_system, 3; Cervix, 4; Endometrium, 5; Haematopoietic_and_lymphoid_tissue, 6; Kidney, 7; Large_intestine, 8; Liver, 9; Lung, 10; NS, 11; Ovary, 12; Pancreas, 13; Prostate, 14; Skin, 15; Stomach, 16; Thyroid, 17; Urinary_tract) |
| Top |
|
 |
| Top |
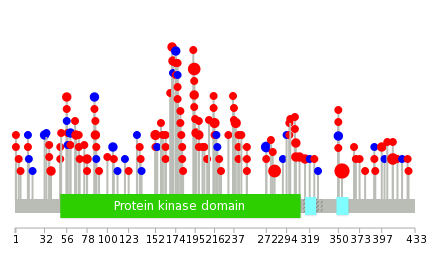
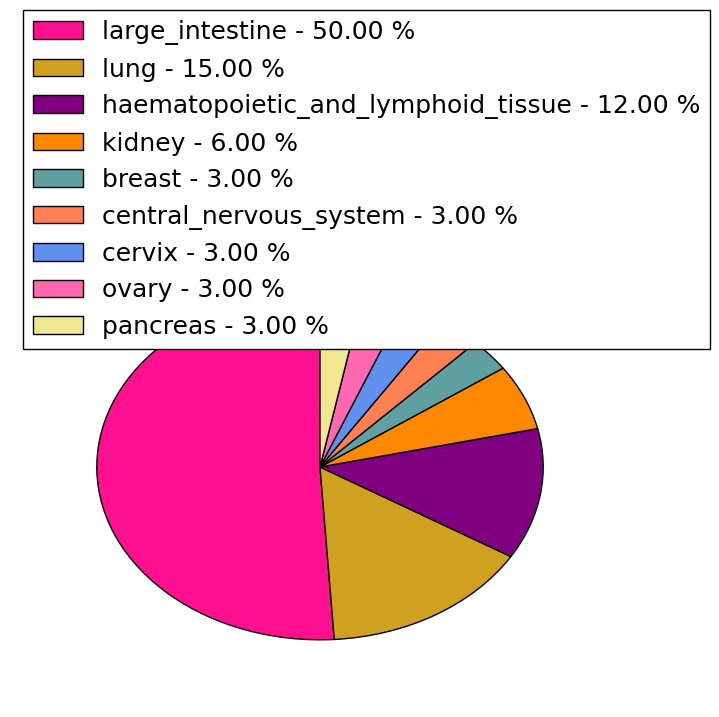
| Stat. for Non-Synonymous SNVs (# total SNVs=236) | (# total SNVs=32) |
 |  |
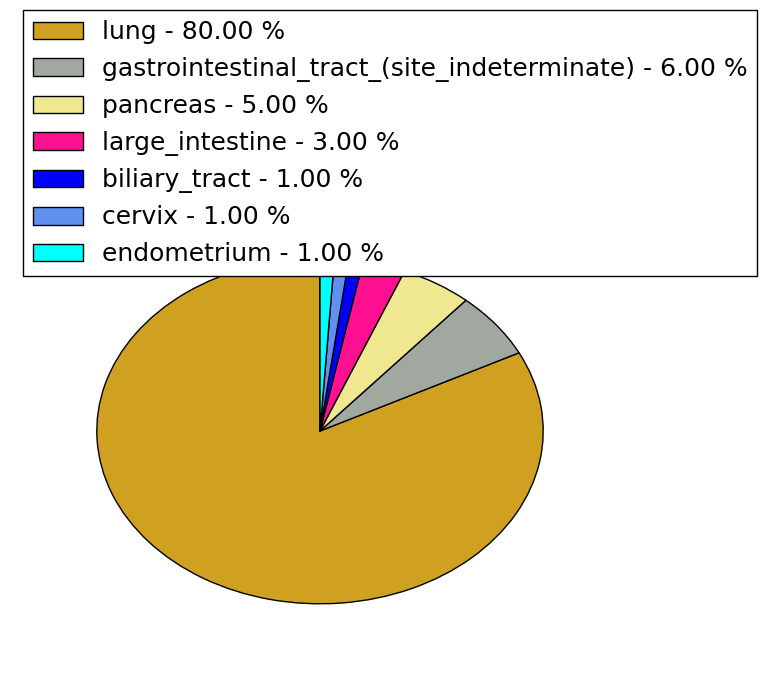
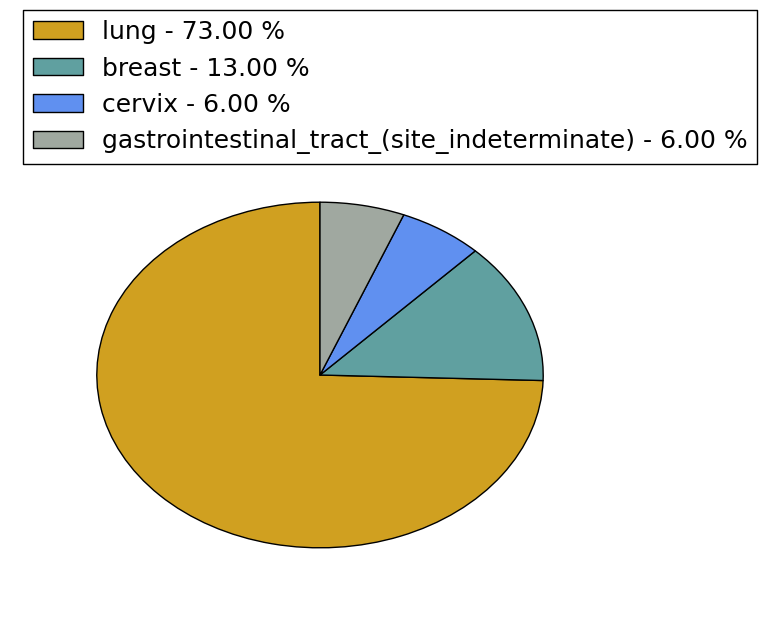
(# total SNVs=60) | (# total SNVs=15) |
 |  |
| Top |
| * When you move the cursor on each content, you can see more deailed mutation information on the Tooltip. Those are primary_site,primary_histology,mutation(aa),pubmedID. |
| GRCh37 position | Mutation(aa) | Unique sampleID count |
| chr19:1223125-1223125 | p.F354L | 29 |
| chr19:1221319-1221319 | p.P281L | 17 |
| chr19:1206913-1226646 | p.0? | 16 |
| chr19:1207021-1207021 | p.Q37* | 12 |
| chr19:1220487-1220487 | p.D194Y | 9 |
| chr19:1220415-1220415 | p.Q170* | 8 |
| chr19:1207092-1207092 | p.Y60Y | 7 |
| chr19:1226570-1226570 | p.R409Q | 6 |
| chr19:1221210-1221210 | p.? | 6 |
| chr19:1221293-1221293 | p.Y272Y | 4 |
| Top |
|
 |
| Point Mutation/ Tissue ID | 1 | 2 | 3 | 4 | 5 | 6 | 7 | 8 | 9 | 10 | 11 | 12 | 13 | 14 | 15 | 16 | 17 | 18 | 19 | 20 |
| # sample | 1 | 34 | 1 | 3 | 1 | 12 | 1 | 3 | 2 | 1 | ||||||||||
| # mutation | 1 | 37 | 2 | 2 | 1 | 13 | 1 | 3 | 2 | 1 | ||||||||||
| nonsynonymous SNV | 22 | 2 | 1 | 1 | 13 | 2 | 1 | 1 | ||||||||||||
| synonymous SNV | 1 | 15 | 1 | 1 | 1 | 1 |
| cf) Tissue ID; Tissue type (1; BLCA[Bladder Urothelial Carcinoma], 2; BRCA[Breast invasive carcinoma], 3; CESC[Cervical squamous cell carcinoma and endocervical adenocarcinoma], 4; COAD[Colon adenocarcinoma], 5; GBM[Glioblastoma multiforme], 6; Glioma Low Grade, 7; HNSC[Head and Neck squamous cell carcinoma], 8; KICH[Kidney Chromophobe], 9; KIRC[Kidney renal clear cell carcinoma], 10; KIRP[Kidney renal papillary cell carcinoma], 11; LAML[Acute Myeloid Leukemia], 12; LUAD[Lung adenocarcinoma], 13; LUSC[Lung squamous cell carcinoma], 14; OV[Ovarian serous cystadenocarcinoma ], 15; PAAD[Pancreatic adenocarcinoma], 16; PRAD[Prostate adenocarcinoma], 17; SKCM[Skin Cutaneous Melanoma], 18:STAD[Stomach adenocarcinoma], 19:THCA[Thyroid carcinoma], 20:UCEC[Uterine Corpus Endometrial Carcinoma]) |
| Top |
| * We represented just top 10 SNVs. When you move the cursor on each content, you can see more deailed mutation information on the Tooltip. Those are primary_site, primary_histology, mutation(aa), pubmedID. |
| Genomic Position | Mutation(aa) | Unique sampleID count |
| chr19:1226570 | p.R409Q | 5 |
| chr19:1219403 | p.Q152R | 3 |
| chr19:1220416 | p.Y60Y | 2 |
| chr19:1207092 | p.Q170R | 2 |
| chr19:1220429 | p.H174H | 2 |
| chr19:1207078 | p.G56W | 2 |
| chr19:1221229 | p.Q152K | 1 |
| chr19:1207145 | p.S216F | 1 |
| chr19:1226511 | p.D350D | 1 |
| chr19:1220378 | p.Y60C | 1 |
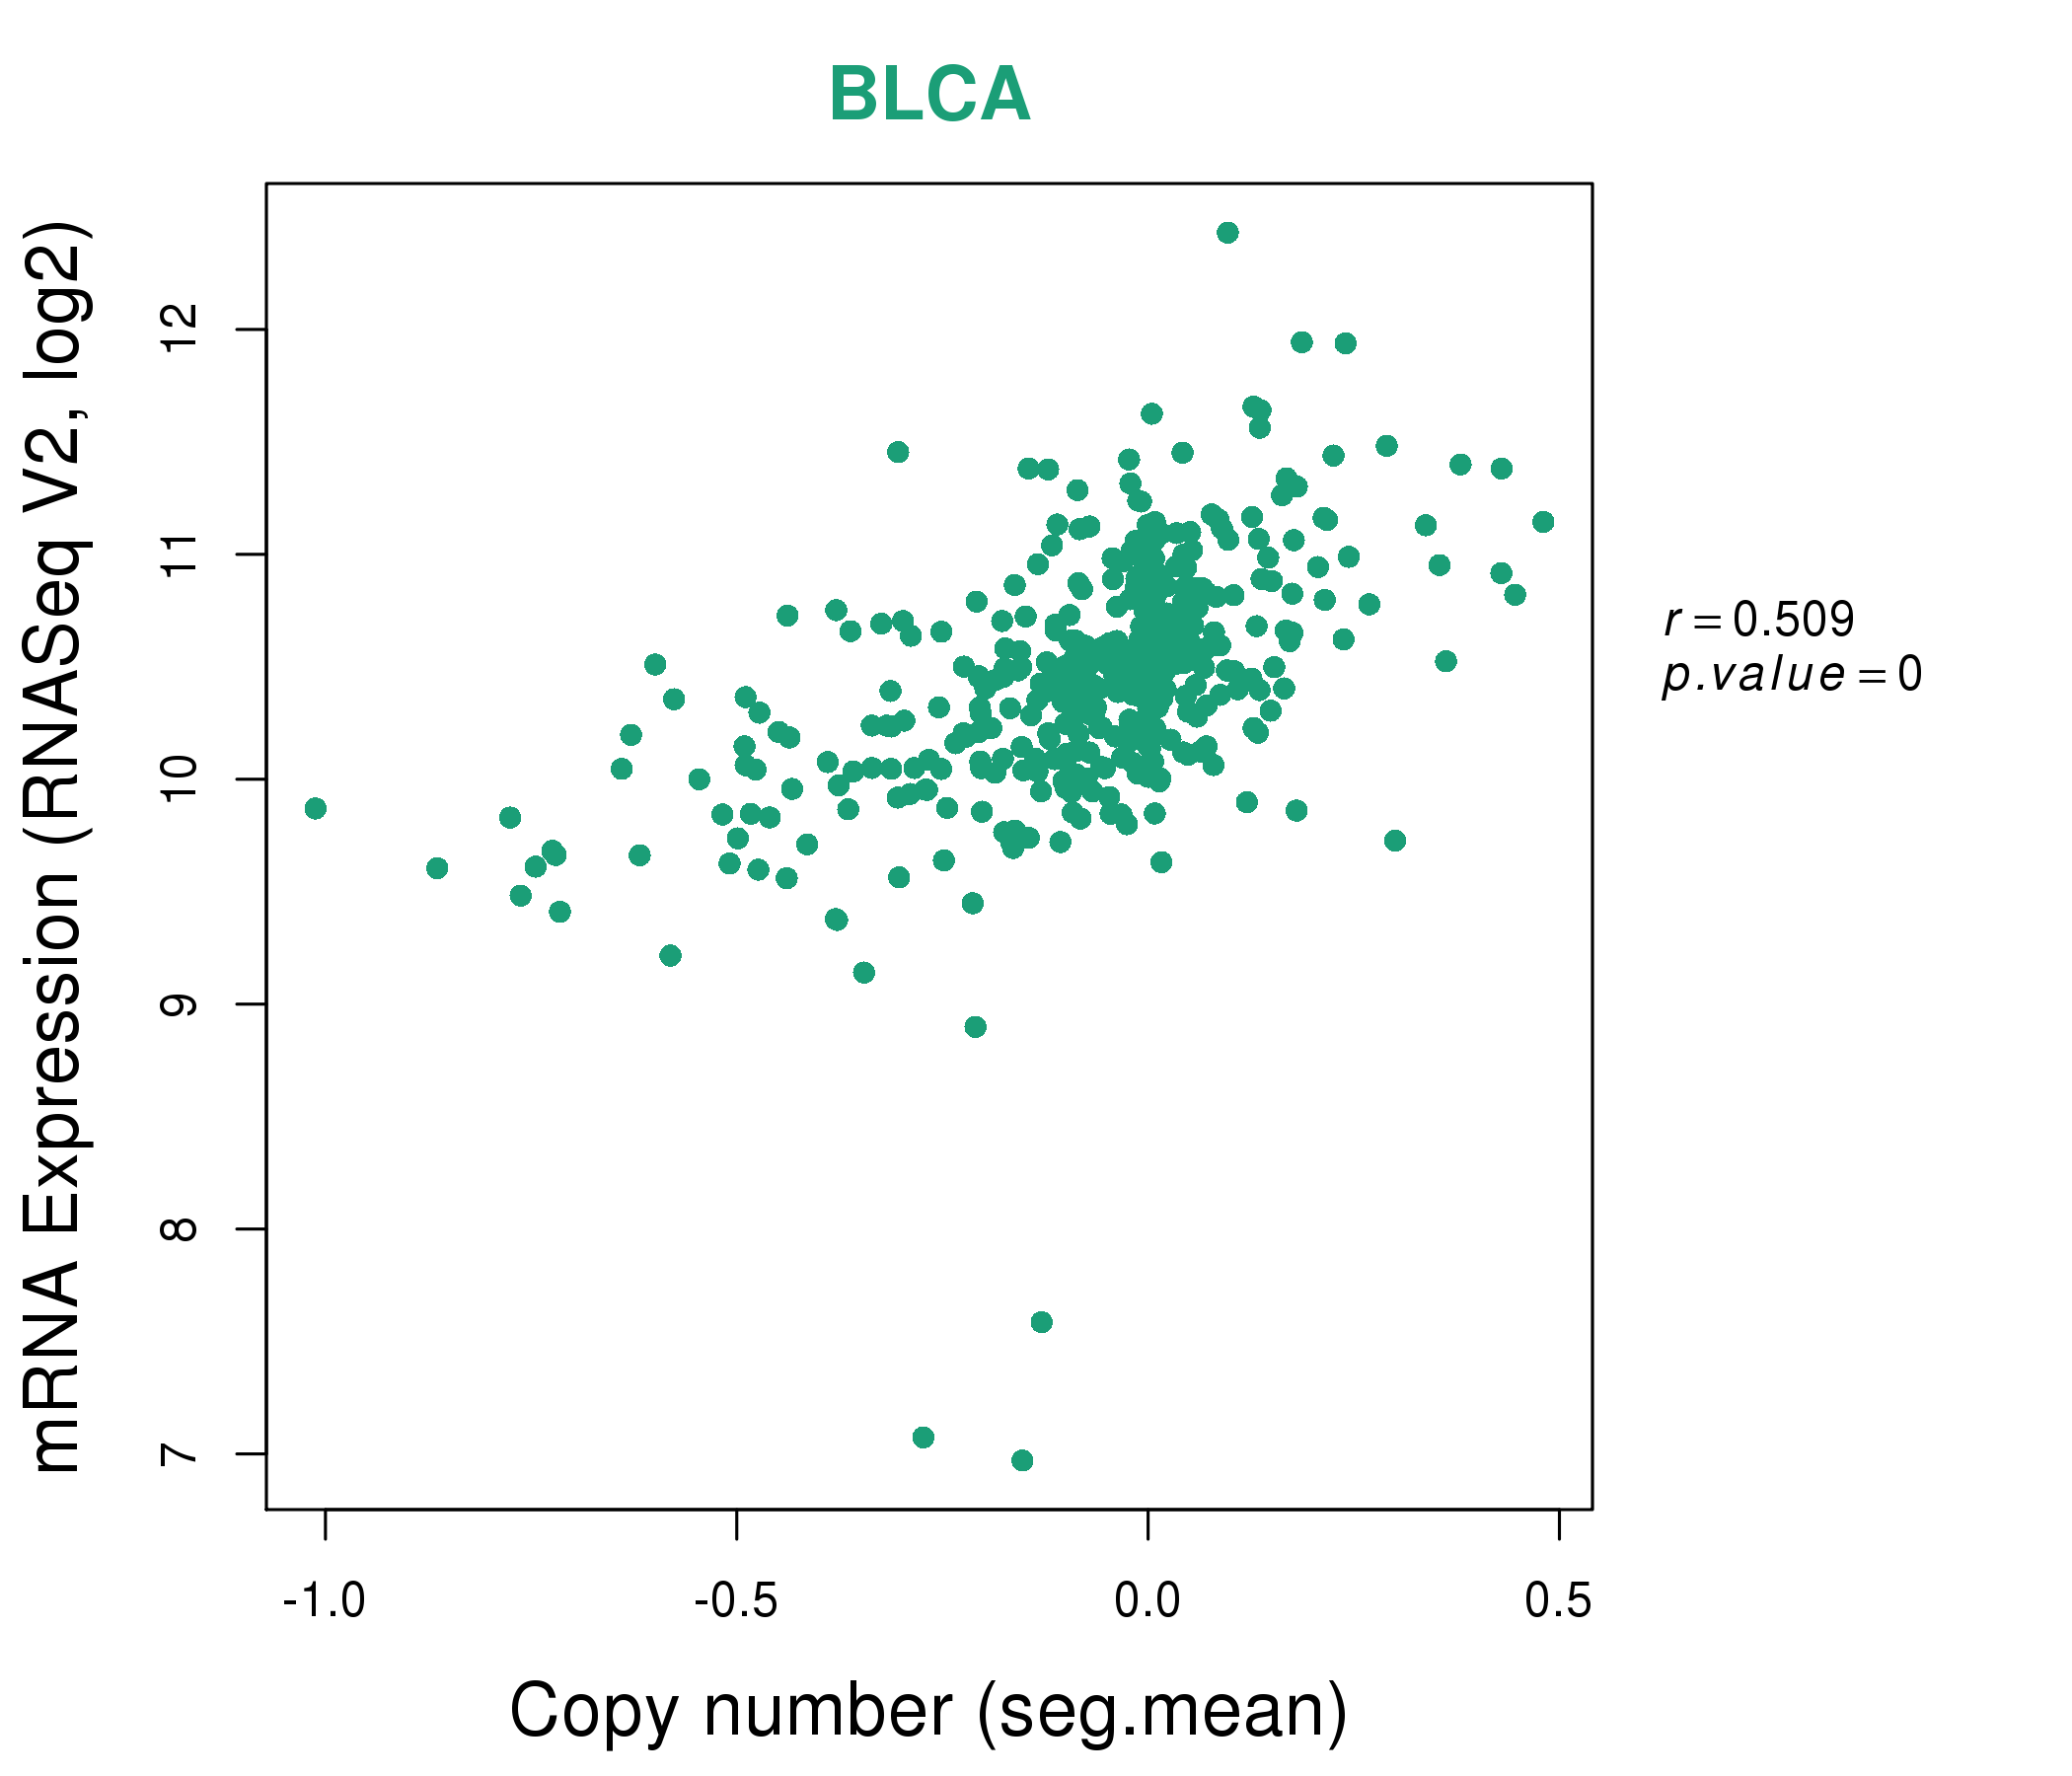
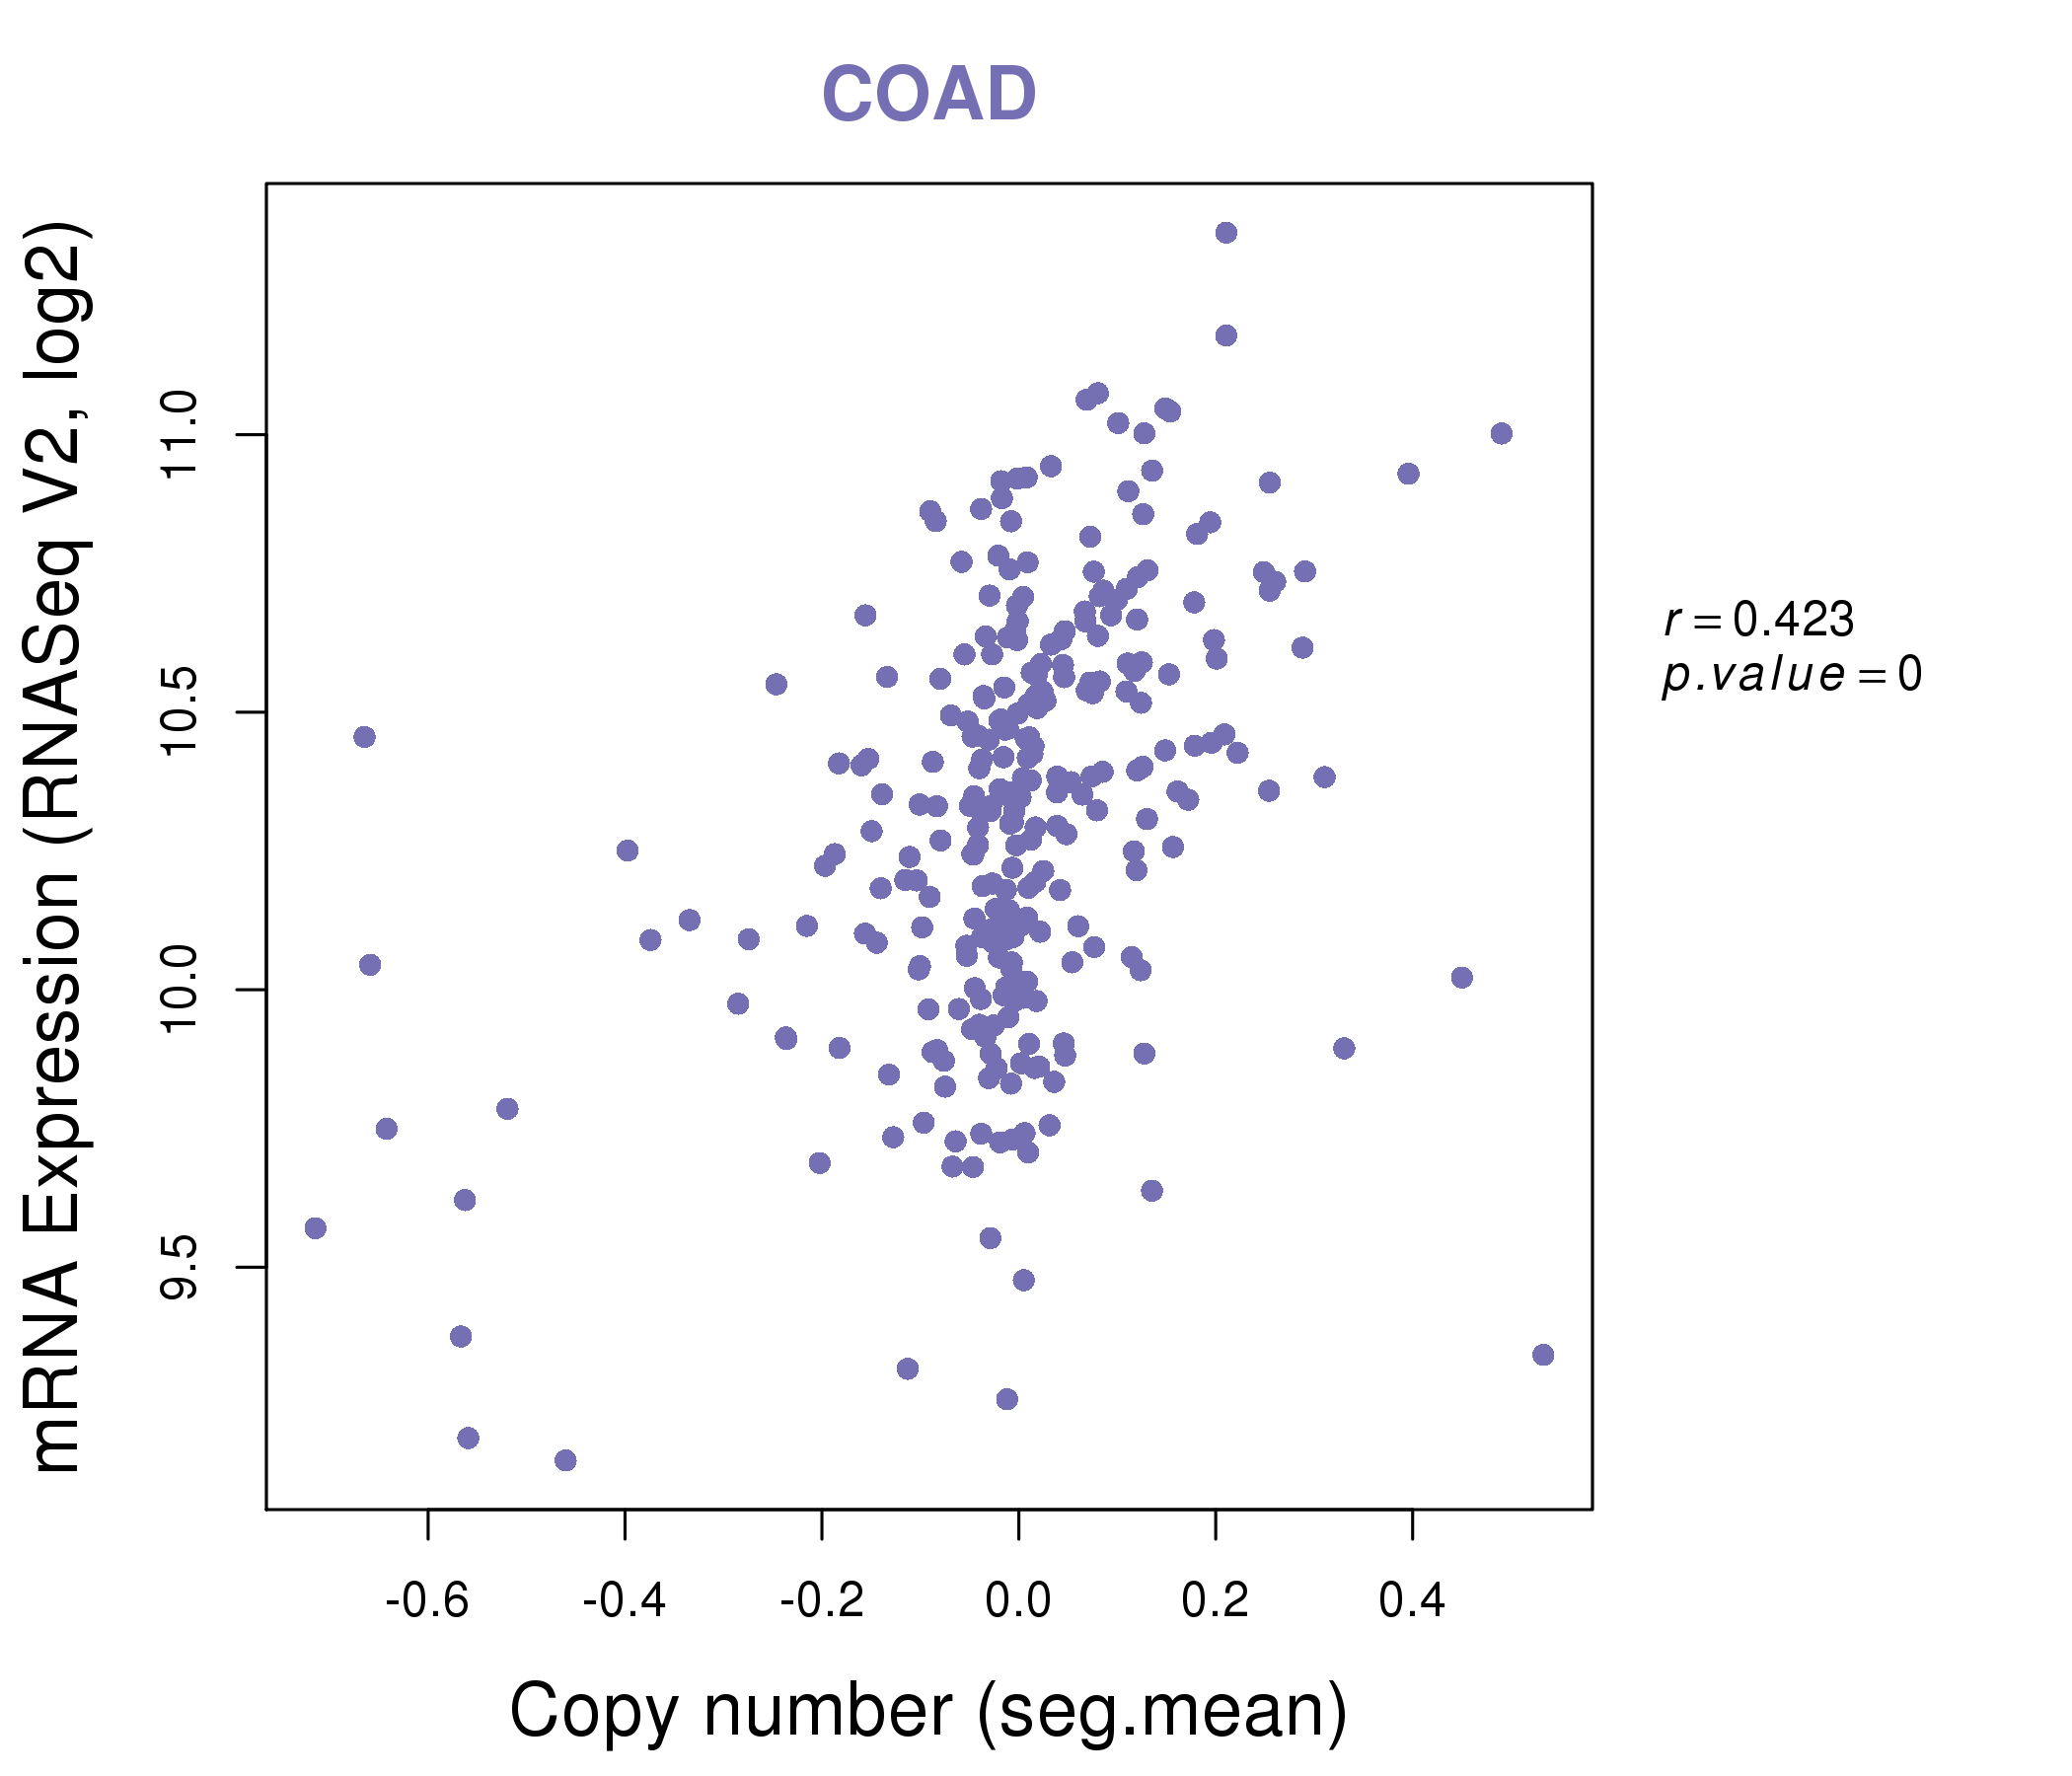
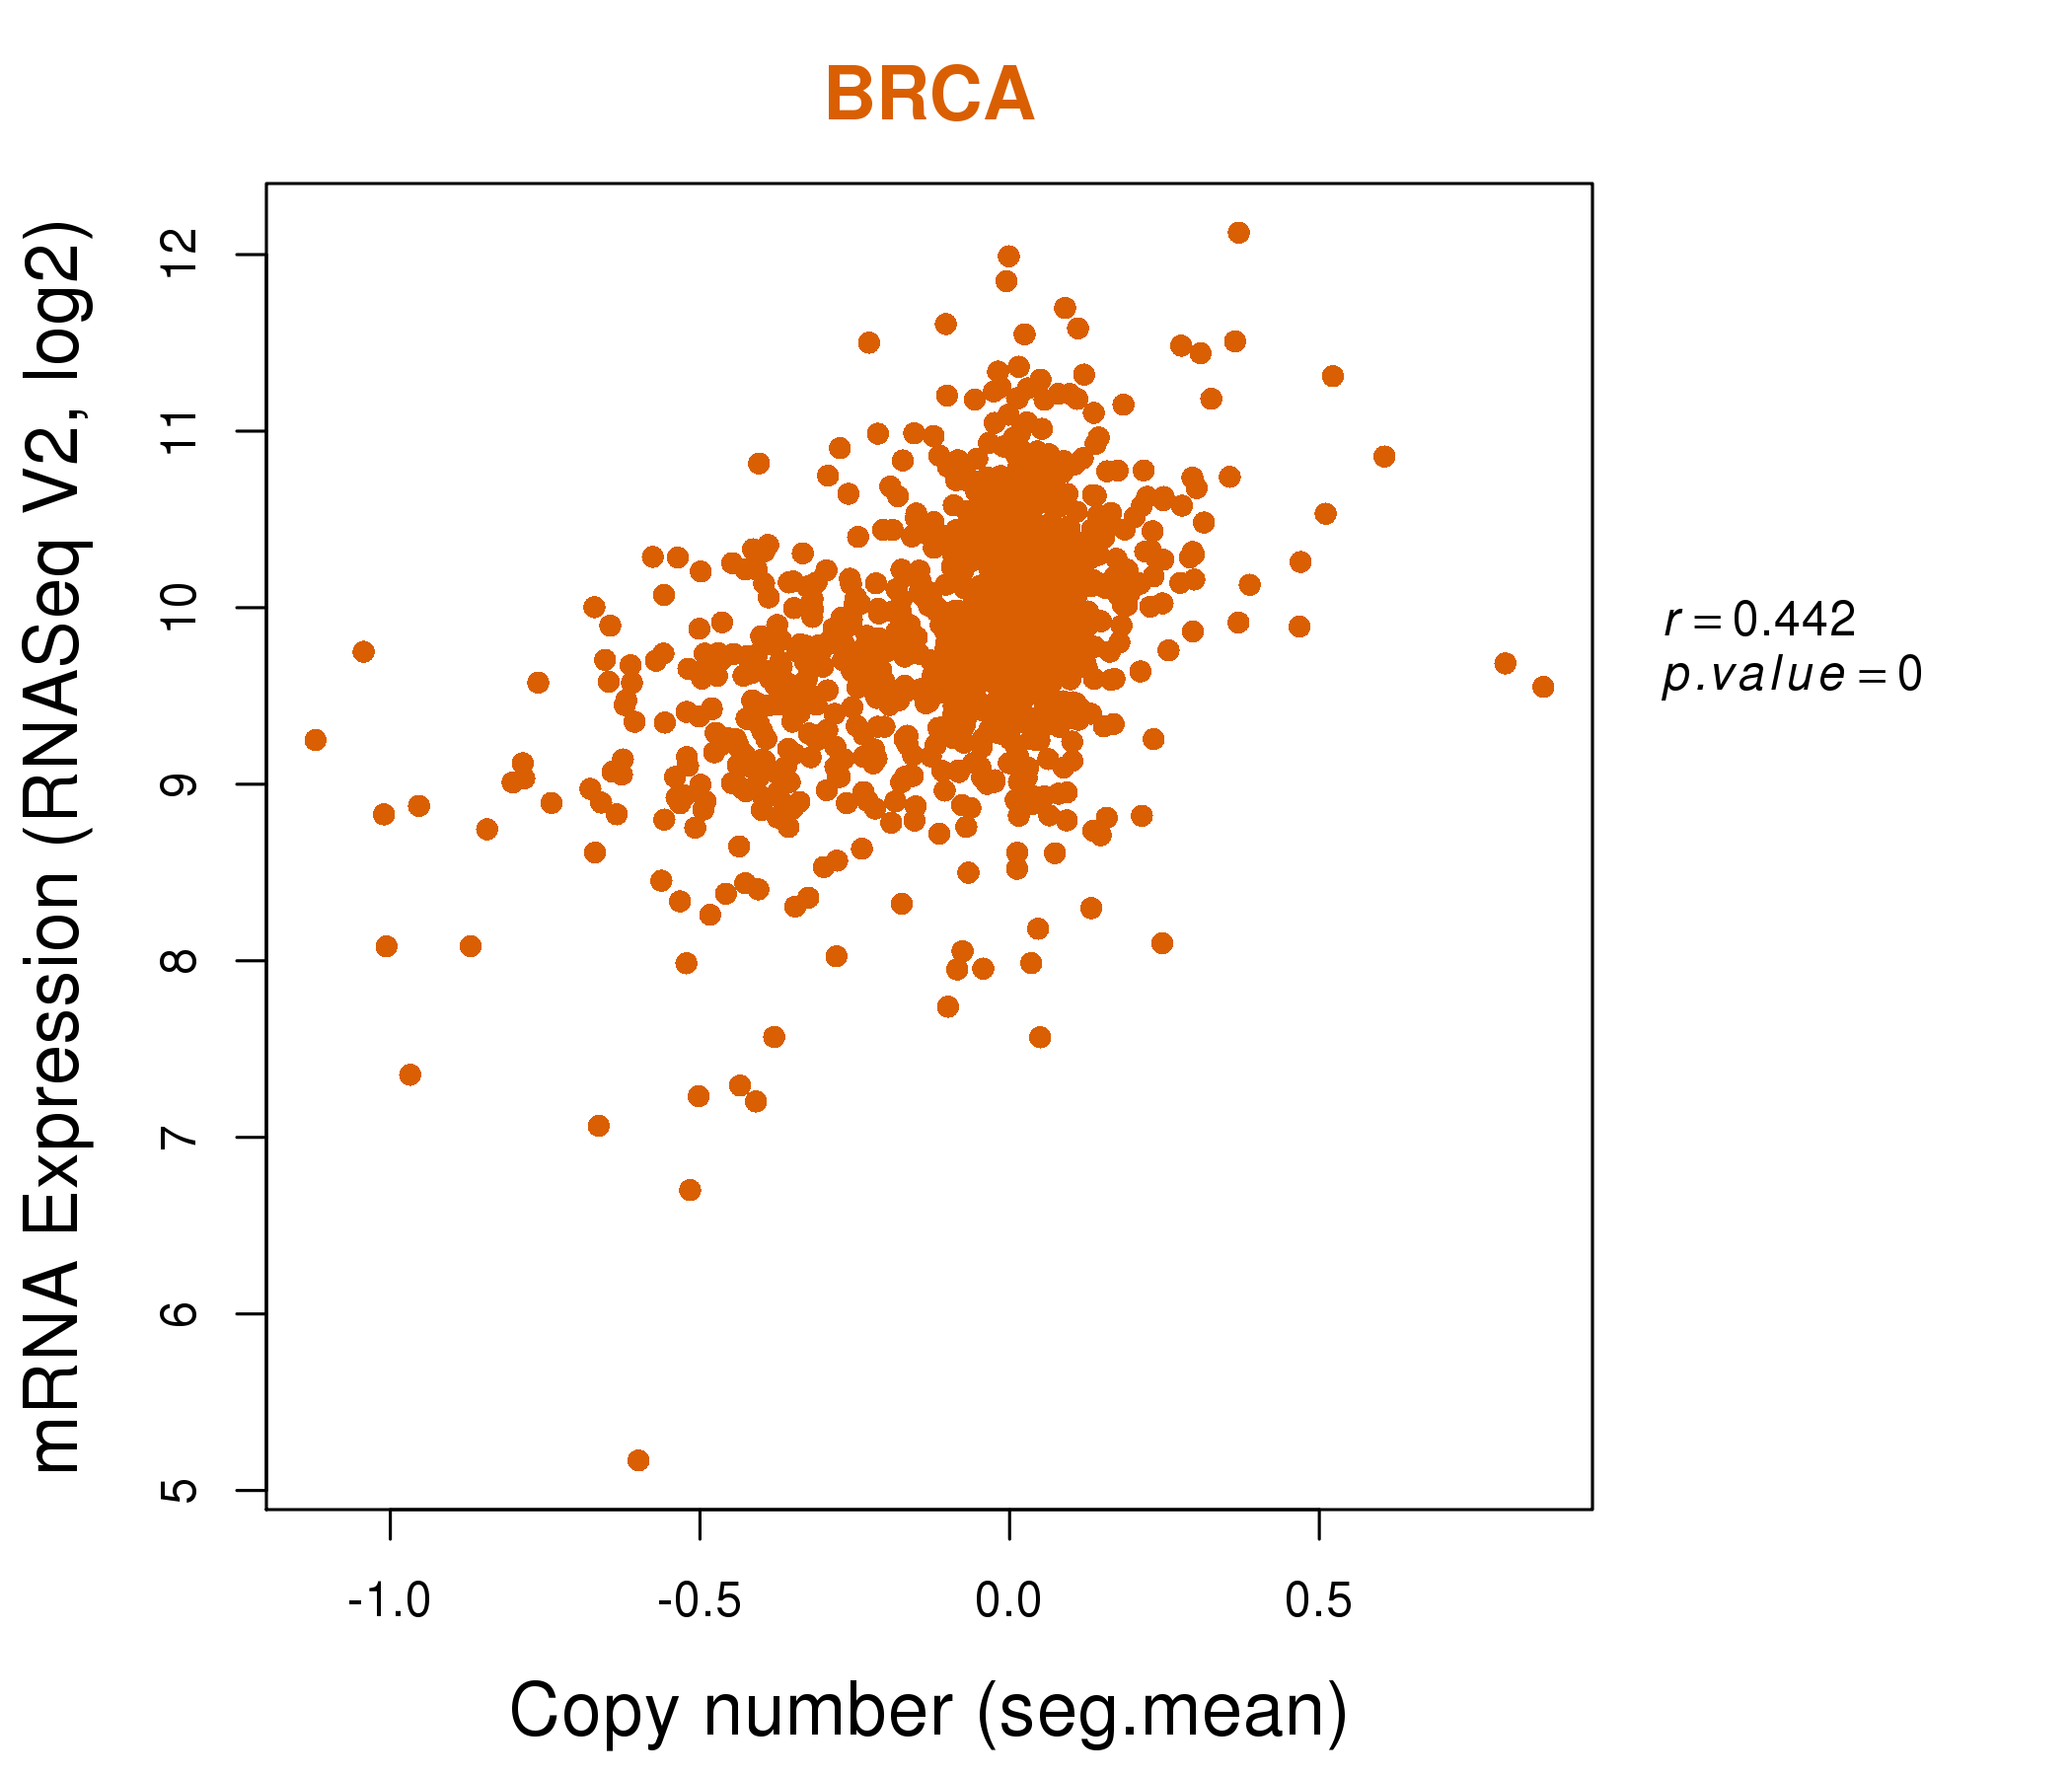
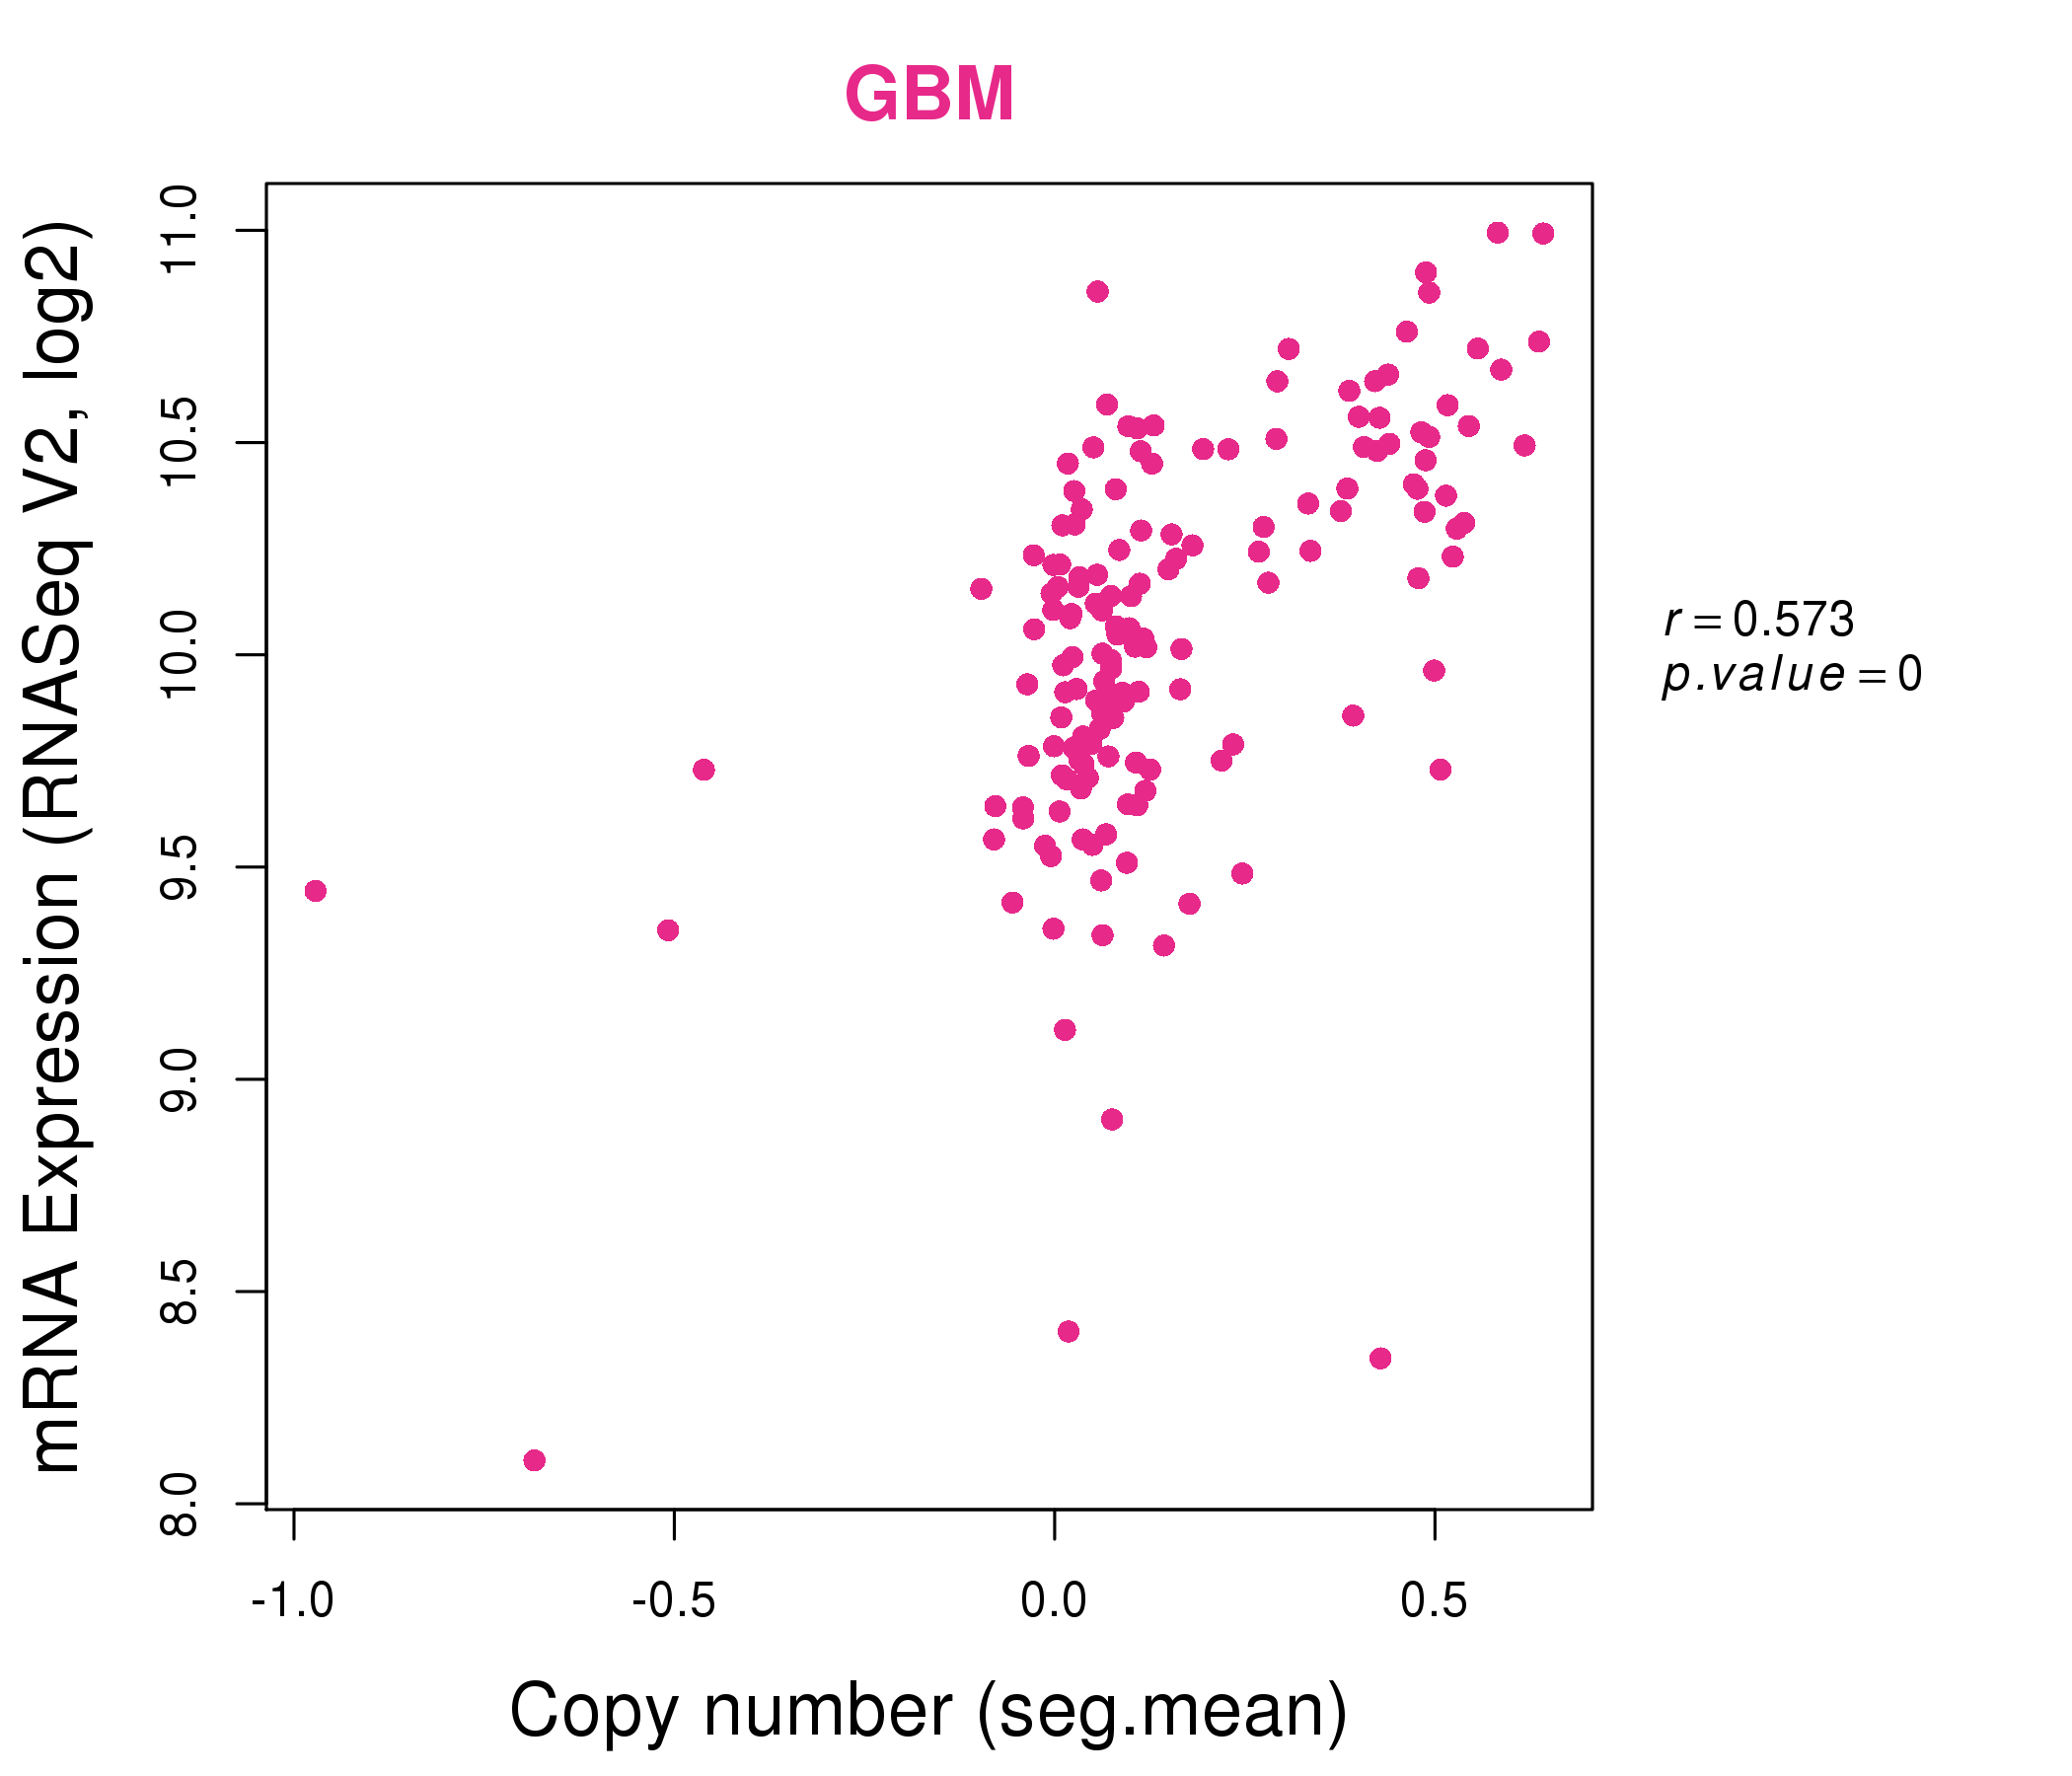
| * Copy number data were extracted from TCGA using R package TCGA-Assembler. The URLs of all public data files on TCGA DCC data server were gathered on Jan-05-2015. Function ProcessCNAData in TCGA-Assembler package was used to obtain gene-level copy number value which is calculated as the average copy number of the genomic region of a gene. |
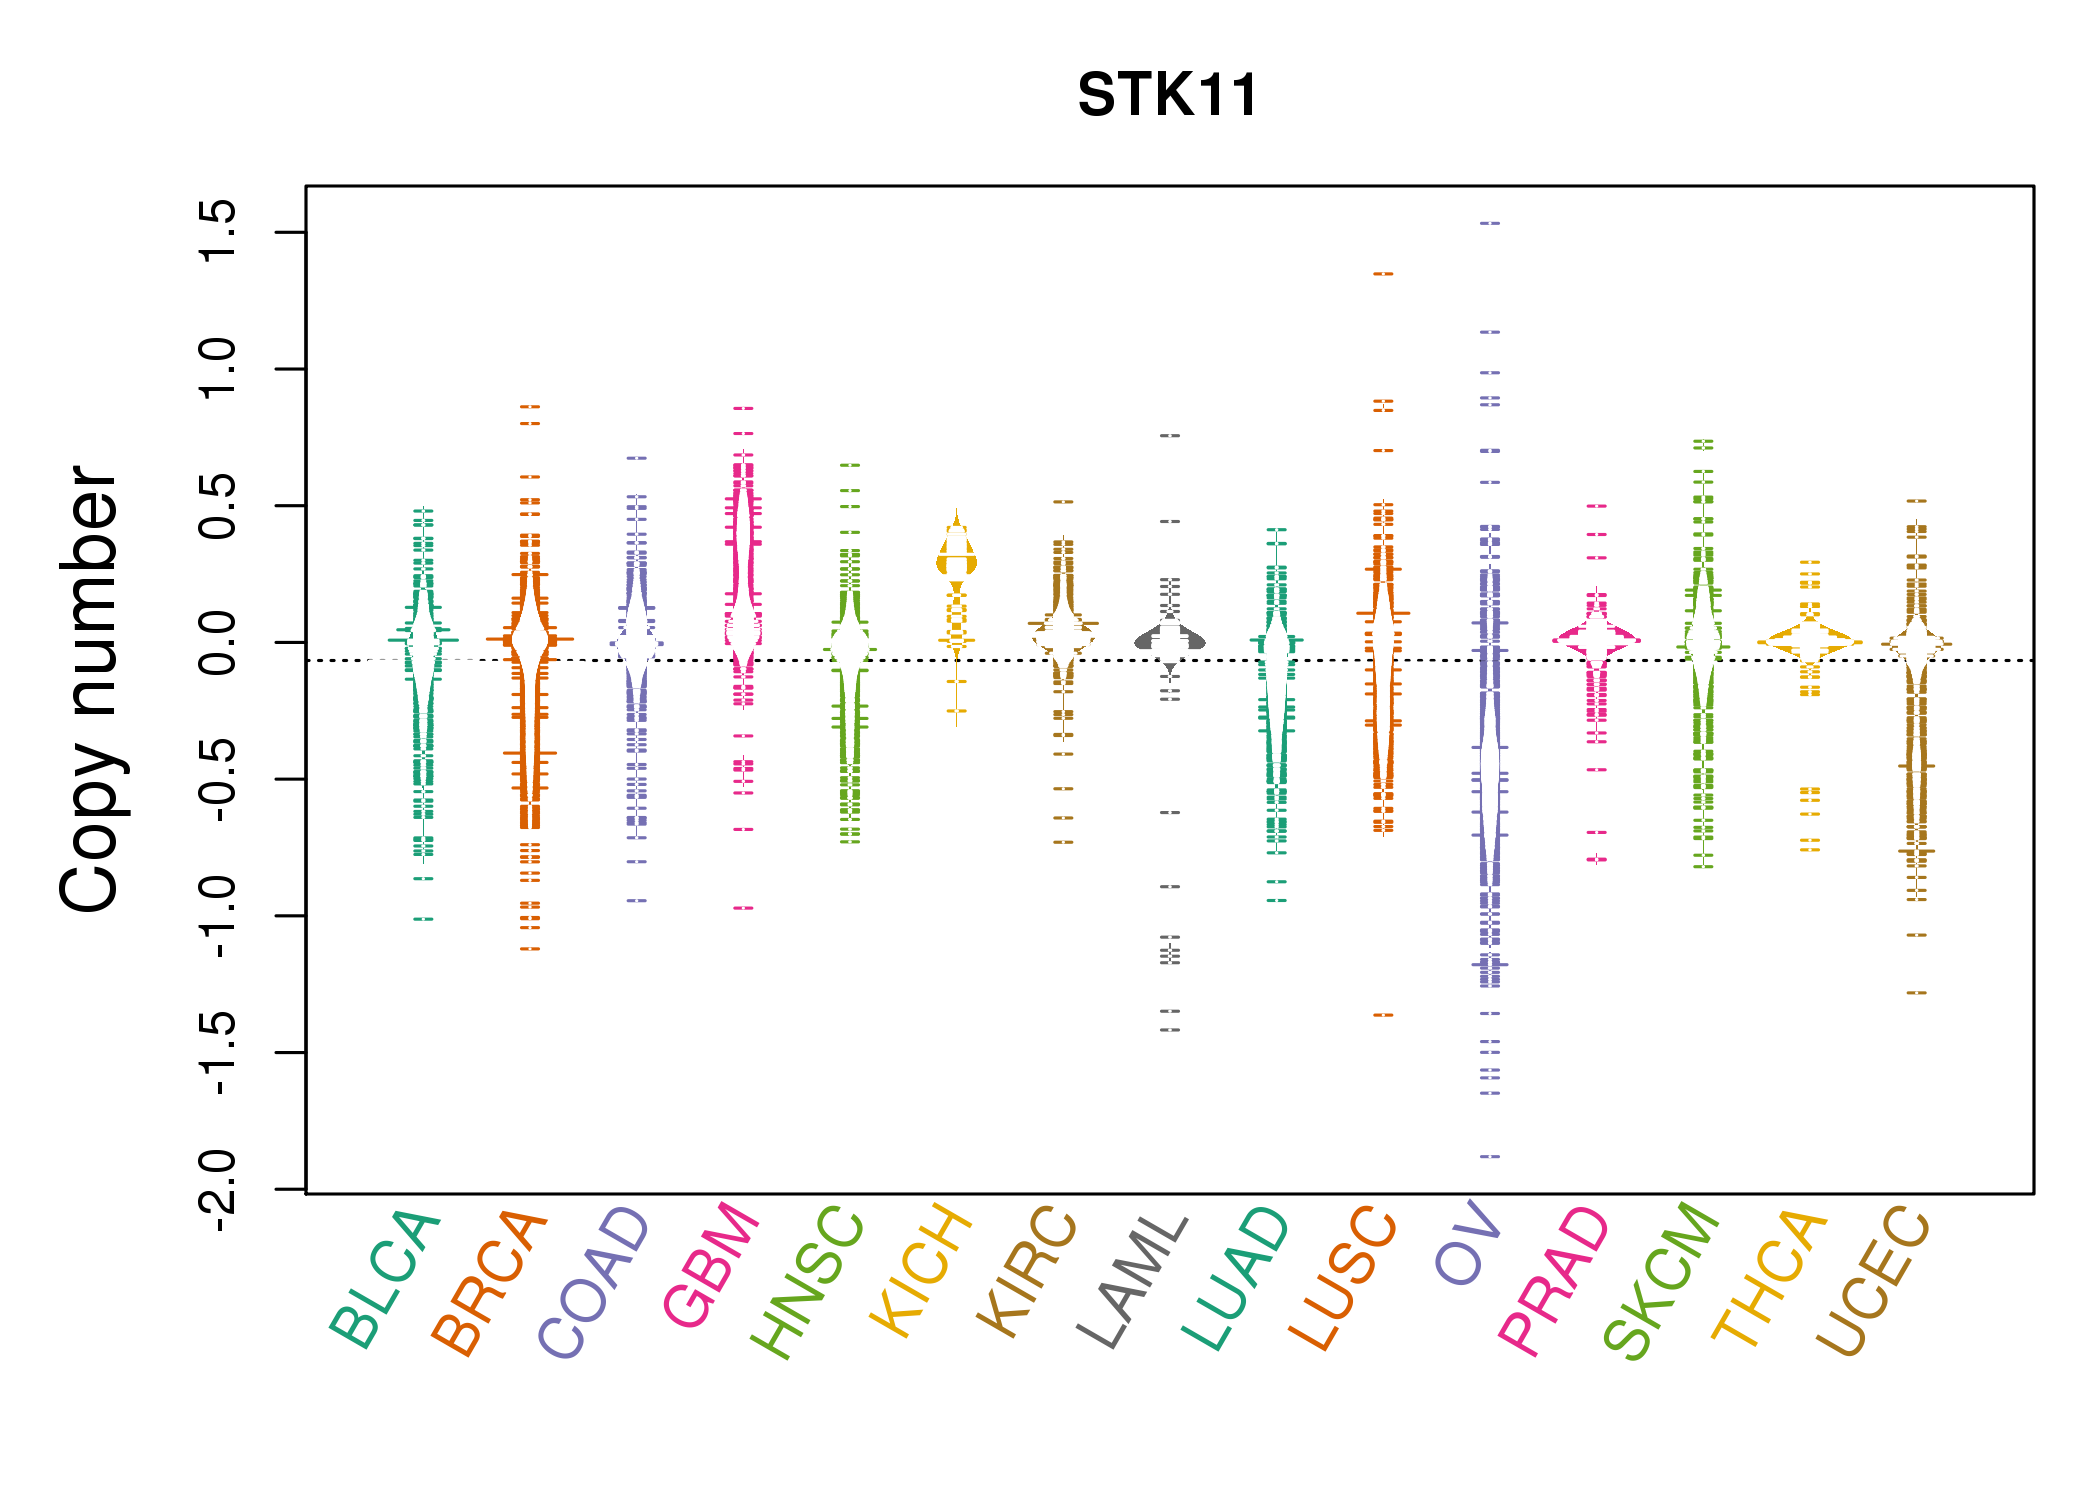 |
| cf) Tissue ID[Tissue type]: BLCA[Bladder Urothelial Carcinoma], BRCA[Breast invasive carcinoma], CESC[Cervical squamous cell carcinoma and endocervical adenocarcinoma], COAD[Colon adenocarcinoma], GBM[Glioblastoma multiforme], Glioma Low Grade, HNSC[Head and Neck squamous cell carcinoma], KICH[Kidney Chromophobe], KIRC[Kidney renal clear cell carcinoma], KIRP[Kidney renal papillary cell carcinoma], LAML[Acute Myeloid Leukemia], LUAD[Lung adenocarcinoma], LUSC[Lung squamous cell carcinoma], OV[Ovarian serous cystadenocarcinoma ], PAAD[Pancreatic adenocarcinoma], PRAD[Prostate adenocarcinoma], SKCM[Skin Cutaneous Melanoma], STAD[Stomach adenocarcinoma], THCA[Thyroid carcinoma], UCEC[Uterine Corpus Endometrial Carcinoma] |
| Top |
| Gene Expression for STK11 |
| * CCLE gene expression data were extracted from CCLE_Expression_Entrez_2012-10-18.res: Gene-centric RMA-normalized mRNA expression data. |
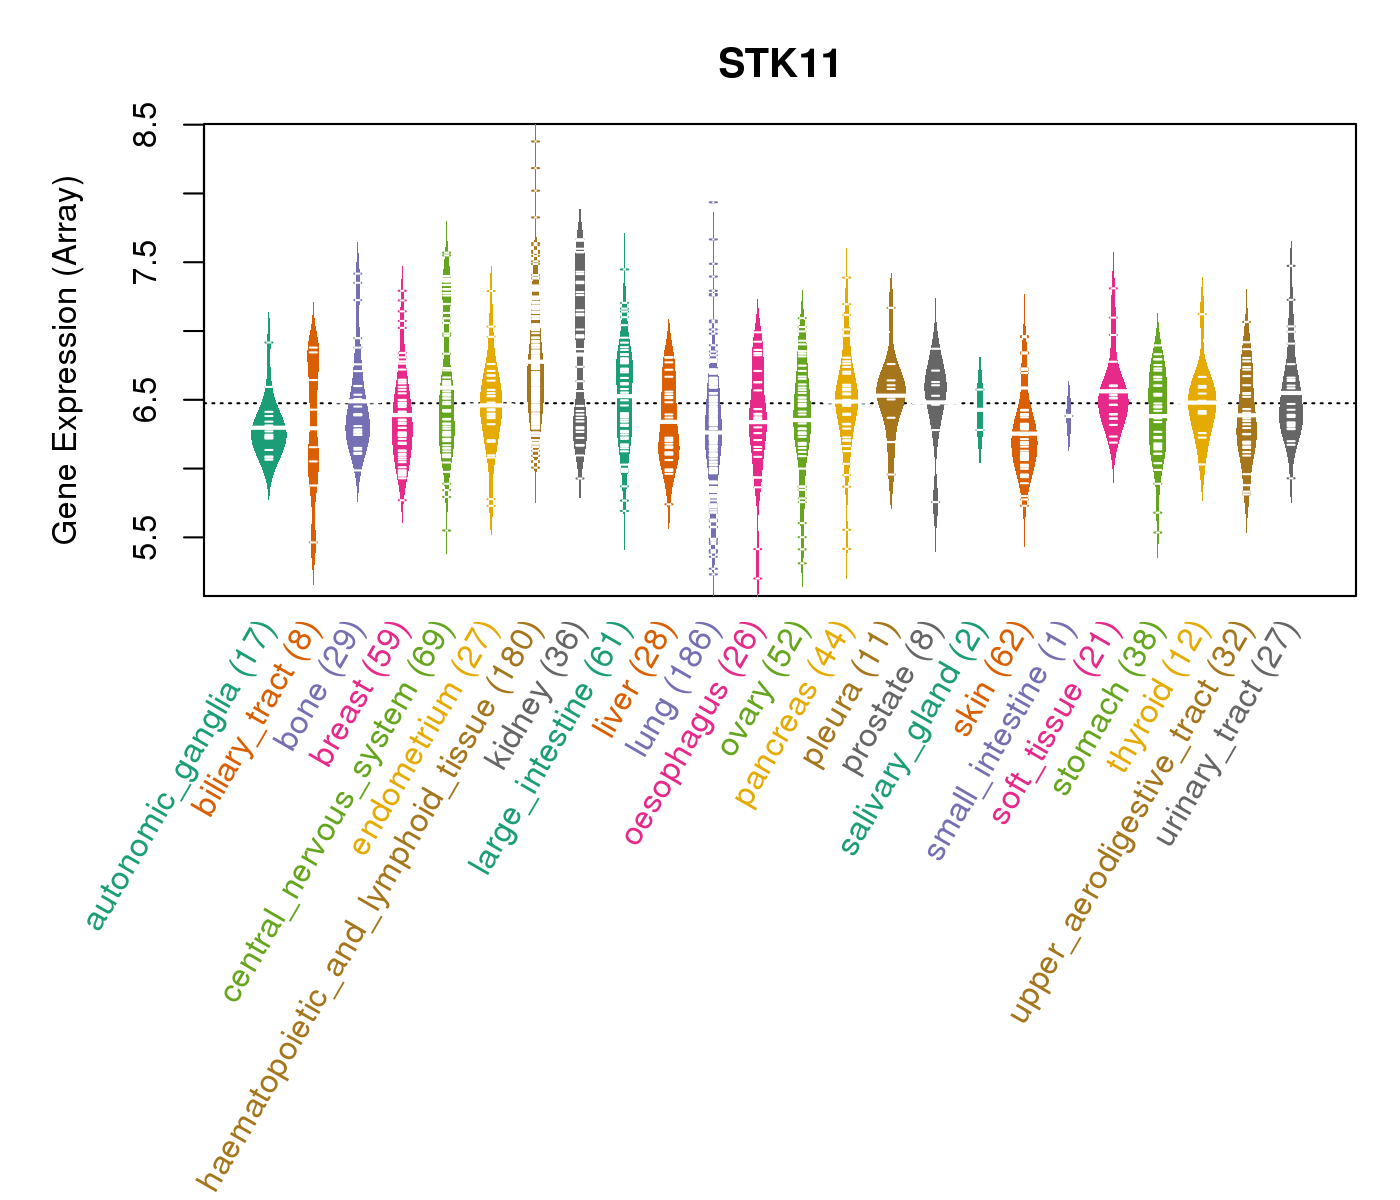 |
| Top |
| *RPPA protein expression data were extracted from TCPA (The Cancer Proteome Atlas). Normalized data based on replicated based normalization (RBN) was used to draw following figures. |
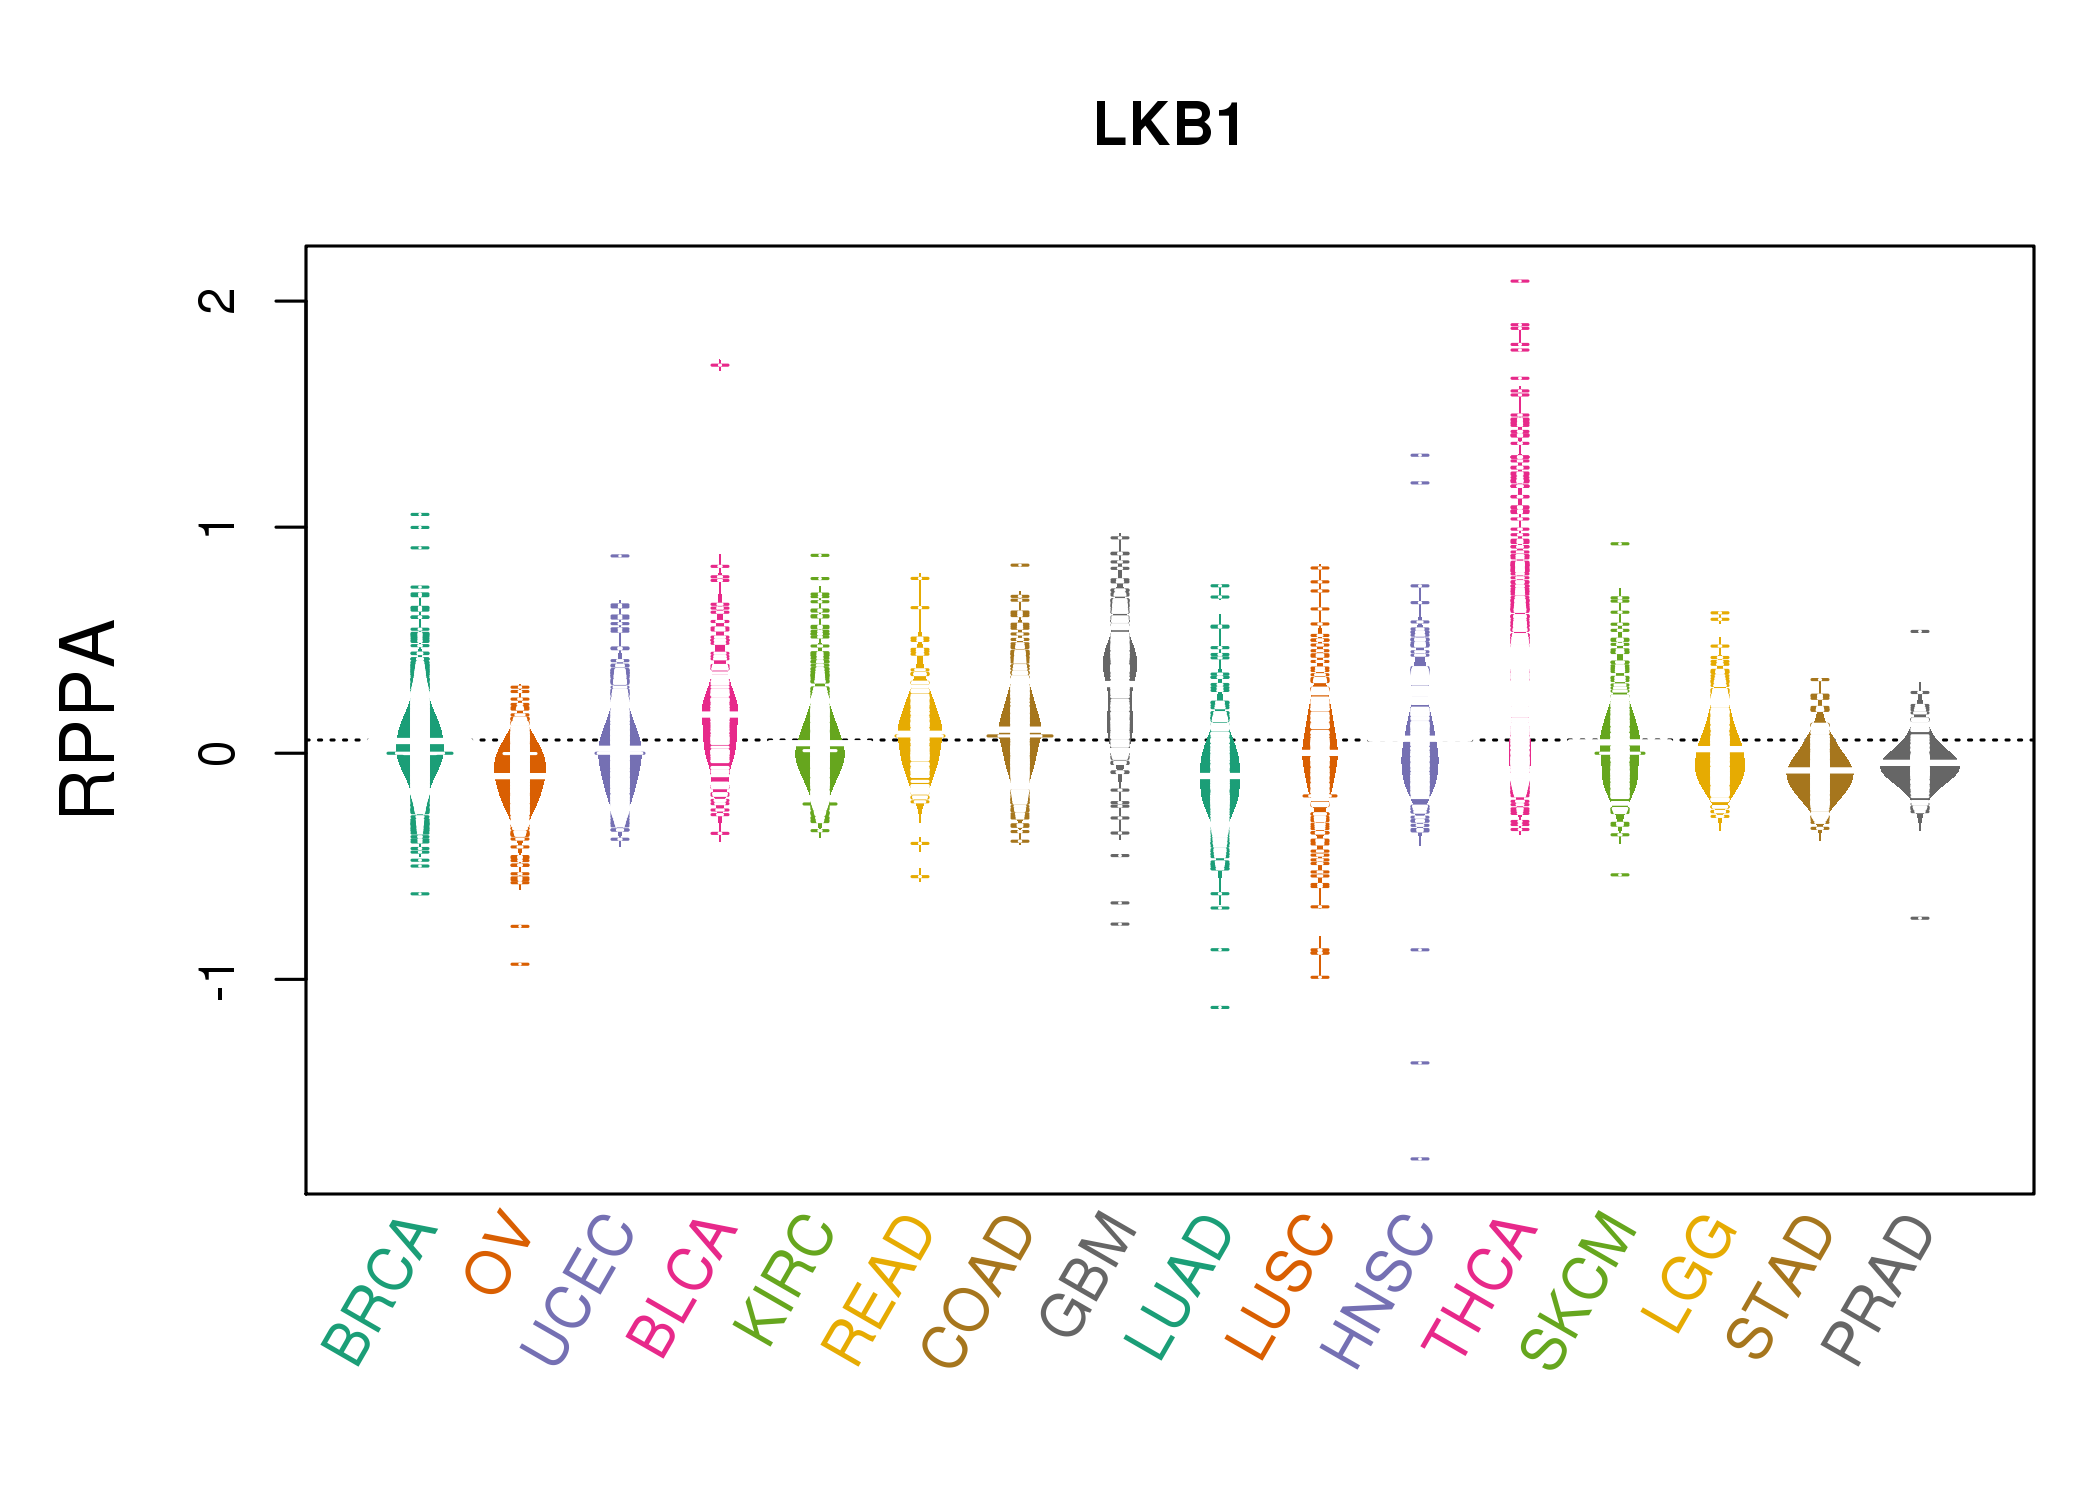 |
| * Normalized gene expression data of RNASeqV2 was extracted from TCGA using R package TCGA-Assembler. The URLs of all public data files on TCGA DCC data server were gathered at Jan-05-2015. Only eight cancer types have enough normal control samples for differential expression analysis. (t test, adjusted p<0.05 (using Benjamini-Hochberg FDR)) |
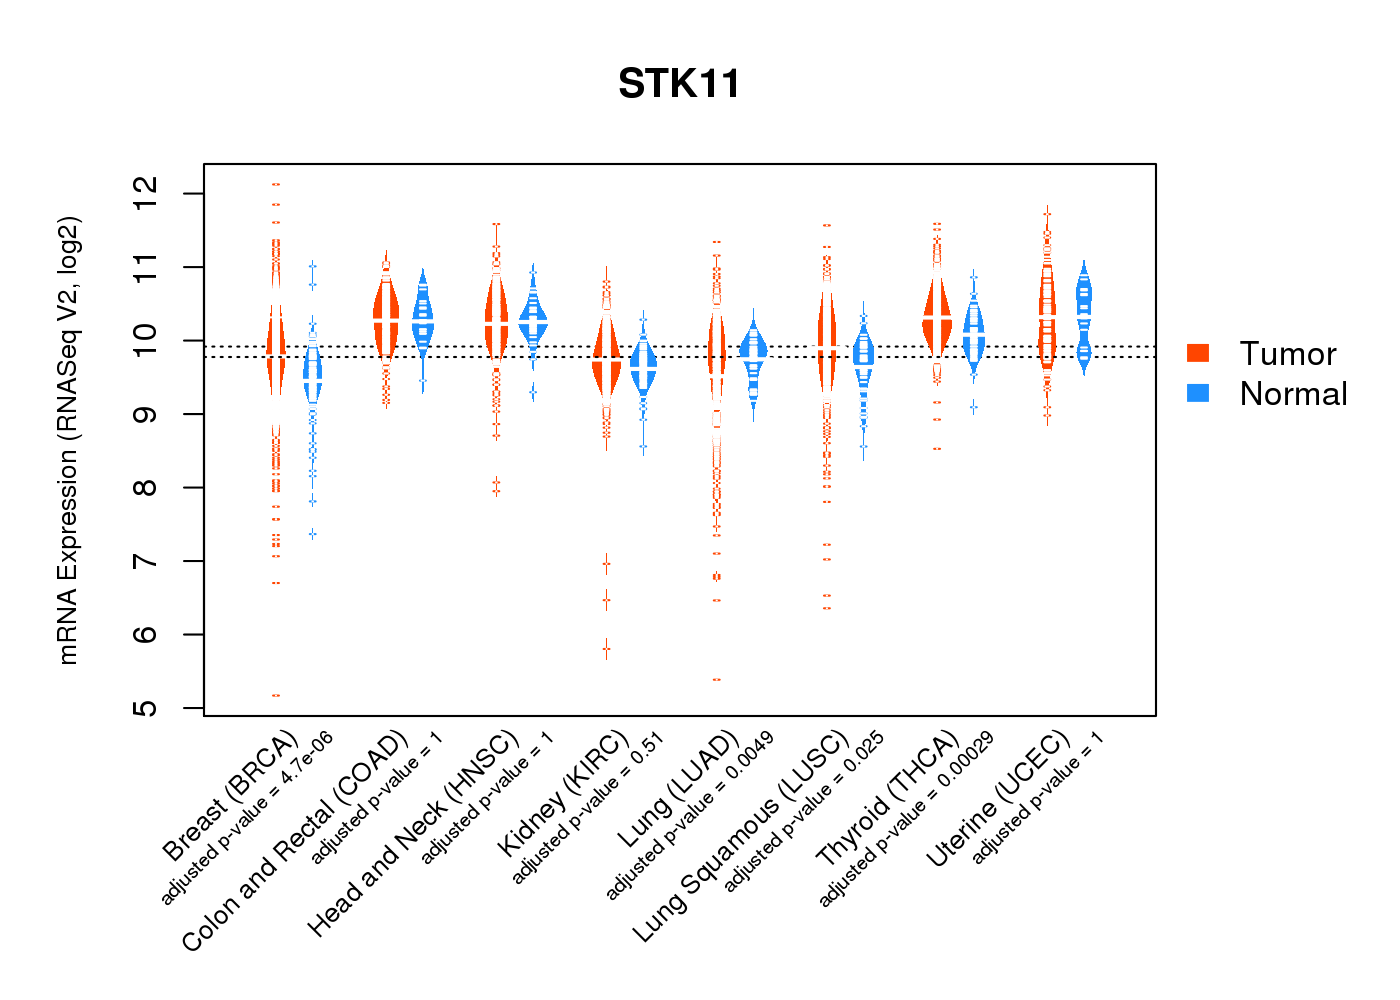 |
| Top |
| * This plots show the correlation between CNV and gene expression. |
: Open all plots for all cancer types
 |
|
 |
|
| Top |
| Gene-Gene Network Information |
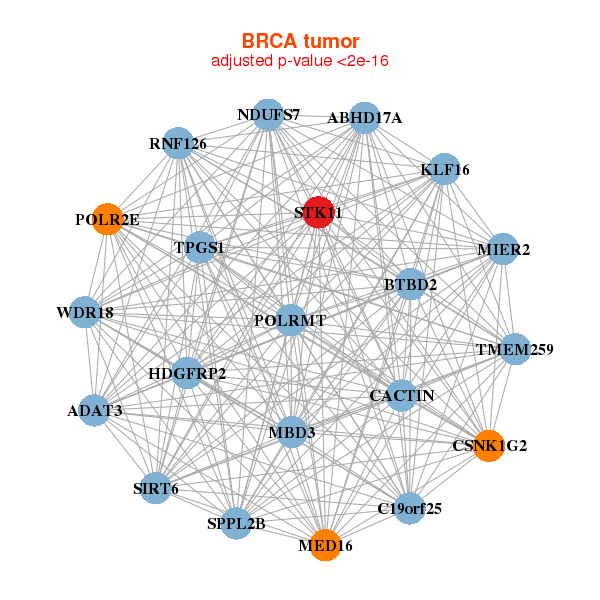
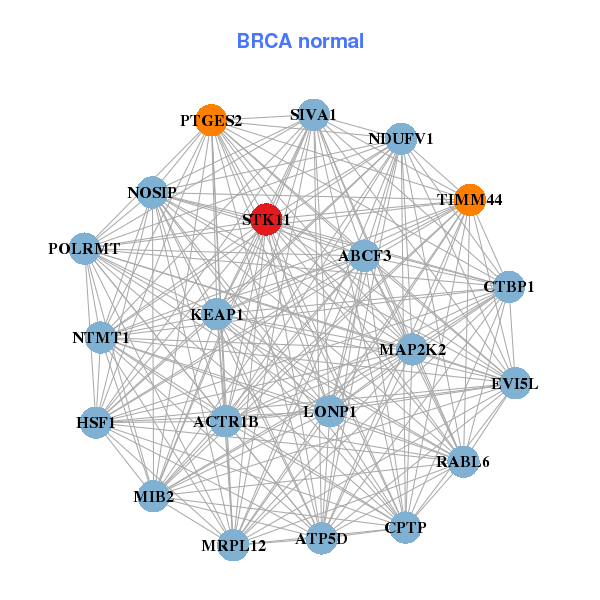
| * Co-Expression network figures were drawn using R package igraph. Only the top 20 genes with the highest correlations were shown. Red circle: input gene, orange circle: cell metabolism gene, sky circle: other gene |
: Open all plots for all cancer types
 |
| ||||
| ADAT3,BTBD2,TPGS1,C19orf25,CACTIN,TMEM259,CSNK1G2, ABHD17A,HDGFRP2,KLF16,MBD3,MED16,MIER2,NDUFS7, POLR2E,POLRMT,RNF126,SIRT6,SPPL2B,STK11,WDR18 | ABCF3,ACTR1B,ATP5D,RABL6,CTBP1,EVI5L,CPTP, HSF1,KEAP1,LONP1,MAP2K2,NTMT1,MIB2,MRPL12, NDUFV1,NOSIP,POLRMT,PTGES2,SIVA1,STK11,TIMM44 | ||||
 |
| ||||
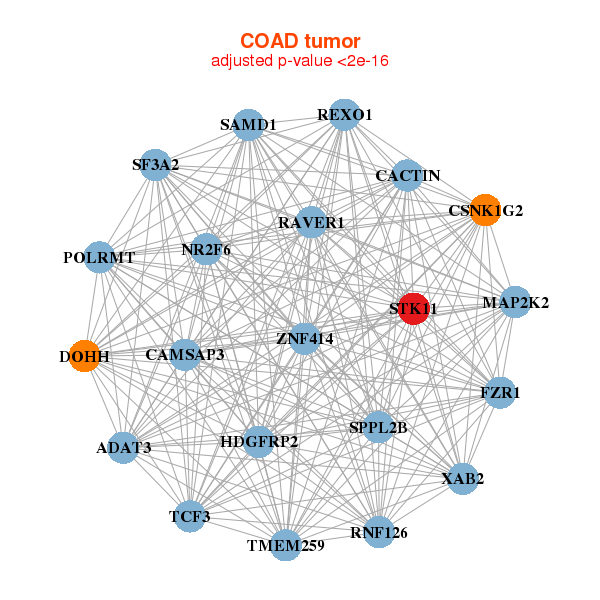
| ADAT3,CACTIN,TMEM259,CSNK1G2,DOHH,FZR1,HDGFRP2, CAMSAP3,MAP2K2,NR2F6,POLRMT,RAVER1,REXO1,RNF126, SAMD1,SF3A2,SPPL2B,STK11,TCF3,XAB2,ZNF414 | ADAT3,VPS51___IFT46,CC2D1A,CCDC61,CTU1,F8A1,FUK, CPTP,LRFN3,MFSD10,C8orf82,MIB2,PGLS,PLA2G6, POLRMT,SPNS1,STK11,TAF6L,TIGD5,ZNF672,ZNF787 |
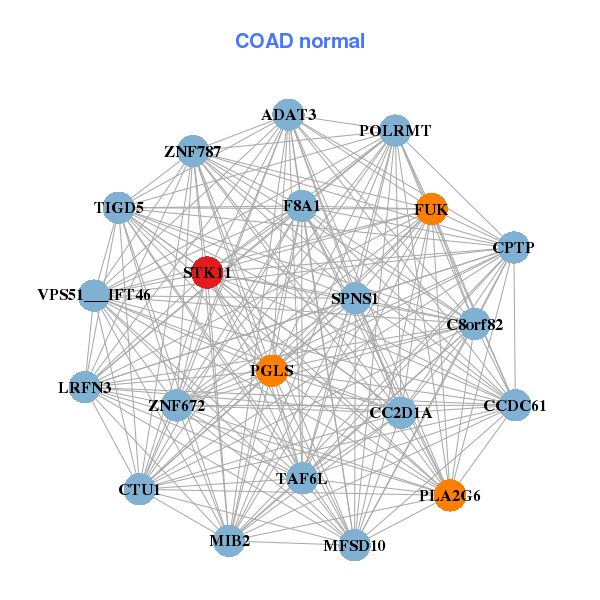
| * Co-Expression network figures were drawn using R package igraph. Only the top 20 genes with the highest correlations were shown. Red circle: input gene, orange circle: cell metabolism gene, sky circle: other gene |
: Open all plots for all cancer types
| Top |
: Open all interacting genes' information including KEGG pathway for all interacting genes from DAVID
| Top |
| Pharmacological Information for STK11 |
| DB Category | DB Name | DB's ID and Url link |
| Chemistry | BindingDB | Q15831; -. |
| Chemistry | ChEMBL | CHEMBL5606; -. |
| Chemistry | GuidetoPHARMACOLOGY | 2212; -. |
| Organism-specific databases | PharmGKB | PA36198; -. |
| Organism-specific databases | CTD | 6794; -. |
| * Gene Centered Interaction Network. |
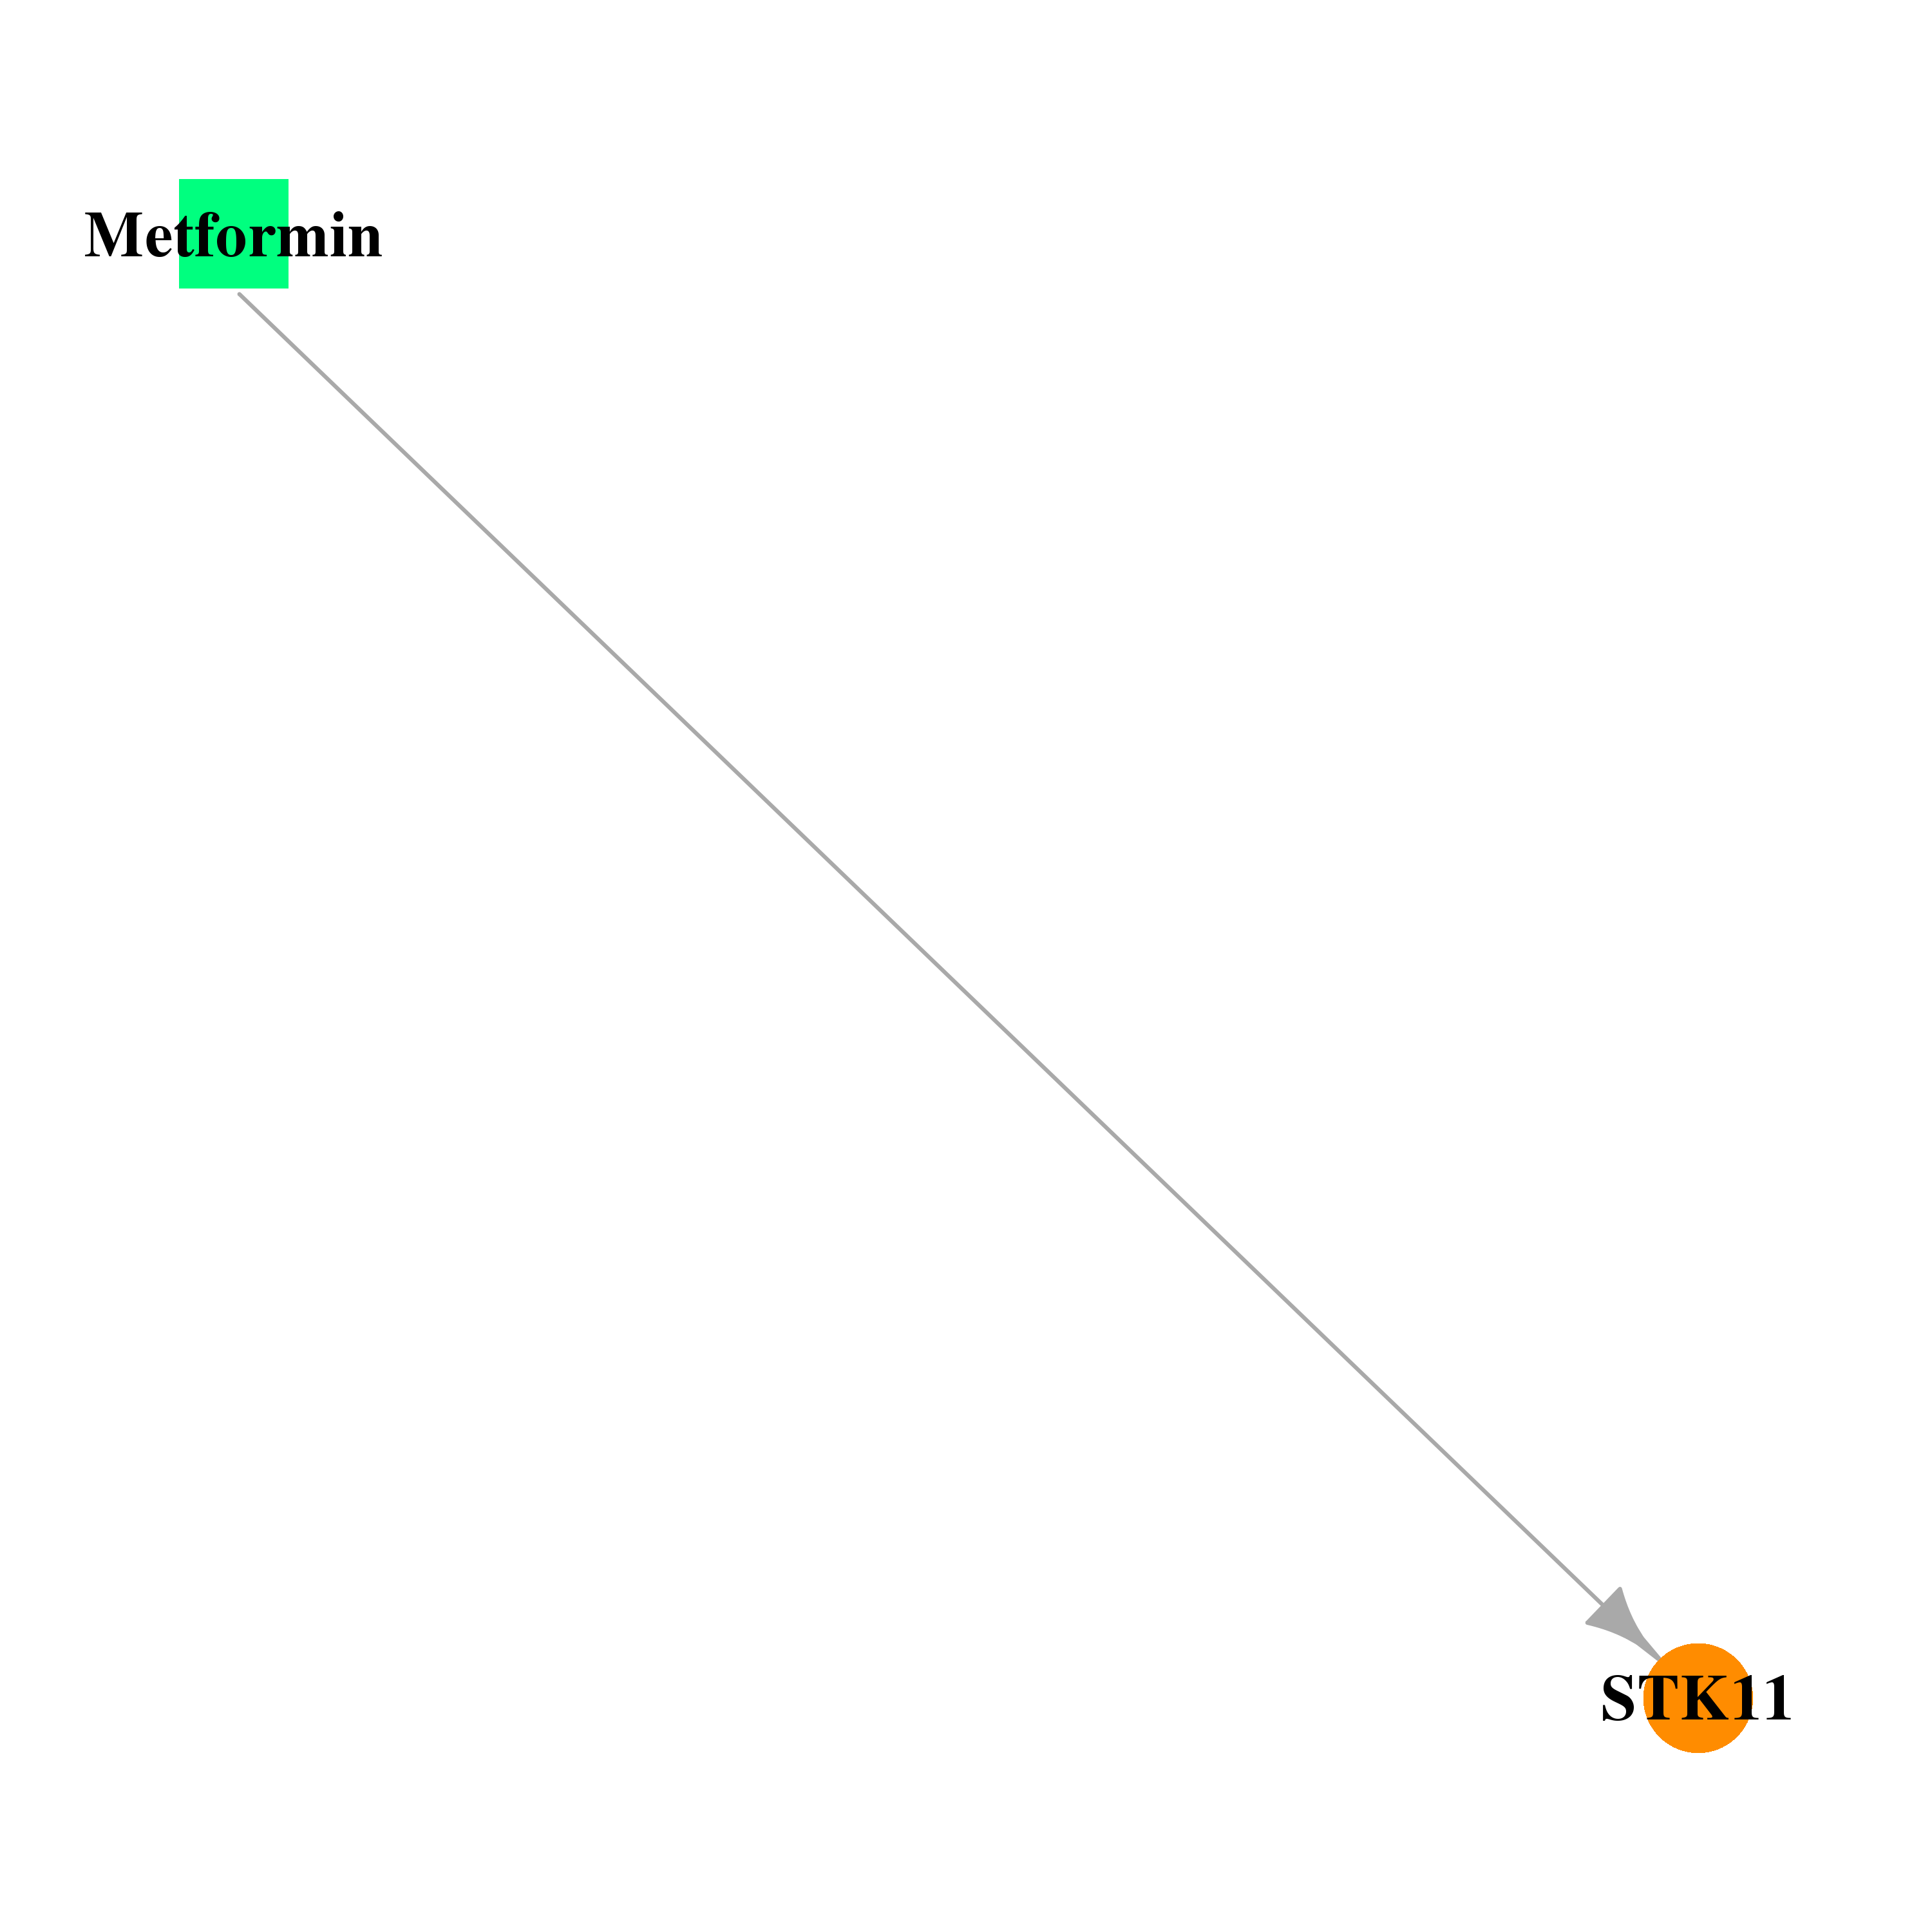 |
| * Drug Centered Interaction Network. |
| DrugBank ID | Target Name | Drug Groups | Generic Name | Drug Centered Network | Drug Structure |
| DB00331 | serine/threonine kinase 11 | approved | Metformin |  | 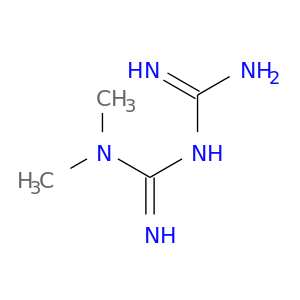 |
| Top |
| Cross referenced IDs for STK11 |
| * We obtained these cross-references from Uniprot database. It covers 150 different DBs, 18 categories. http://www.uniprot.org/help/cross_references_section |
: Open all cross reference information
|
Copyright © 2016-Present - The Univsersity of Texas Health Science Center at Houston @ |