|
||||||||||||||||||||
| |
| Phenotypic Information (metabolism pathway, cancer, disease, phenome) |
| |
| |
| Gene-Gene Network Information: Co-Expression Network, Interacting Genes & KEGG |
| |
|


| Gene Summary for SULT1A2 |
| Basic gene info. | Gene symbol | SULT1A2 |
| Gene name | sulfotransferase family, cytosolic, 1A, phenol-preferring, member 2 | |
| Synonyms | HAST4|P-PST|ST1A2|STP2|TSPST2 | |
| Cytomap | UCSC genome browser: 16p12.1 | |
| Genomic location | chr16 :28603263-28608391 | |
| Type of gene | protein-coding | |
| RefGenes | NM_001054.3, NM_177528.2, | |
| Ensembl id | ENSG00000197165 | |
| Description | P-PST 2aryl sulfotransferase 2arylamine sulfotransferasephenol sulfotransferase 2phenol-preferring phenol sulfotransferase2phenol-sulfating phenol sulfotransferase 2phenolic-metabolizing (P) form of PSTsulfotransferase 1A2thermostable phenol sulfo | |
| Modification date | 20141207 | |
| dbXrefs | MIM : 601292 | |
| HGNC : HGNC | ||
| Ensembl : ENSG00000197165 | ||
| HPRD : 03187 | ||
| Vega : OTTHUMG00000048082 | ||
| Protein | UniProt: go to UniProt's Cross Reference DB Table | |
| Expression | CleanEX: HS_SULT1A2 | |
| BioGPS: 6799 | ||
| Gene Expression Atlas: ENSG00000197165 | ||
| The Human Protein Atlas: ENSG00000197165 | ||
| Pathway | NCI Pathway Interaction Database: SULT1A2 | |
| KEGG: SULT1A2 | ||
| REACTOME: SULT1A2 | ||
| ConsensusPathDB | ||
| Pathway Commons: SULT1A2 | ||
| Metabolism | MetaCyc: SULT1A2 | |
| HUMANCyc: SULT1A2 | ||
| Regulation | Ensembl's Regulation: ENSG00000197165 | |
| miRBase: chr16 :28,603,263-28,608,391 | ||
| TargetScan: NM_001054 | ||
| cisRED: ENSG00000197165 | ||
| Context | iHOP: SULT1A2 | |
| cancer metabolism search in PubMed: SULT1A2 | ||
| UCL Cancer Institute: SULT1A2 | ||
| Assigned class in ccmGDB | C | |
| Top |
| Phenotypic Information for SULT1A2(metabolism pathway, cancer, disease, phenome) |
| Cancer | CGAP: SULT1A2 |
| Familial Cancer Database: SULT1A2 | |
| * This gene is included in those cancer gene databases. |
|
|
|
|
|
|
| ||||||||||||||
Oncogene 1 | Significant driver gene in | |||||||||||||||||||
| cf) number; DB name 1 Oncogene; http://nar.oxfordjournals.org/content/35/suppl_1/D721.long, 2 Tumor Suppressor gene; https://bioinfo.uth.edu/TSGene/, 3 Cancer Gene Census; http://www.nature.com/nrc/journal/v4/n3/abs/nrc1299.html, 4 CancerGenes; http://nar.oxfordjournals.org/content/35/suppl_1/D721.long, 5 Network of Cancer Gene; http://ncg.kcl.ac.uk/index.php, 1Therapeutic Vulnerabilities in Cancer; http://cbio.mskcc.org/cancergenomics/statius/ |
| KEGG_SULFUR_METABOLISM | |
| Mutations for SULT1A2 |
| * Under tables are showing count per each tissue to give us broad intuition about tissue specific mutation patterns.You can go to the detailed page for each mutation database's web site. |
| There's no structural variation information in COSMIC data for this gene. |
| * From mRNA Sanger sequences, Chitars2.0 arranged chimeric transcripts. This table shows SULT1A2 related fusion information. |
| ID | Head Gene | Tail Gene | Accession | Gene_a | qStart_a | qEnd_a | Chromosome_a | tStart_a | tEnd_a | Gene_a | qStart_a | qEnd_a | Chromosome_a | tStart_a | tEnd_a |
| Top |
| There's no copy number variation information in COSMIC data for this gene. |
| Top |
|
 |
| Top |
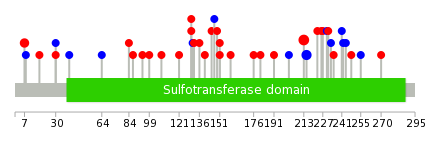
| Stat. for Non-Synonymous SNVs (# total SNVs=20) | (# total SNVs=7) |
 |  |
(# total SNVs=0) | (# total SNVs=0) |
| Top |
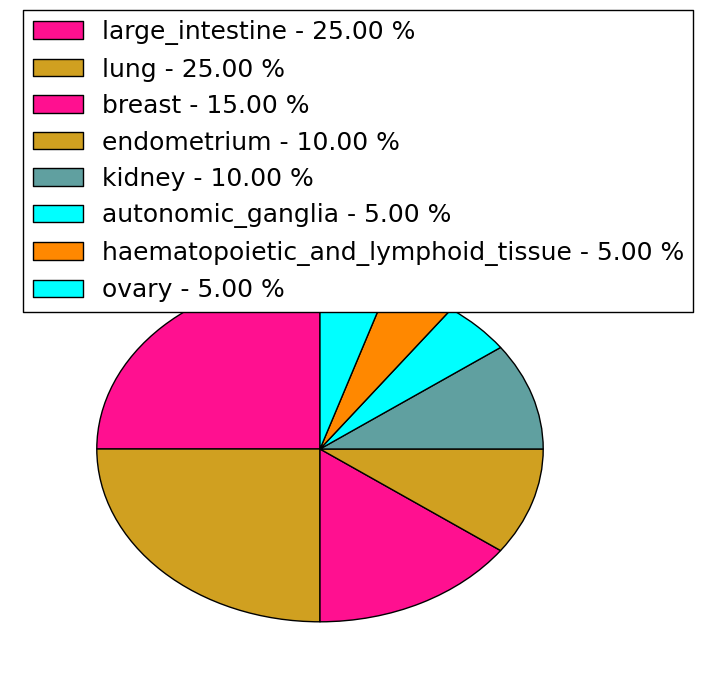
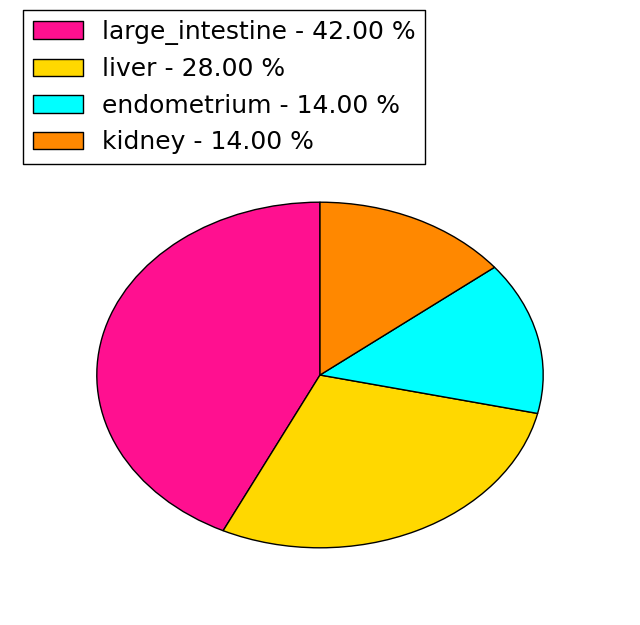
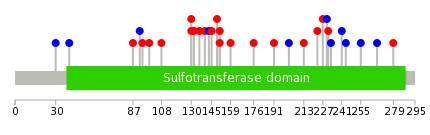
| * When you move the cursor on each content, you can see more deailed mutation information on the Tooltip. Those are primary_site,primary_histology,mutation(aa),pubmedID. |
| GRCh37 position | Mutation(aa) | Unique sampleID count |
| chr16:28603721-28603721 | p.R213H | 4 |
| chr16:28603714-28603714 | p.L215L | 3 |
| chr16:28604874-28604874 | p.R130S | 2 |
| chr16:28607232-28607232 | p.I7T | 2 |
| chr16:28606895-28606895 | p.F84L | 1 |
| chr16:28603627-28603627 | p.R244R | 1 |
| chr16:28604843-28604843 | p.Y140C | 1 |
| chr16:28606953-28606953 | p.G64G | 1 |
| chr16:28603633-28603633 | p.T242T | 1 |
| chr16:28603753-28603753 | p.R202R | 1 |
| Top |
|
 |
| Point Mutation/ Tissue ID | 1 | 2 | 3 | 4 | 5 | 6 | 7 | 8 | 9 | 10 | 11 | 12 | 13 | 14 | 15 | 16 | 17 | 18 | 19 | 20 |
| # sample | 3 | 1 | 2 | 3 | 4 | 2 | 7 | 5 | 2 | |||||||||||
| # mutation | 3 | 1 | 4 | 3 | 4 | 2 | 7 | 5 | 2 | |||||||||||
| nonsynonymous SNV | 1 | 4 | 2 | 3 | 2 | 2 | 5 | 2 | ||||||||||||
| synonymous SNV | 3 | 1 | 1 | 5 |
| cf) Tissue ID; Tissue type (1; BLCA[Bladder Urothelial Carcinoma], 2; BRCA[Breast invasive carcinoma], 3; CESC[Cervical squamous cell carcinoma and endocervical adenocarcinoma], 4; COAD[Colon adenocarcinoma], 5; GBM[Glioblastoma multiforme], 6; Glioma Low Grade, 7; HNSC[Head and Neck squamous cell carcinoma], 8; KICH[Kidney Chromophobe], 9; KIRC[Kidney renal clear cell carcinoma], 10; KIRP[Kidney renal papillary cell carcinoma], 11; LAML[Acute Myeloid Leukemia], 12; LUAD[Lung adenocarcinoma], 13; LUSC[Lung squamous cell carcinoma], 14; OV[Ovarian serous cystadenocarcinoma ], 15; PAAD[Pancreatic adenocarcinoma], 16; PRAD[Prostate adenocarcinoma], 17; SKCM[Skin Cutaneous Melanoma], 18:STAD[Stomach adenocarcinoma], 19:THCA[Thyroid carcinoma], 20:UCEC[Uterine Corpus Endometrial Carcinoma]) |
| Top |
| * We represented just top 10 SNVs. When you move the cursor on each content, you can see more deailed mutation information on the Tooltip. Those are primary_site, primary_histology, mutation(aa), pubmedID. |
| Genomic Position | Mutation(aa) | Unique sampleID count |
| chr16:28604874 | p.R130S,SULT1A2 | 2 |
| chr16:28603636 | p.A132T,SULT1A2 | 1 |
| chr16:28604809 | p.E231K,SULT1A2 | 1 |
| chr16:28606779 | p.K230K,SULT1A2 | 1 |
| chr16:28603660 | p.H108Q,SULT1A2 | 1 |
| chr16:28604811 | p.T227A,SULT1A2 | 1 |
| chr16:28606784 | p.T99I,SULT1A2 | 1 |
| chr16:28603668 | p.M223I,SULT1A2 | 1 |
| chr16:28604817 | p.E94G,SULT1A2 | 1 |
| chr16:28606886 | p.R213H,SULT1A2 | 1 |
| * Copy number data were extracted from TCGA using R package TCGA-Assembler. The URLs of all public data files on TCGA DCC data server were gathered on Jan-05-2015. Function ProcessCNAData in TCGA-Assembler package was used to obtain gene-level copy number value which is calculated as the average copy number of the genomic region of a gene. |
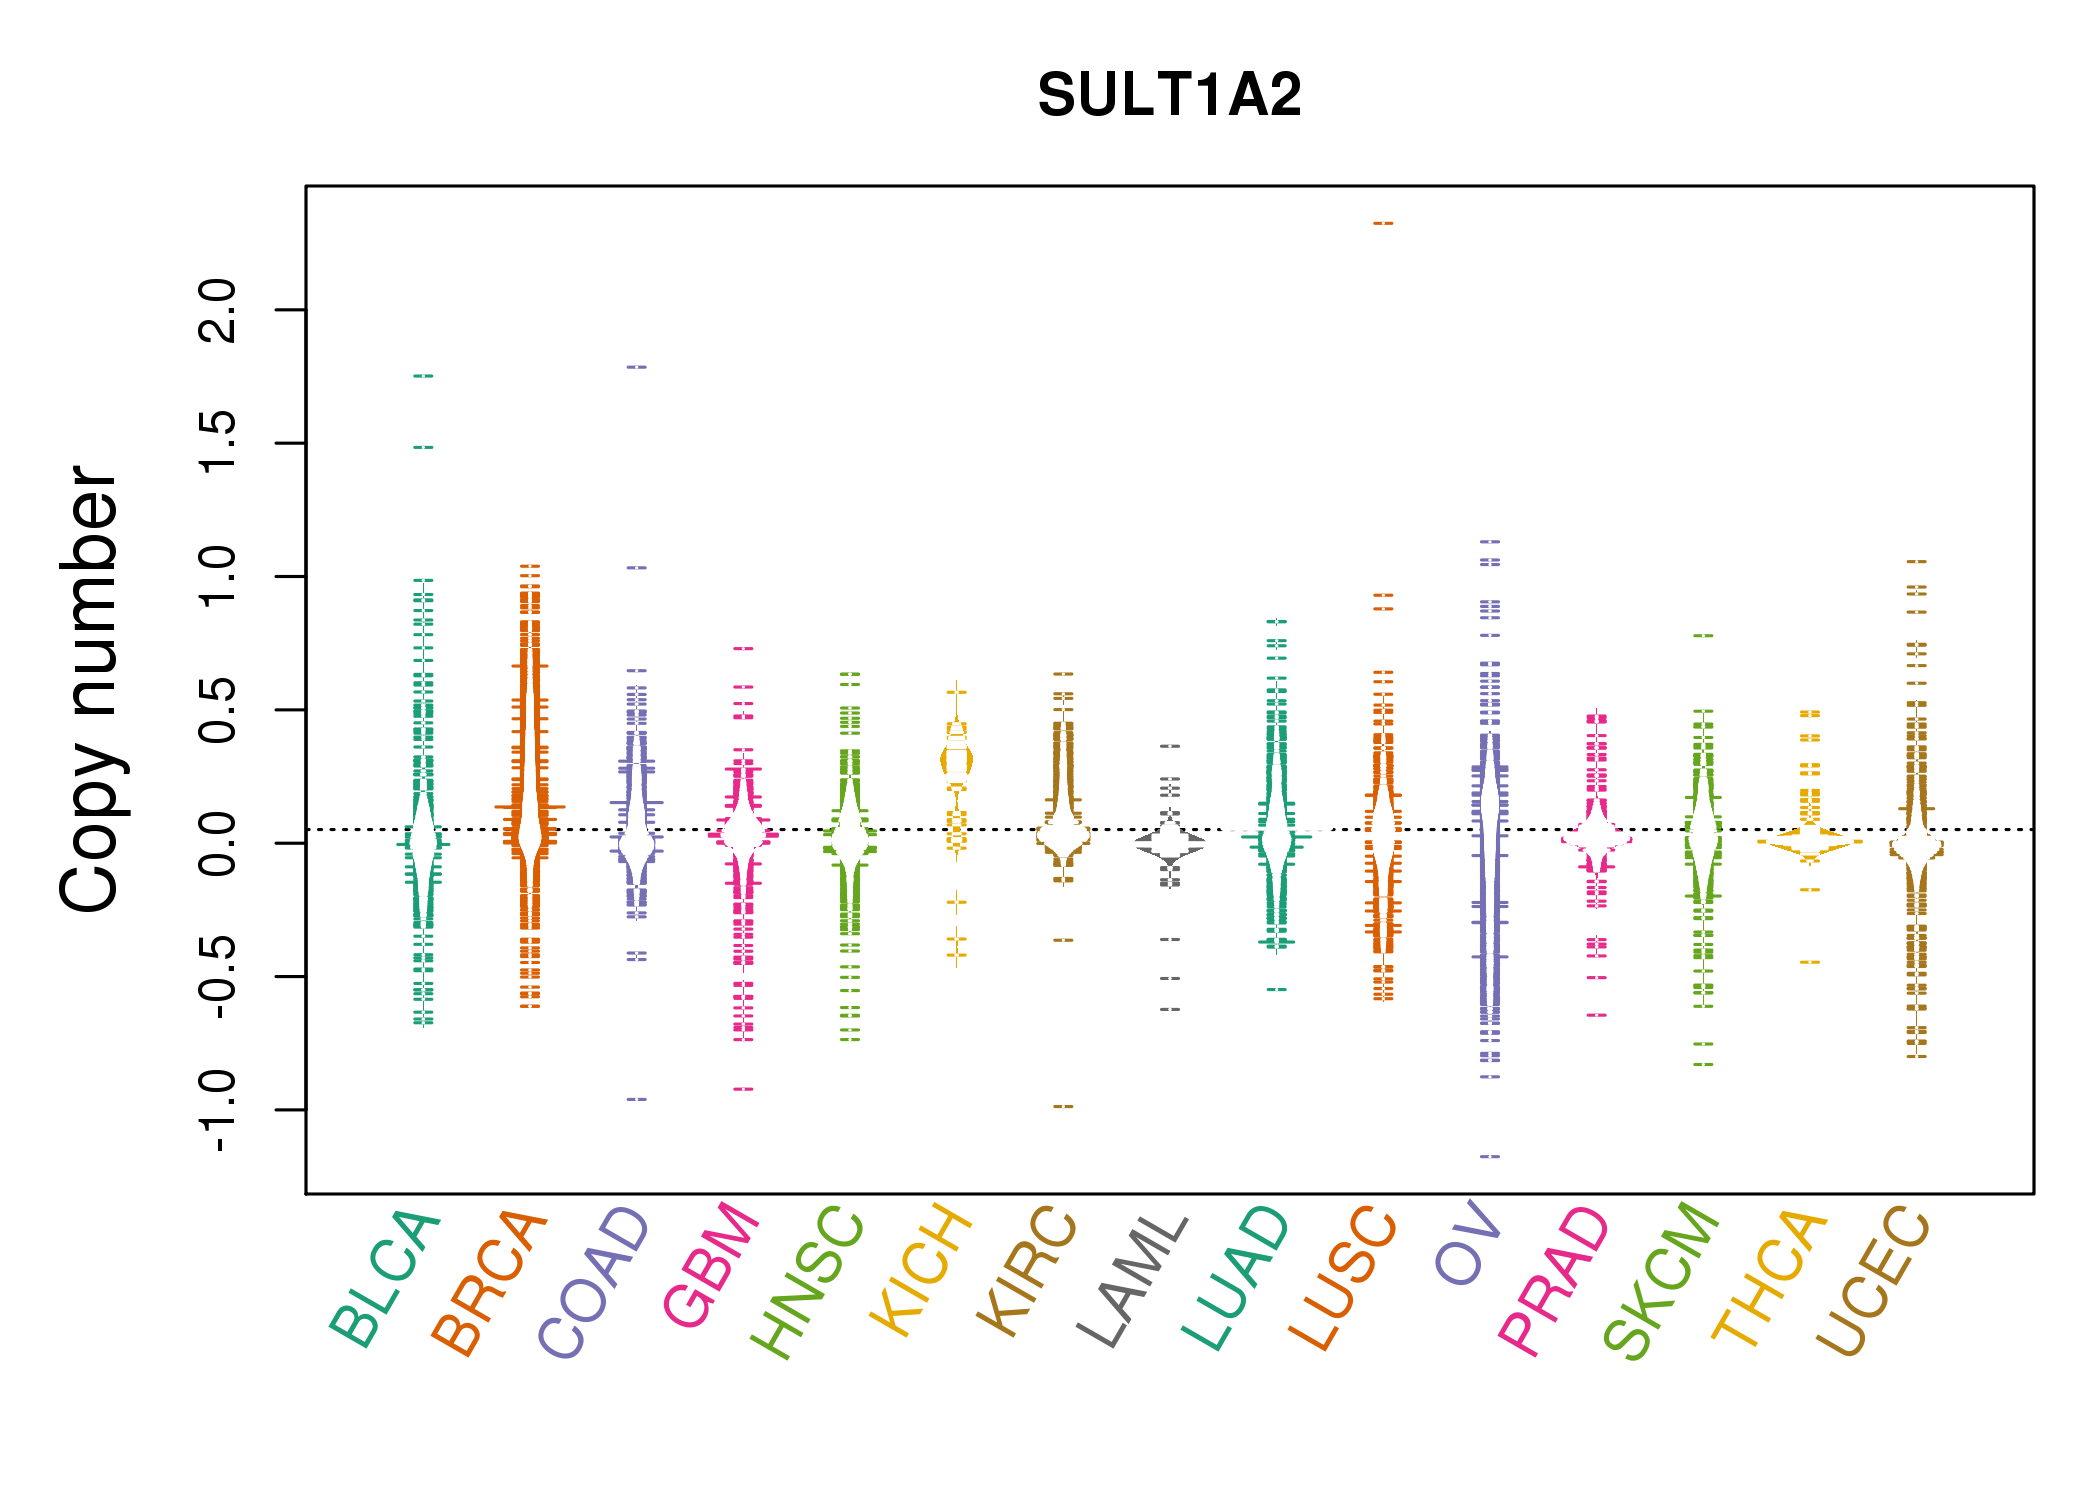 |
| cf) Tissue ID[Tissue type]: BLCA[Bladder Urothelial Carcinoma], BRCA[Breast invasive carcinoma], CESC[Cervical squamous cell carcinoma and endocervical adenocarcinoma], COAD[Colon adenocarcinoma], GBM[Glioblastoma multiforme], Glioma Low Grade, HNSC[Head and Neck squamous cell carcinoma], KICH[Kidney Chromophobe], KIRC[Kidney renal clear cell carcinoma], KIRP[Kidney renal papillary cell carcinoma], LAML[Acute Myeloid Leukemia], LUAD[Lung adenocarcinoma], LUSC[Lung squamous cell carcinoma], OV[Ovarian serous cystadenocarcinoma ], PAAD[Pancreatic adenocarcinoma], PRAD[Prostate adenocarcinoma], SKCM[Skin Cutaneous Melanoma], STAD[Stomach adenocarcinoma], THCA[Thyroid carcinoma], UCEC[Uterine Corpus Endometrial Carcinoma] |
| Top |
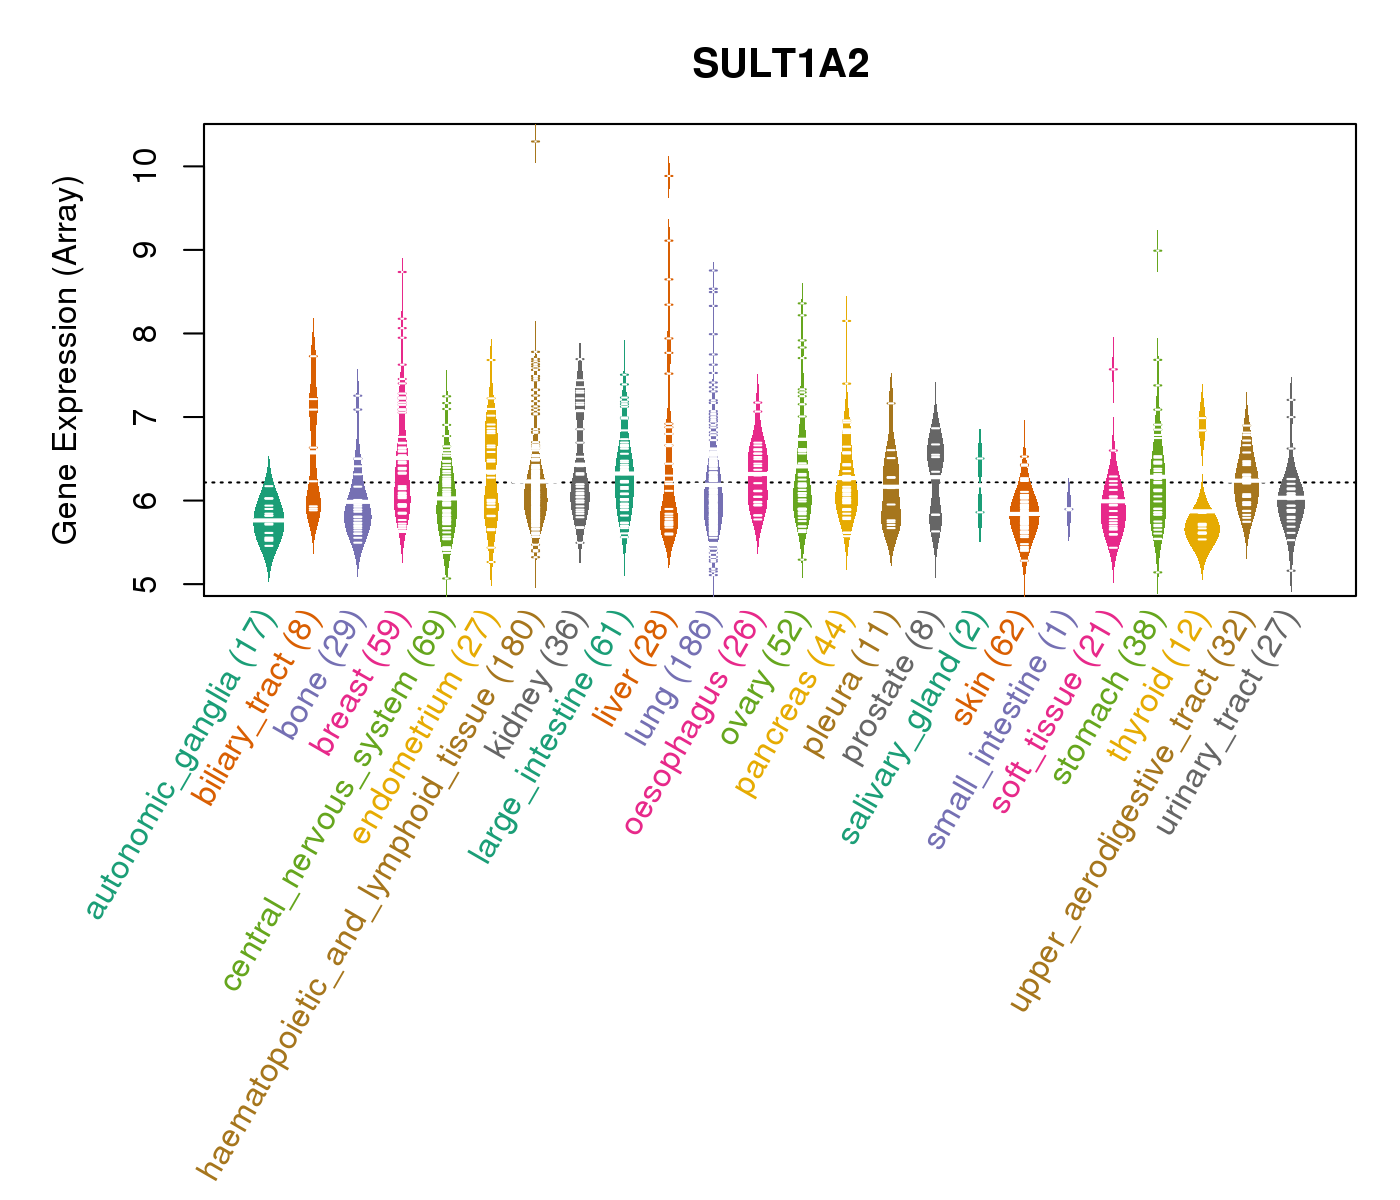
| Gene Expression for SULT1A2 |
| * CCLE gene expression data were extracted from CCLE_Expression_Entrez_2012-10-18.res: Gene-centric RMA-normalized mRNA expression data. |
 |
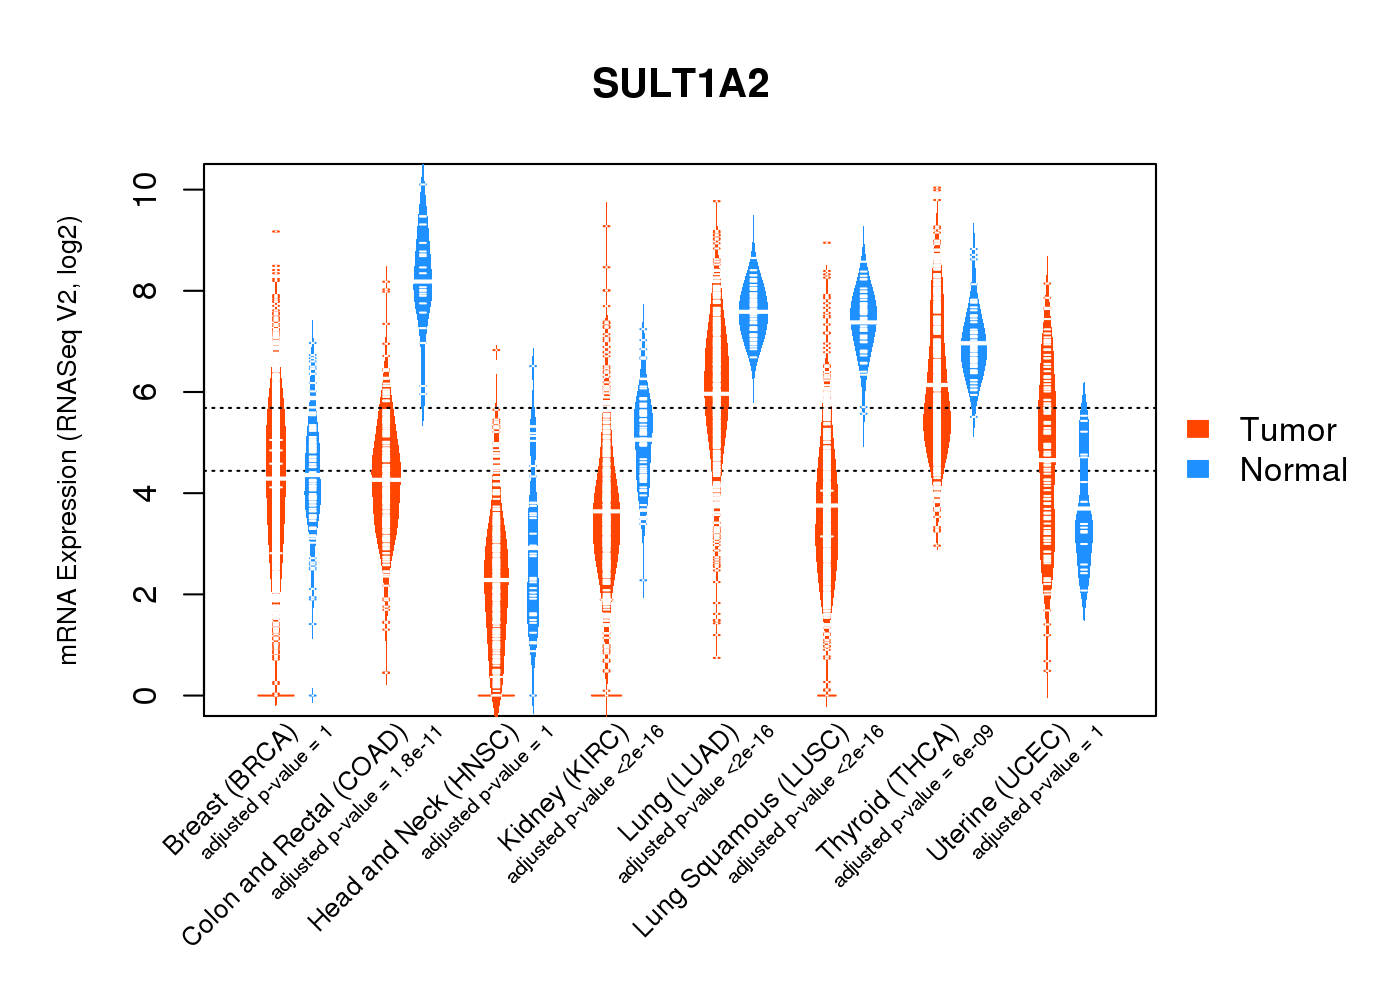
| * Normalized gene expression data of RNASeqV2 was extracted from TCGA using R package TCGA-Assembler. The URLs of all public data files on TCGA DCC data server were gathered at Jan-05-2015. Only eight cancer types have enough normal control samples for differential expression analysis. (t test, adjusted p<0.05 (using Benjamini-Hochberg FDR)) |
 |
| Top |
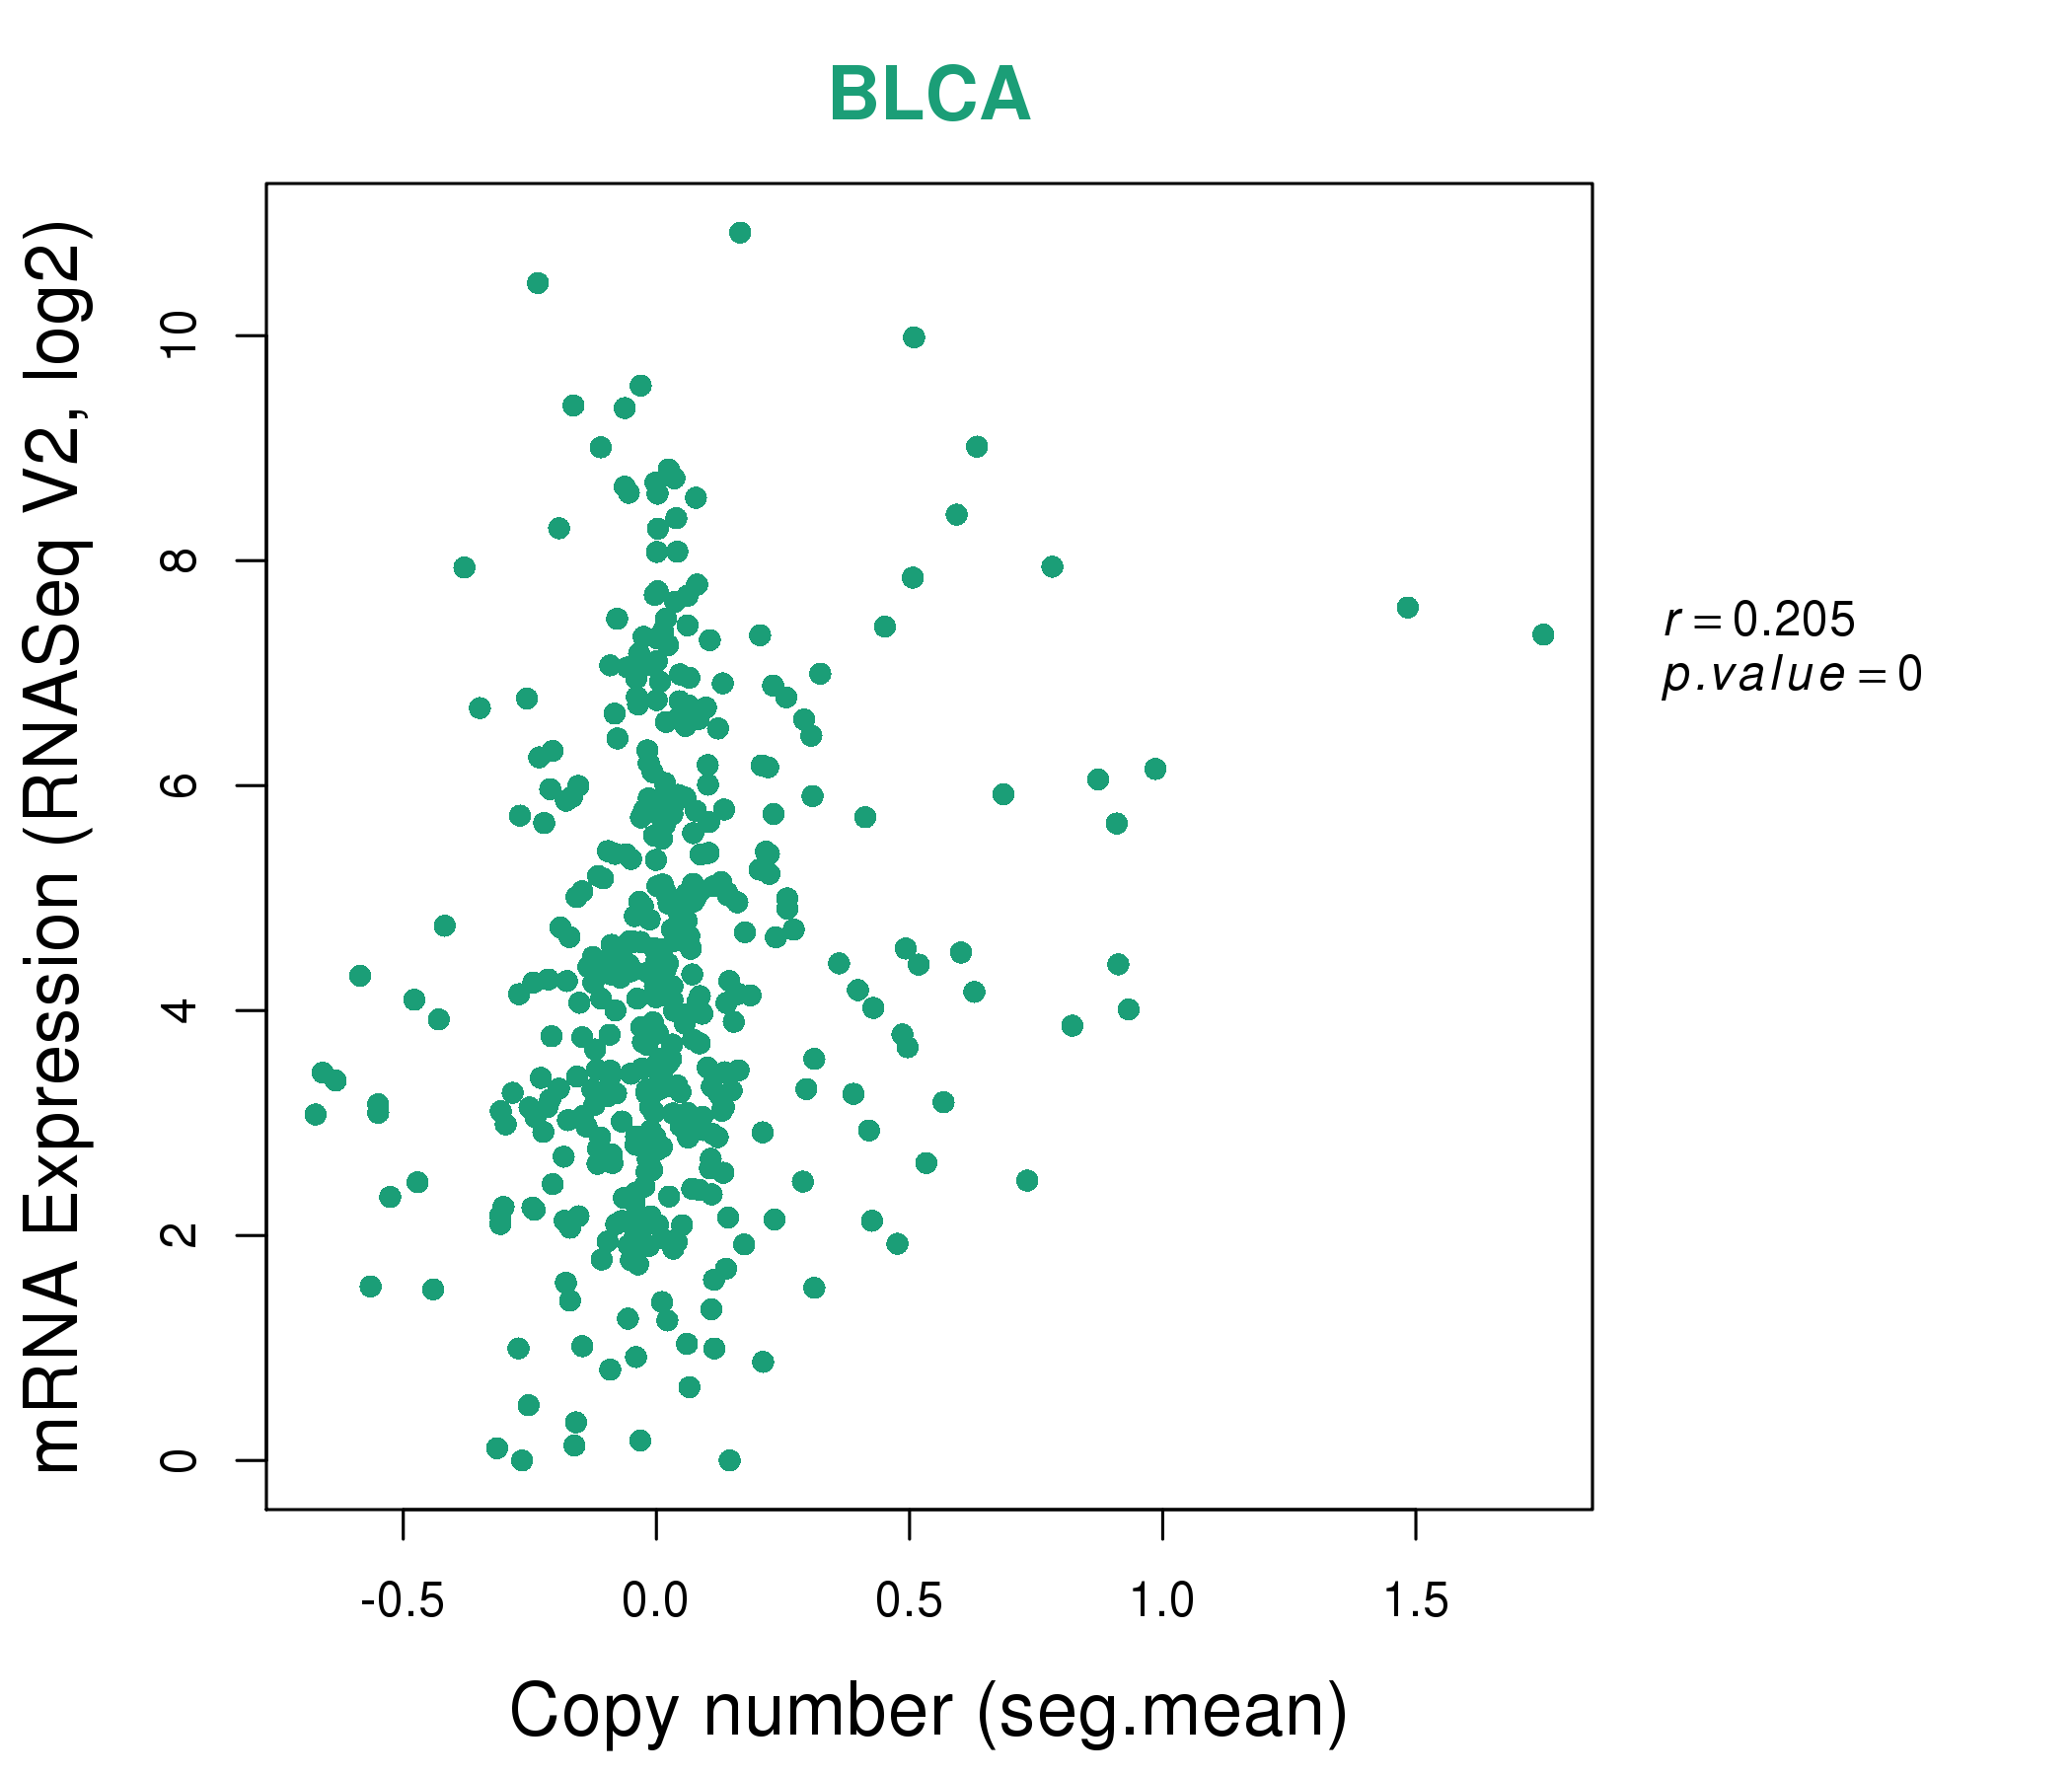
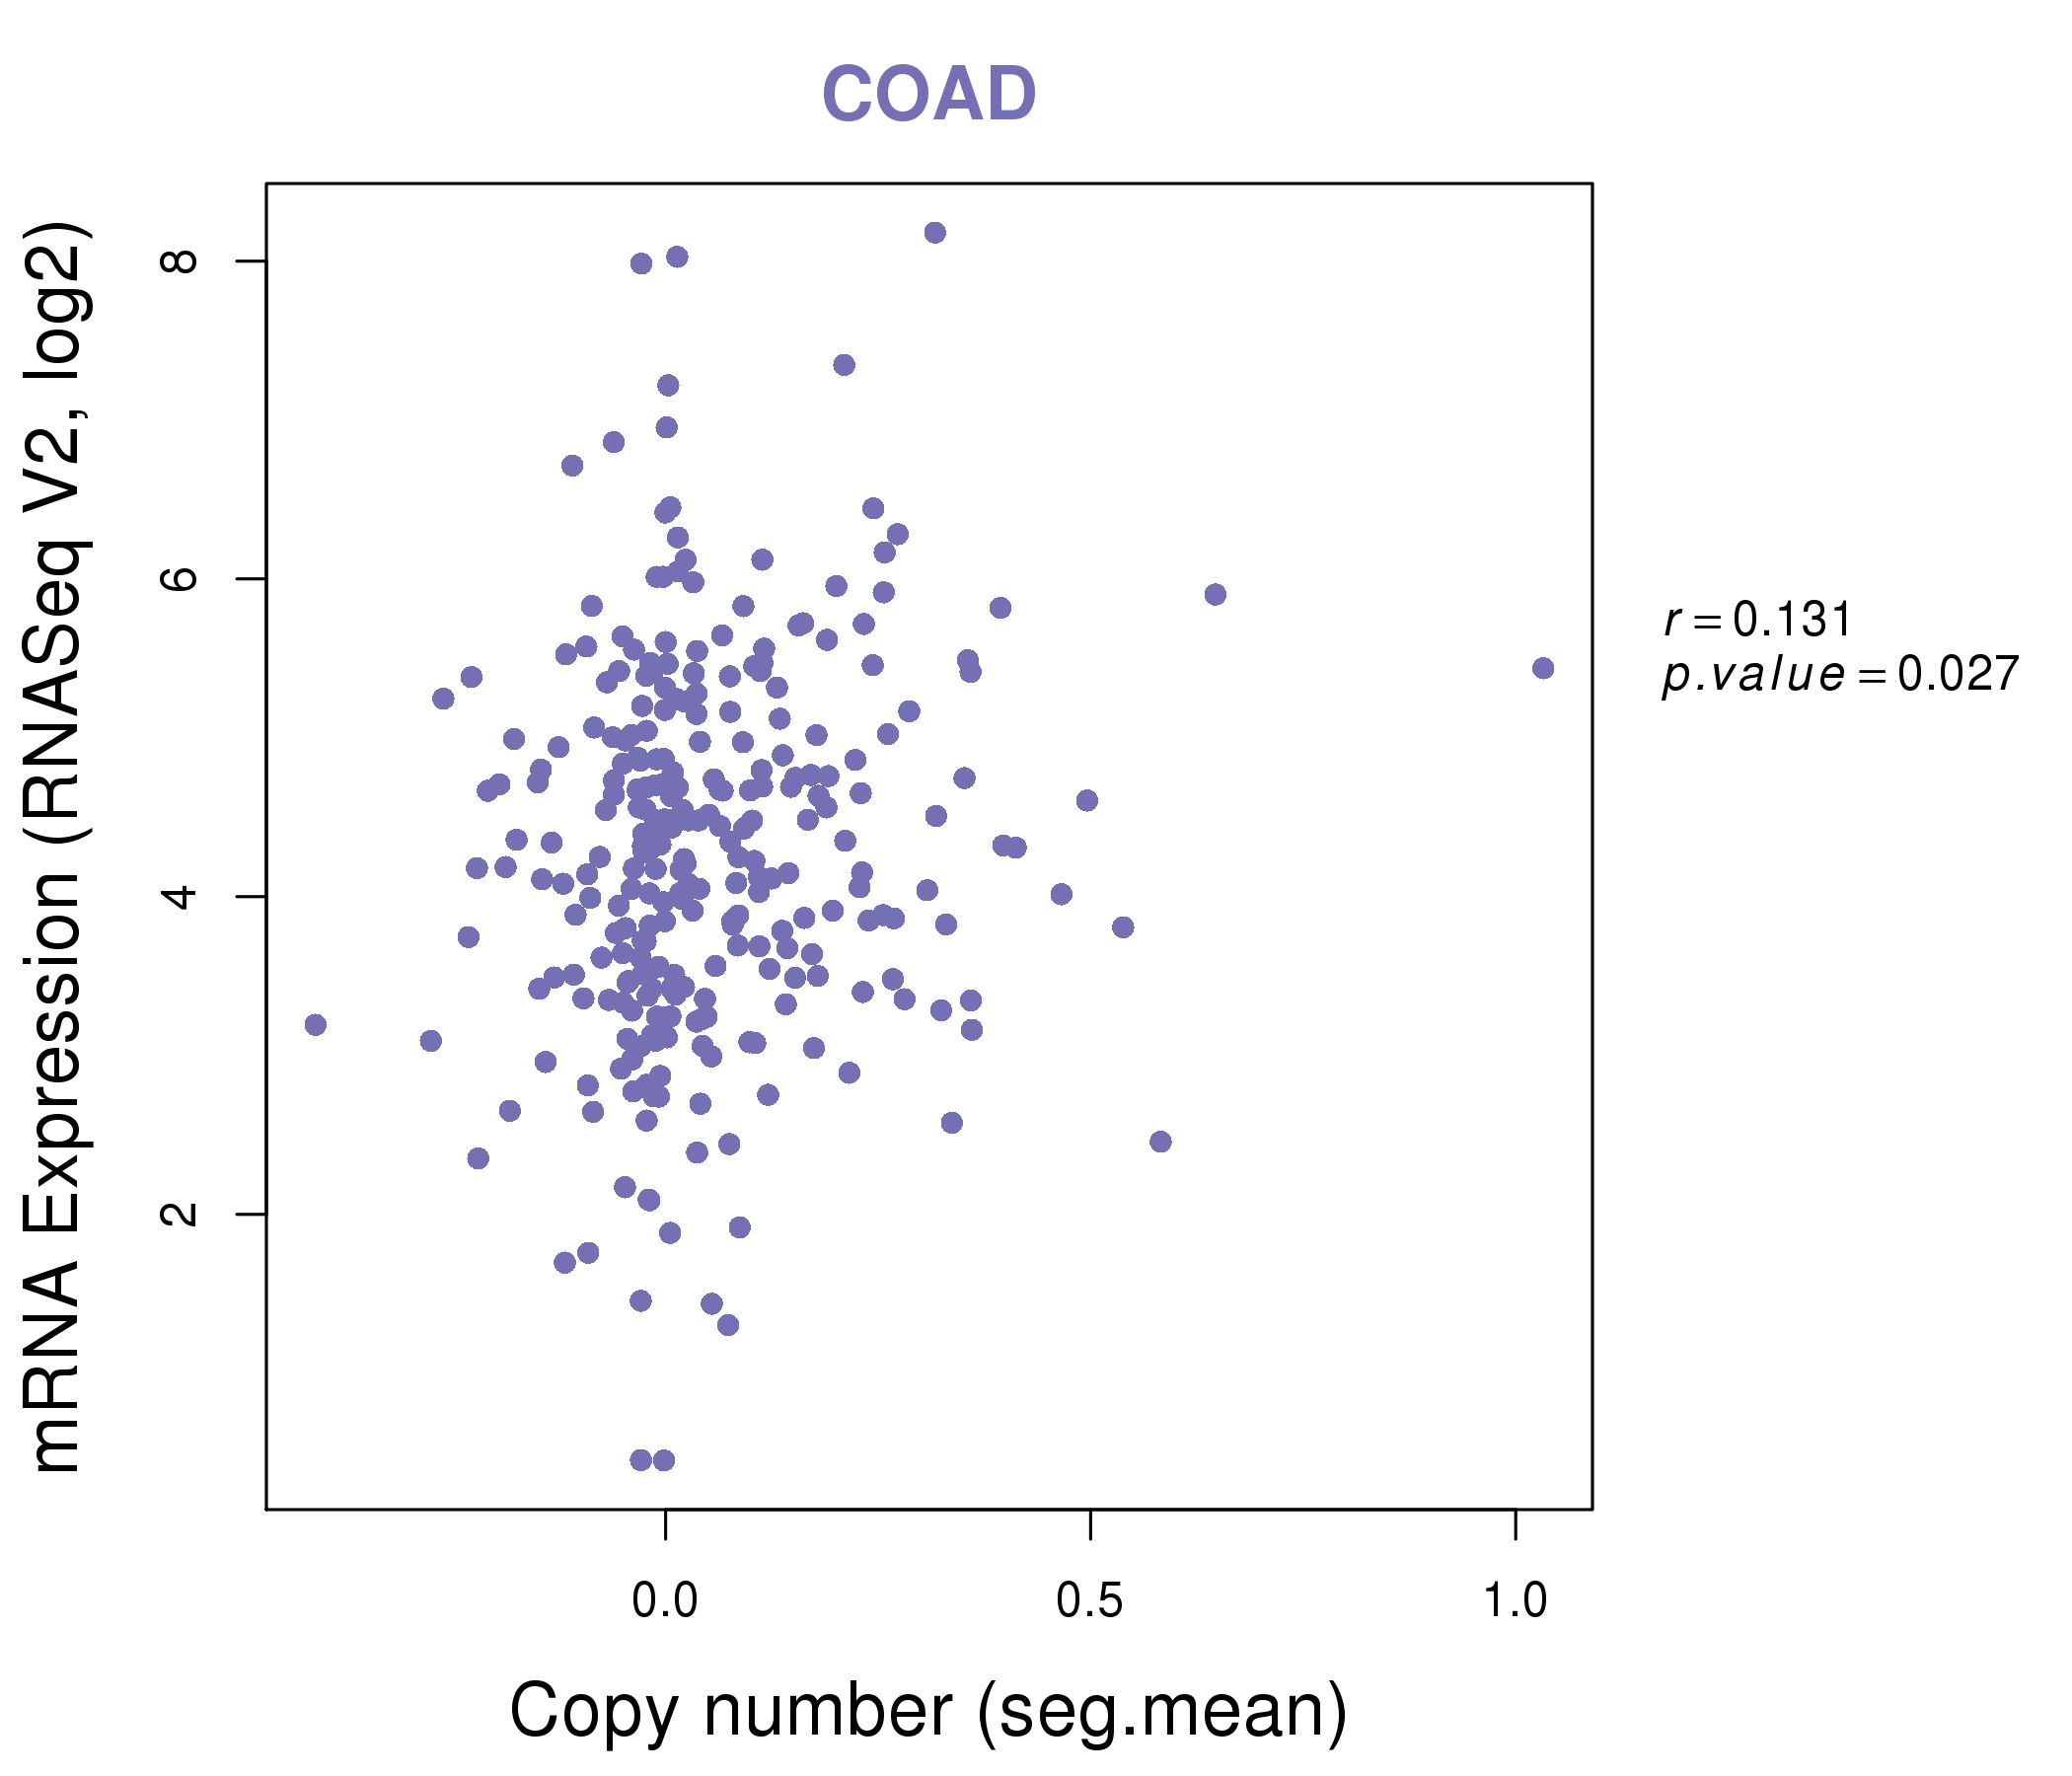
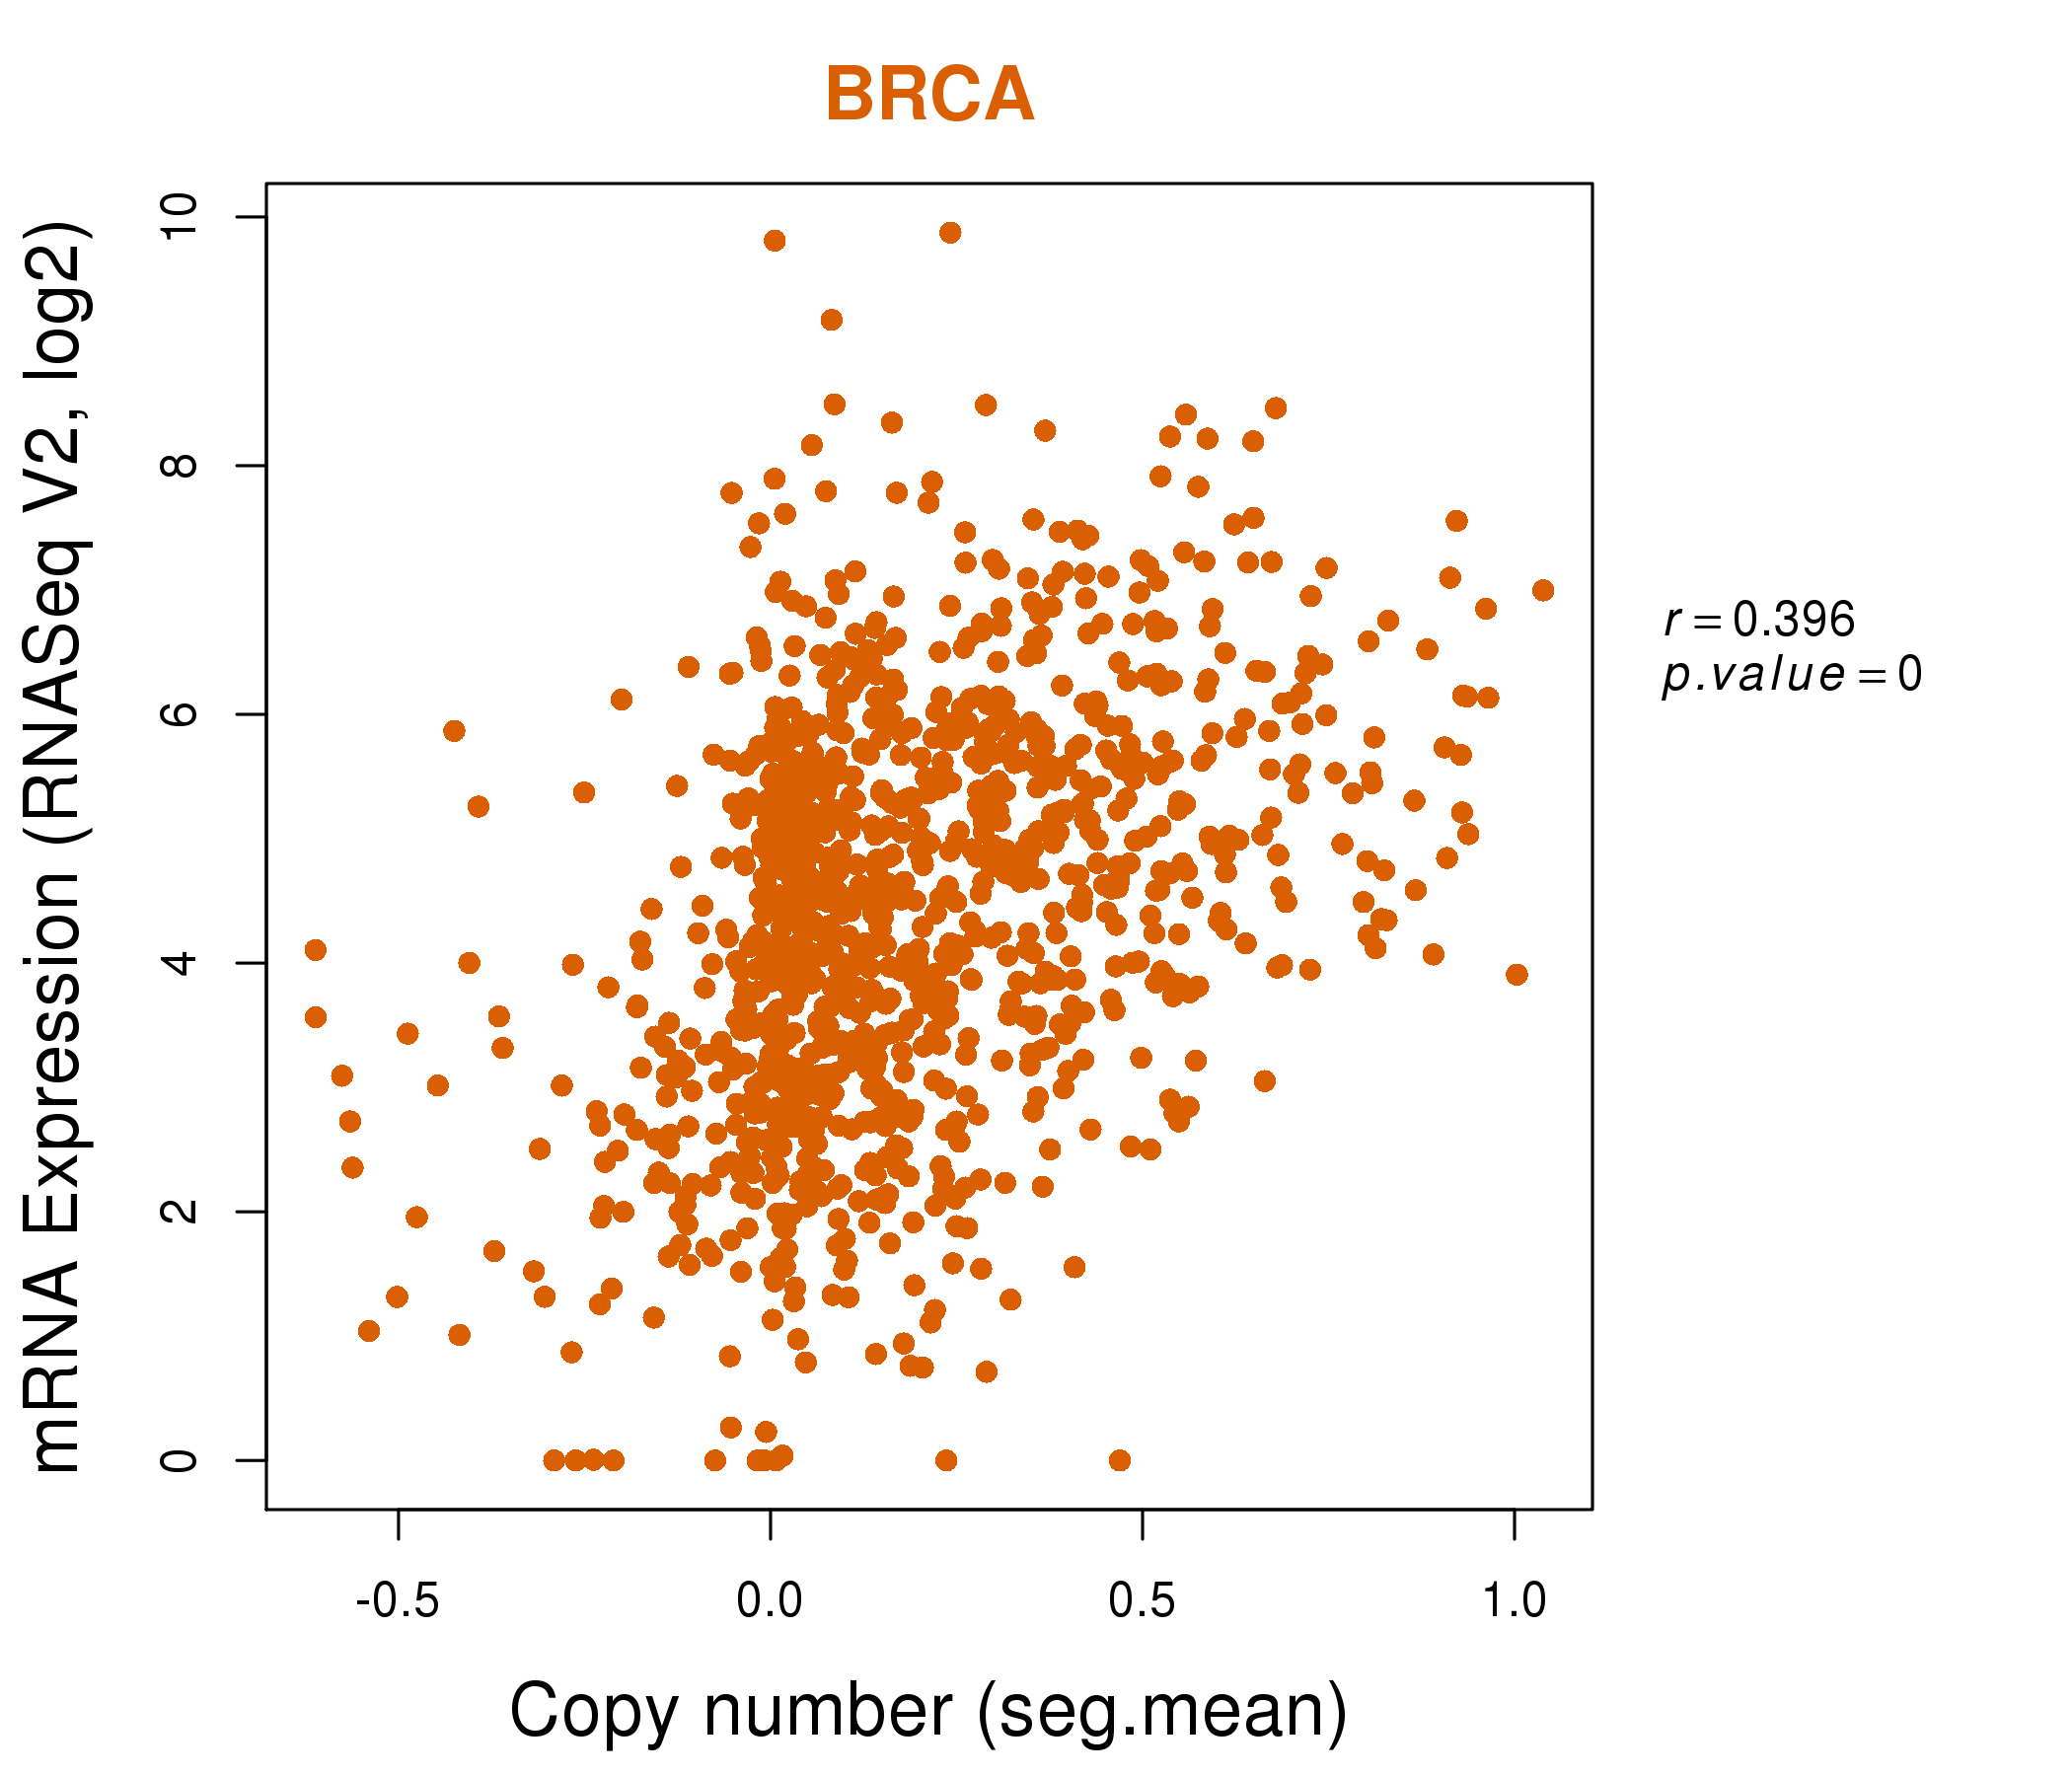
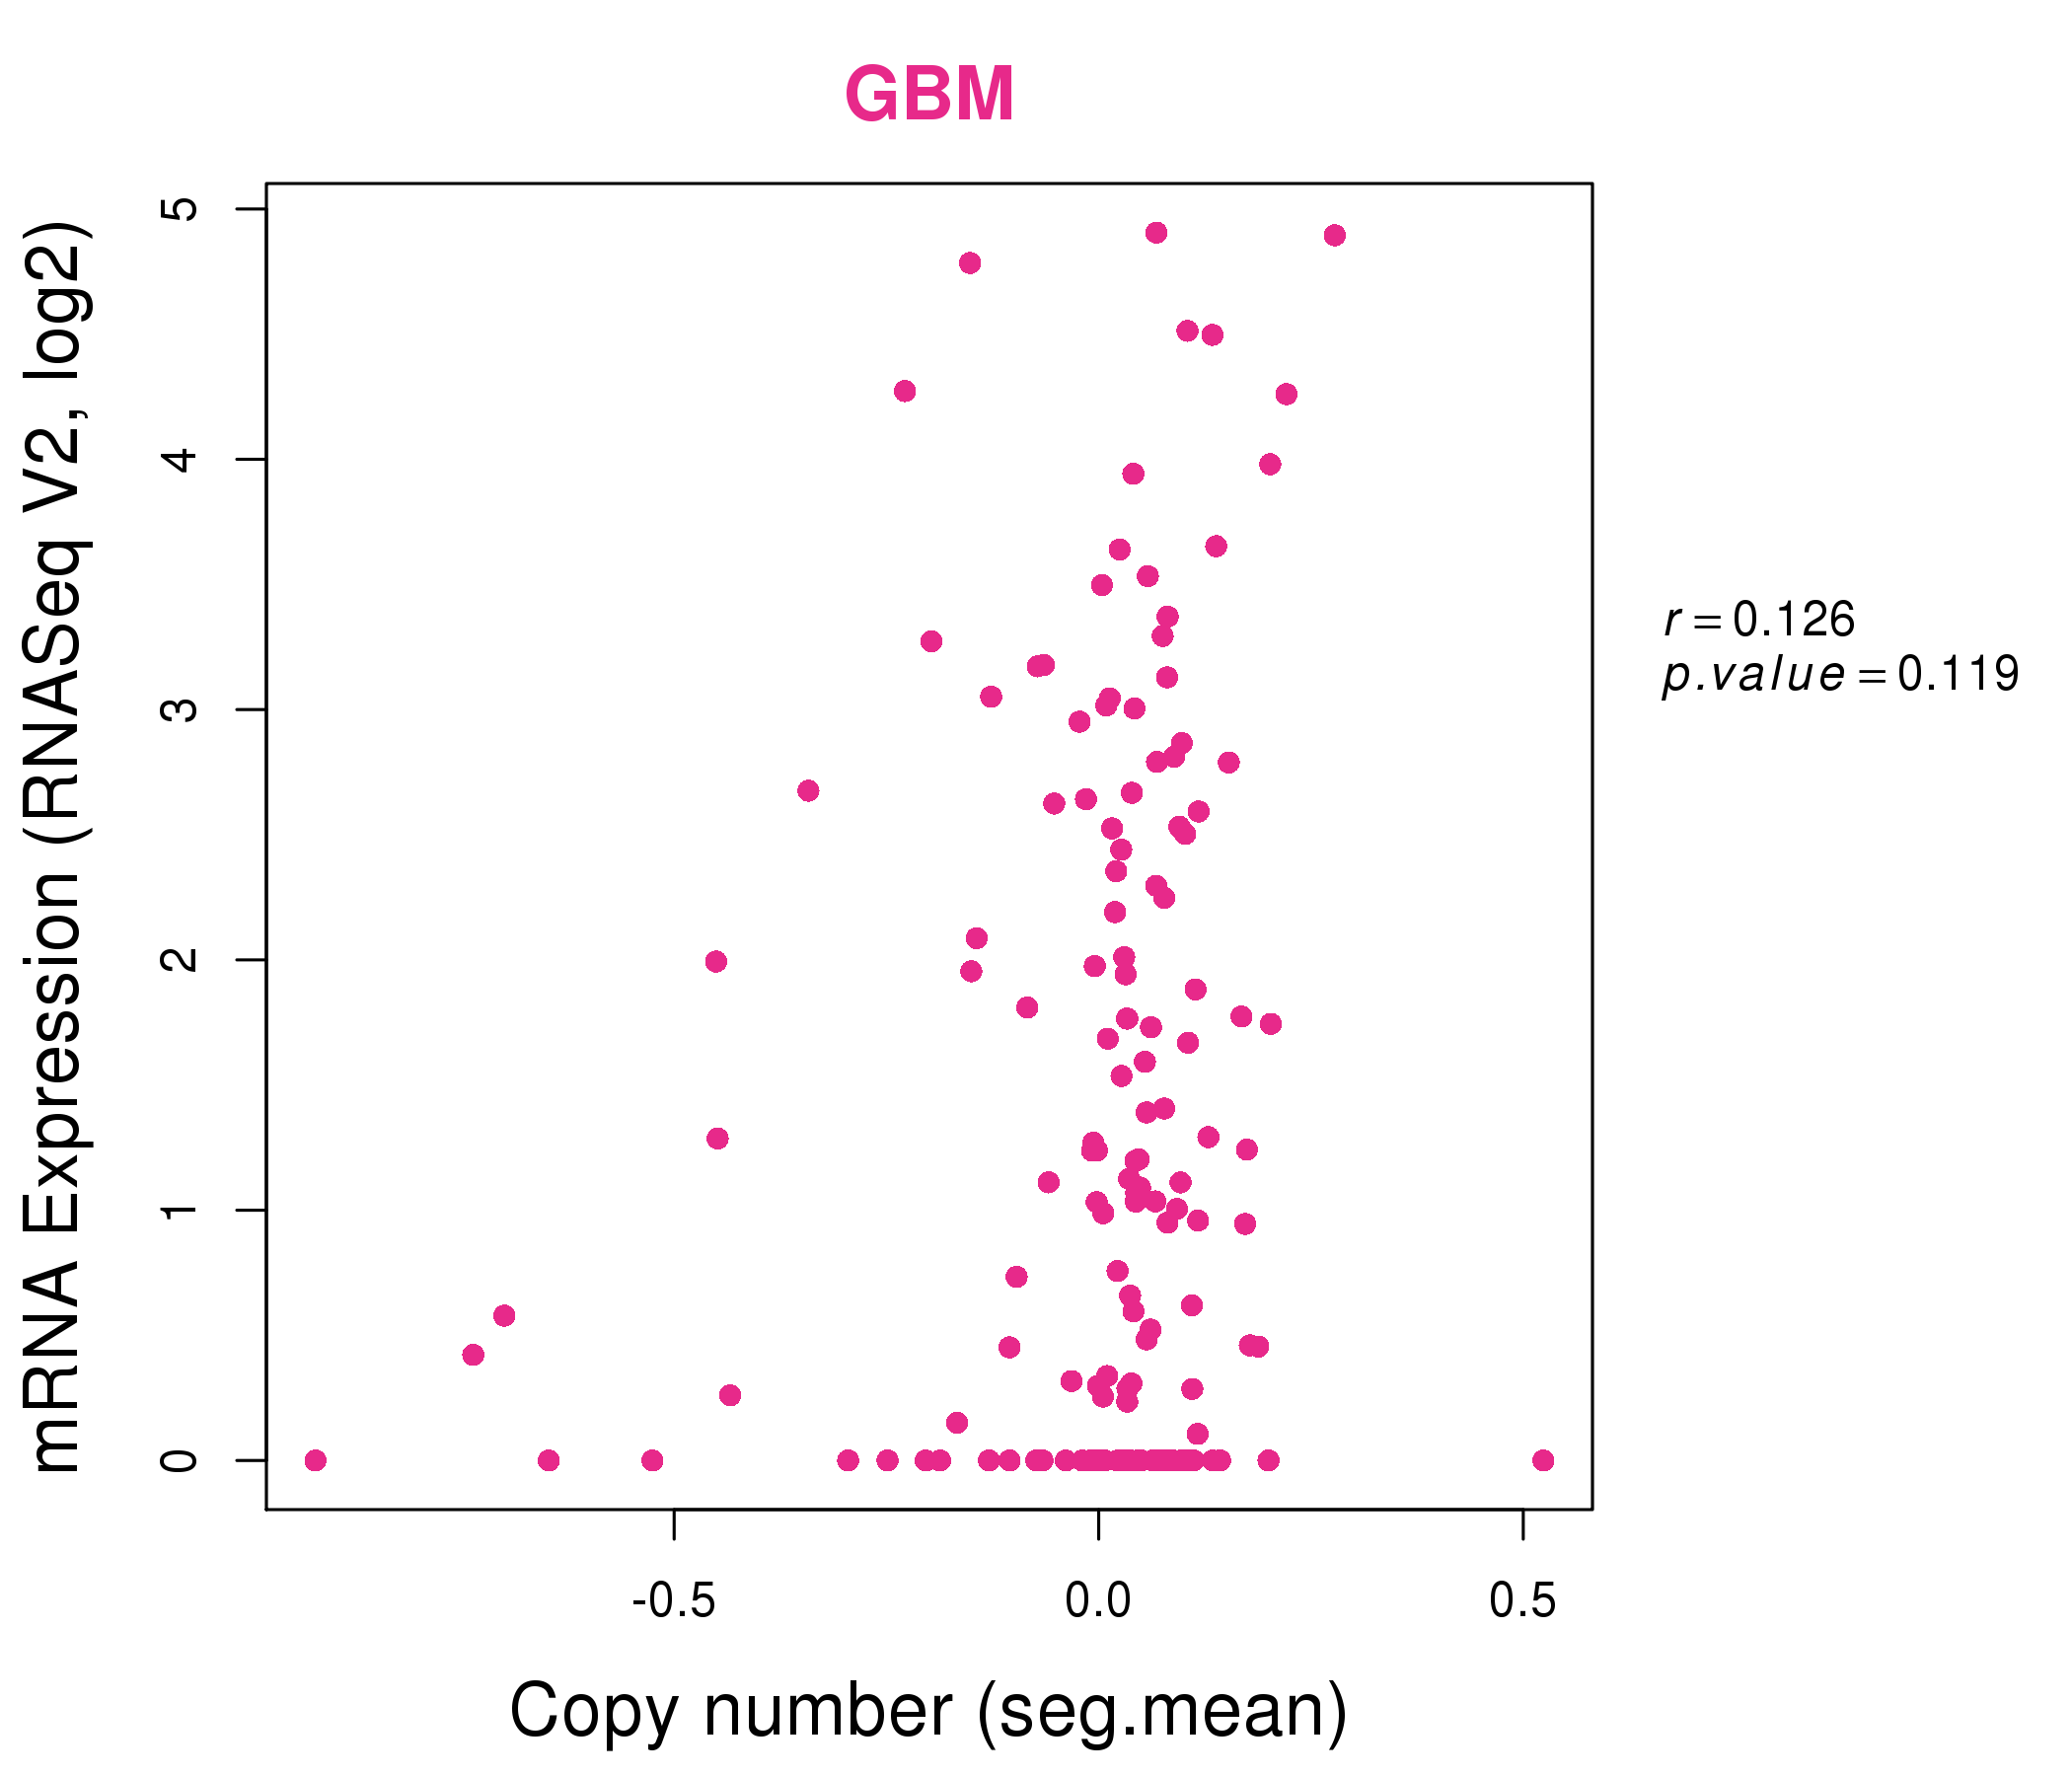
| * This plots show the correlation between CNV and gene expression. |
: Open all plots for all cancer types
 |
|
 |
|
| Top |
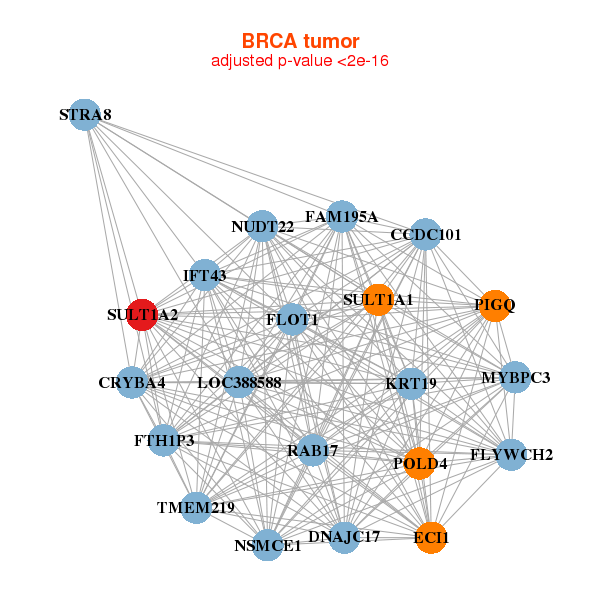
| Gene-Gene Network Information |
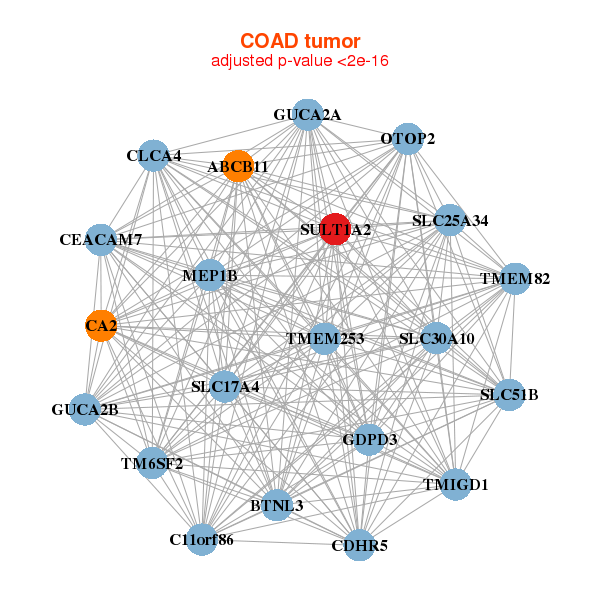
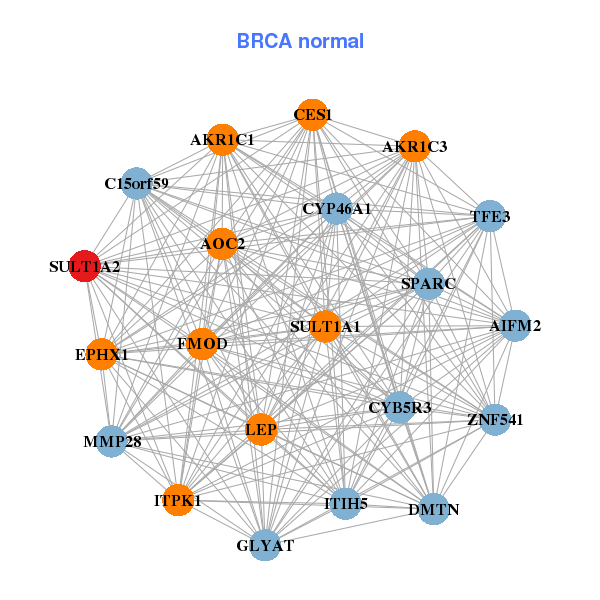
| * Co-Expression network figures were drawn using R package igraph. Only the top 20 genes with the highest correlations were shown. Red circle: input gene, orange circle: cell metabolism gene, sky circle: other gene |
: Open all plots for all cancer types
 |
| ||||
| IFT43,CCDC101,CRYBA4,ECI1,DNAJC17,FAM195A,FLOT1, FLYWCH2,FTH1P3,KRT19,LOC388588,MYBPC3,NSMCE1,NUDT22, PIGQ,POLD4,RAB17,STRA8,SULT1A1,SULT1A2,TMEM219 | AIFM2,AKR1C1,AKR1C3,AOC2,C15orf59,CES1,CYB5R3, CYP46A1,DMTN,EPHX1,FMOD,GLYAT,ITIH5,ITPK1, LEP,MMP28,SPARC,SULT1A1,SULT1A2,TFE3,ZNF541 | ||||
 |
| ||||
| ABCB11,BTNL3,C11orf86,TMEM253,CA2,CDHR5,CEACAM7, CLCA4,GDPD3,GUCA2A,GUCA2B,MEP1B,SLC51B,OTOP2, SLC17A4,SLC25A34,SLC30A10,SULT1A2,TM6SF2,TMEM82,TMIGD1 | ABHD12,LRRC75A,C1orf115,CDC14A,CLRN3,DHRS11,EPS8L2, FAM132A,GCOM1,GDPD2,MEP1A,PDXP,RBKS,RHOU, SEPHS2,SLC9A3R1,SULT1A2,TMEM120A,TMEM82,TMIGD1,USH1C |
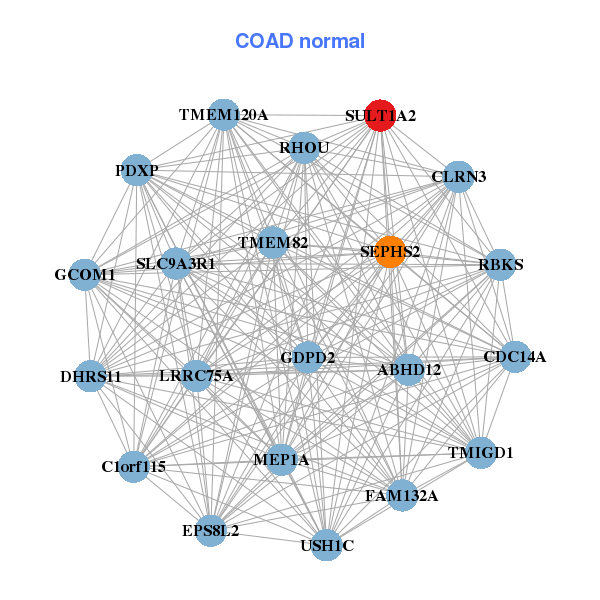
| * Co-Expression network figures were drawn using R package igraph. Only the top 20 genes with the highest correlations were shown. Red circle: input gene, orange circle: cell metabolism gene, sky circle: other gene |
: Open all plots for all cancer types
| Top |
: Open all interacting genes' information including KEGG pathway for all interacting genes from DAVID
| Top |
| Pharmacological Information for SULT1A2 |
| DB Category | DB Name | DB's ID and Url link |
| * Gene Centered Interaction Network. |
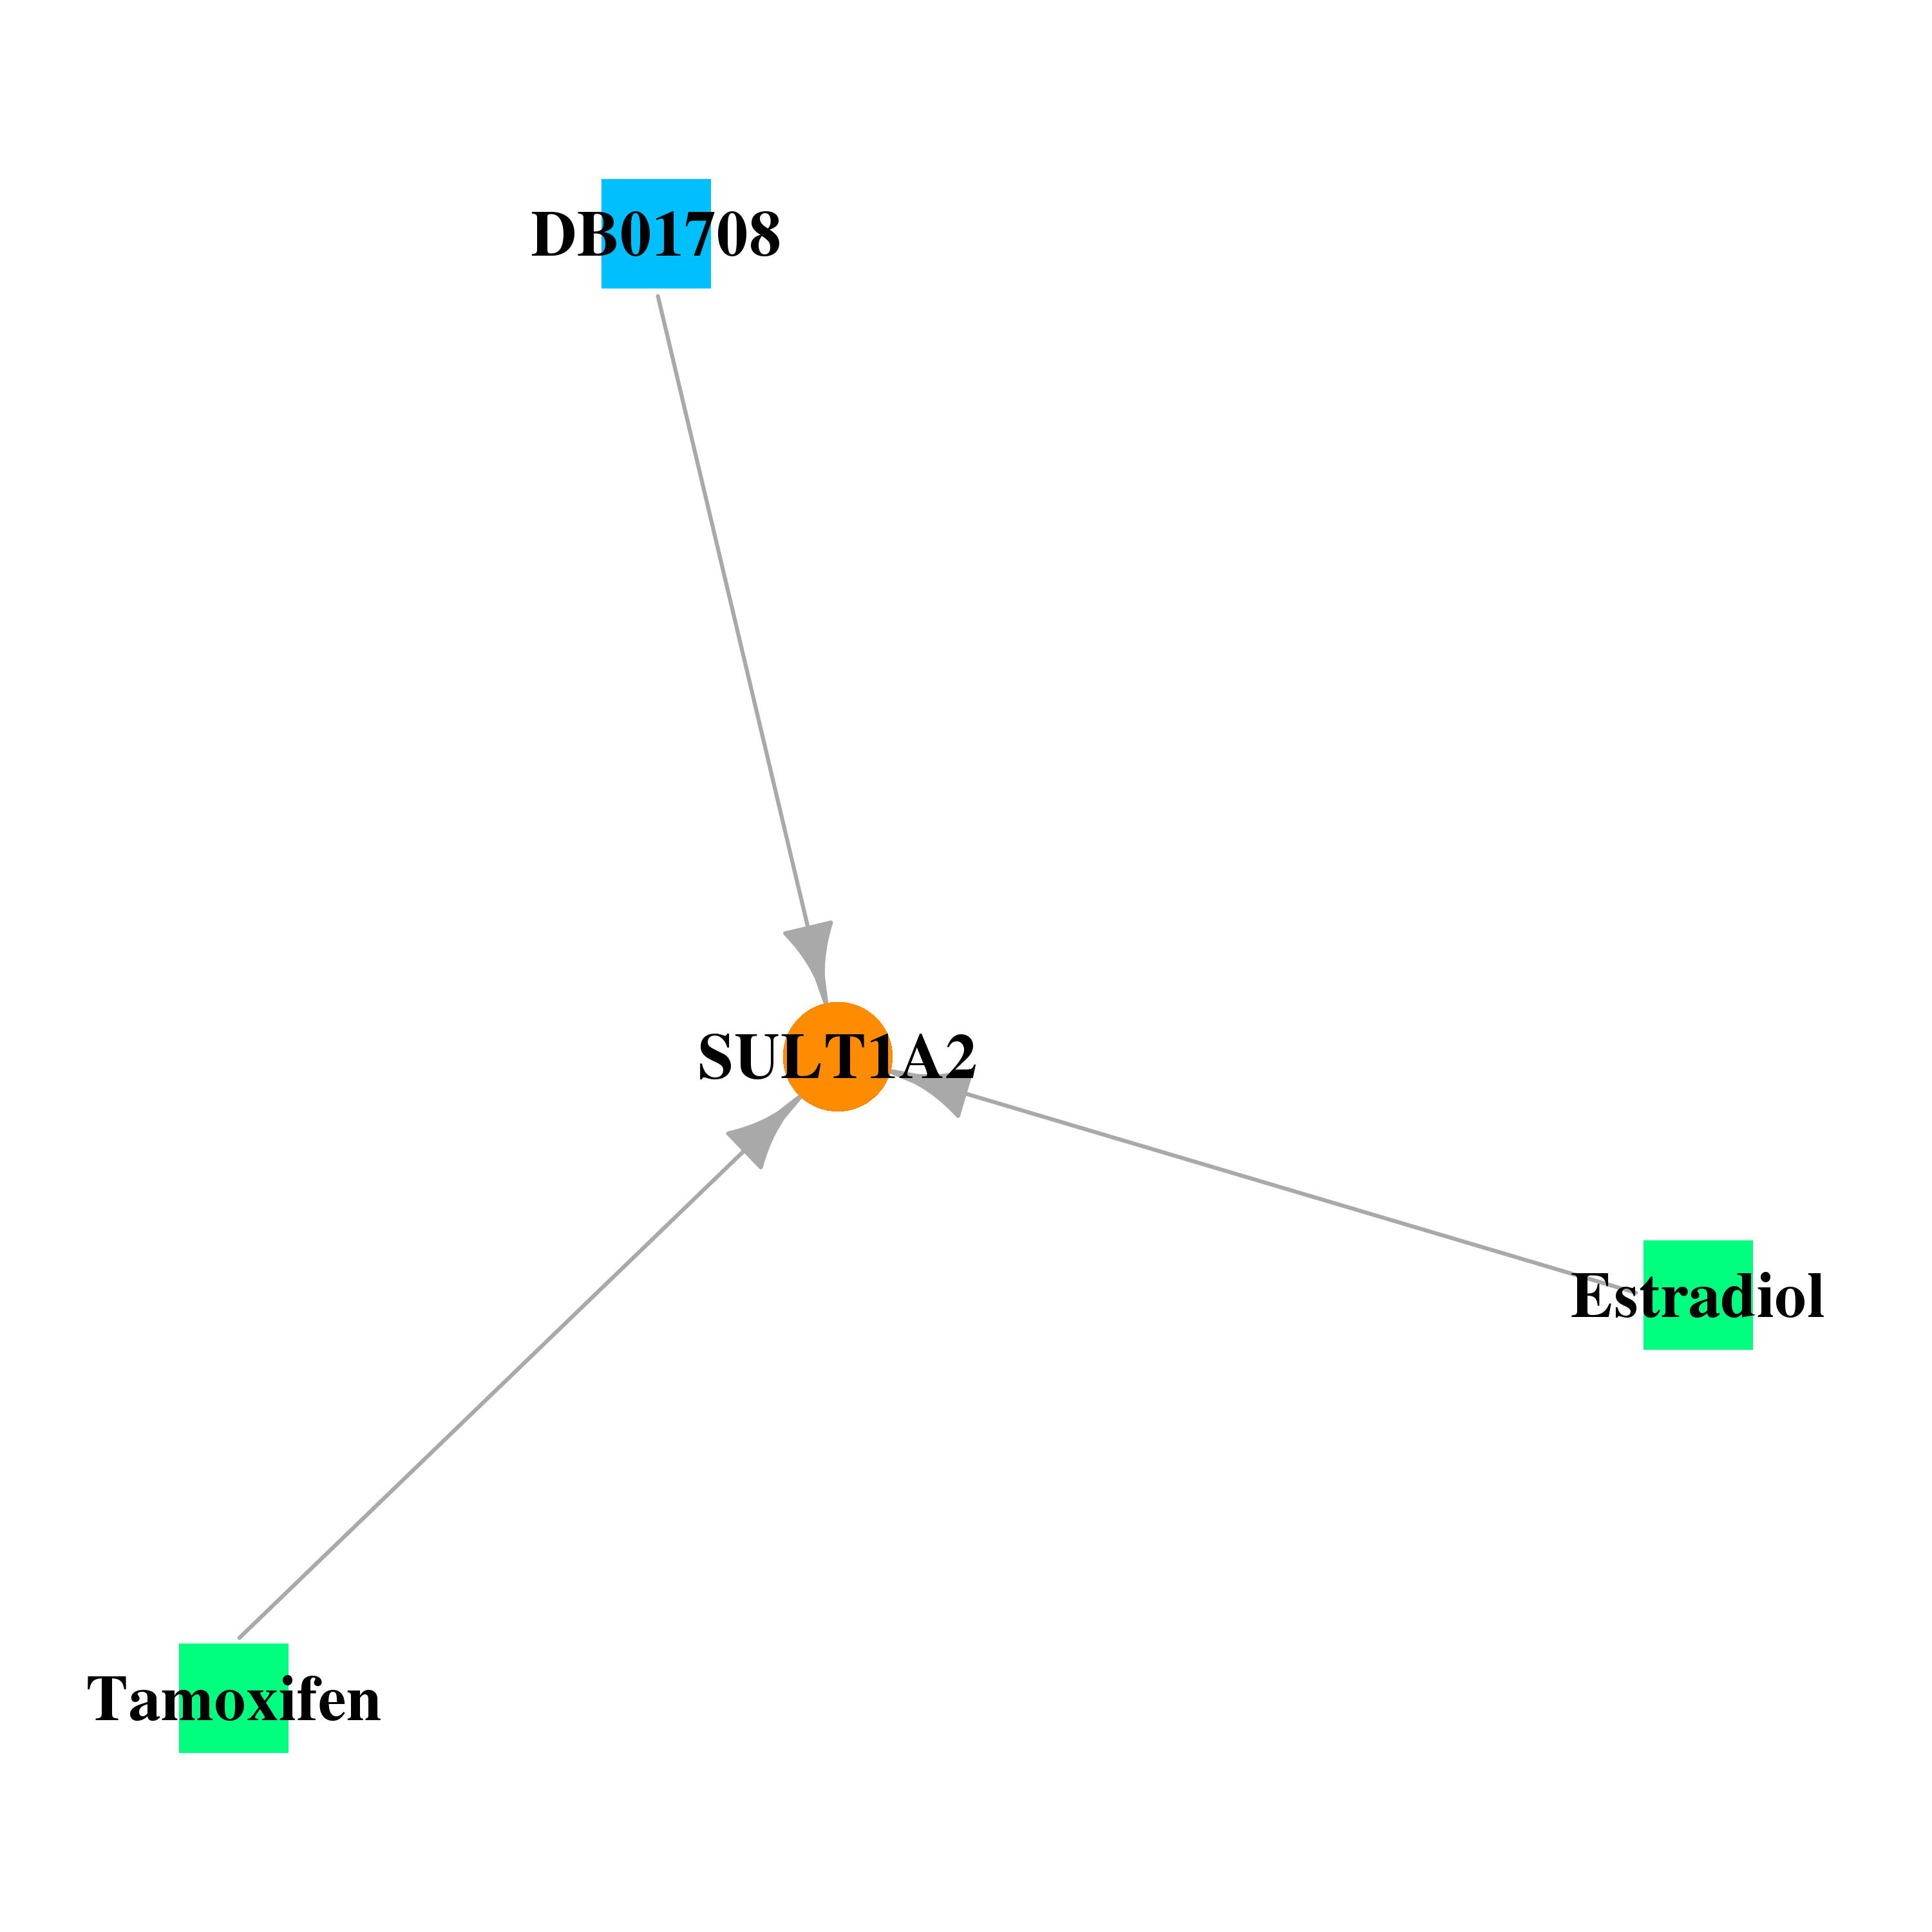 |
| * Drug Centered Interaction Network. |
| DrugBank ID | Target Name | Drug Groups | Generic Name | Drug Centered Network | Drug Structure |
| DB01708 | sulfotransferase family, cytosolic, 1A, phenol-preferring, member 2 | nutraceutical | Dehydroepiandrosterone | 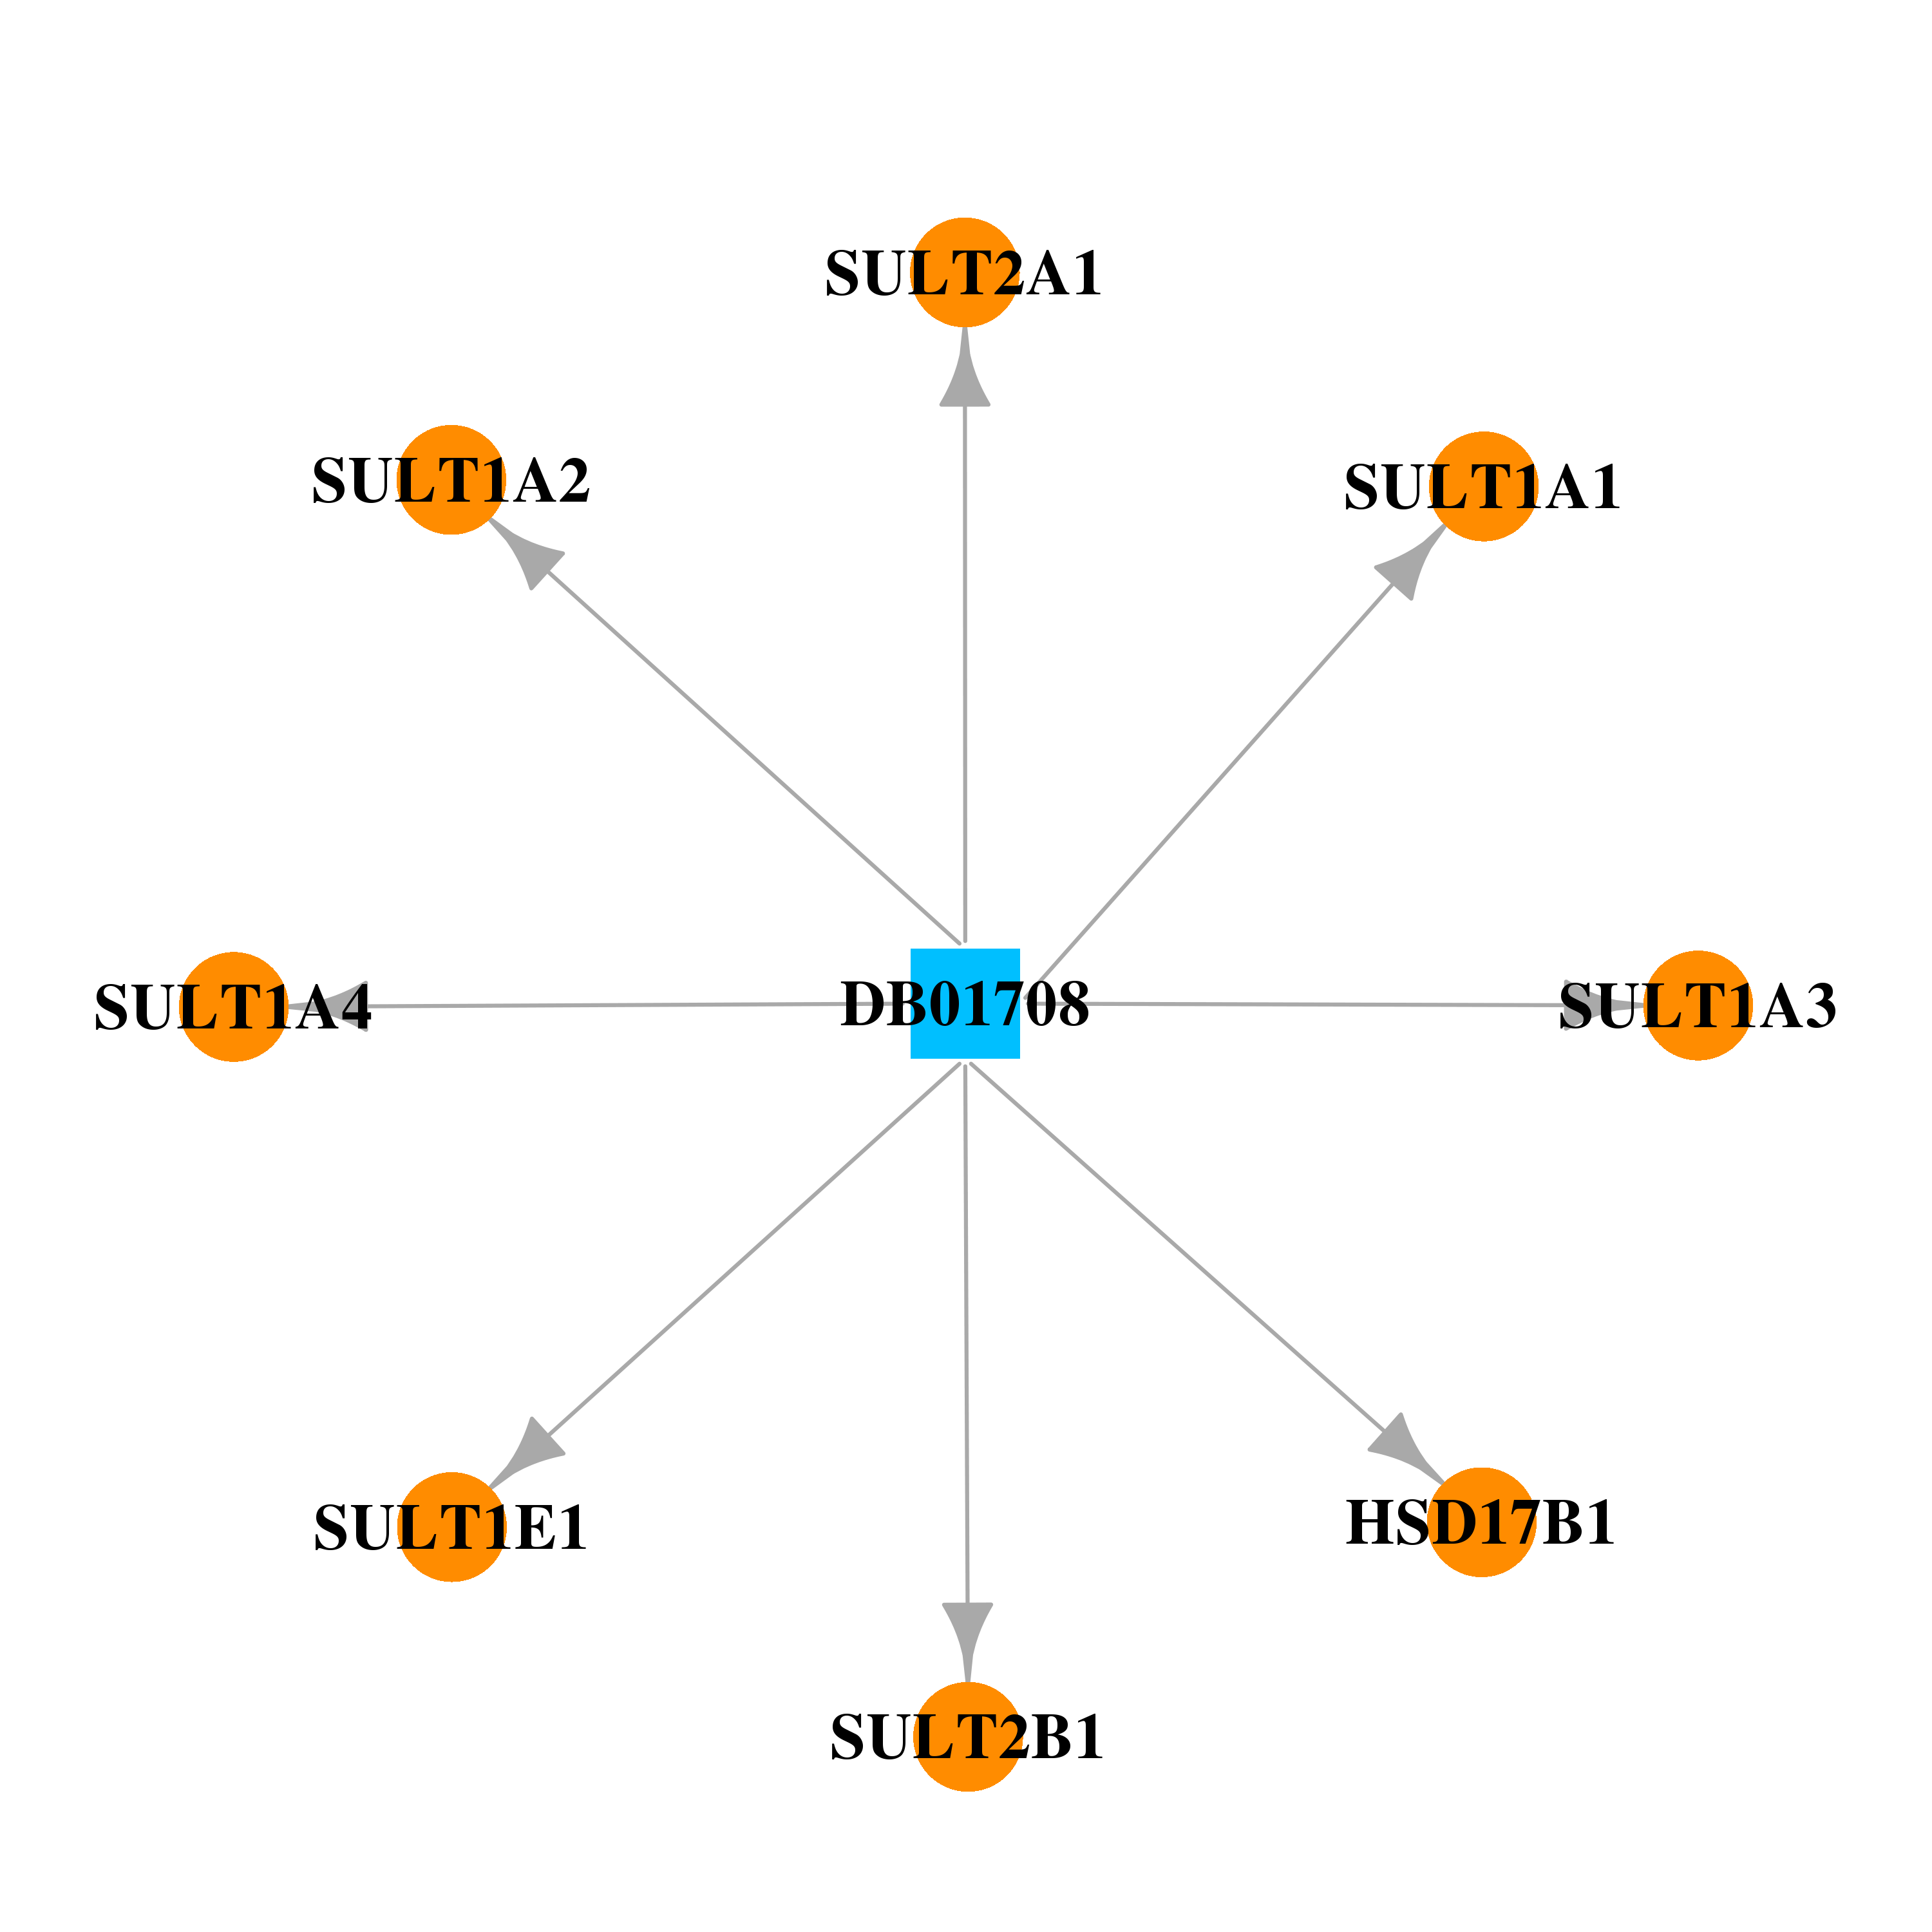 |  |
| DB00783 | sulfotransferase family, cytosolic, 1A, phenol-preferring, member 2 | approved; investigational | Estradiol | 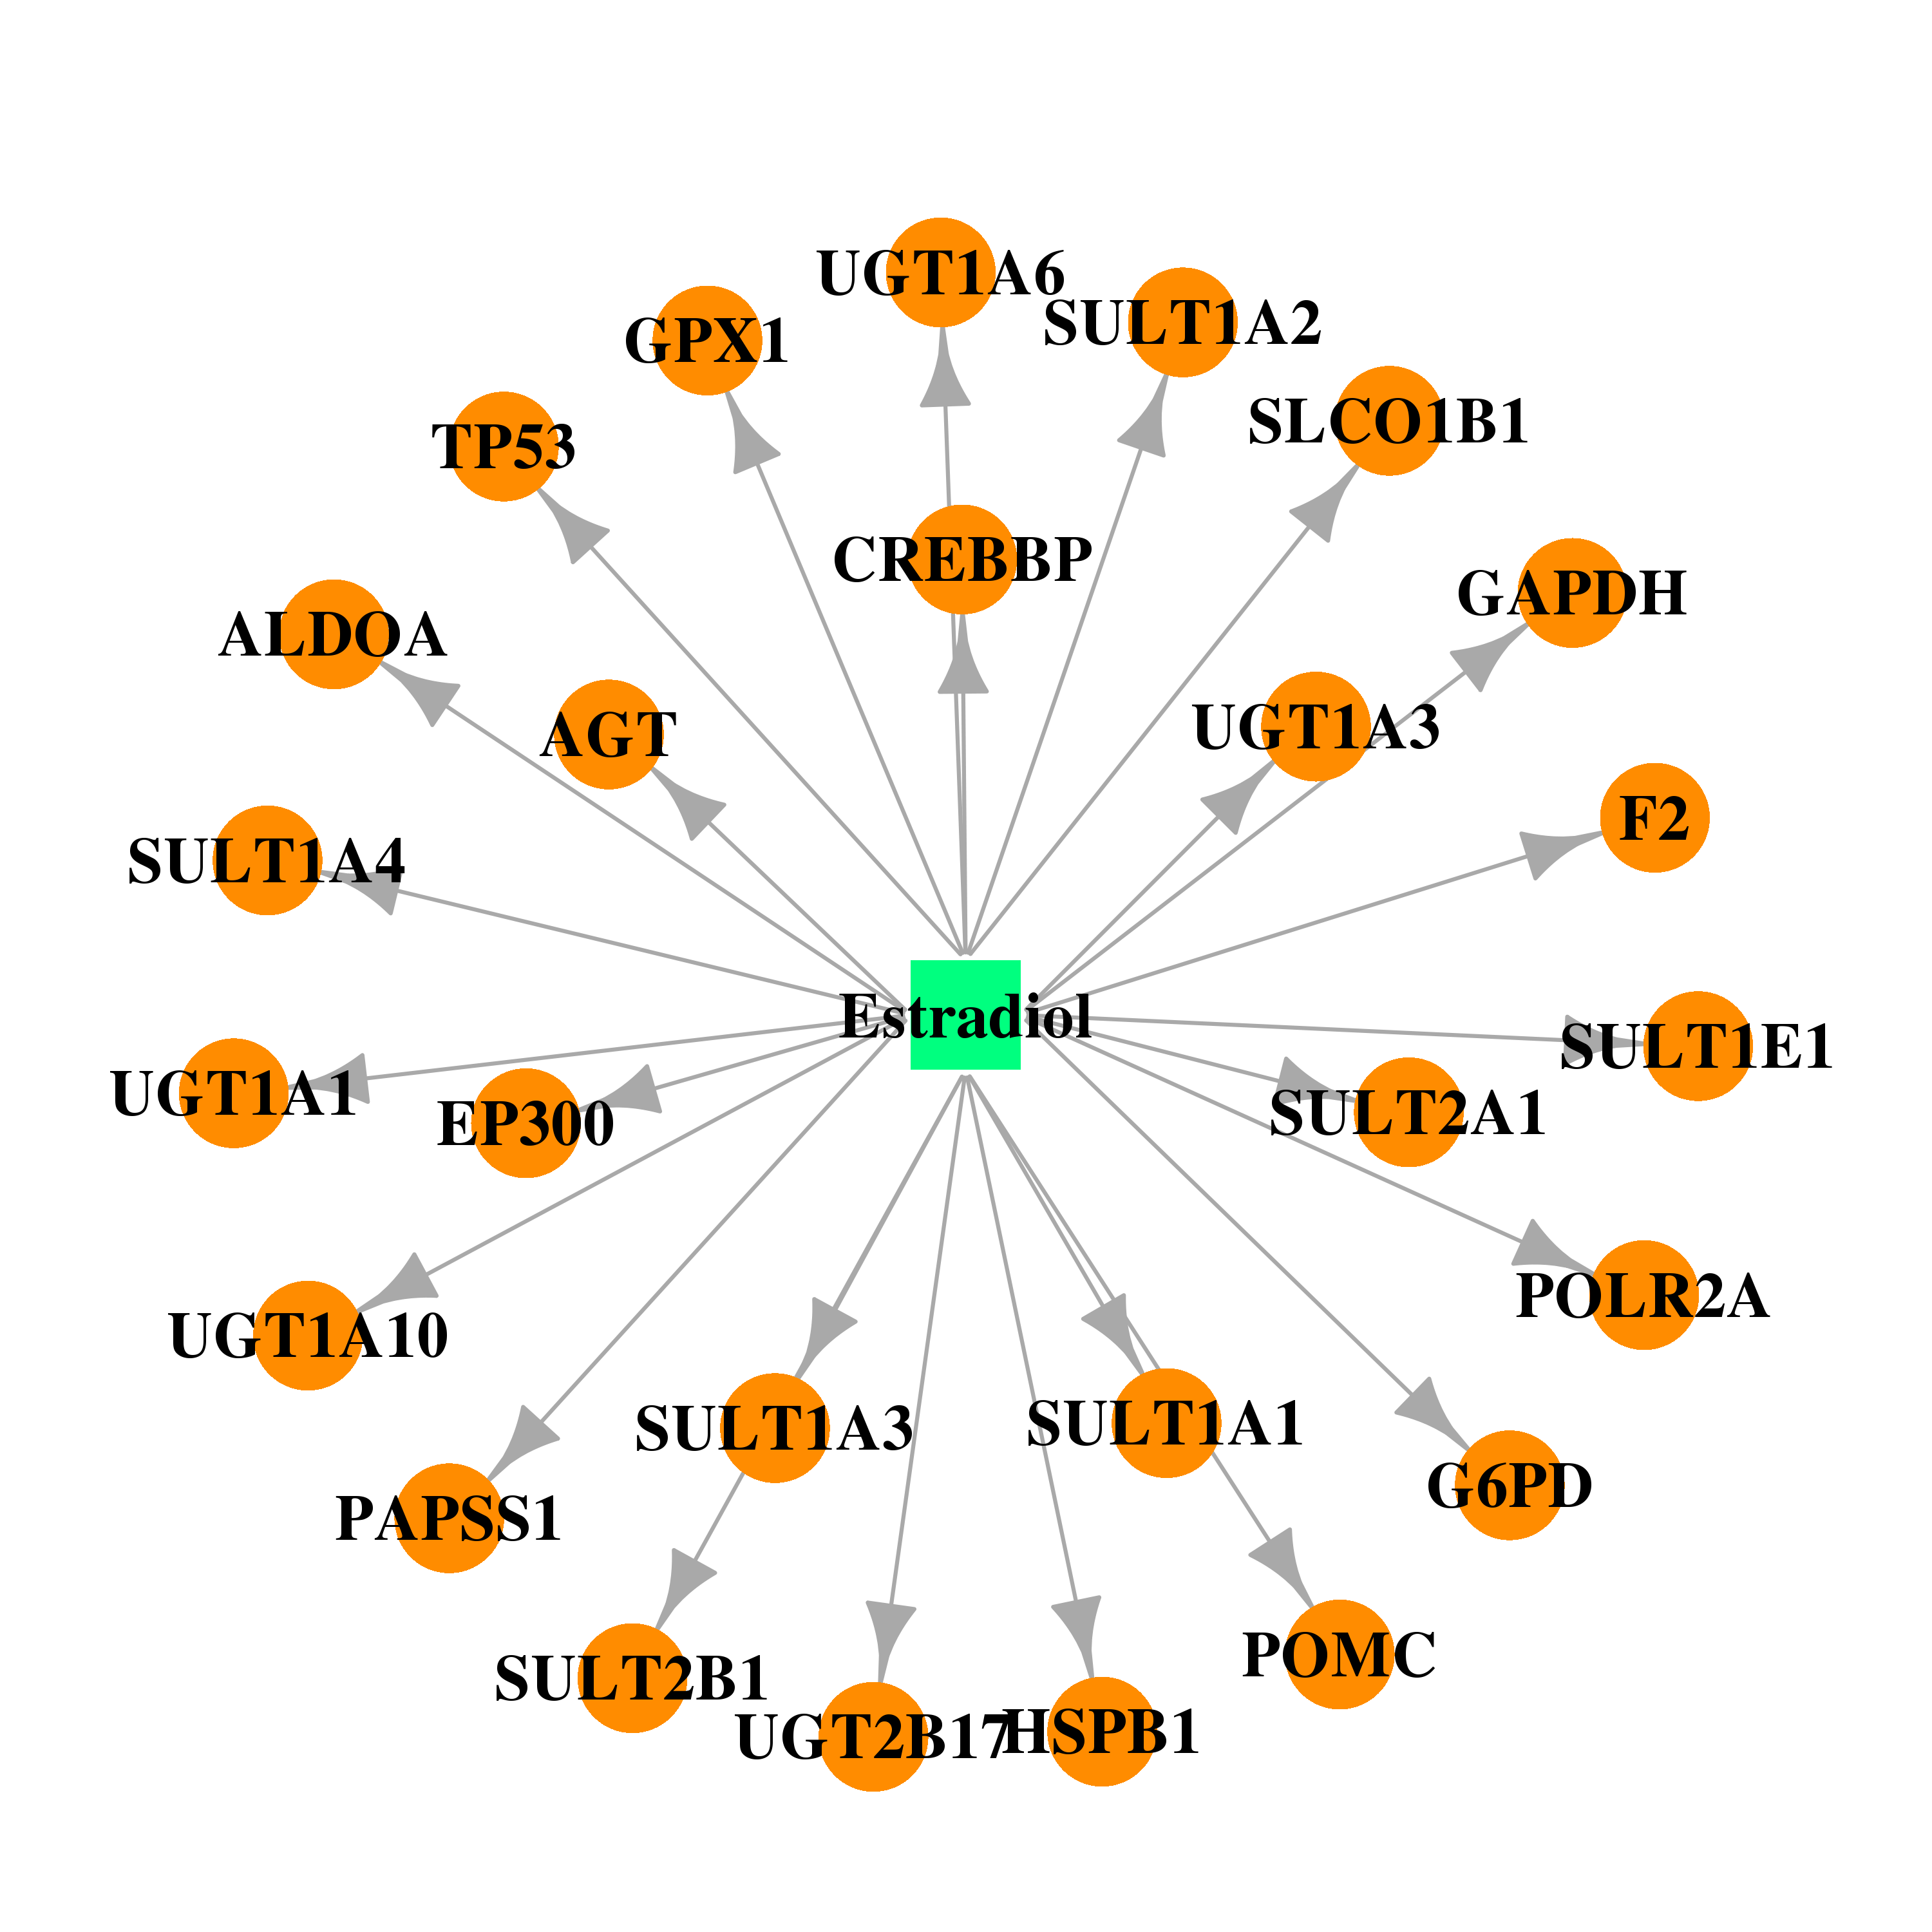 | 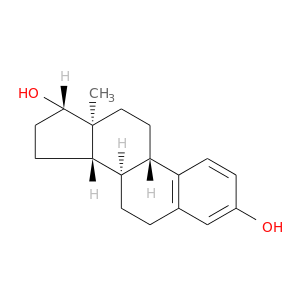 |
| DB00675 | sulfotransferase family, cytosolic, 1A, phenol-preferring, member 2 | approved | Tamoxifen |  |  |
| Top |
| Cross referenced IDs for SULT1A2 |
| * We obtained these cross-references from Uniprot database. It covers 150 different DBs, 18 categories. http://www.uniprot.org/help/cross_references_section |
: Open all cross reference information
|
Copyright © 2016-Present - The Univsersity of Texas Health Science Center at Houston @ |