|
||||||||||||||||||||
| |
| Phenotypic Information (metabolism pathway, cancer, disease, phenome) |
| |
| |
| Gene-Gene Network Information: Co-Expression Network, Interacting Genes & KEGG |
| |
|


| Gene Summary for BSG |
| Basic gene info. | Gene symbol | BSG |
| Gene name | basigin (Ok blood group) | |
| Synonyms | 5F7|CD147|EMMPRIN|M6|OK|TCSF | |
| Cytomap | UCSC genome browser: 19p13.3 | |
| Genomic location | chr19 :572453-583493 | |
| Type of gene | protein-coding | |
| RefGenes | NM_001728.3, NM_198589.2,NM_198590.2,NM_198591.2, | |
| Ensembl id | ENSG00000172270 | |
| Description | CD147 antigenOK blood group antigenbasigincollagenase stimulatory factorextracellular matrix metalloproteinase inducerleukocyte activation antigen M6tumor cell-derived collagenase stimulatory factor | |
| Modification date | 20141222 | |
| dbXrefs | MIM : 109480 | |
| HGNC : HGNC | ||
| Ensembl : ENSG00000172270 | ||
| HPRD : 00176 | ||
| Vega : OTTHUMG00000177718 | ||
| Protein | UniProt: P35613 go to UniProt's Cross Reference DB Table | |
| Expression | CleanEX: HS_BSG | |
| BioGPS: 682 | ||
| Gene Expression Atlas: ENSG00000172270 | ||
| The Human Protein Atlas: ENSG00000172270 | ||
| Pathway | NCI Pathway Interaction Database: BSG | |
| KEGG: BSG | ||
| REACTOME: BSG | ||
| ConsensusPathDB | ||
| Pathway Commons: BSG | ||
| Metabolism | MetaCyc: BSG | |
| HUMANCyc: BSG | ||
| Regulation | Ensembl's Regulation: ENSG00000172270 | |
| miRBase: chr19 :572,453-583,493 | ||
| TargetScan: NM_001728 | ||
| cisRED: ENSG00000172270 | ||
| Context | iHOP: BSG | |
| cancer metabolism search in PubMed: BSG | ||
| UCL Cancer Institute: BSG | ||
| Assigned class in ccmGDB | A - This gene has a literature evidence and it belongs to cancer gene. | |
| References showing role of BSG in cancer cell metabolism | 1. Marchiq I, Le Floch R, Roux D, Simon MP, Pouyssegur J (2015) Genetic disruption of lactate/H+ symporters (MCTs) and their subunit CD147/BASIGIN sensitizes glycolytic tumor cells to phenformin. Cancer Res 75: 171-180. doi: 10.1158/0008-5472.CAN-14-2260. go to article 2. Granja S, Marchiq I, Le Floch R, Moura CS, Baltazar F, et al. (2015) Disruption of BASIGIN decreases lactic acid export and sensitizes non-small cell lung cancer to biguanides independently of the LKB1 status. Oncotarget 6: 6708-6721. pmid: 4466644. go to article | |
| Top |
| Phenotypic Information for BSG(metabolism pathway, cancer, disease, phenome) |
| Cancer | CGAP: BSG |
| Familial Cancer Database: BSG | |
| * This gene is included in those cancer gene databases. |
|
|
|
|
|
|
| ||||||||||||||
Oncogene 1 | Significant driver gene in | |||||||||||||||||||
| cf) number; DB name 1 Oncogene; http://nar.oxfordjournals.org/content/35/suppl_1/D721.long, 2 Tumor Suppressor gene; https://bioinfo.uth.edu/TSGene/, 3 Cancer Gene Census; http://www.nature.com/nrc/journal/v4/n3/abs/nrc1299.html, 4 CancerGenes; http://nar.oxfordjournals.org/content/35/suppl_1/D721.long, 5 Network of Cancer Gene; http://ncg.kcl.ac.uk/index.php, 1Therapeutic Vulnerabilities in Cancer; http://cbio.mskcc.org/cancergenomics/statius/ |
| REACTOME_PYRUVATE_METABOLISM_AND_CITRIC_ACID_TCA_CYCLE REACTOME_PYRUVATE_METABOLISM | |
| OMIM | 109480; gene. 111380; phenotype. |
| Orphanet | |
| Disease | KEGG Disease: BSG |
| MedGen: BSG (Human Medical Genetics with Condition) | |
| ClinVar: BSG | |
| Phenotype | MGI: BSG (International Mouse Phenotyping Consortium) |
| PhenomicDB: BSG | |
| Mutations for BSG |
| * Under tables are showing count per each tissue to give us broad intuition about tissue specific mutation patterns.You can go to the detailed page for each mutation database's web site. |
| There's no structural variation information in COSMIC data for this gene. |
| * From mRNA Sanger sequences, Chitars2.0 arranged chimeric transcripts. This table shows BSG related fusion information. |
| ID | Head Gene | Tail Gene | Accession | Gene_a | qStart_a | qEnd_a | Chromosome_a | tStart_a | tEnd_a | Gene_a | qStart_a | qEnd_a | Chromosome_a | tStart_a | tEnd_a |
| BP379102 | ACTB | 1 | 419 | 7 | 5568820 | 5570232 | BSG | 419 | 568 | 19 | 580716 | 581397 | |
| DA210402 | BSG | 1 | 328 | 19 | 572596 | 580441 | SLC1A3 | 329 | 555 | 5 | 36686310 | 36686536 | |
| XX000018 | BSG | 1 | 83 | 19 | 580706 | 580787 | NFIX | 76 | 151 | 19 | 13135833 | 13135908 | |
| BG491011 | BSG | 15 | 107 | 19 | 580384 | 580660 | BSG | 104 | 925 | 19 | 580655 | 583075 | |
| BF762451 | BSG | 8 | 78 | 19 | 583357 | 583428 | FBXL19 | 76 | 242 | 16 | 30935819 | 30935985 | |
| AA535665 | BSG | 10 | 210 | 19 | 583091 | 583290 | BSG | 206 | 351 | 19 | 583296 | 583441 | |
| BM706468 | BSG | 14 | 84 | 19 | 581372 | 581442 | BSG | 80 | 484 | 19 | 581435 | 582903 | |
| AA570609 | BSG | 8 | 208 | 19 | 583091 | 583290 | BSG | 204 | 348 | 19 | 583296 | 583441 | |
| BG333059 | BSG | 15 | 107 | 19 | 580384 | 580660 | BSG | 104 | 821 | 19 | 580655 | 582966 | |
| AW973156 | BSG | 114 | 313 | 19 | 583091 | 583290 | BSG | 309 | 454 | 19 | 583296 | 583441 | |
| CA422684 | BSG | 18 | 565 | 19 | 582940 | 583487 | BSG | 550 | 647 | 19 | 582859 | 583230 | |
| BF819563 | BSG | 9 | 293 | 19 | 579499 | 580692 | ZKSCAN1 | 288 | 572 | 7 | 99613281 | 99621265 | |
| Top |
| There's no copy number variation information in COSMIC data for this gene. |
| Top |
|
 |
| Top |
| Stat. for Non-Synonymous SNVs (# total SNVs=22) | (# total SNVs=11) |
 |  |
(# total SNVs=2) | (# total SNVs=0) |
 |
| Top |
| * When you move the cursor on each content, you can see more deailed mutation information on the Tooltip. Those are primary_site,primary_histology,mutation(aa),pubmedID. |
| GRCh37 position | Mutation(aa) | Unique sampleID count |
| chr19:579609-579609 | p.G175G | 2 |
| chr19:579627-579627 | p.D181D | 2 |
| chr19:580426-580426 | p.P207L | 2 |
| chr19:580665-580665 | p.A225A | 2 |
| chr19:579577-579577 | p.E165K | 2 |
| chr19:581455-581455 | p.Q311H | 2 |
| chr19:579603-579603 | p.G175fs*4 | 2 |
| chr19:577922-577922 | p.D72D | 1 |
| chr19:581471-581471 | p.R317C | 1 |
| chr19:580728-580728 | p.S246S | 1 |
| Top |
|
 |
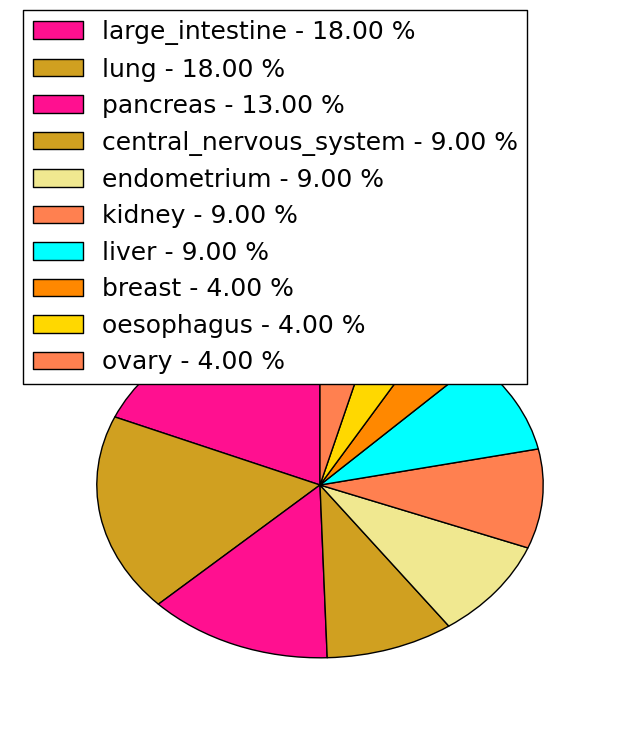
| Point Mutation/ Tissue ID | 1 | 2 | 3 | 4 | 5 | 6 | 7 | 8 | 9 | 10 | 11 | 12 | 13 | 14 | 15 | 16 | 17 | 18 | 19 | 20 |
| # sample | 1 | 1 | 3 | 2 | 1 | 1 | 1 | 3 | 1 | 4 | ||||||||||
| # mutation | 1 | 1 | 3 | 2 | 1 | 1 | 1 | 4 | 1 | 4 | ||||||||||
| nonsynonymous SNV | 1 | 1 | 1 | 1 | 1 | 2 | 1 | 2 | ||||||||||||
| synonymous SNV | 3 | 2 | 2 | 2 |
| cf) Tissue ID; Tissue type (1; BLCA[Bladder Urothelial Carcinoma], 2; BRCA[Breast invasive carcinoma], 3; CESC[Cervical squamous cell carcinoma and endocervical adenocarcinoma], 4; COAD[Colon adenocarcinoma], 5; GBM[Glioblastoma multiforme], 6; Glioma Low Grade, 7; HNSC[Head and Neck squamous cell carcinoma], 8; KICH[Kidney Chromophobe], 9; KIRC[Kidney renal clear cell carcinoma], 10; KIRP[Kidney renal papillary cell carcinoma], 11; LAML[Acute Myeloid Leukemia], 12; LUAD[Lung adenocarcinoma], 13; LUSC[Lung squamous cell carcinoma], 14; OV[Ovarian serous cystadenocarcinoma ], 15; PAAD[Pancreatic adenocarcinoma], 16; PRAD[Prostate adenocarcinoma], 17; SKCM[Skin Cutaneous Melanoma], 18:STAD[Stomach adenocarcinoma], 19:THCA[Thyroid carcinoma], 20:UCEC[Uterine Corpus Endometrial Carcinoma]) |
| Top |
| * We represented just top 10 SNVs. When you move the cursor on each content, you can see more deailed mutation information on the Tooltip. Those are primary_site, primary_histology, mutation(aa), pubmedID. |
| Genomic Position | Mutation(aa) | Unique sampleID count |
| chr19:580426 | p.P27L,BSG | 2 |
| chr19:578038 | p.F58F | 1 |
| chr19:581345 | p.G128S,BSG | 1 |
| chr19:579570 | p.I95I | 1 |
| chr19:581411 | p.R137R,BSG | 1 |
| chr19:579571 | p.A110A | 1 |
| chr19:581444 | p.S111N | 1 |
| chr19:579590 | p.S46S,BSG | 1 |
| chr19:581473 | p.A47T,BSG | 1 |
| chr19:579609 | p.H53R,BSG | 1 |
| * Copy number data were extracted from TCGA using R package TCGA-Assembler. The URLs of all public data files on TCGA DCC data server were gathered on Jan-05-2015. Function ProcessCNAData in TCGA-Assembler package was used to obtain gene-level copy number value which is calculated as the average copy number of the genomic region of a gene. |
 |
| cf) Tissue ID[Tissue type]: BLCA[Bladder Urothelial Carcinoma], BRCA[Breast invasive carcinoma], CESC[Cervical squamous cell carcinoma and endocervical adenocarcinoma], COAD[Colon adenocarcinoma], GBM[Glioblastoma multiforme], Glioma Low Grade, HNSC[Head and Neck squamous cell carcinoma], KICH[Kidney Chromophobe], KIRC[Kidney renal clear cell carcinoma], KIRP[Kidney renal papillary cell carcinoma], LAML[Acute Myeloid Leukemia], LUAD[Lung adenocarcinoma], LUSC[Lung squamous cell carcinoma], OV[Ovarian serous cystadenocarcinoma ], PAAD[Pancreatic adenocarcinoma], PRAD[Prostate adenocarcinoma], SKCM[Skin Cutaneous Melanoma], STAD[Stomach adenocarcinoma], THCA[Thyroid carcinoma], UCEC[Uterine Corpus Endometrial Carcinoma] |
| Top |
| Gene Expression for BSG |
| * CCLE gene expression data were extracted from CCLE_Expression_Entrez_2012-10-18.res: Gene-centric RMA-normalized mRNA expression data. |
 |
| * Normalized gene expression data of RNASeqV2 was extracted from TCGA using R package TCGA-Assembler. The URLs of all public data files on TCGA DCC data server were gathered at Jan-05-2015. Only eight cancer types have enough normal control samples for differential expression analysis. (t test, adjusted p<0.05 (using Benjamini-Hochberg FDR)) |
 |
| Top |
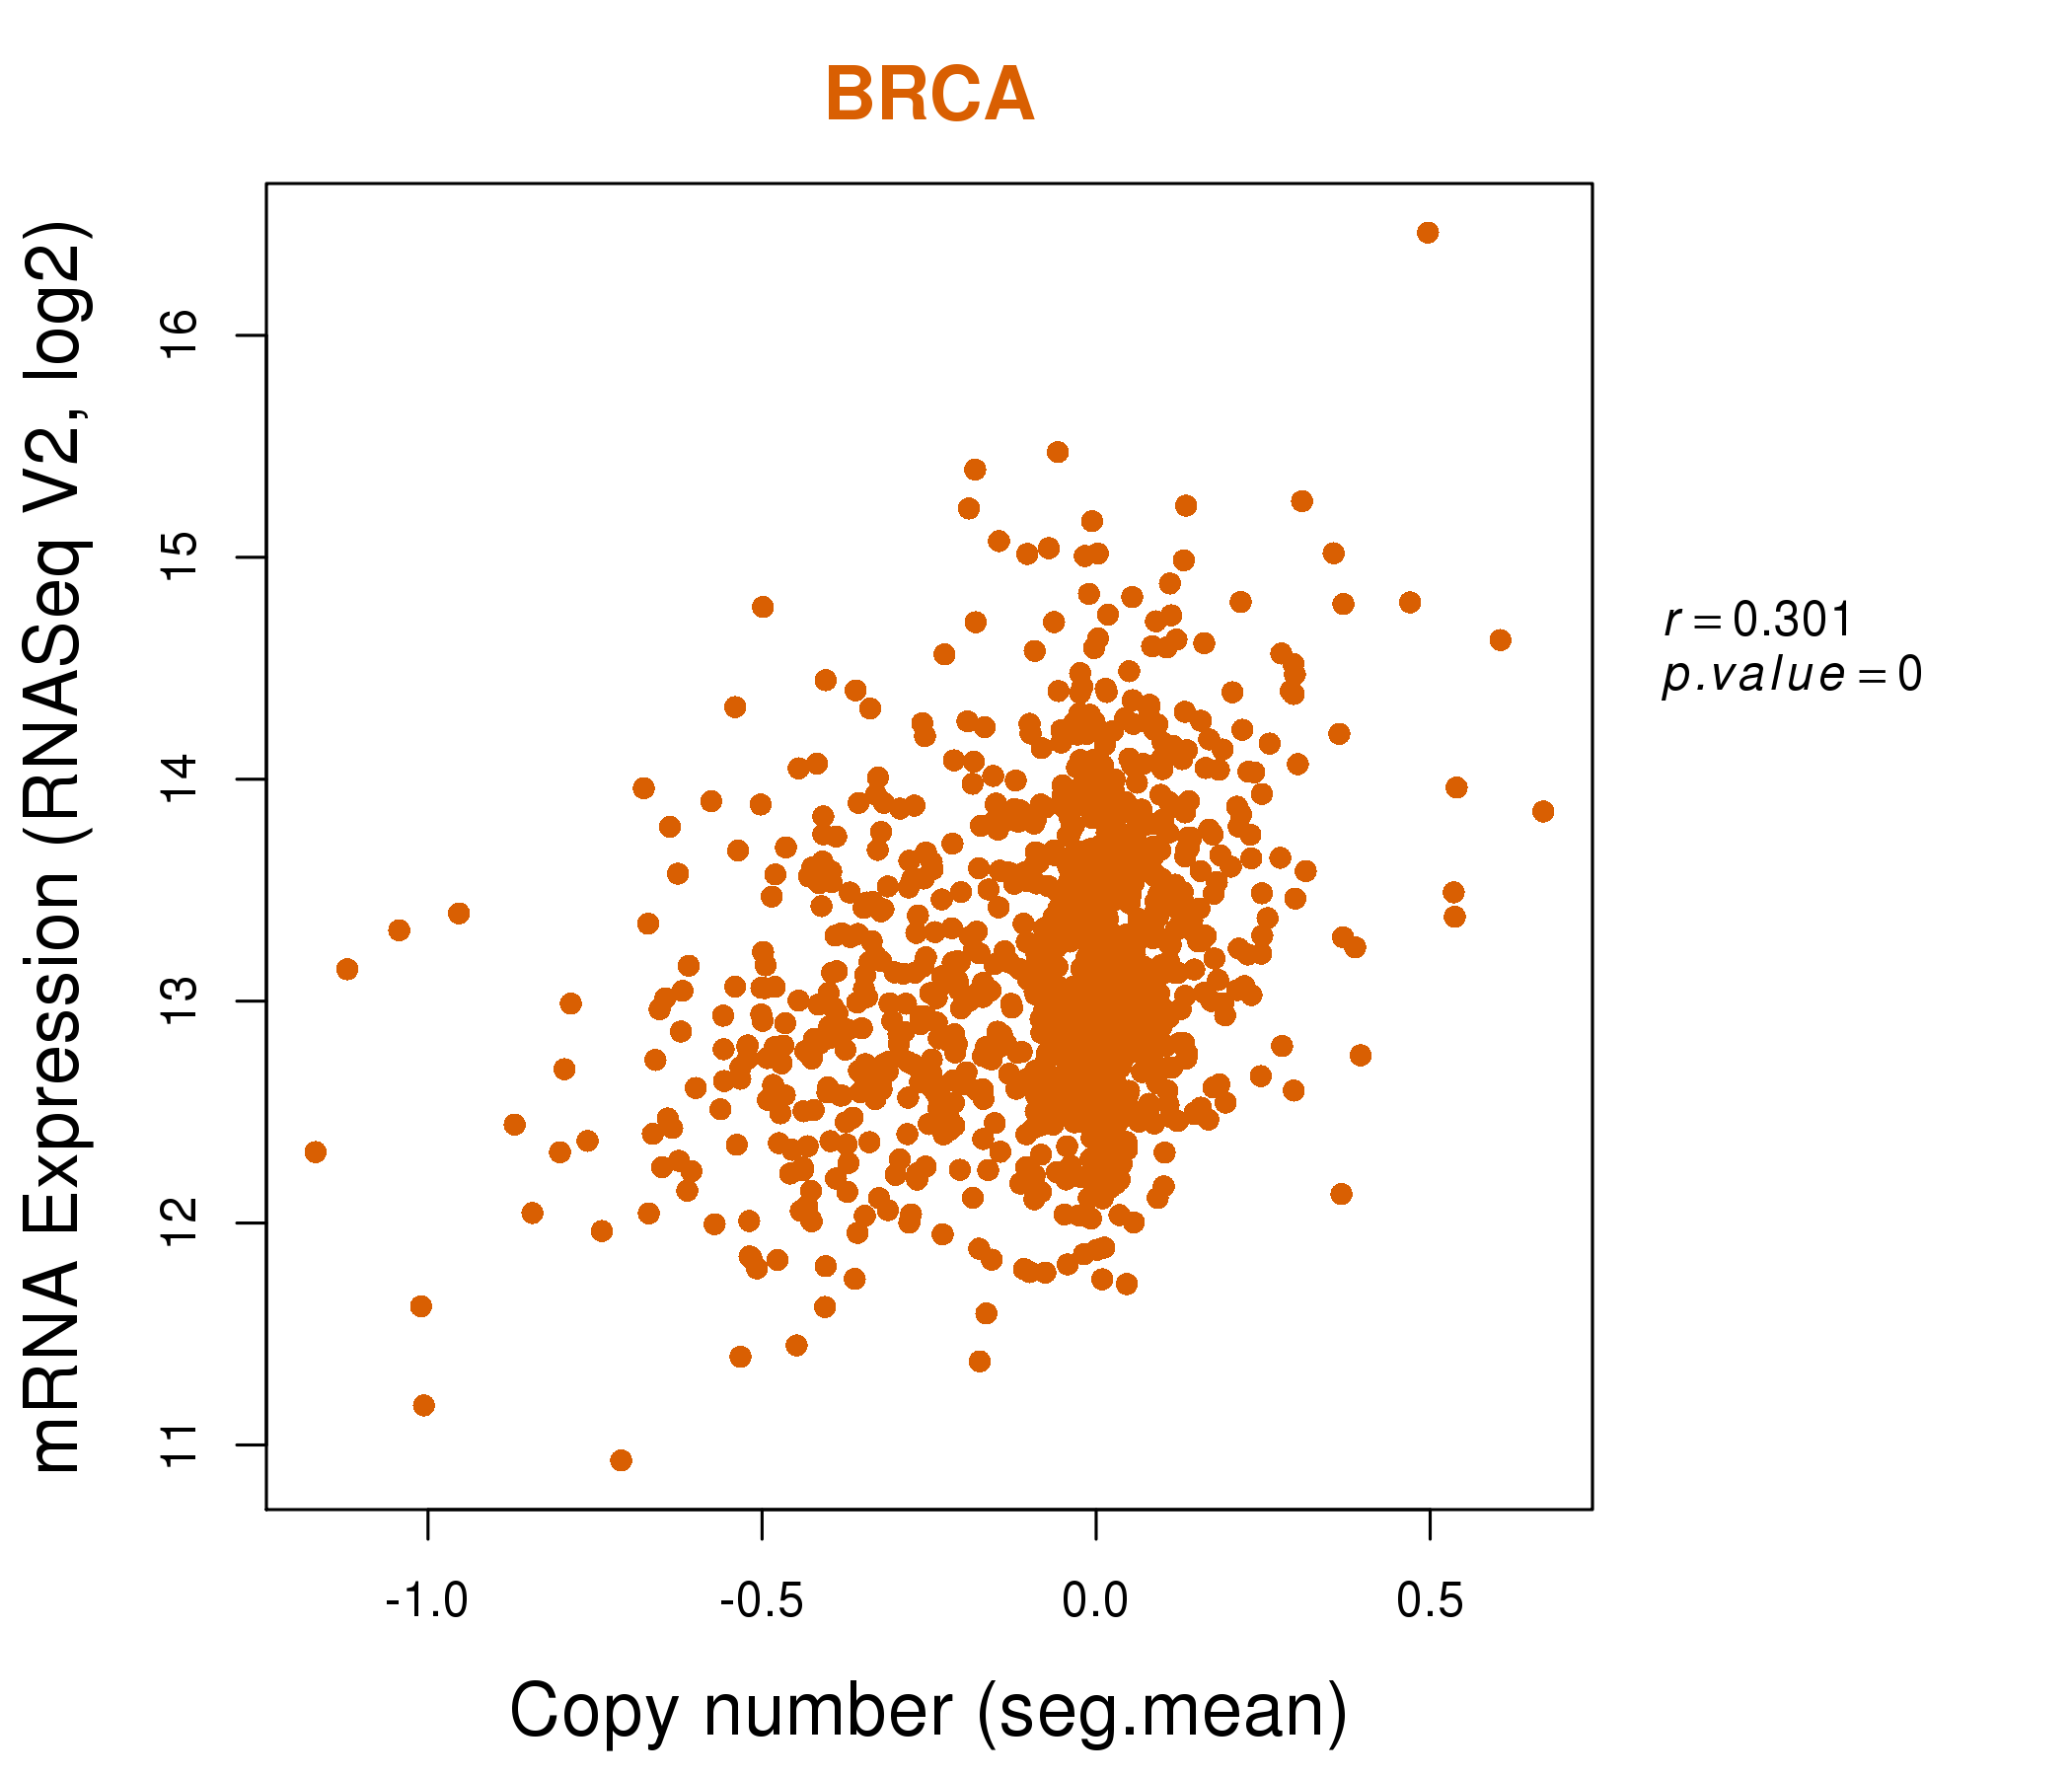
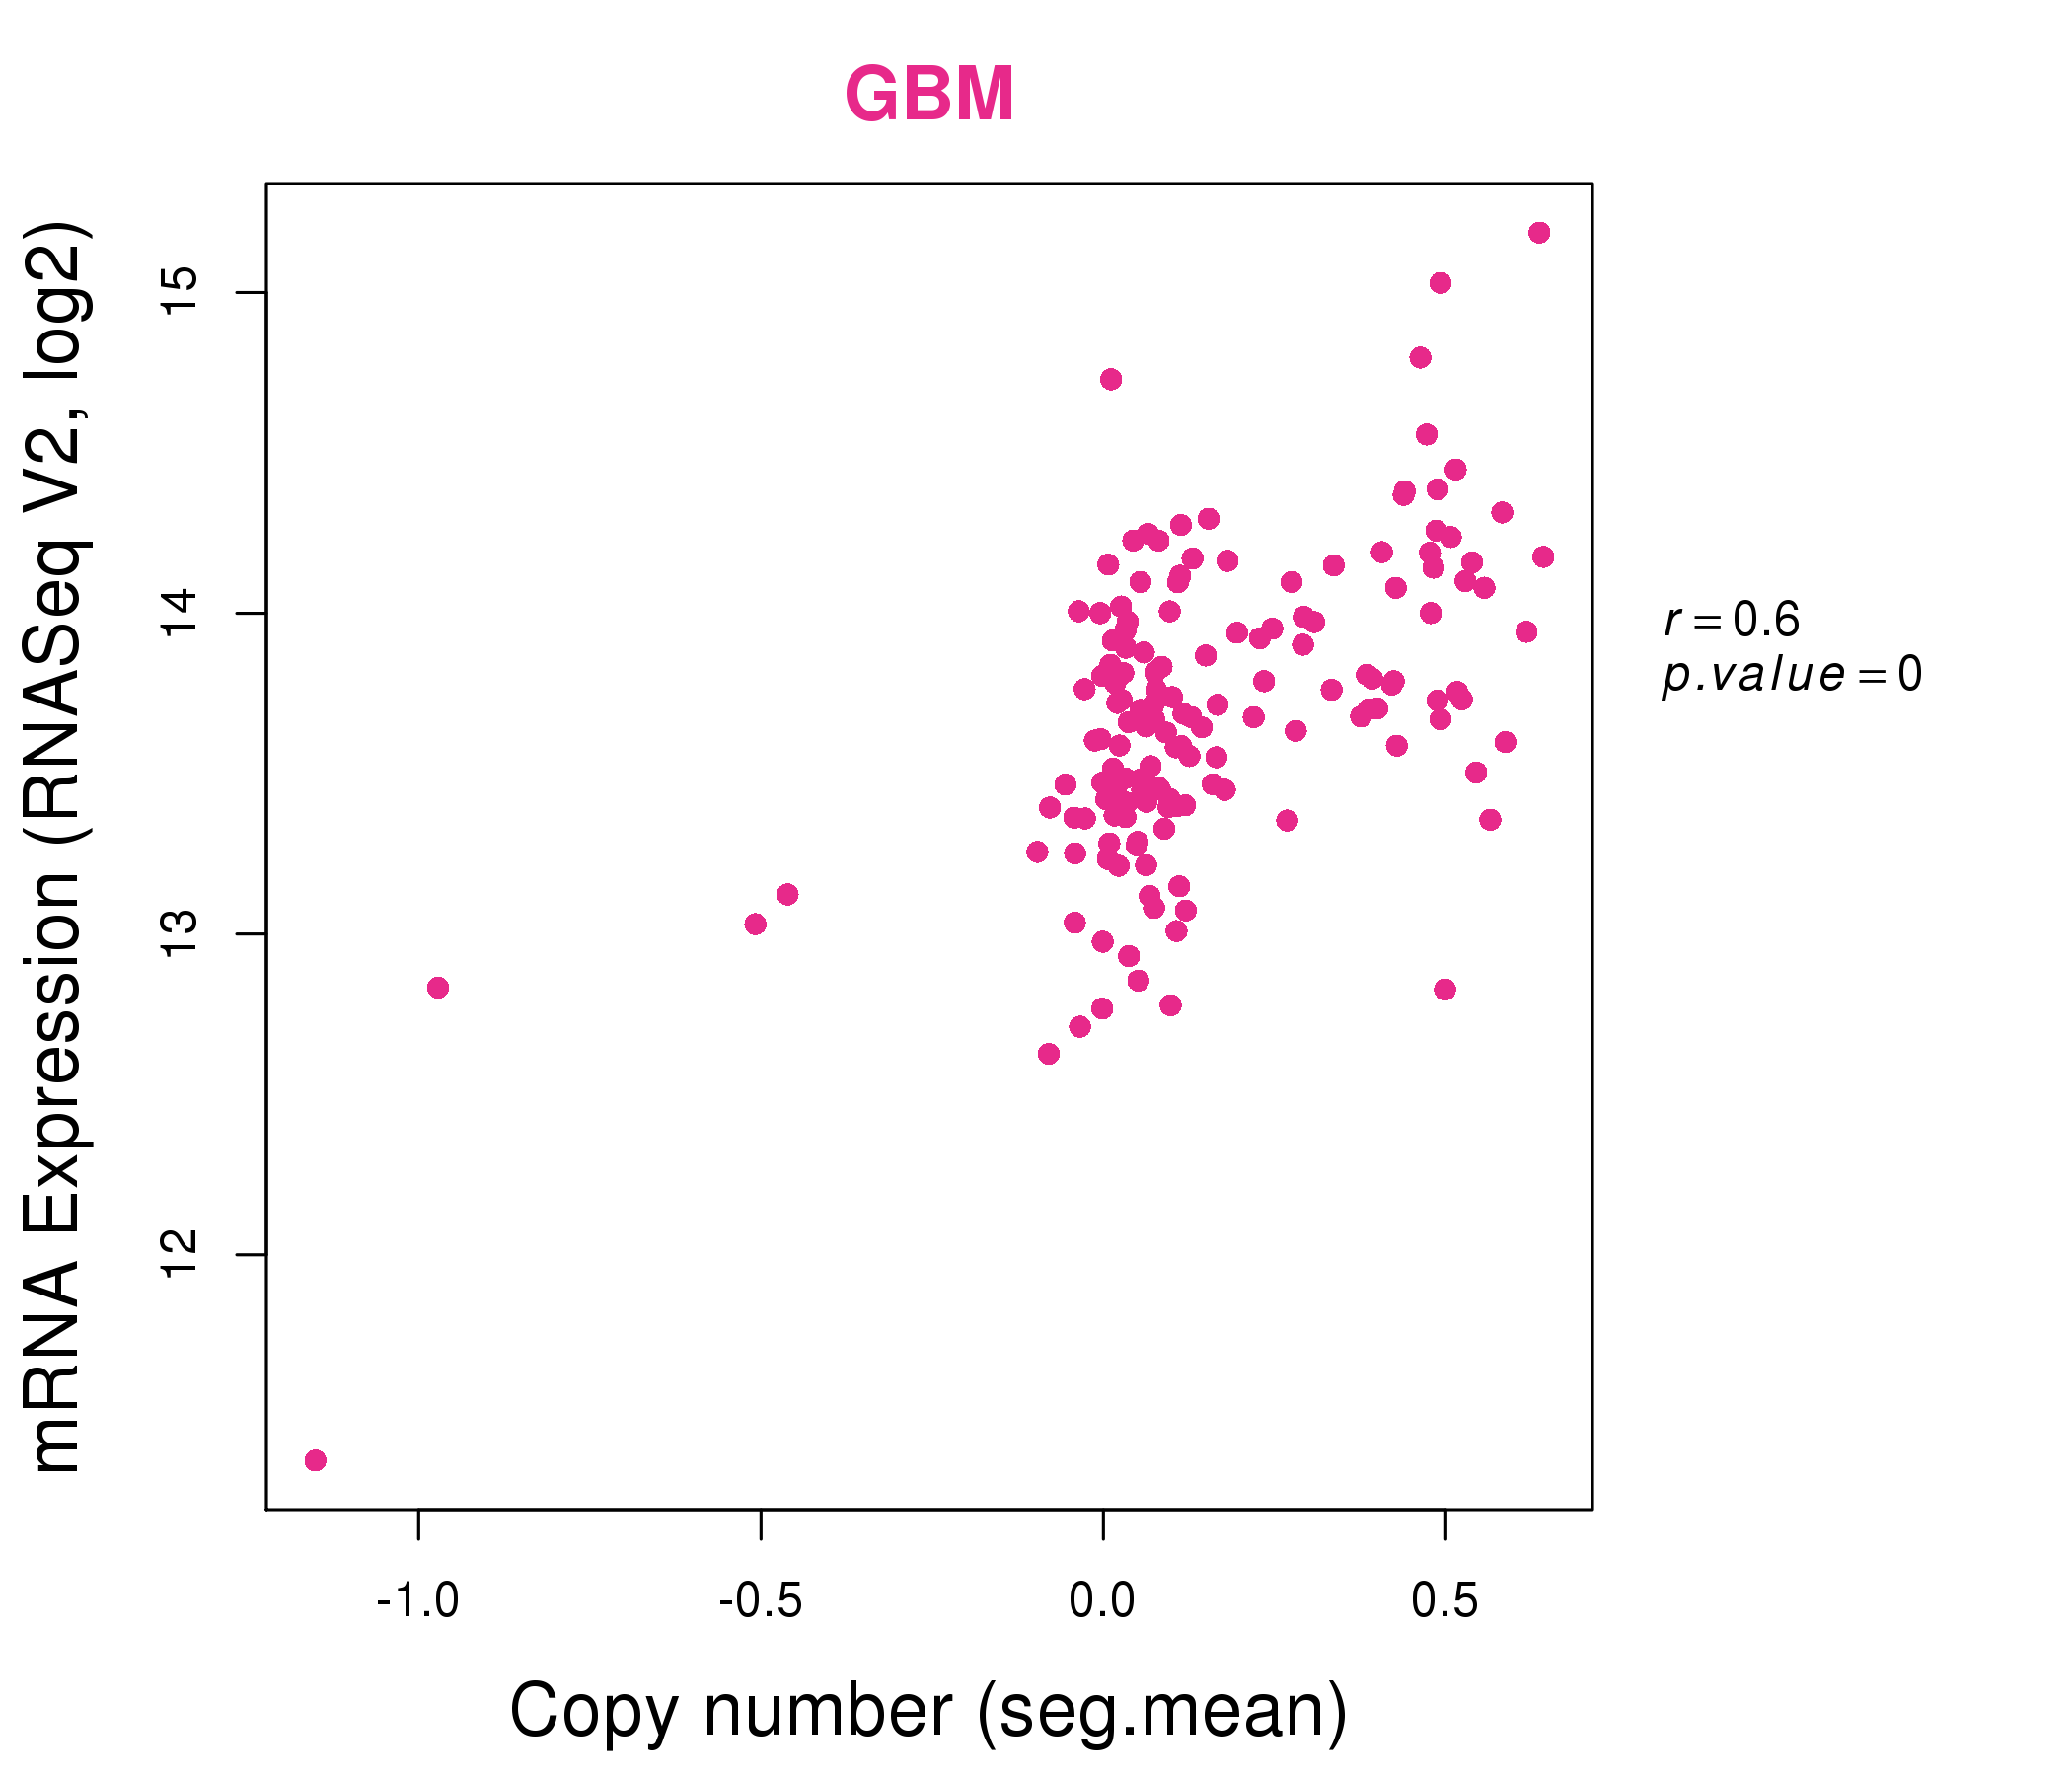
| * This plots show the correlation between CNV and gene expression. |
: Open all plots for all cancer types
 |
|
 |
|
| Top |
| Gene-Gene Network Information |
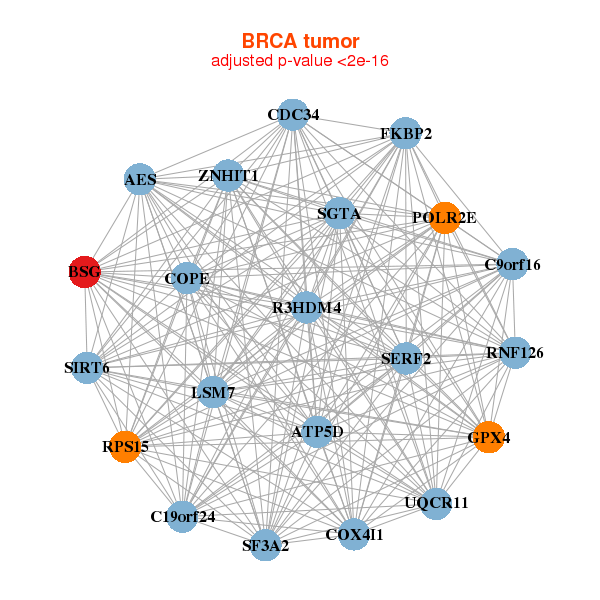
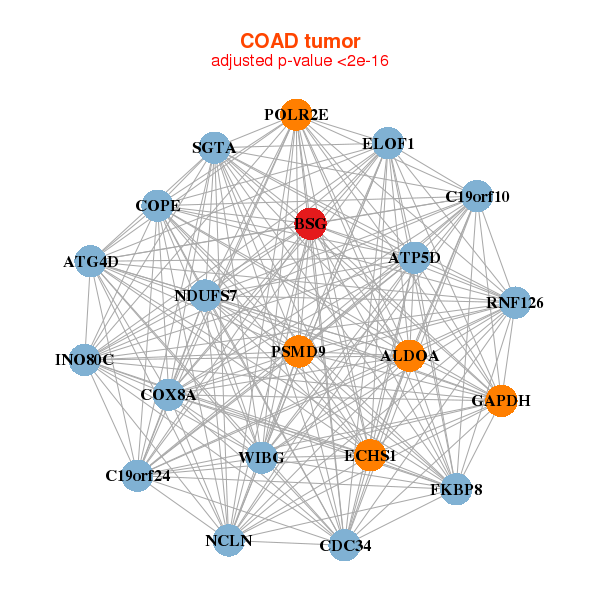
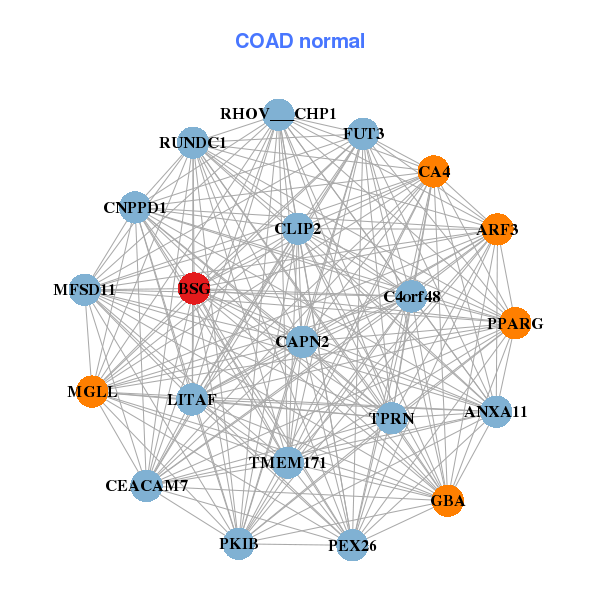
| * Co-Expression network figures were drawn using R package igraph. Only the top 20 genes with the highest correlations were shown. Red circle: input gene, orange circle: cell metabolism gene, sky circle: other gene |
: Open all plots for all cancer types
 |
|
| AES,ATP5D,BSG,R3HDM4,C19orf24,C9orf16,CDC34, COPE,COX4I1,FKBP2,GPX4,LSM7,POLR2E,RNF126, RPS15,SERF2,SF3A2,SGTA,SIRT6,UQCR11,ZNHIT1 | BSG,C20orf27,CNPPD1,DCXR,EIF4EBP1,ETFB,FPGS, GCDH,GCHFR,HSD17B10,MPST,MRPL53,PCYT2,PLEKHJ1, PMM1,POLR2E,PQLC1,PSMA7,SLC2A4RG,TP53I13,TSPO |
 |
|
| ALDOA,ATG4D,ATP5D,BSG,C19orf10,C19orf24,CDC34, COPE,COX8A,ECHS1,ELOF1,FKBP8,GAPDH,INO80C, NCLN,NDUFS7,POLR2E,PSMD9,RNF126,SGTA,WIBG | ANXA11,ARF3,BSG,CNPPD1,C4orf48,CA4,CAPN2, CEACAM7,RHOV___CHP1,CLIP2,FUT3,GBA,LITAF,MFSD11, MGLL,PEX26,PKIB,PPARG,RUNDC1,TMEM171,TPRN |

| * Co-Expression network figures were drawn using R package igraph. Only the top 20 genes with the highest correlations were shown. Red circle: input gene, orange circle: cell metabolism gene, sky circle: other gene |
: Open all plots for all cancer types
| Top |
: Open all interacting genes' information including KEGG pathway for all interacting genes from DAVID
| Top |
| Pharmacological Information for BSG |
| There's no related Drug. |
| Top |
| Cross referenced IDs for BSG |
| * We obtained these cross-references from Uniprot database. It covers 150 different DBs, 18 categories. http://www.uniprot.org/help/cross_references_section |
: Open all cross reference information
|
Copyright © 2016-Present - The Univsersity of Texas Health Science Center at Houston @ |