|
||||||||||||||||||||
| |
| Phenotypic Information (metabolism pathway, cancer, disease, phenome) |
| |
| |
| Gene-Gene Network Information: Co-Expression Network, Interacting Genes & KEGG |
| |
|


| Gene Summary for VAMP2 |
| Top |
| Phenotypic Information for VAMP2(metabolism pathway, cancer, disease, phenome) |
| Cancer | CGAP: VAMP2 |
| Familial Cancer Database: VAMP2 | |
| * This gene is included in those cancer gene databases. |
|
|
|
|
|
| . | ||||||||||||||
Oncogene 1 | Significant driver gene in | |||||||||||||||||||
| cf) number; DB name 1 Oncogene; http://nar.oxfordjournals.org/content/35/suppl_1/D721.long, 2 Tumor Suppressor gene; https://bioinfo.uth.edu/TSGene/, 3 Cancer Gene Census; http://www.nature.com/nrc/journal/v4/n3/abs/nrc1299.html, 4 CancerGenes; http://nar.oxfordjournals.org/content/35/suppl_1/D721.long, 5 Network of Cancer Gene; http://ncg.kcl.ac.uk/index.php, 1Therapeutic Vulnerabilities in Cancer; http://cbio.mskcc.org/cancergenomics/statius/ |
| REACTOME_INTEGRATION_OF_ENERGY_METABOLISM | |
| OMIM | |
| Orphanet | |
| Disease | KEGG Disease: VAMP2 |
| MedGen: VAMP2 (Human Medical Genetics with Condition) | |
| ClinVar: VAMP2 | |
| Phenotype | MGI: VAMP2 (International Mouse Phenotyping Consortium) |
| PhenomicDB: VAMP2 | |
| Mutations for VAMP2 |
| * Under tables are showing count per each tissue to give us broad intuition about tissue specific mutation patterns.You can go to the detailed page for each mutation database's web site. |
| There's no structural variation information in COSMIC data for this gene. |
| * From mRNA Sanger sequences, Chitars2.0 arranged chimeric transcripts. This table shows VAMP2 related fusion information. |
| ID | Head Gene | Tail Gene | Accession | Gene_a | qStart_a | qEnd_a | Chromosome_a | tStart_a | tEnd_a | Gene_a | qStart_a | qEnd_a | Chromosome_a | tStart_a | tEnd_a |
| BE764151 | STIM1 | 11 | 121 | 11 | 4109779 | 4109891 | VAMP2 | 114 | 195 | 17 | 8062753 | 8062834 | |
| BE646088 | HNRNPD | 17 | 136 | 4 | 83275139 | 83275258 | VAMP2 | 134 | 339 | 17 | 8063452 | 8063657 | |
| D51537 | VAMP2 | 91 | 219 | 17 | 8065564 | 8065692 | LGALS1 | 220 | 271 | 22 | 38075753 | 38075807 | |
| BI019526 | VAMP2 | 33 | 111 | 17 | 8066213 | 8066292 | ACTB | 102 | 208 | 7 | 5566931 | 5567037 | |
| BE219072 | VAMP2 | 22 | 124 | 17 | 8063082 | 8063184 | VAMP2 | 119 | 507 | 17 | 8062666 | 8063054 | |
| AI302145 | VAMP2 | 1 | 235 | 17 | 8062473 | 8062707 | C16orf80 | 229 | 430 | 16 | 58148757 | 58149306 | |
| BE771726 | VAMP2 | 44 | 245 | 17 | 8064504 | 8064706 | TNC | 226 | 247 | 9 | 117838780 | 117838801 | |
| BE272026 | VAMP2 | 1 | 113 | 17 | 8063812 | 8063924 | TAF4 | 110 | 631 | 20 | 60551014 | 60573216 | |
| Top |
| There's no copy number variation information in COSMIC data for this gene. |
| Top |
|
 |
| Top |
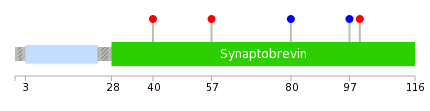
| Stat. for Non-Synonymous SNVs (# total SNVs=2) | (# total SNVs=2) |
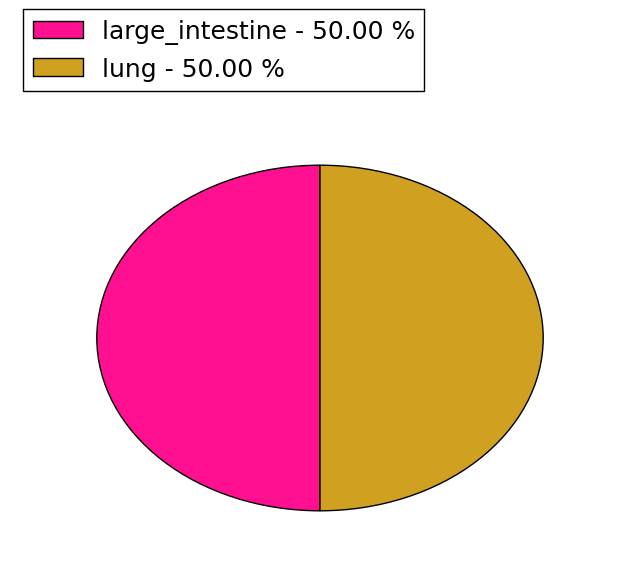 |  |
(# total SNVs=0) | (# total SNVs=0) |
| Top |
| * When you move the cursor on each content, you can see more deailed mutation information on the Tooltip. Those are primary_site,primary_histology,mutation(aa),pubmedID. |
| GRCh37 position | Mutation(aa) | Unique sampleID count |
| chr17:8064826-8064826 | p.G100V | 1 |
| chr17:8064834-8064834 | p.I97I | 1 |
| chr17:8064968-8064968 | p.S80S | 1 |
| chr17:8065039-8065039 | p.D57N | 1 |
| chr17:8065572-8065572 | p.D40N | 1 |
| Top |
|
 |
| Point Mutation/ Tissue ID | 1 | 2 | 3 | 4 | 5 | 6 | 7 | 8 | 9 | 10 | 11 | 12 | 13 | 14 | 15 | 16 | 17 | 18 | 19 | 20 |
| # sample | 1 | 2 | ||||||||||||||||||
| # mutation | 1 | 2 | ||||||||||||||||||
| nonsynonymous SNV | 1 | |||||||||||||||||||
| synonymous SNV | 1 | 1 |
| cf) Tissue ID; Tissue type (1; BLCA[Bladder Urothelial Carcinoma], 2; BRCA[Breast invasive carcinoma], 3; CESC[Cervical squamous cell carcinoma and endocervical adenocarcinoma], 4; COAD[Colon adenocarcinoma], 5; GBM[Glioblastoma multiforme], 6; Glioma Low Grade, 7; HNSC[Head and Neck squamous cell carcinoma], 8; KICH[Kidney Chromophobe], 9; KIRC[Kidney renal clear cell carcinoma], 10; KIRP[Kidney renal papillary cell carcinoma], 11; LAML[Acute Myeloid Leukemia], 12; LUAD[Lung adenocarcinoma], 13; LUSC[Lung squamous cell carcinoma], 14; OV[Ovarian serous cystadenocarcinoma ], 15; PAAD[Pancreatic adenocarcinoma], 16; PRAD[Prostate adenocarcinoma], 17; SKCM[Skin Cutaneous Melanoma], 18:STAD[Stomach adenocarcinoma], 19:THCA[Thyroid carcinoma], 20:UCEC[Uterine Corpus Endometrial Carcinoma]) |
| Top |
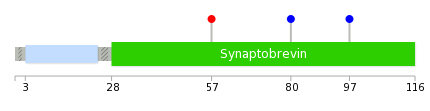
| * We represented just top 10 SNVs. When you move the cursor on each content, you can see more deailed mutation information on the Tooltip. Those are primary_site, primary_histology, mutation(aa), pubmedID. |
| Genomic Position | Mutation(aa) | Unique sampleID count |
| chr17:8064834 | p.I97I | 1 |
| chr17:8064968 | p.S80S | 1 |
| chr17:8065039 | p.D57N | 1 |
| * Copy number data were extracted from TCGA using R package TCGA-Assembler. The URLs of all public data files on TCGA DCC data server were gathered on Jan-05-2015. Function ProcessCNAData in TCGA-Assembler package was used to obtain gene-level copy number value which is calculated as the average copy number of the genomic region of a gene. |
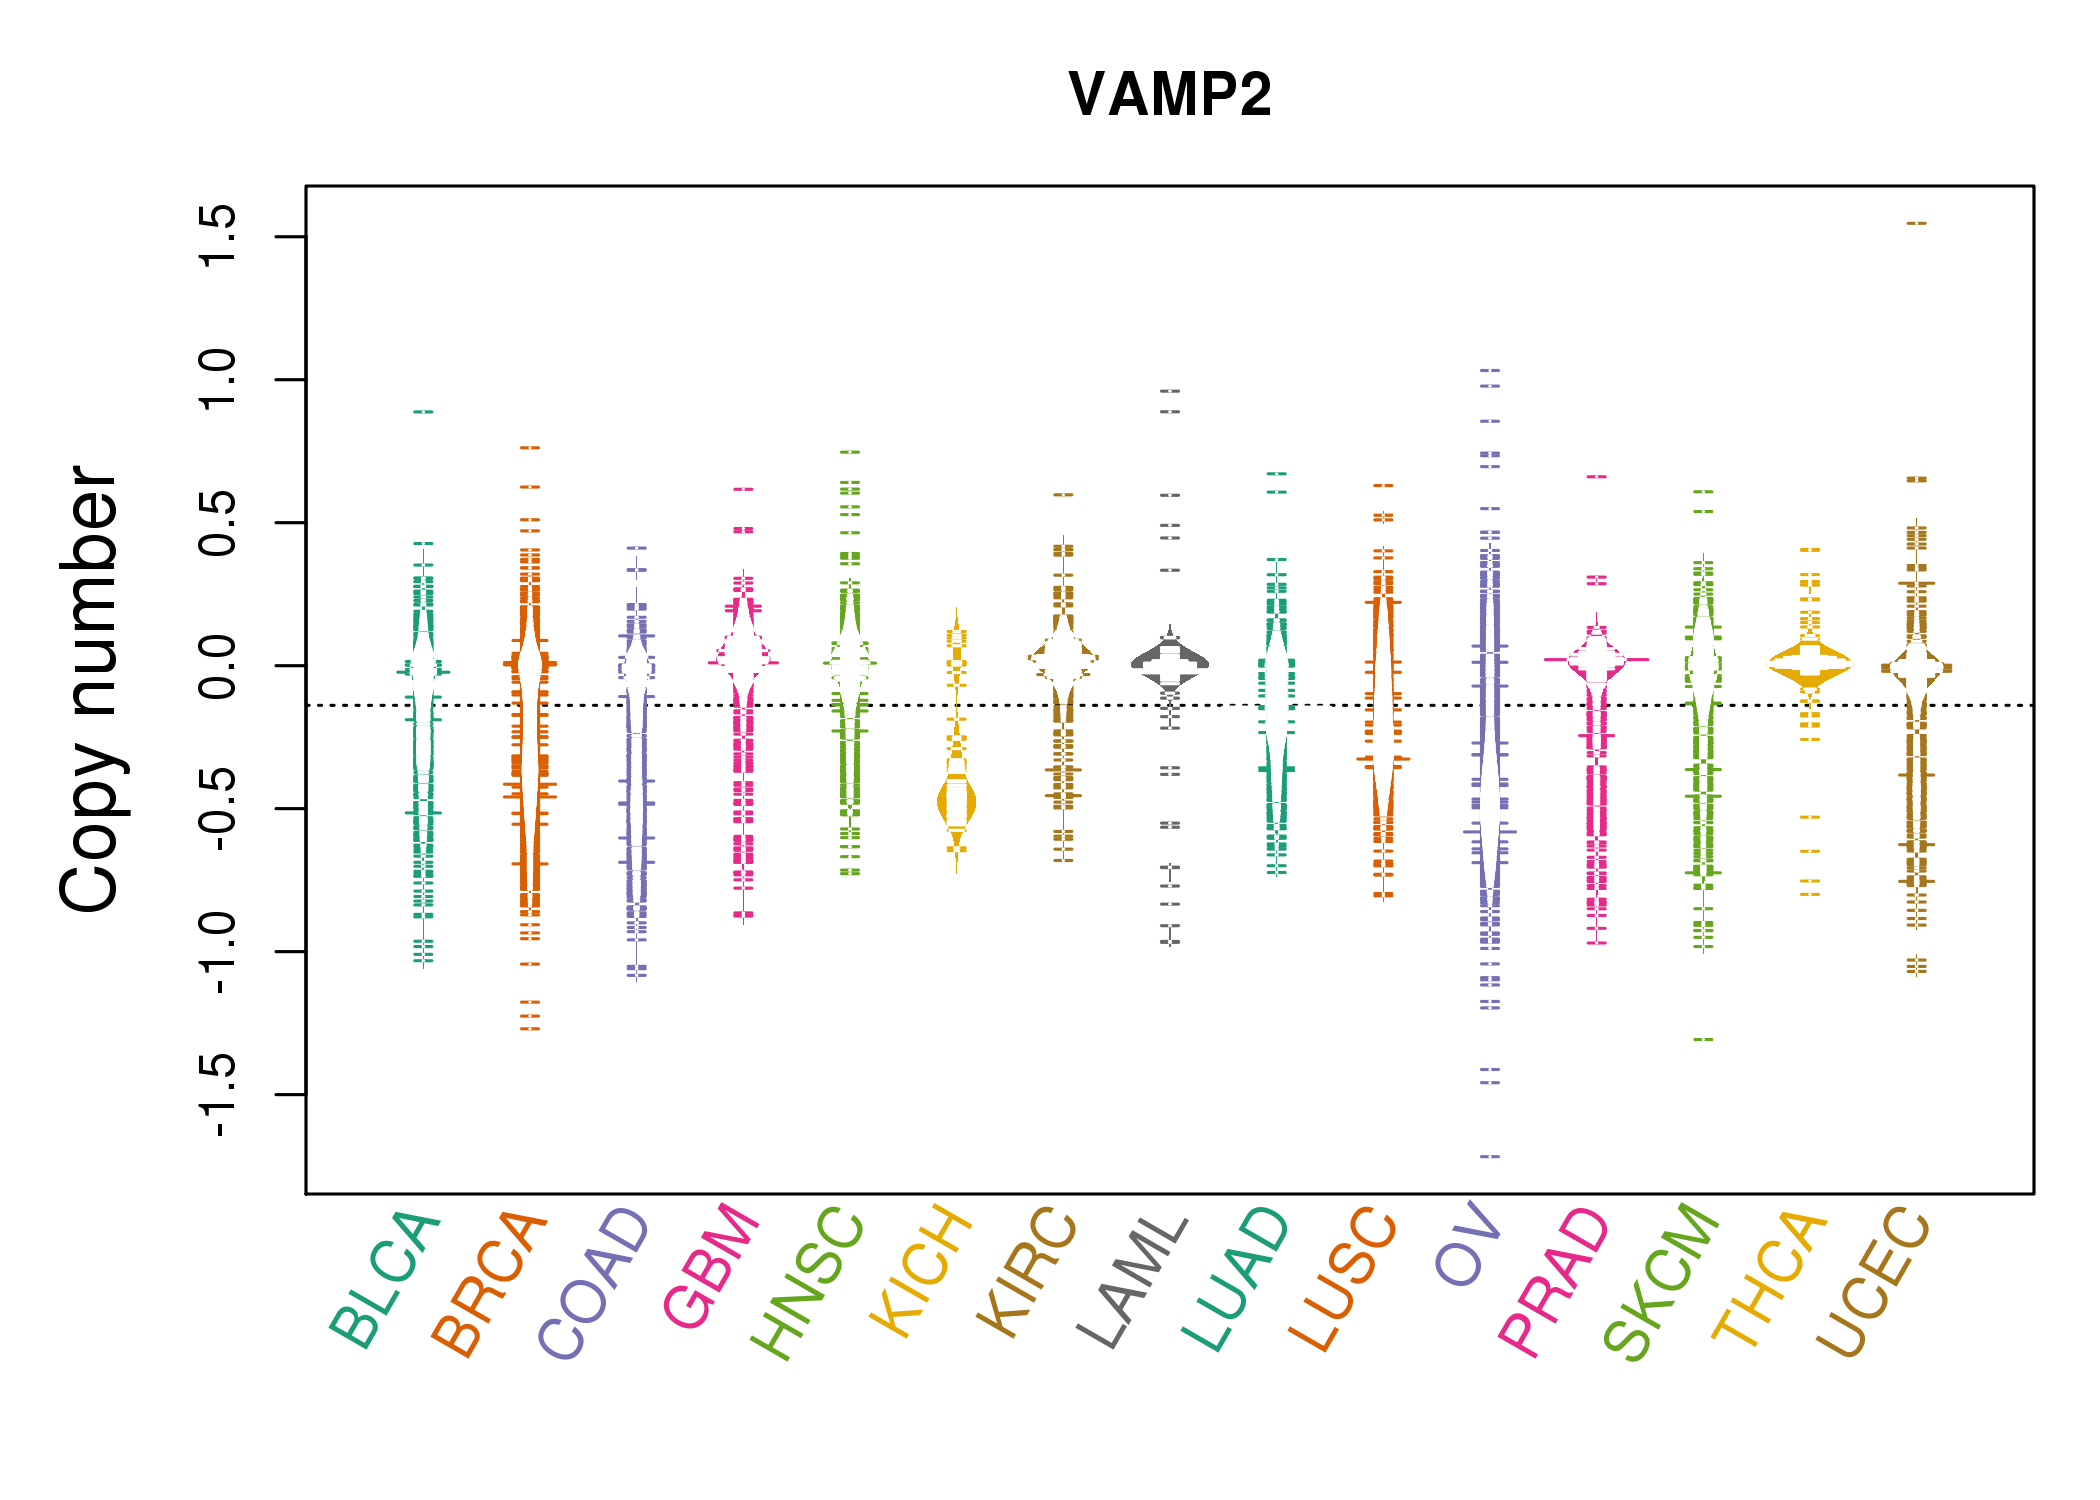 |
| cf) Tissue ID[Tissue type]: BLCA[Bladder Urothelial Carcinoma], BRCA[Breast invasive carcinoma], CESC[Cervical squamous cell carcinoma and endocervical adenocarcinoma], COAD[Colon adenocarcinoma], GBM[Glioblastoma multiforme], Glioma Low Grade, HNSC[Head and Neck squamous cell carcinoma], KICH[Kidney Chromophobe], KIRC[Kidney renal clear cell carcinoma], KIRP[Kidney renal papillary cell carcinoma], LAML[Acute Myeloid Leukemia], LUAD[Lung adenocarcinoma], LUSC[Lung squamous cell carcinoma], OV[Ovarian serous cystadenocarcinoma ], PAAD[Pancreatic adenocarcinoma], PRAD[Prostate adenocarcinoma], SKCM[Skin Cutaneous Melanoma], STAD[Stomach adenocarcinoma], THCA[Thyroid carcinoma], UCEC[Uterine Corpus Endometrial Carcinoma] |
| Top |
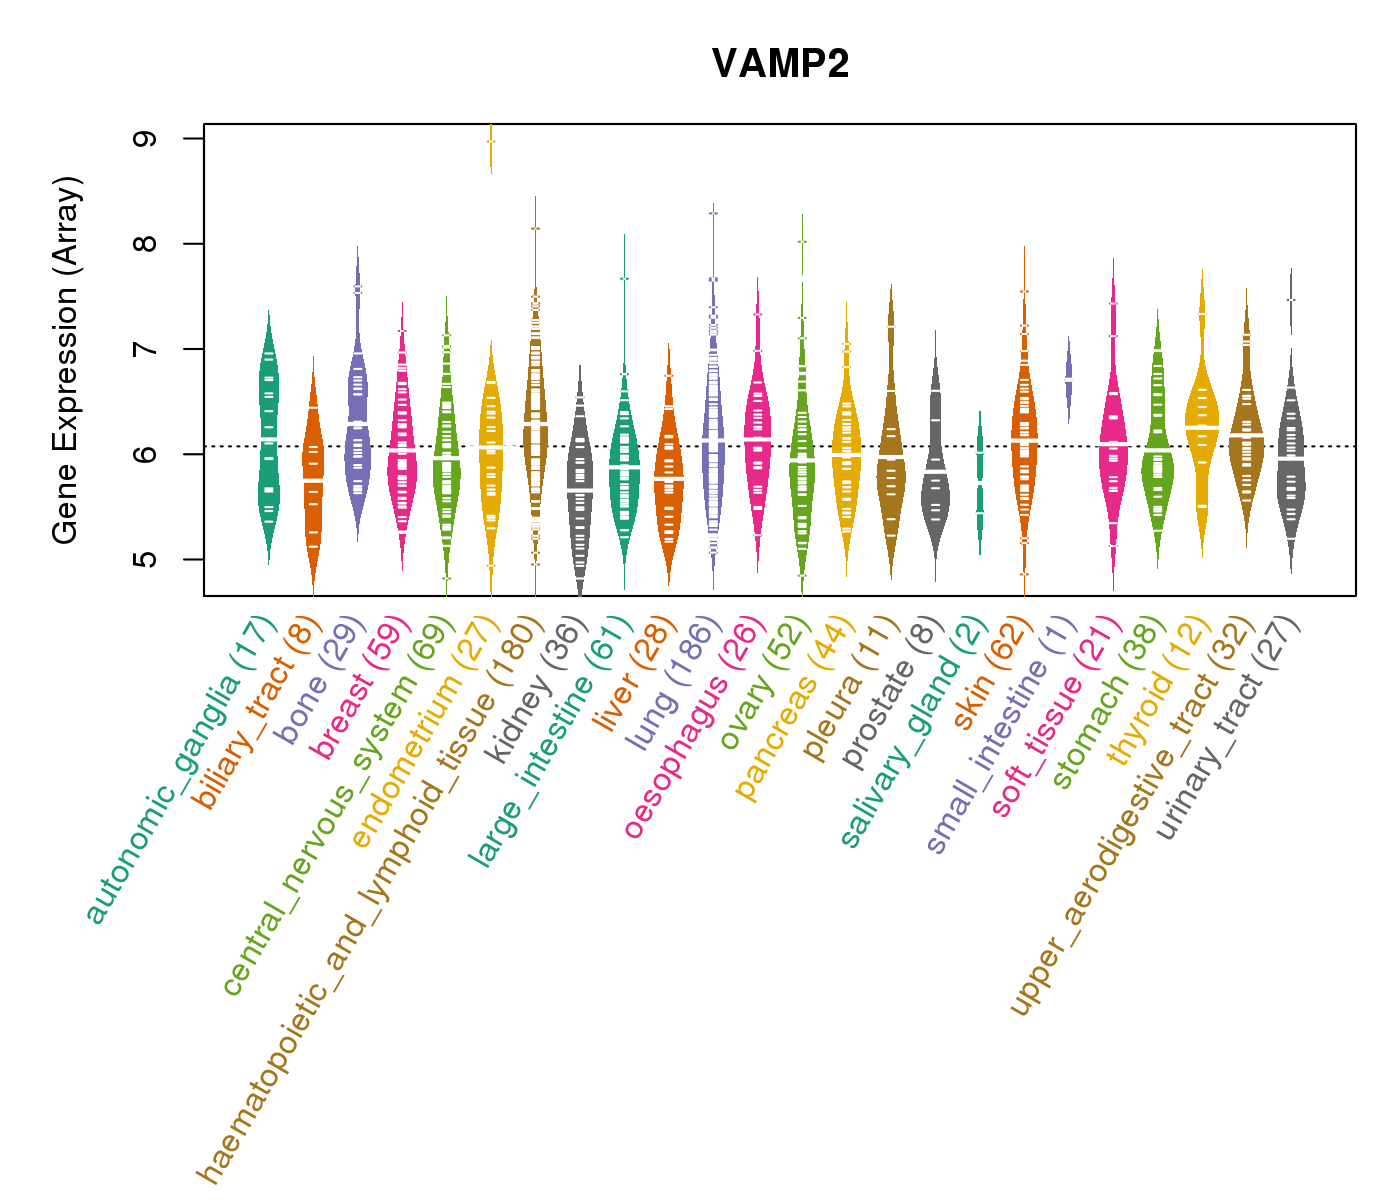
| Gene Expression for VAMP2 |
| * CCLE gene expression data were extracted from CCLE_Expression_Entrez_2012-10-18.res: Gene-centric RMA-normalized mRNA expression data. |
 |
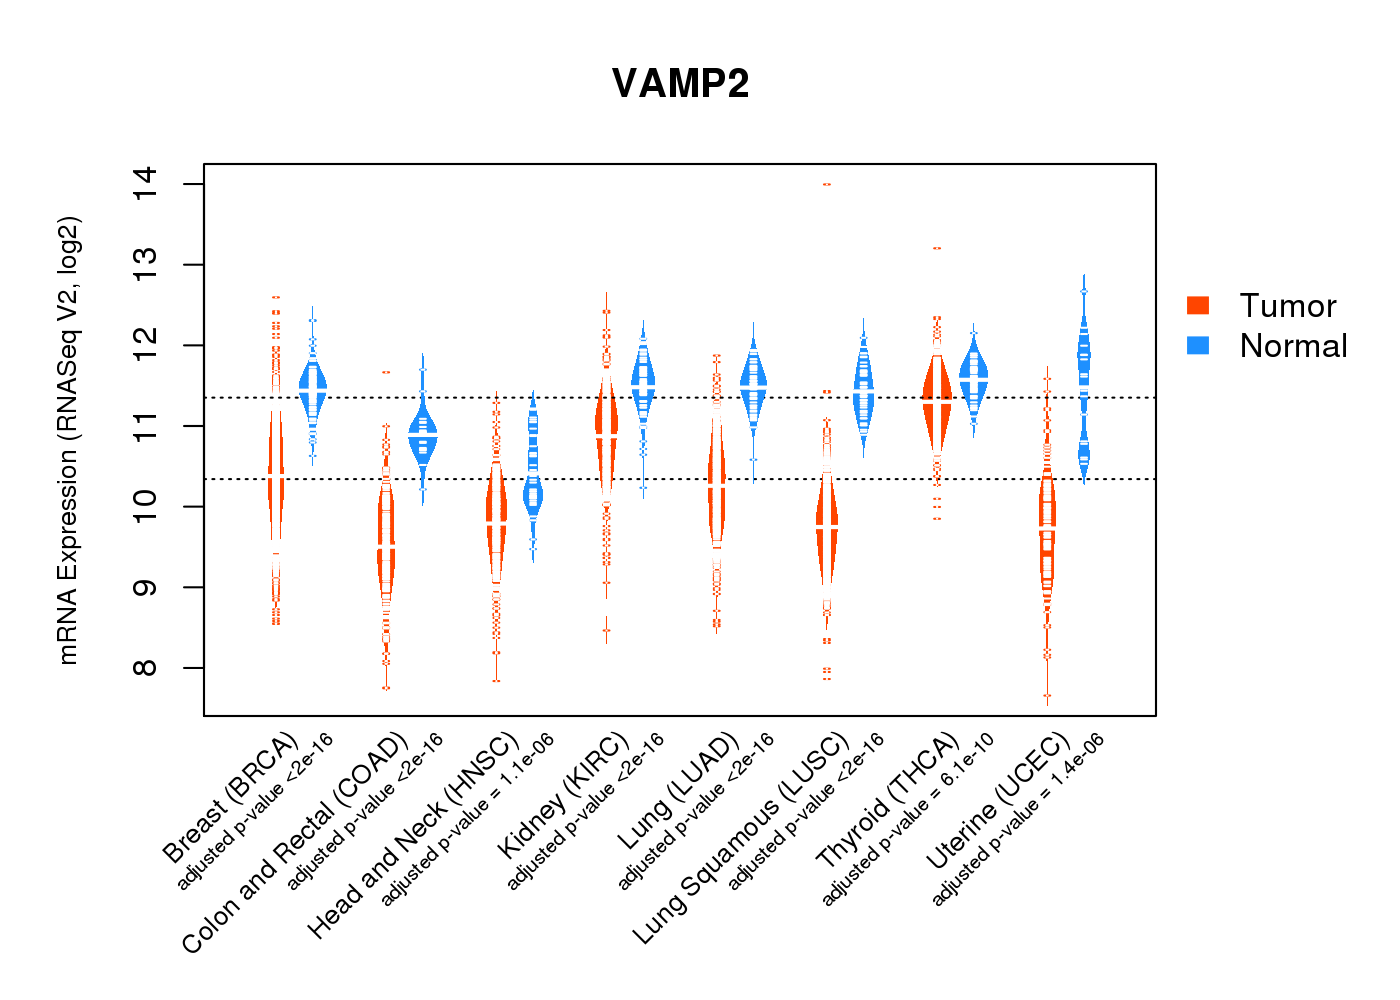
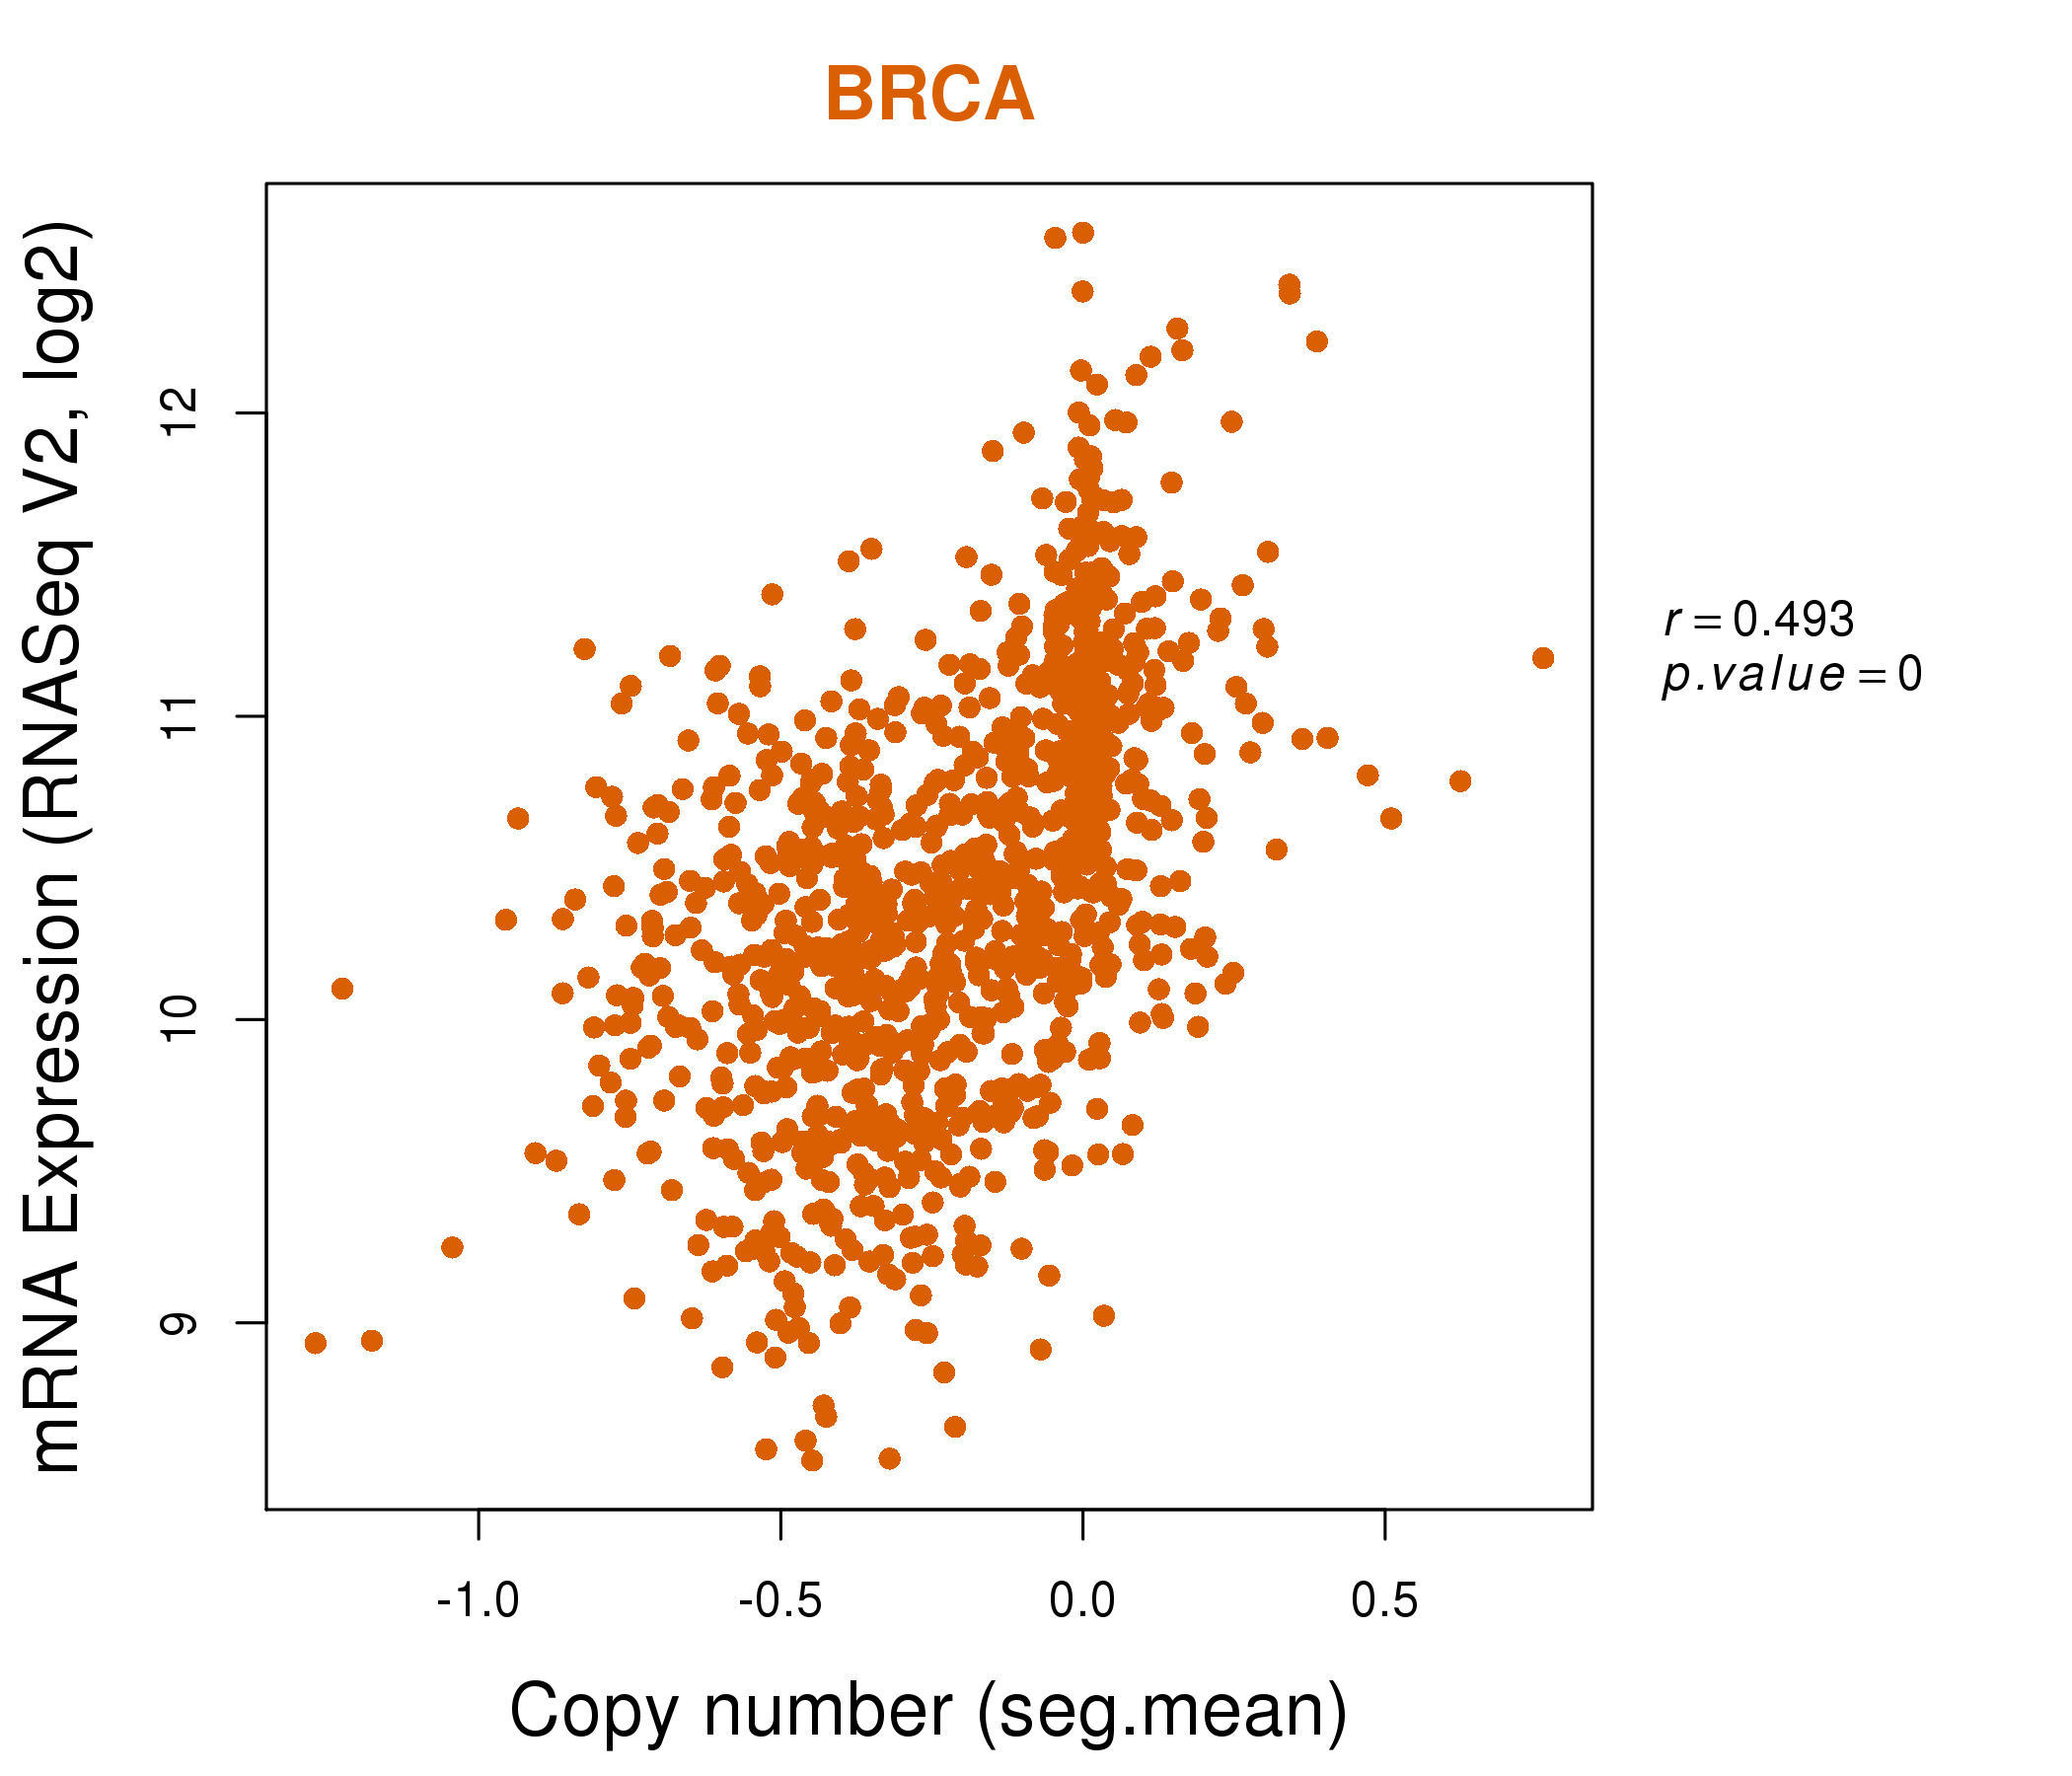
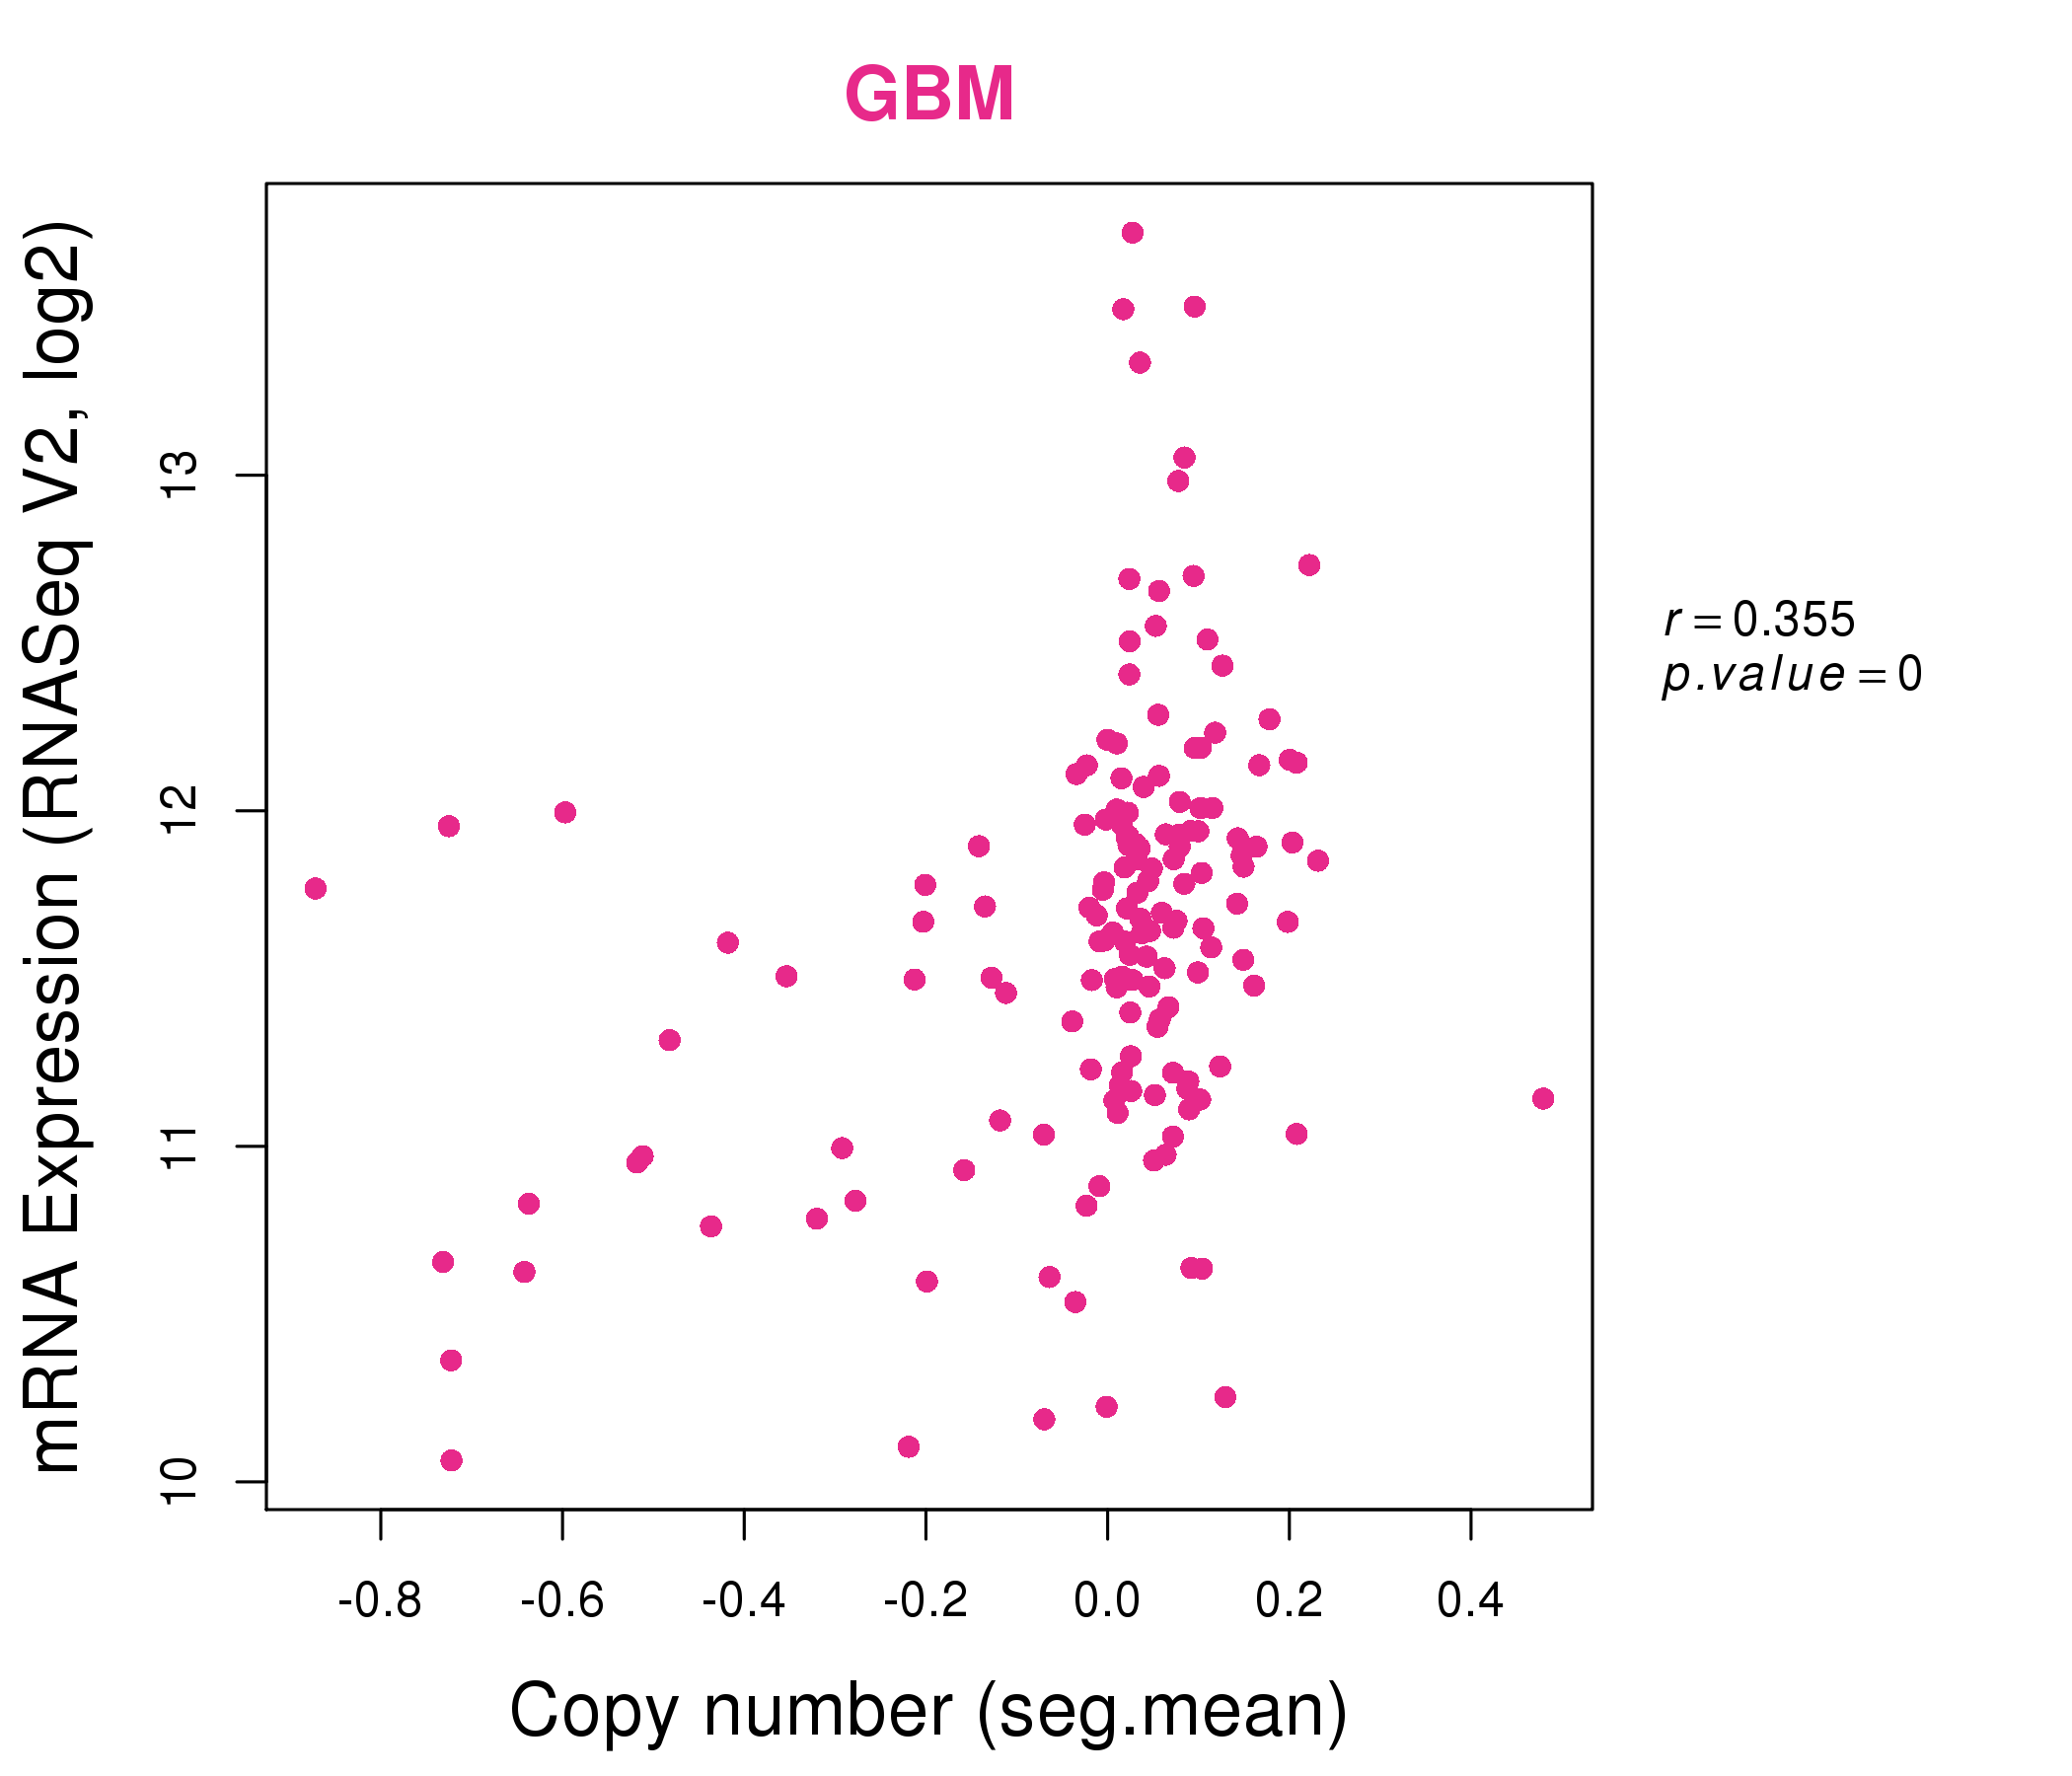
| * Normalized gene expression data of RNASeqV2 was extracted from TCGA using R package TCGA-Assembler. The URLs of all public data files on TCGA DCC data server were gathered at Jan-05-2015. Only eight cancer types have enough normal control samples for differential expression analysis. (t test, adjusted p<0.05 (using Benjamini-Hochberg FDR)) |
 |
| Top |
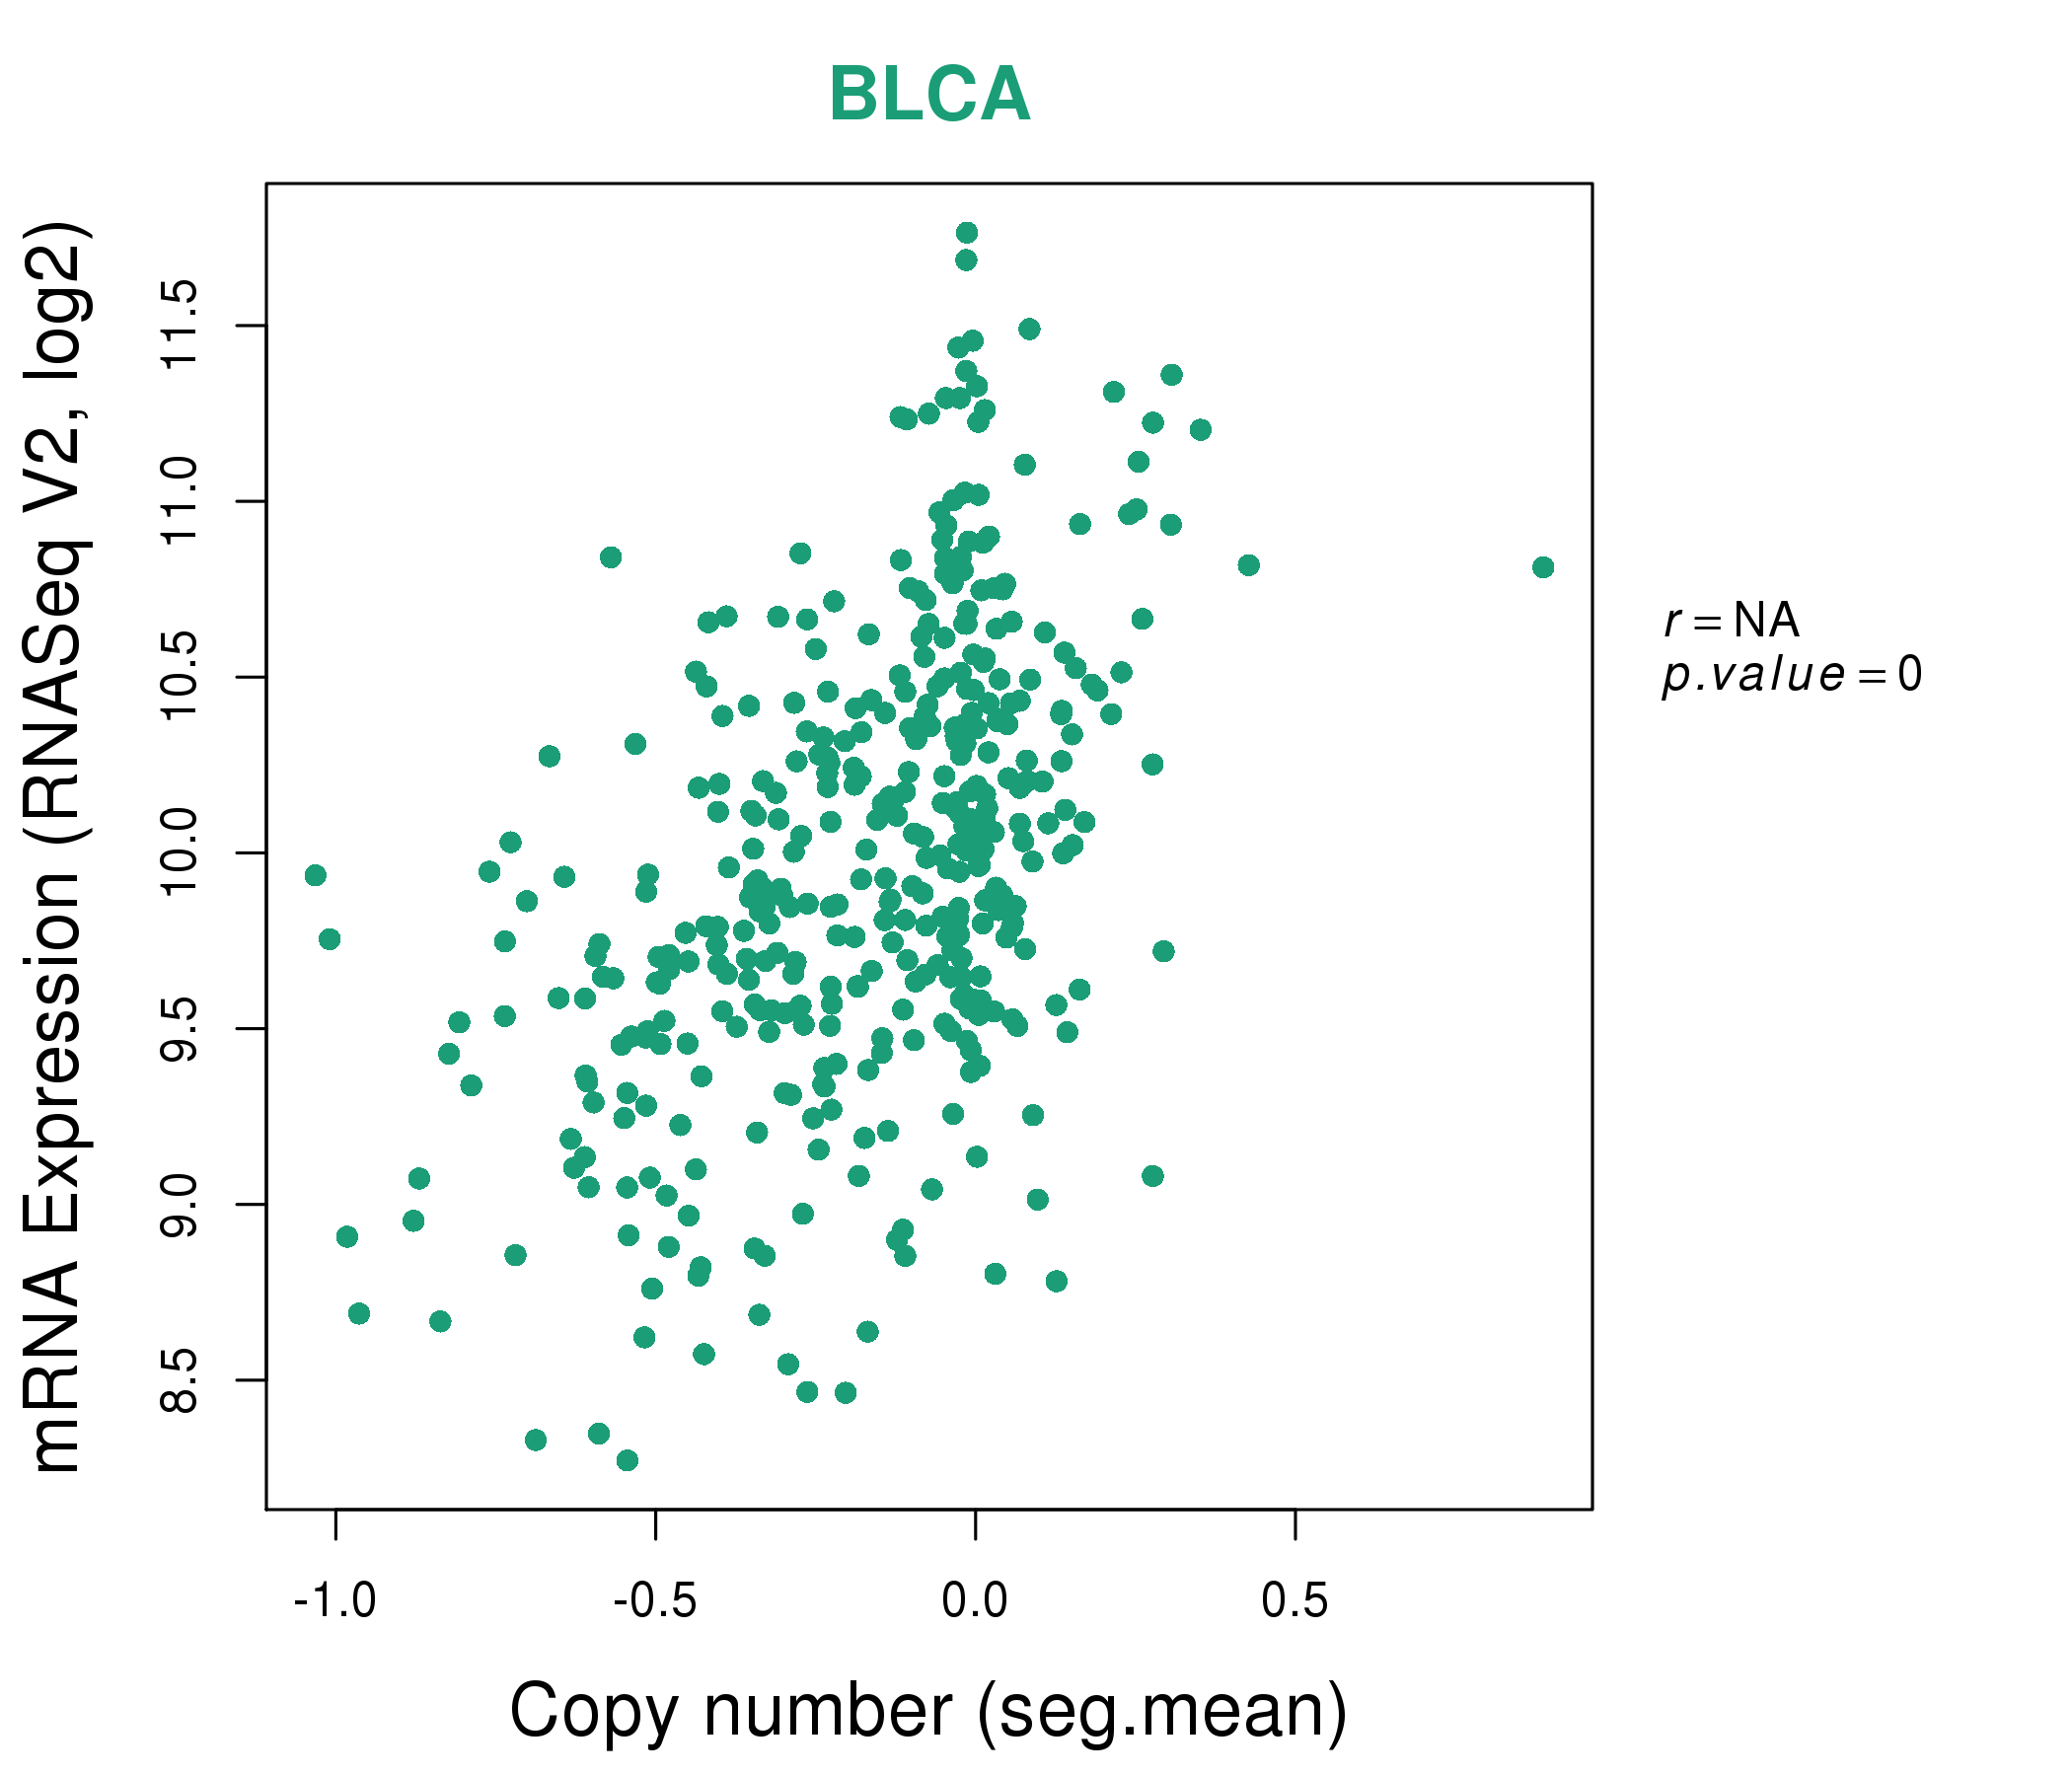
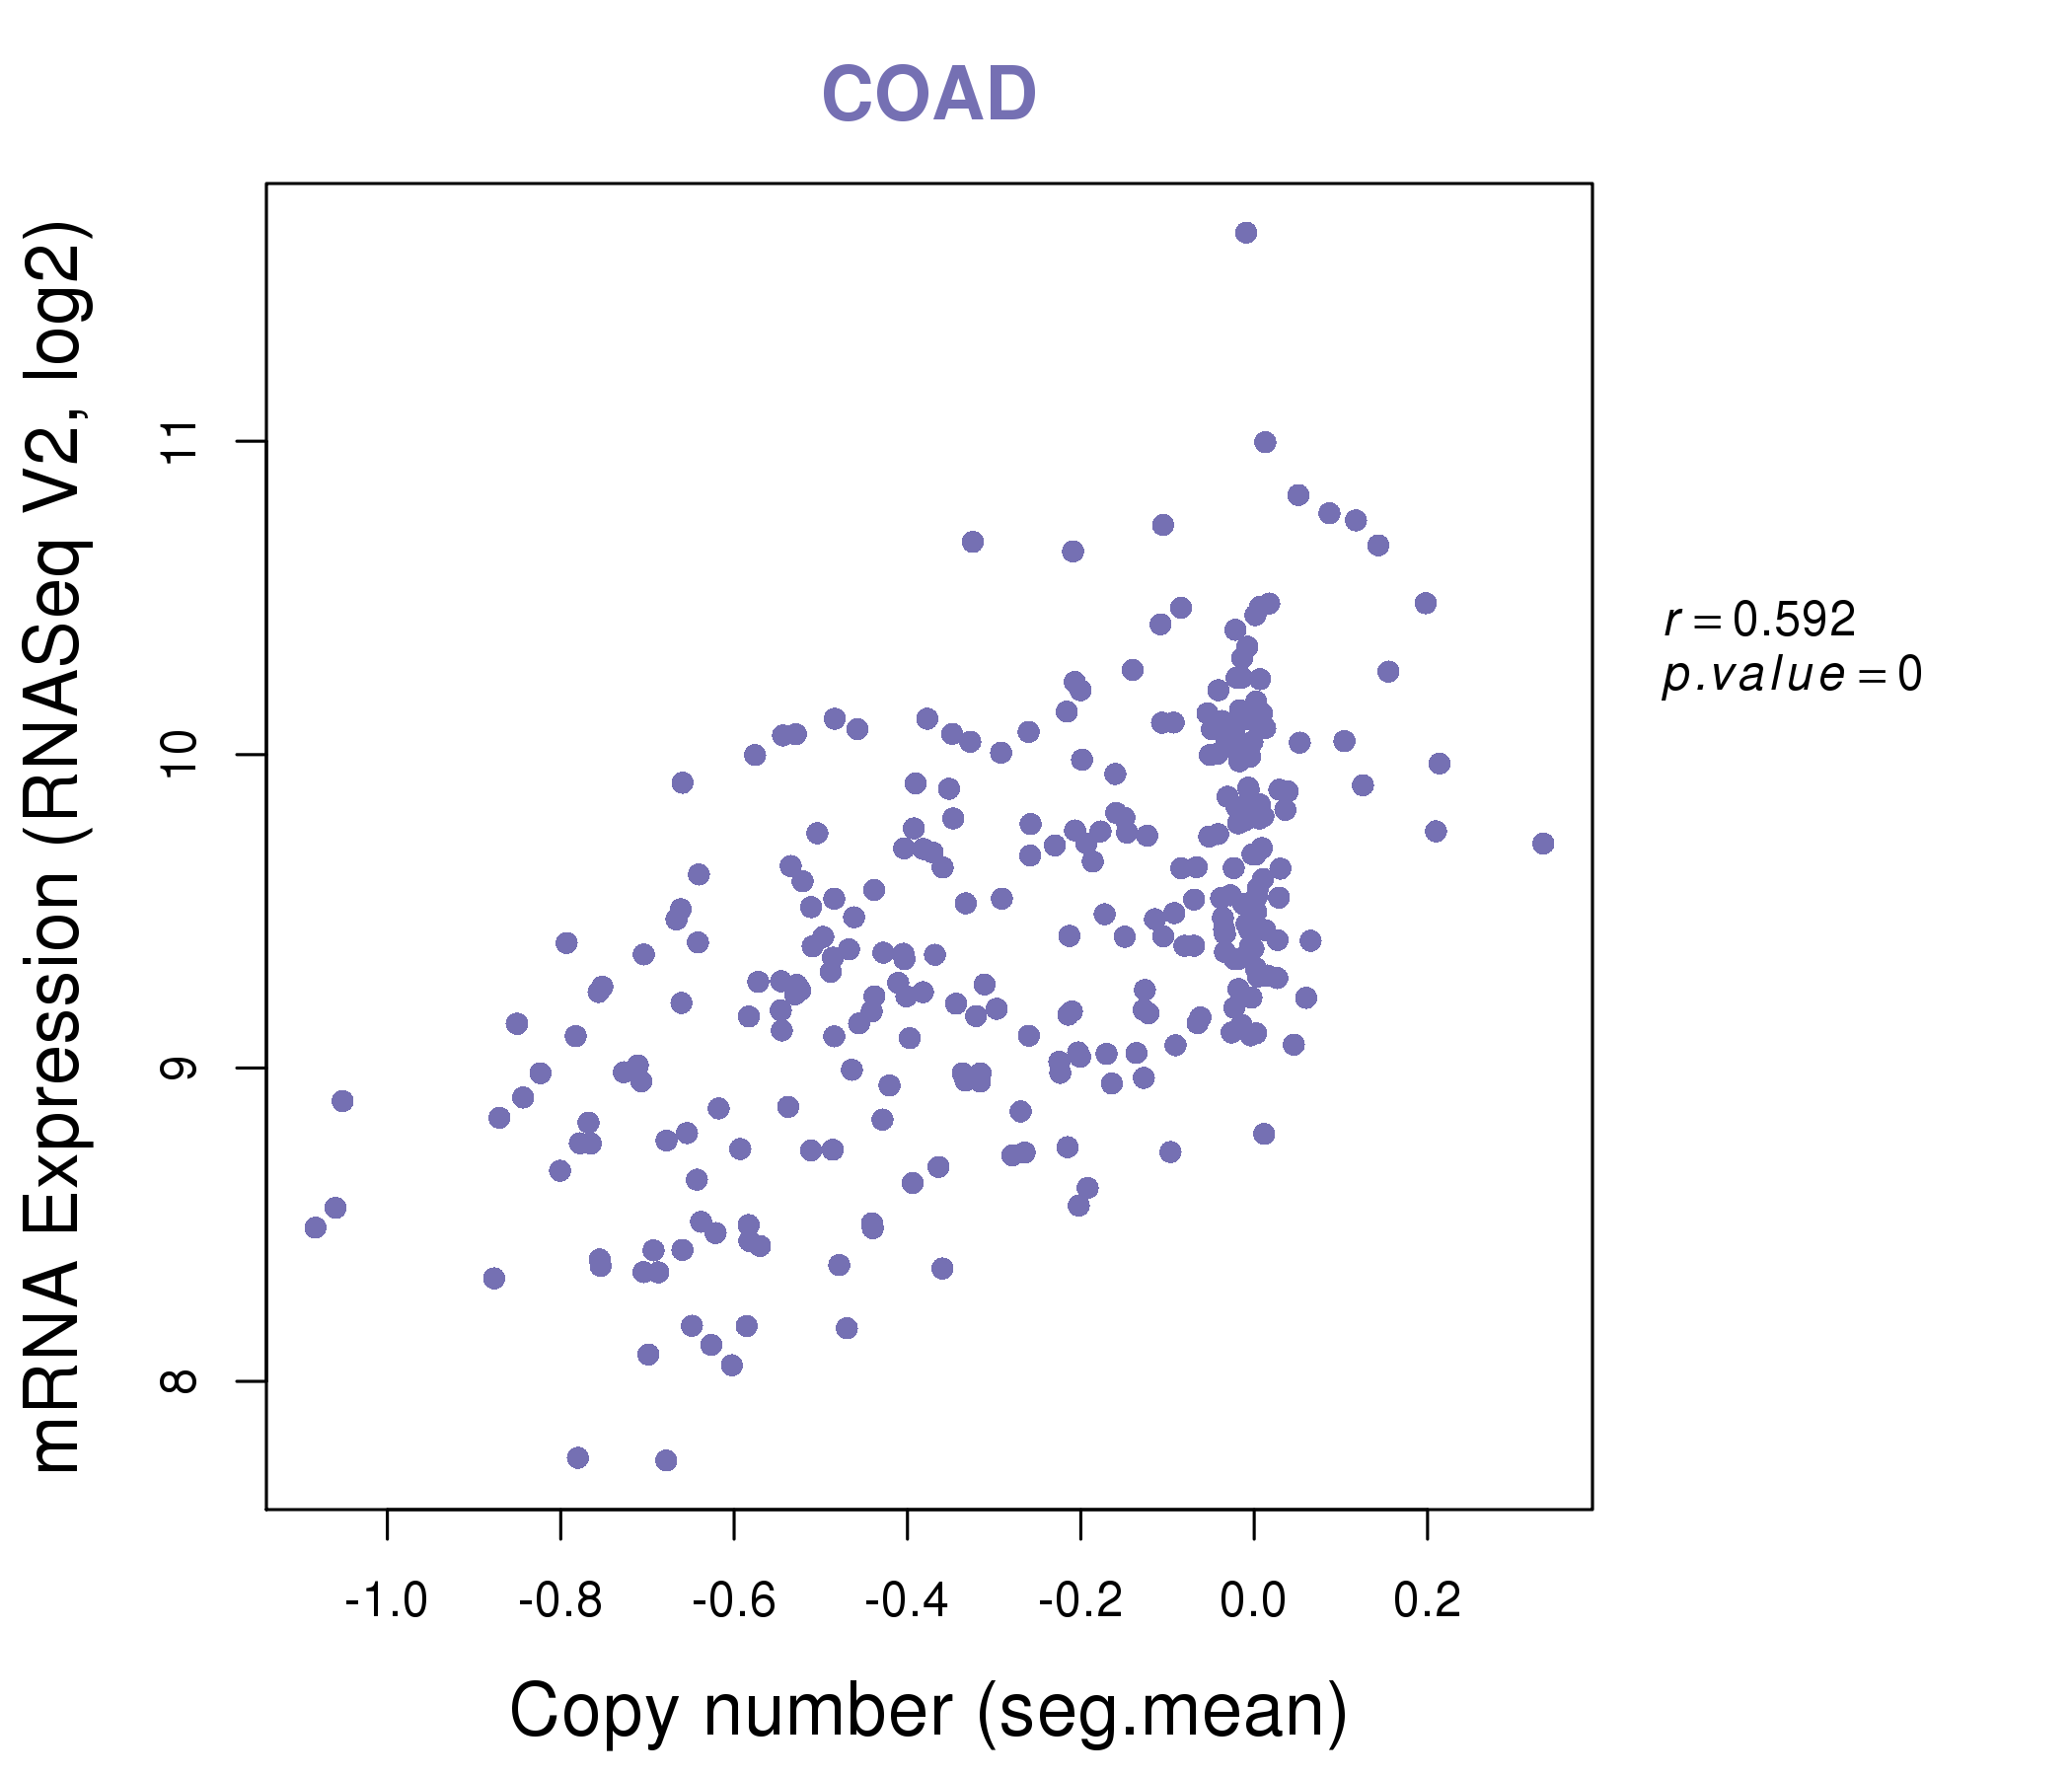
| * This plots show the correlation between CNV and gene expression. |
: Open all plots for all cancer types
 |
|
 |
|
| Top |
| Gene-Gene Network Information |
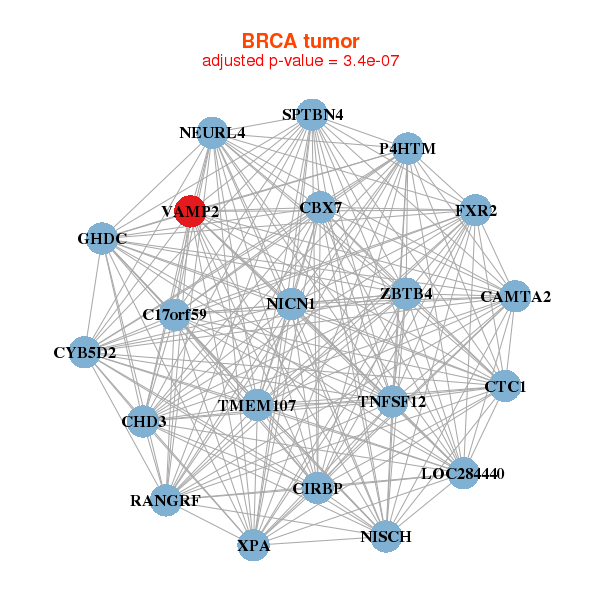
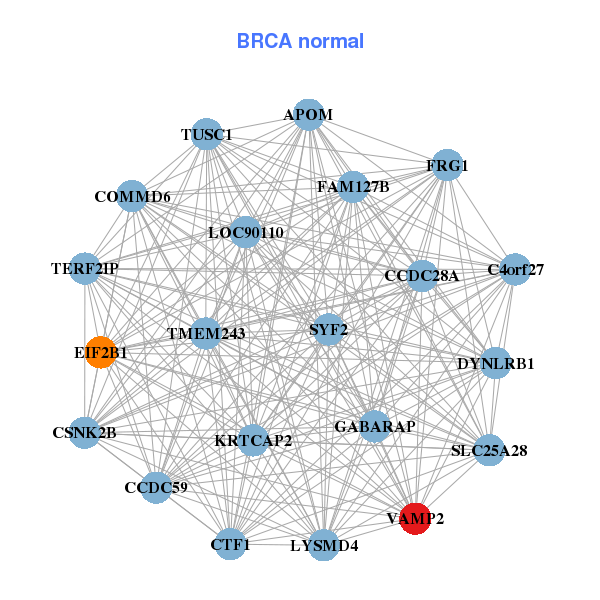
| * Co-Expression network figures were drawn using R package igraph. Only the top 20 genes with the highest correlations were shown. Red circle: input gene, orange circle: cell metabolism gene, sky circle: other gene |
: Open all plots for all cancer types
 |
| ||||
| C17orf59,CTC1,CAMTA2,CBX7,CHD3,CIRBP,CYB5D2, FXR2,GHDC,LOC284440,NEURL4,NICN1,NISCH,P4HTM, RANGRF,SPTBN4,TMEM107,TNFSF12,VAMP2,XPA,ZBTB4 | APOM,C4orf27,TMEM243,CCDC28A,CCDC59,COMMD6,CSNK2B, CTF1,DYNLRB1,EIF2B1,FAM127B,FRG1,GABARAP,KRTCAP2, LOC90110,LYSMD4,SLC25A28,SYF2,TERF2IP,TUSC1,VAMP2 | ||||
 |
| ||||
| ASAP3,CBX7,CCPG1,DPYD,GABARAPL1,LGI2,NDEL1, PAFAH1B1,PALM,PLSCR4,PPM1K,RNF122,RNF144B,SLC9A9, SMG6,SRPX,SYNE1,SYT15,TNFSF12,VAMP2,ZBTB4 | BBS1,MAATS1,CALCOCO1,CAMK2A,EZH1,FOXF1,GDI1, GREM2,KLC1,LGI3,LOC158696,LOC92973,MAGED4B,MPL, LINC00087,PBXIP1,SEPT5,VAMP2,ZNF548,ZRANB1,ZSCAN18 |
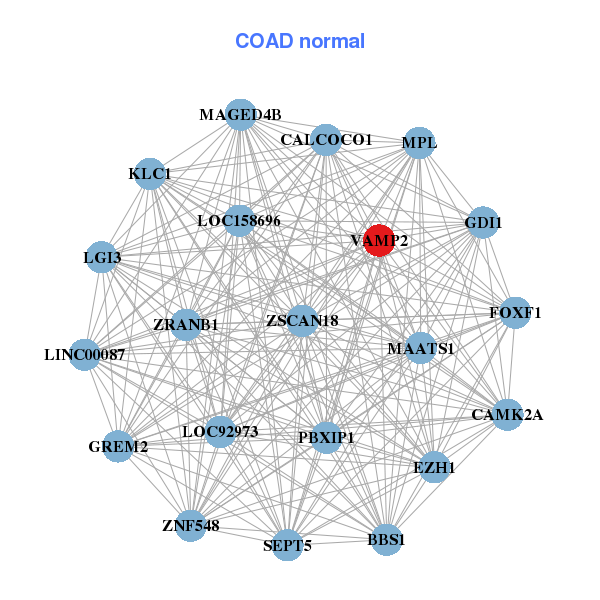
| * Co-Expression network figures were drawn using R package igraph. Only the top 20 genes with the highest correlations were shown. Red circle: input gene, orange circle: cell metabolism gene, sky circle: other gene |
: Open all plots for all cancer types
| Top |
: Open all interacting genes' information including KEGG pathway for all interacting genes from DAVID
| Top |
| Pharmacological Information for VAMP2 |
| DB Category | DB Name | DB's ID and Url link |
| * Gene Centered Interaction Network. |
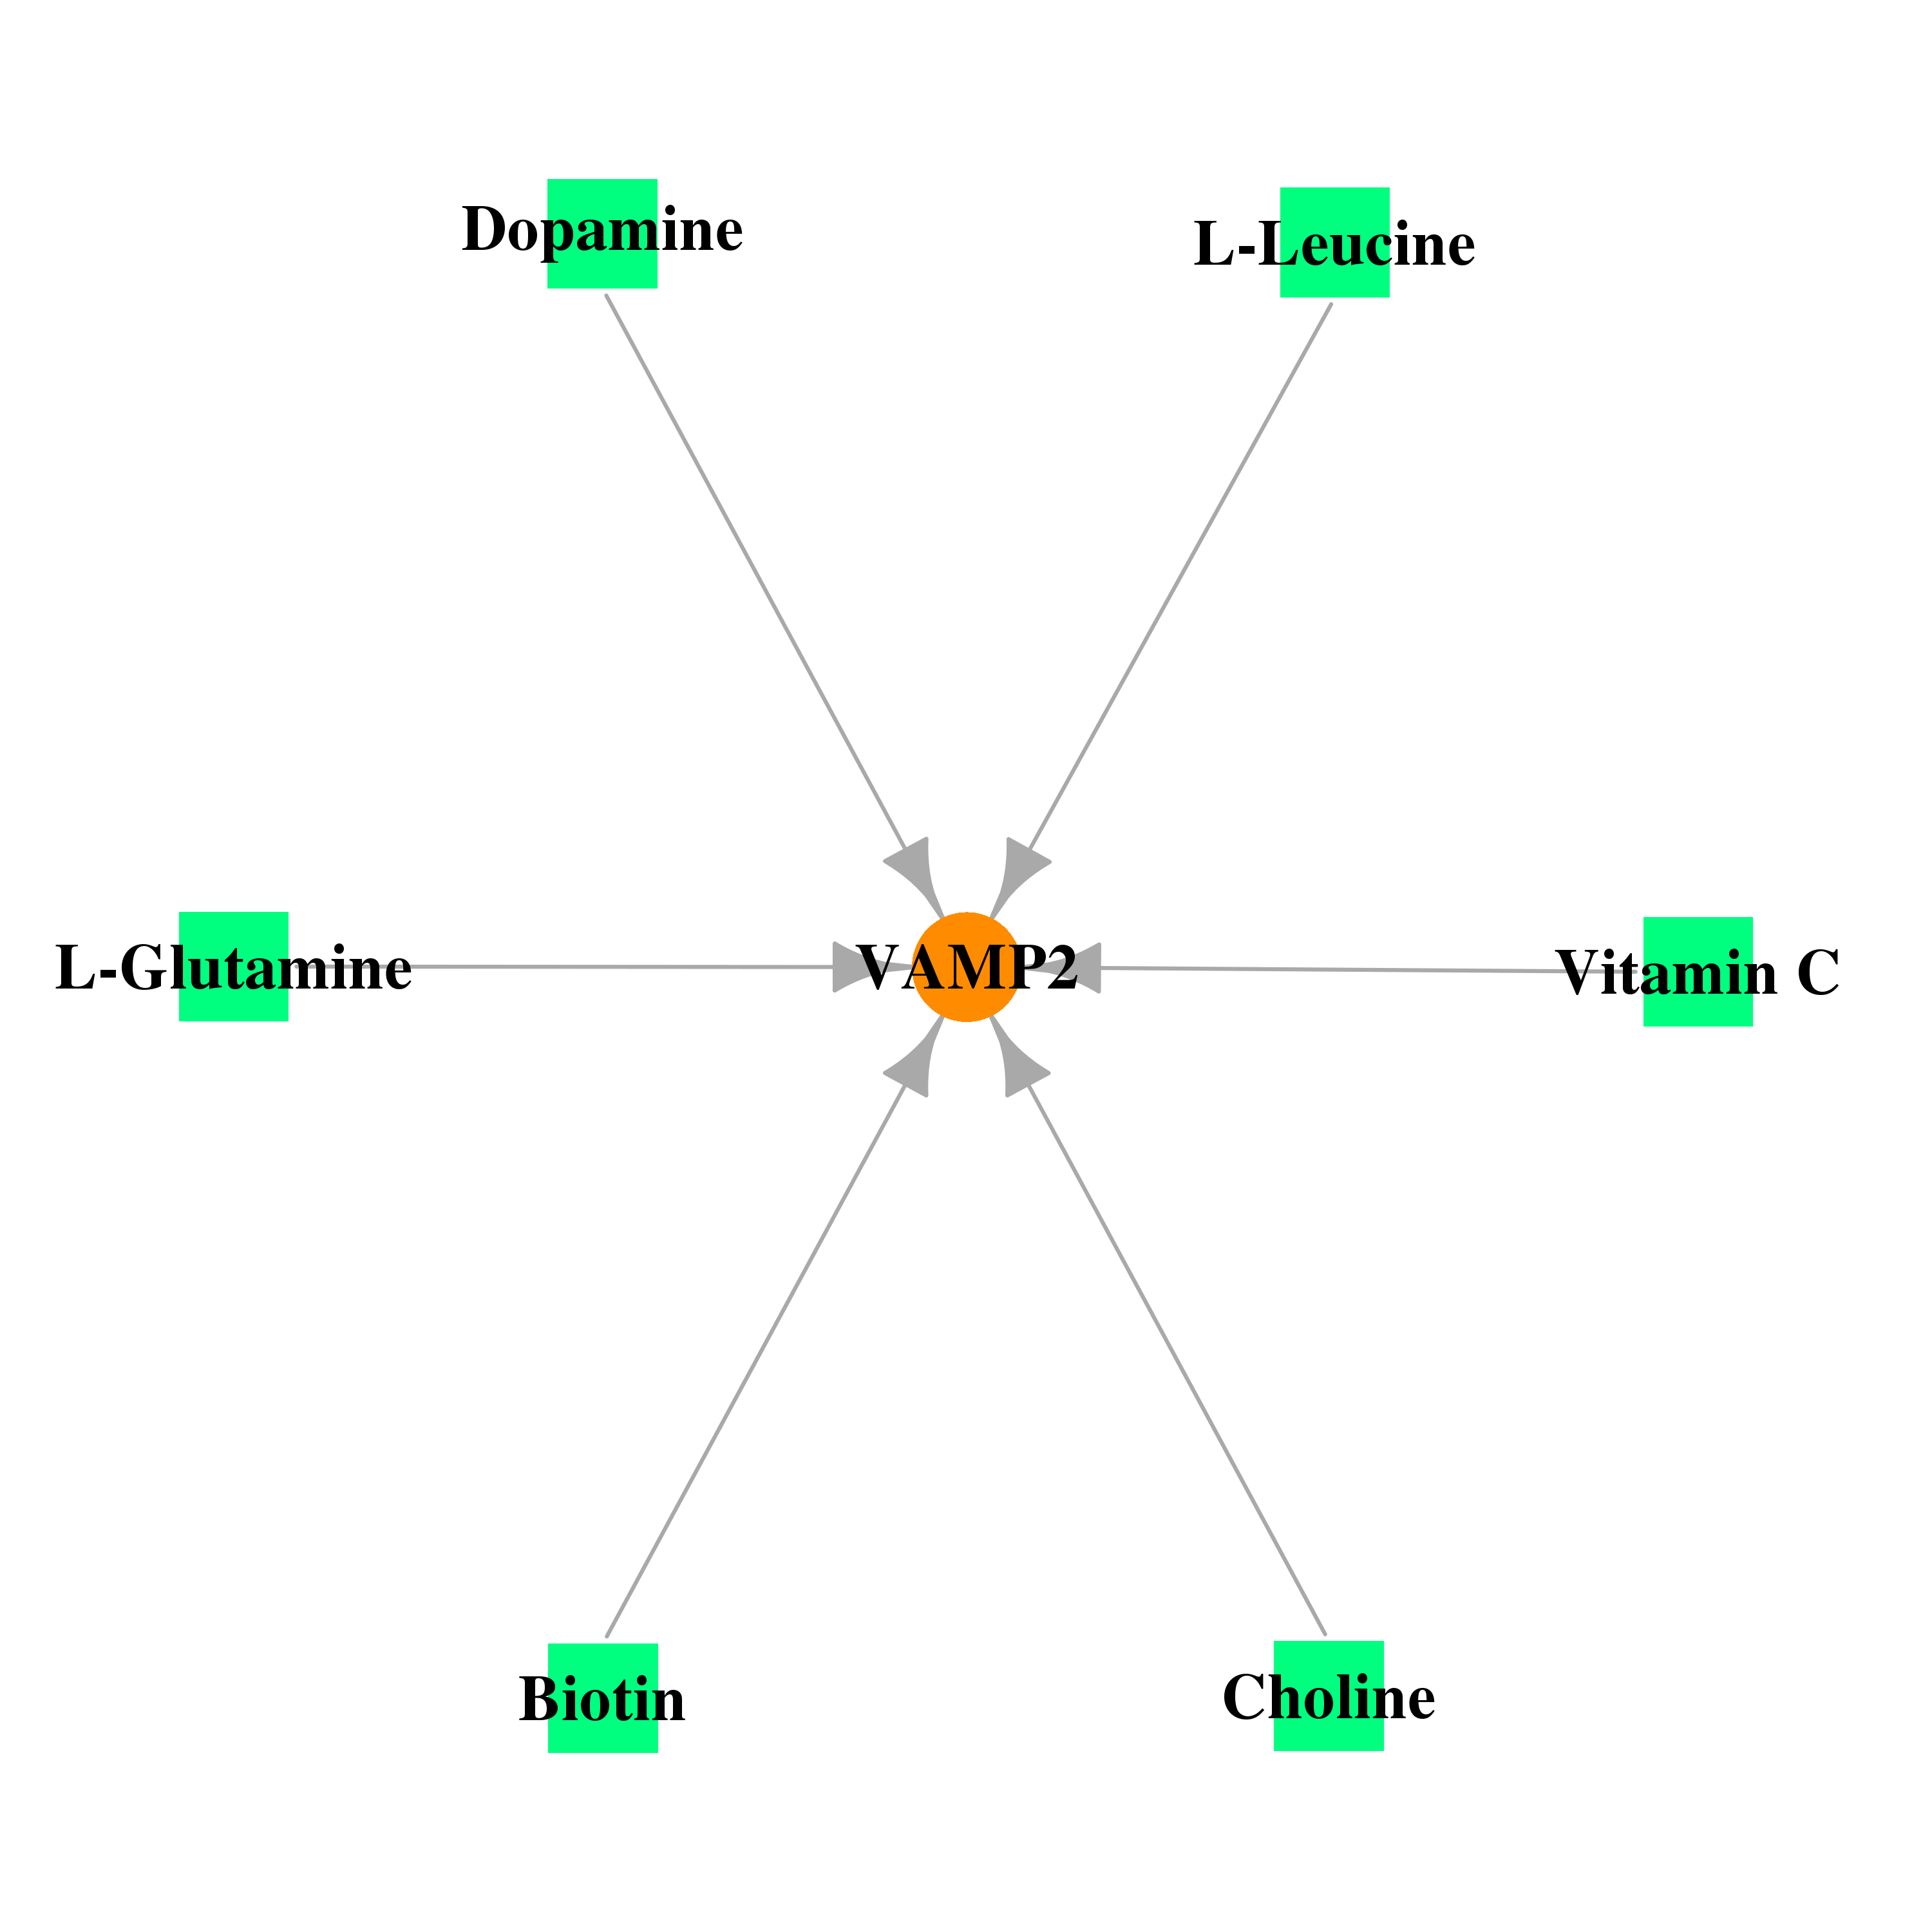 |
| * Drug Centered Interaction Network. |
| DrugBank ID | Target Name | Drug Groups | Generic Name | Drug Centered Network | Drug Structure |
| DB00126 | vesicle-associated membrane protein 2 (synaptobrevin 2) | approved; nutraceutical | Vitamin C | 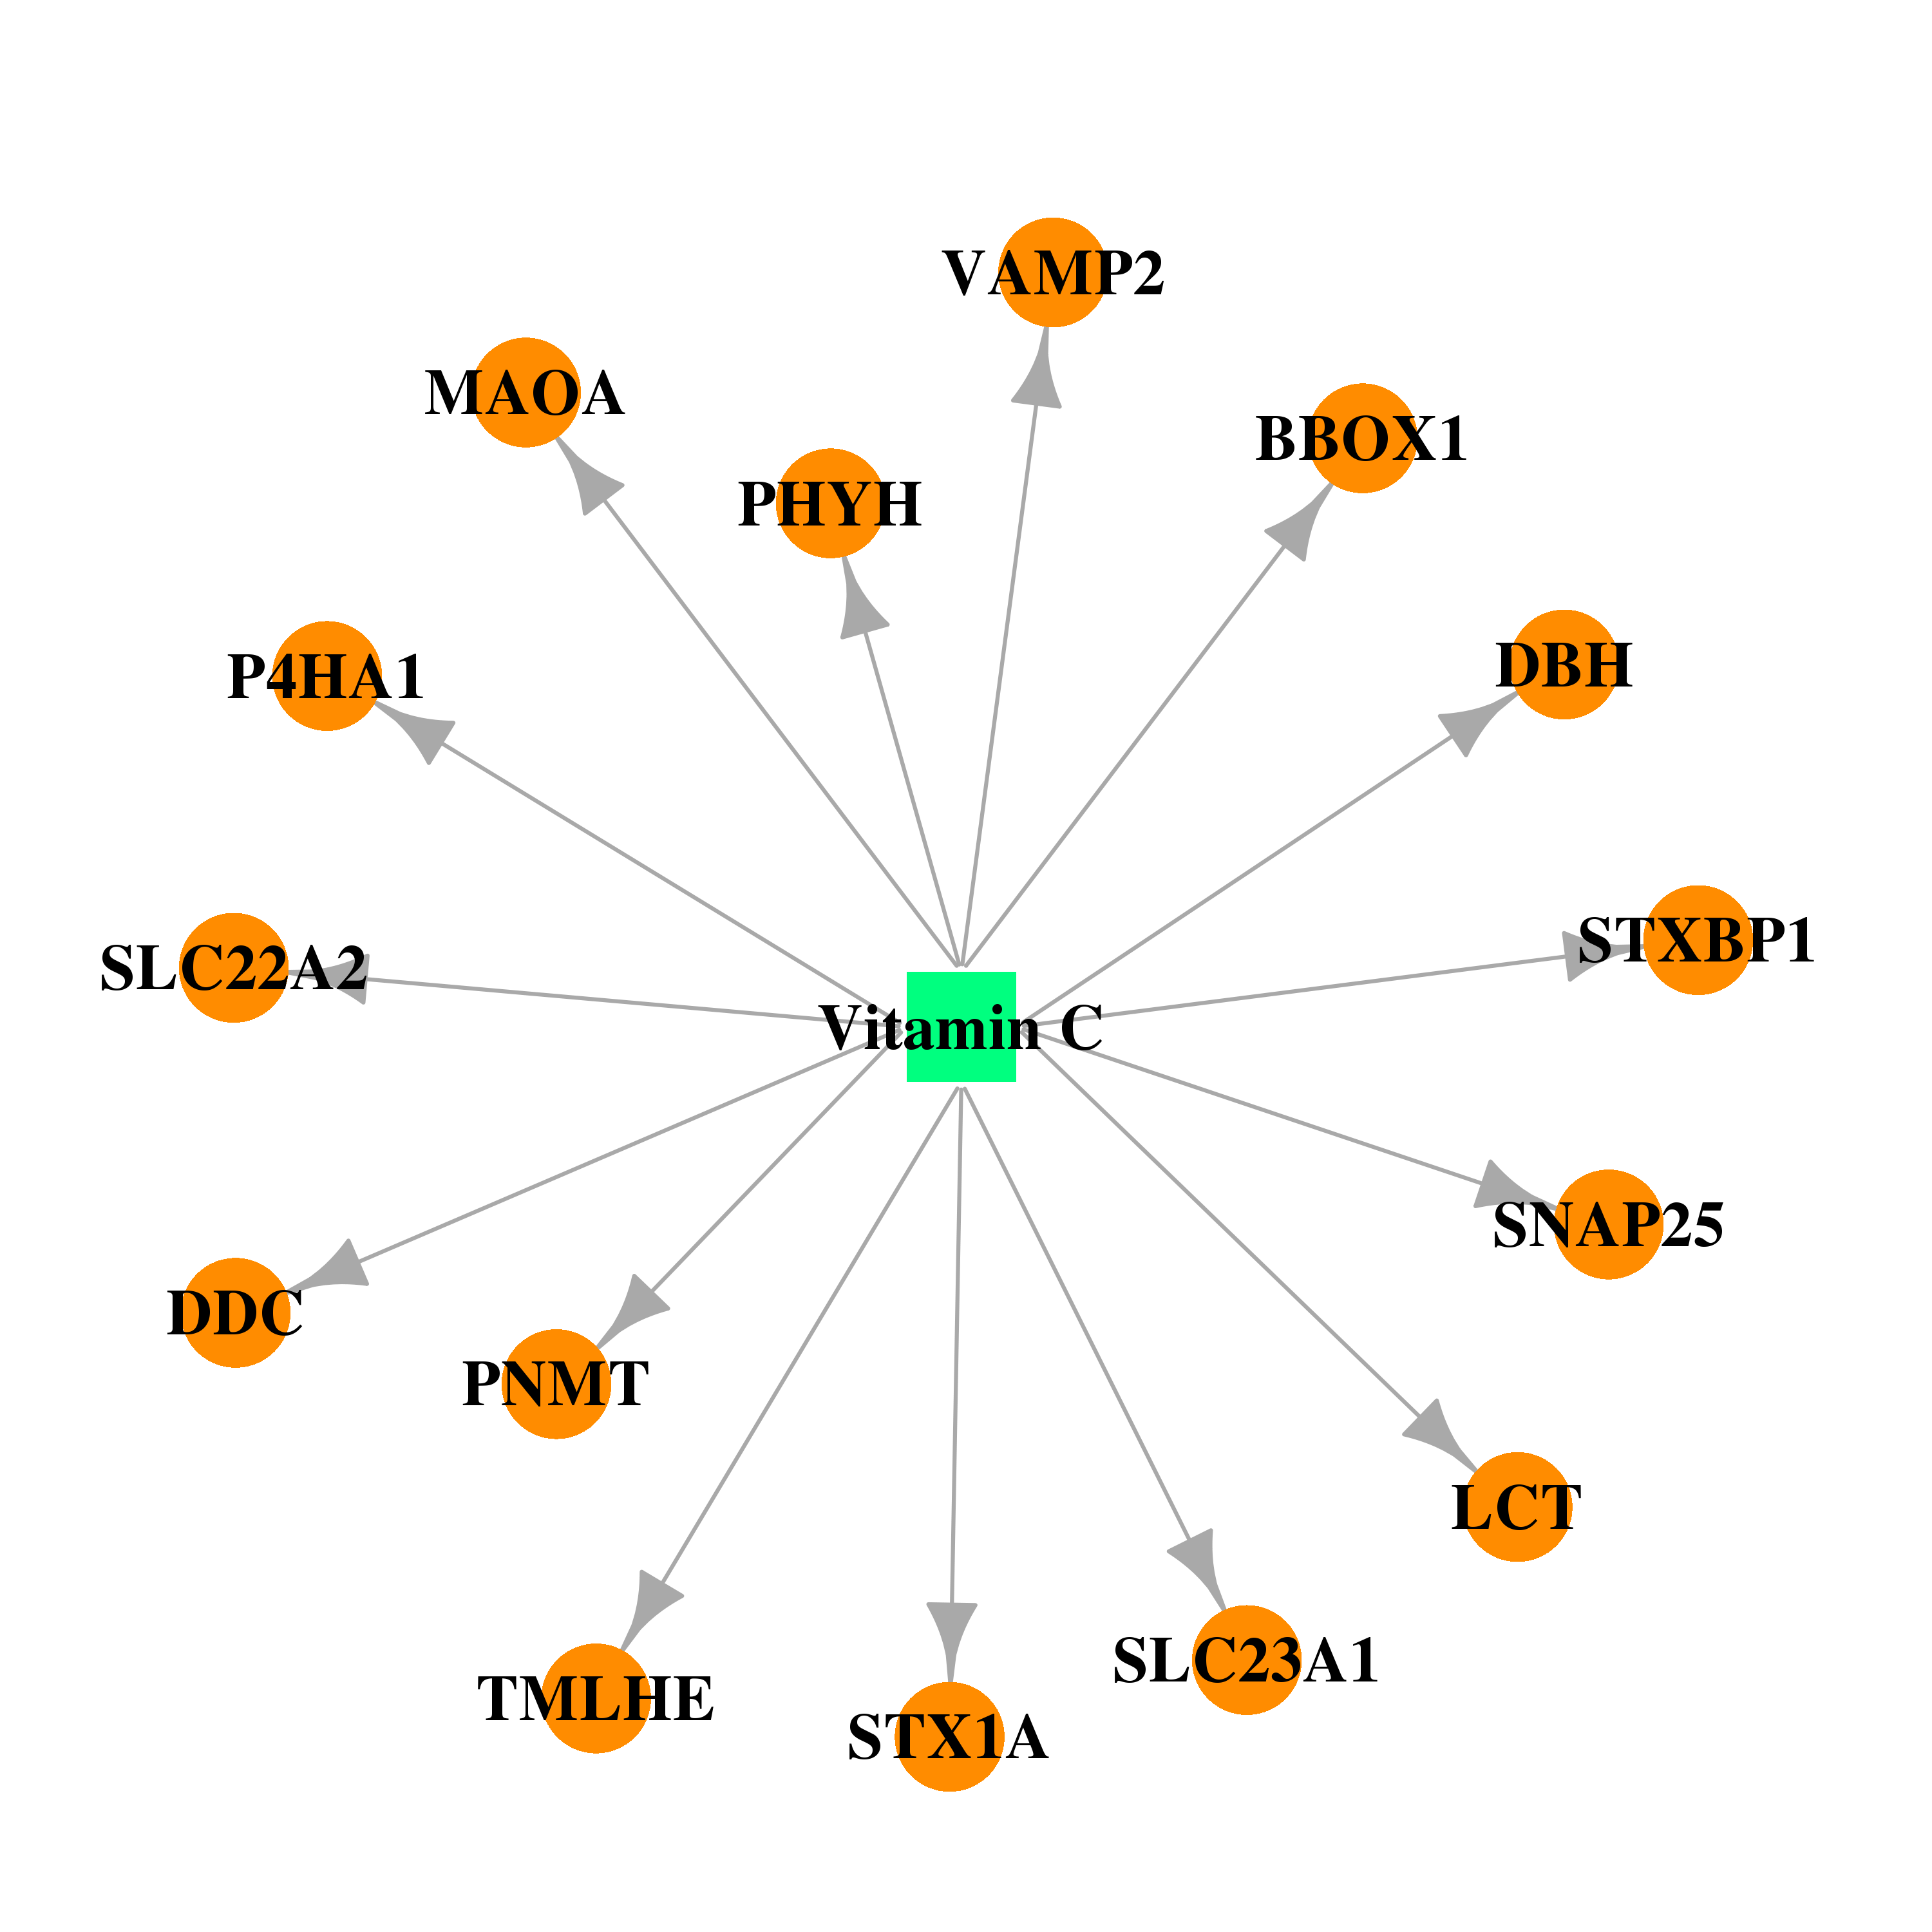 | 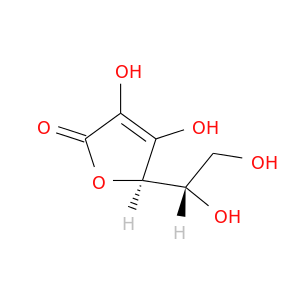 |
| DB00121 | vesicle-associated membrane protein 2 (synaptobrevin 2) | approved; nutraceutical | Biotin | 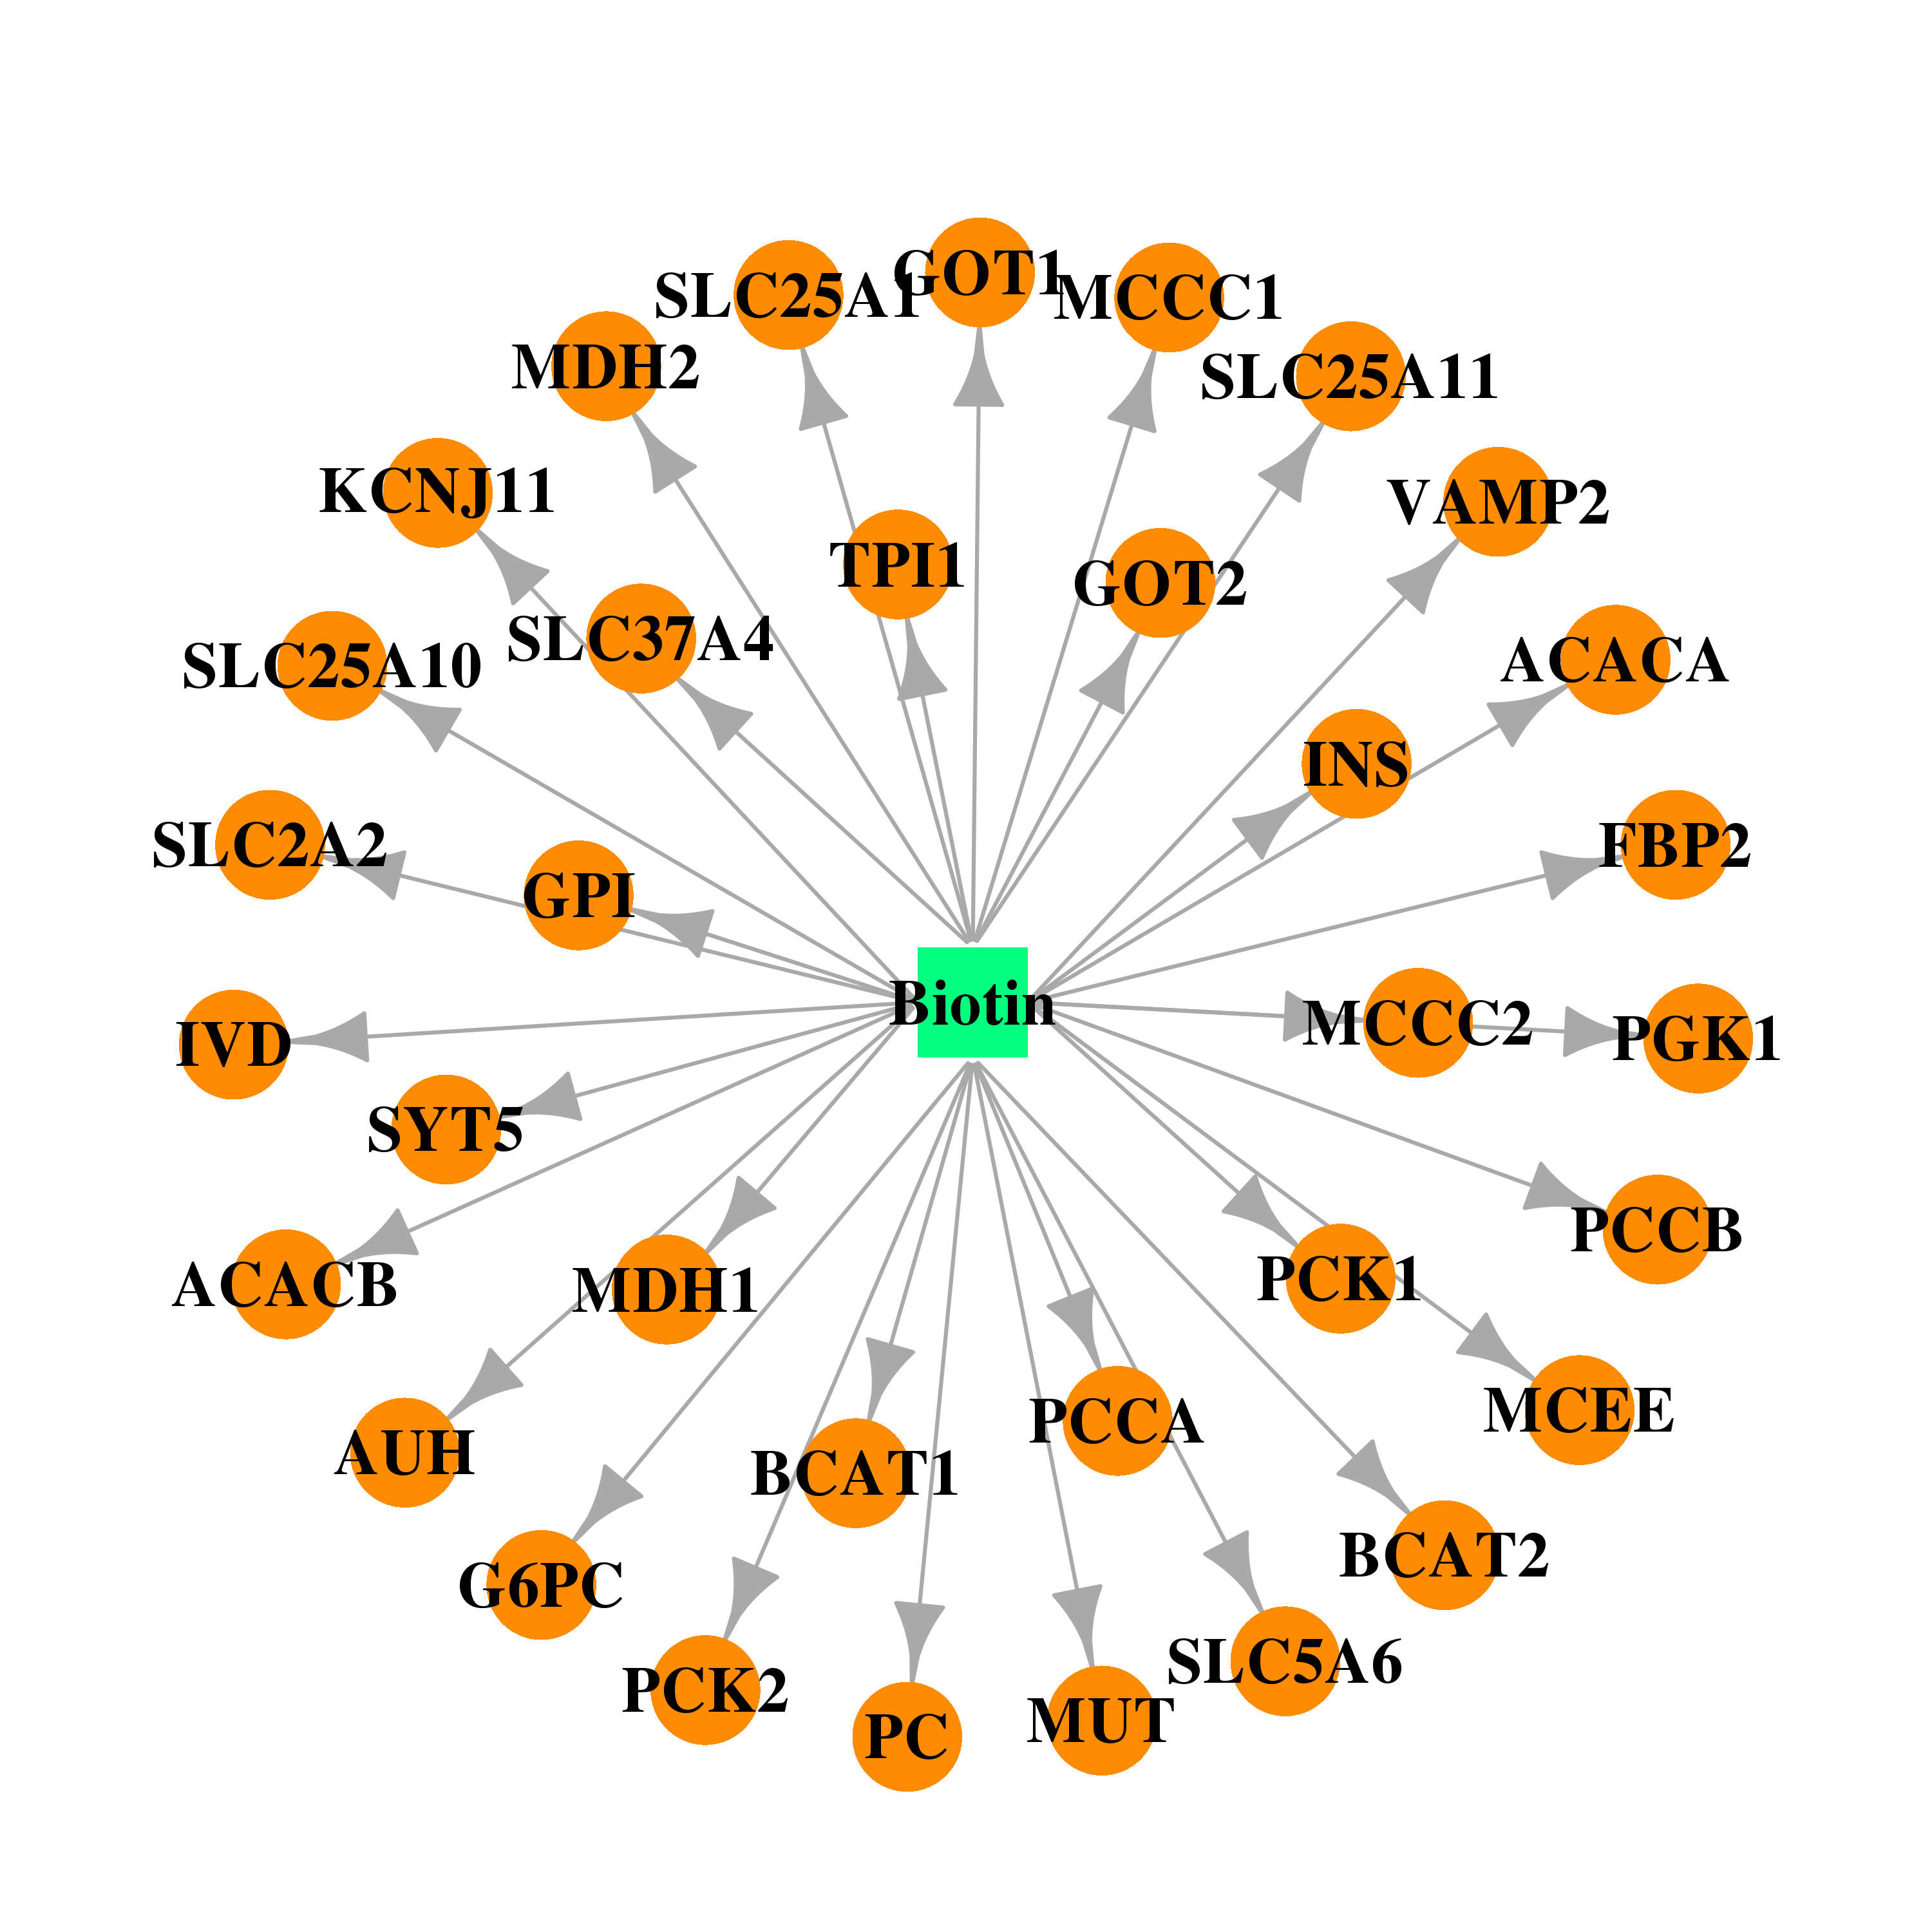 | 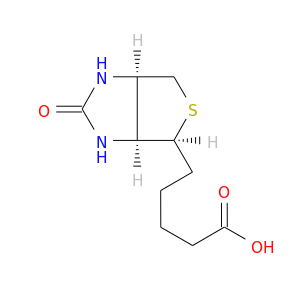 |
| DB00130 | vesicle-associated membrane protein 2 (synaptobrevin 2) | approved; nutraceutical; investigational | L-Glutamine |  |  |
| DB00149 | vesicle-associated membrane protein 2 (synaptobrevin 2) | approved; nutraceutical | L-Leucine | 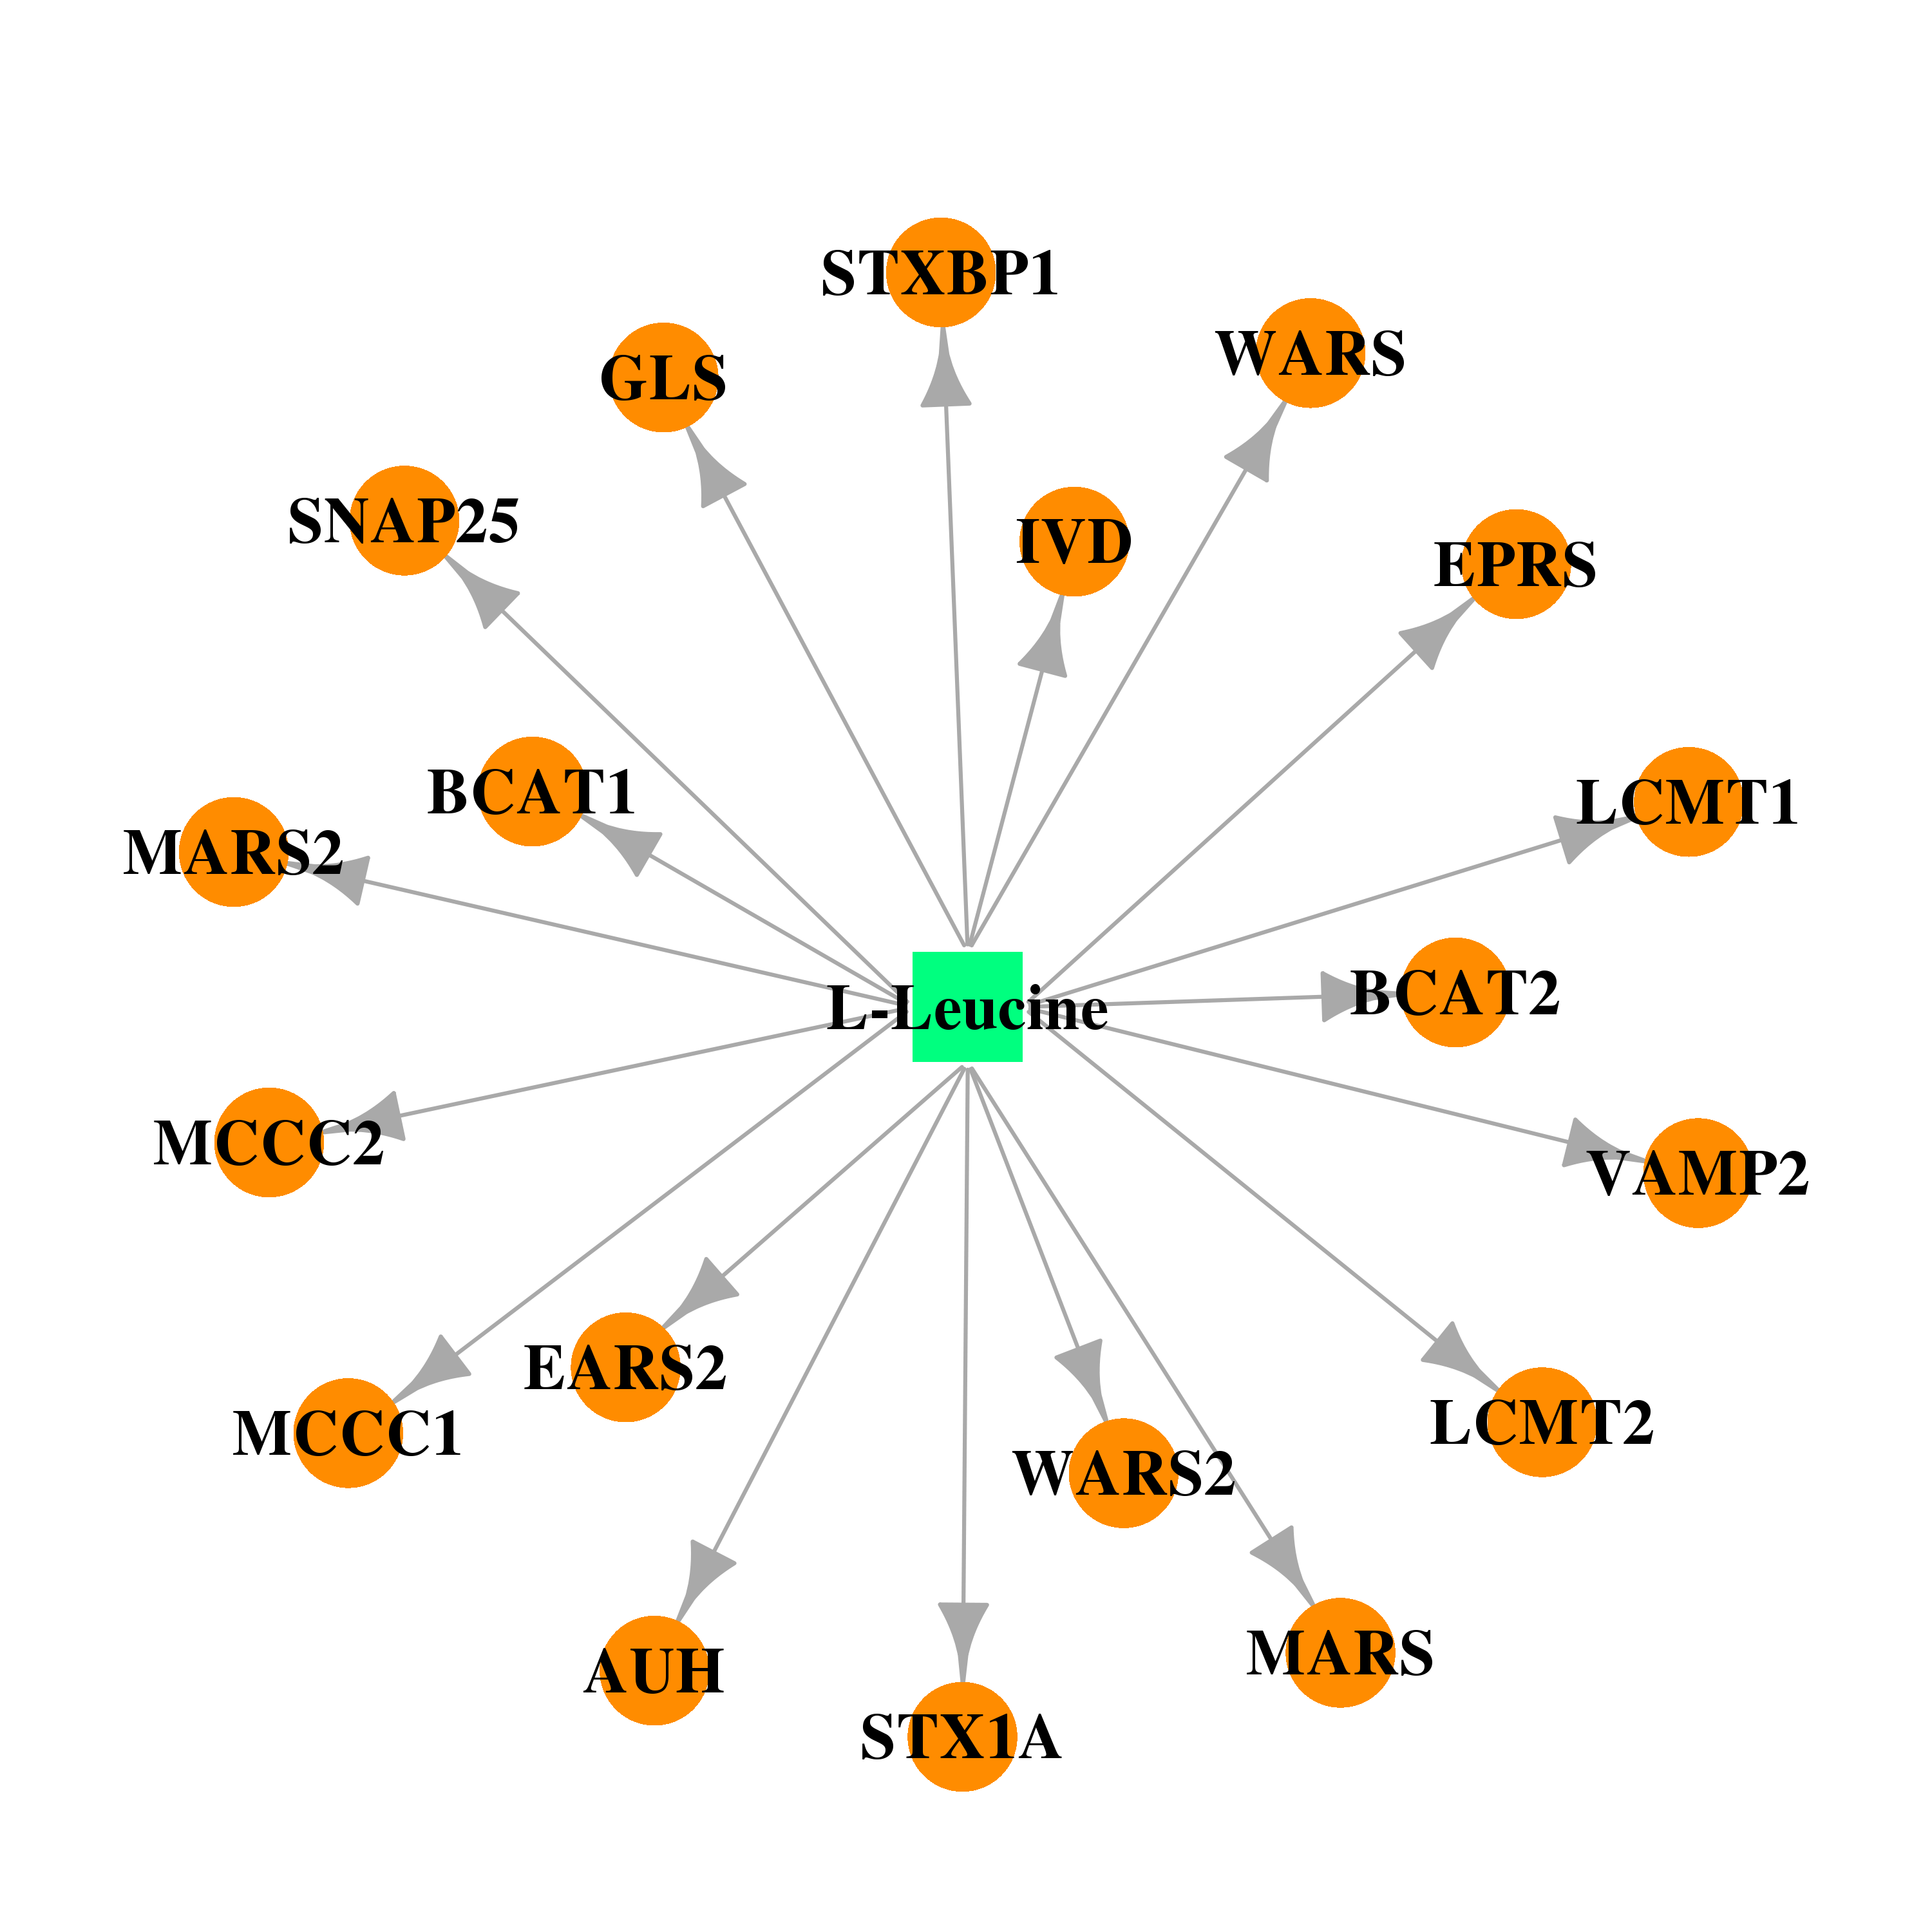 |  |
| DB00122 | vesicle-associated membrane protein 2 (synaptobrevin 2) | approved; nutraceutical | Choline | 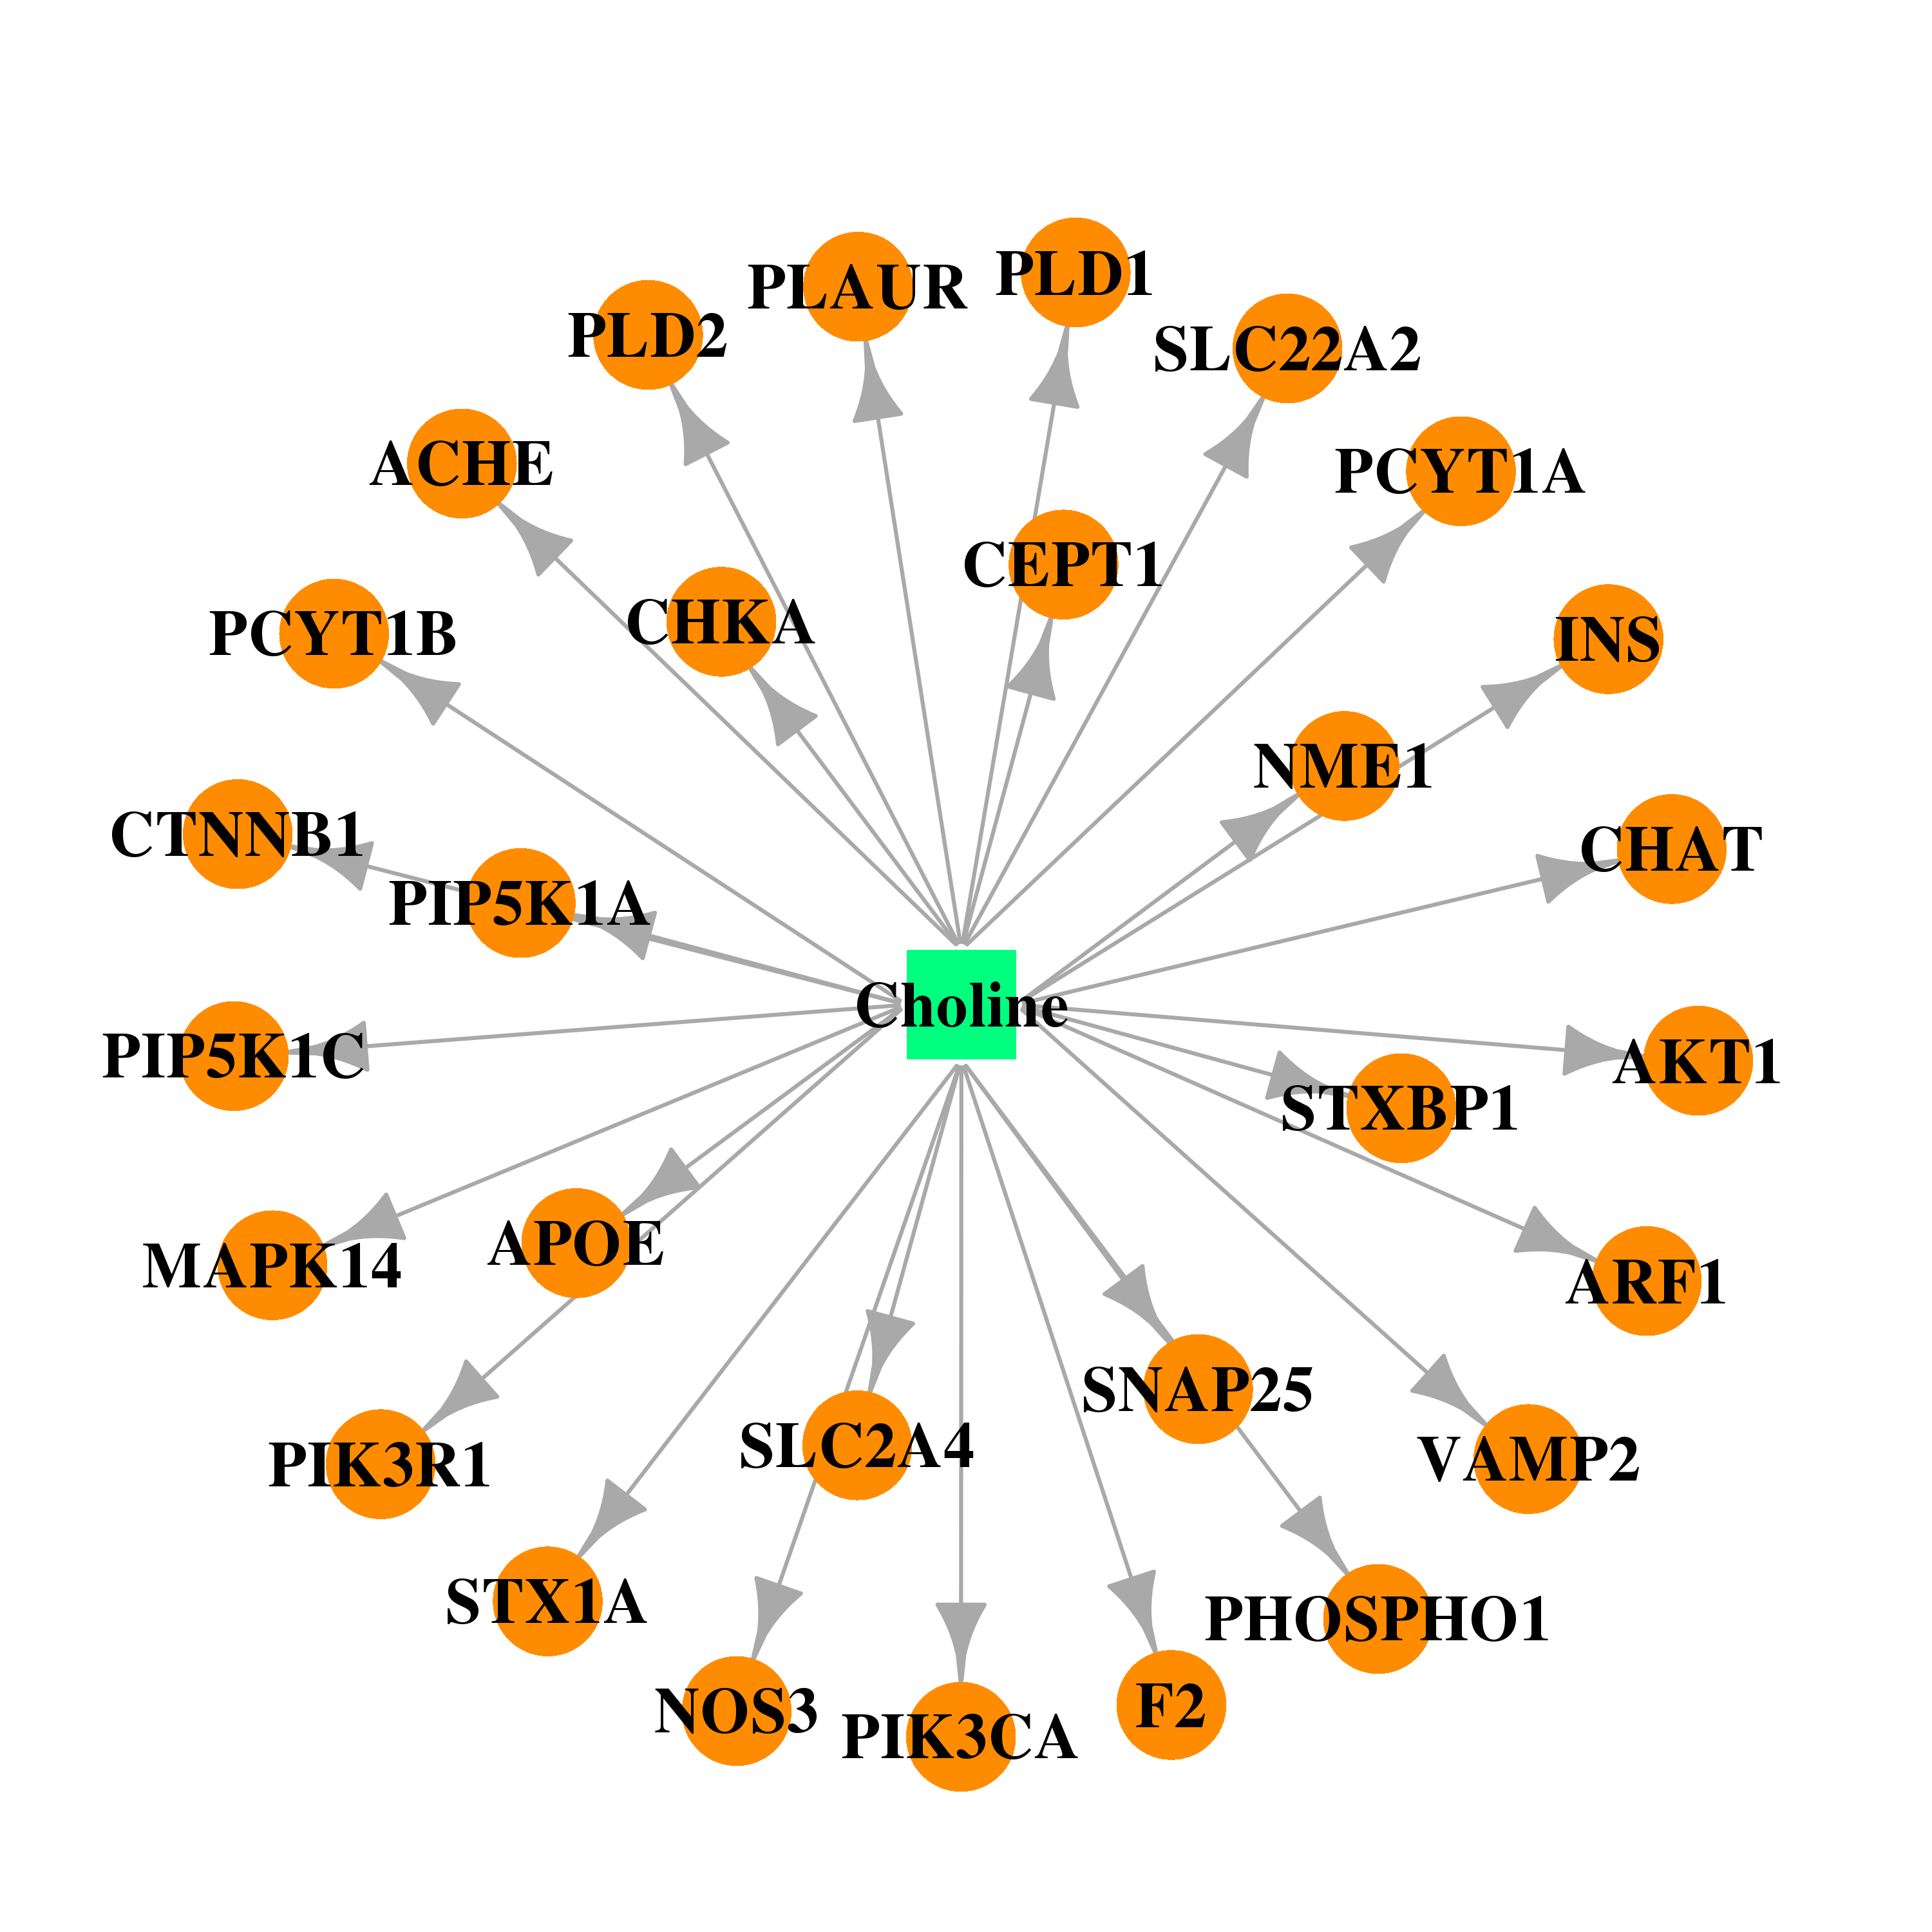 |  |
| DB00988 | vesicle-associated membrane protein 2 (synaptobrevin 2) | approved | Dopamine | 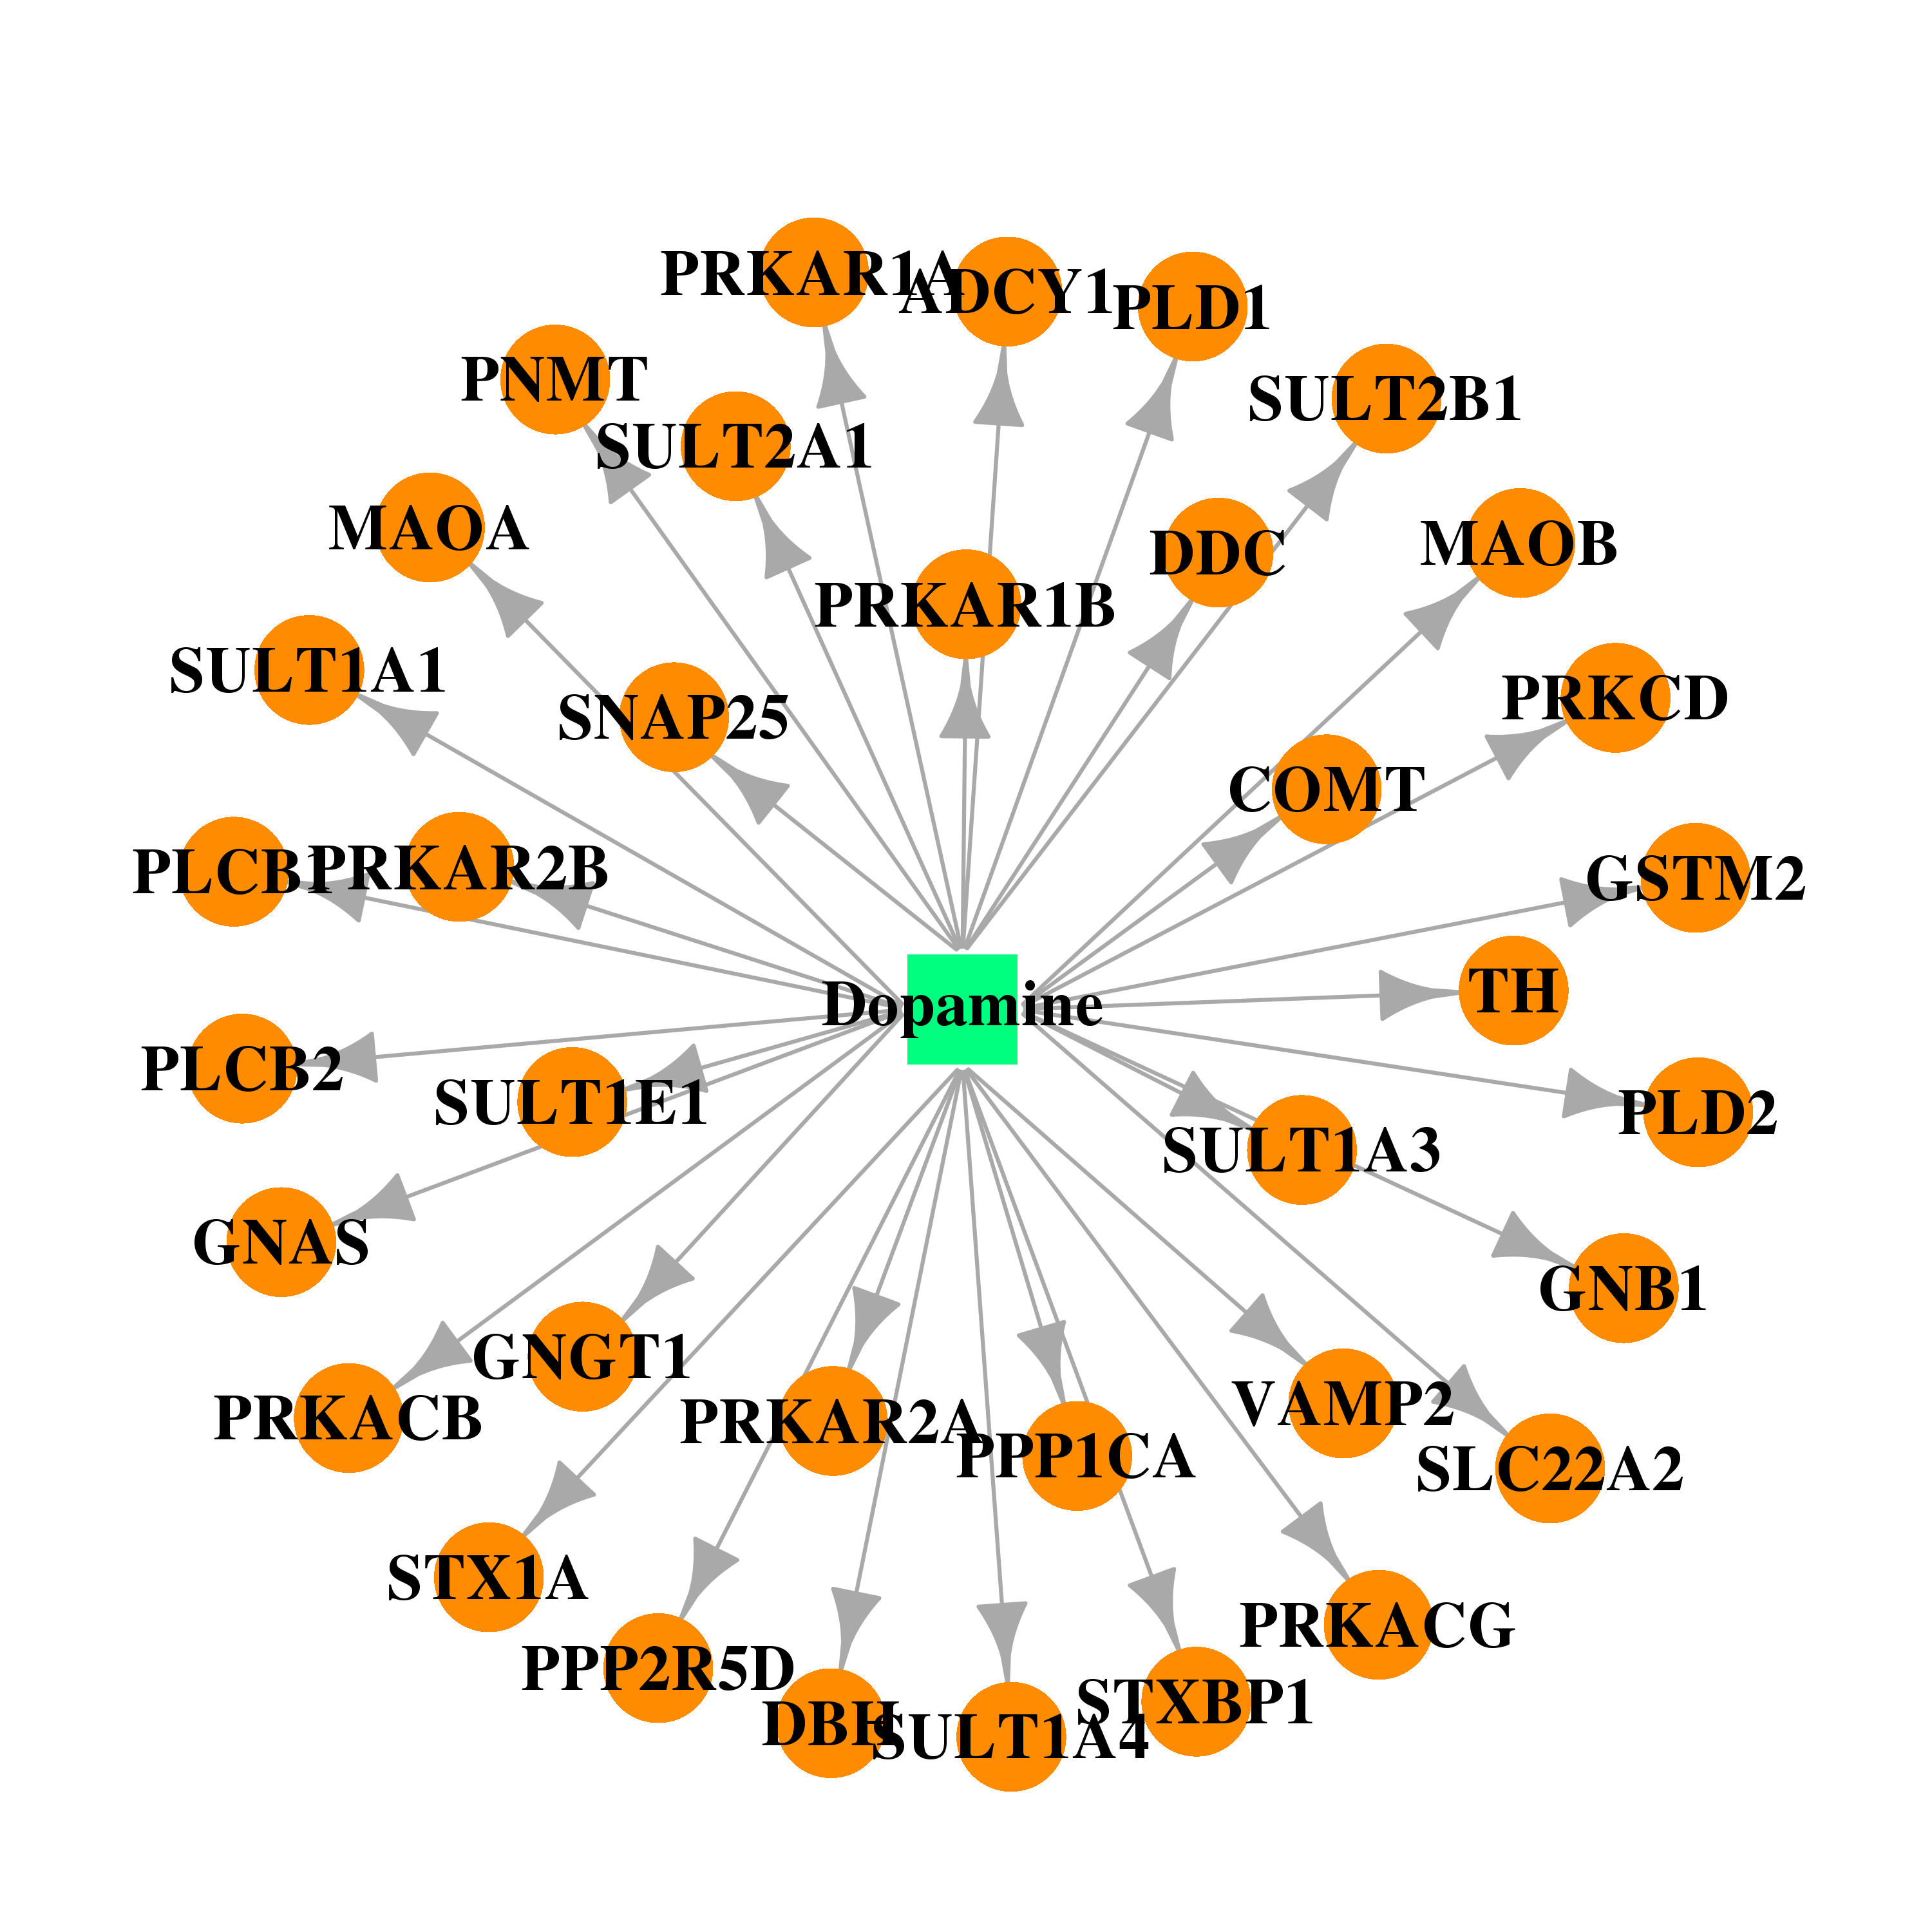 |  |
| Top |
| Cross referenced IDs for VAMP2 |
| * We obtained these cross-references from Uniprot database. It covers 150 different DBs, 18 categories. http://www.uniprot.org/help/cross_references_section |
: Open all cross reference information
|
Copyright © 2016-Present - The Univsersity of Texas Health Science Center at Houston @ |