|
||||||||||||||||||||
| |
| Phenotypic Information (metabolism pathway, cancer, disease, phenome) |
| |
| |
| Gene-Gene Network Information: Co-Expression Network, Interacting Genes & KEGG |
| |
|


| Gene Summary for SYT5 |
| Basic gene info. | Gene symbol | SYT5 |
| Gene name | synaptotagmin V | |
| Synonyms | - | |
| Cytomap | UCSC genome browser: 19q13.42|11p | |
| Genomic location | chr19 :55684468-55691720 | |
| Type of gene | protein-coding | |
| RefGenes | NM_001297774.1, NM_003180.2, | |
| Ensembl id | ENSG00000129990 | |
| Description | synaptotagmin 5synaptotagmin-5sytV | |
| Modification date | 20141207 | |
| dbXrefs | MIM : 600782 | |
| HGNC : HGNC | ||
| HPRD : 02870 | ||
| Protein | UniProt: go to UniProt's Cross Reference DB Table | |
| Expression | CleanEX: HS_SYT5 | |
| BioGPS: 6861 | ||
| Gene Expression Atlas: ENSG00000129990 | ||
| The Human Protein Atlas: ENSG00000129990 | ||
| Pathway | NCI Pathway Interaction Database: SYT5 | |
| KEGG: SYT5 | ||
| REACTOME: SYT5 | ||
| ConsensusPathDB | ||
| Pathway Commons: SYT5 | ||
| Metabolism | MetaCyc: SYT5 | |
| HUMANCyc: SYT5 | ||
| Regulation | Ensembl's Regulation: ENSG00000129990 | |
| miRBase: chr19 :55,684,468-55,691,720 | ||
| TargetScan: NM_001297774 | ||
| cisRED: ENSG00000129990 | ||
| Context | iHOP: SYT5 | |
| cancer metabolism search in PubMed: SYT5 | ||
| UCL Cancer Institute: SYT5 | ||
| Assigned class in ccmGDB | C | |
| Top |
| Phenotypic Information for SYT5(metabolism pathway, cancer, disease, phenome) |
| Cancer | CGAP: SYT5 |
| Familial Cancer Database: SYT5 | |
| * This gene is included in those cancer gene databases. |
|
|
|
|
|
| . | ||||||||||||||
Oncogene 1 | Significant driver gene in | |||||||||||||||||||
| cf) number; DB name 1 Oncogene; http://nar.oxfordjournals.org/content/35/suppl_1/D721.long, 2 Tumor Suppressor gene; https://bioinfo.uth.edu/TSGene/, 3 Cancer Gene Census; http://www.nature.com/nrc/journal/v4/n3/abs/nrc1299.html, 4 CancerGenes; http://nar.oxfordjournals.org/content/35/suppl_1/D721.long, 5 Network of Cancer Gene; http://ncg.kcl.ac.uk/index.php, 1Therapeutic Vulnerabilities in Cancer; http://cbio.mskcc.org/cancergenomics/statius/ |
| REACTOME_INTEGRATION_OF_ENERGY_METABOLISM | |
| OMIM | |
| Orphanet | |
| Disease | KEGG Disease: SYT5 |
| MedGen: SYT5 (Human Medical Genetics with Condition) | |
| ClinVar: SYT5 | |
| Phenotype | MGI: SYT5 (International Mouse Phenotyping Consortium) |
| PhenomicDB: SYT5 | |
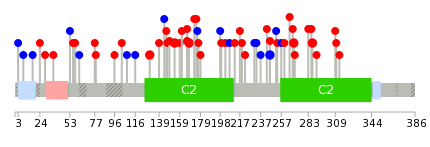
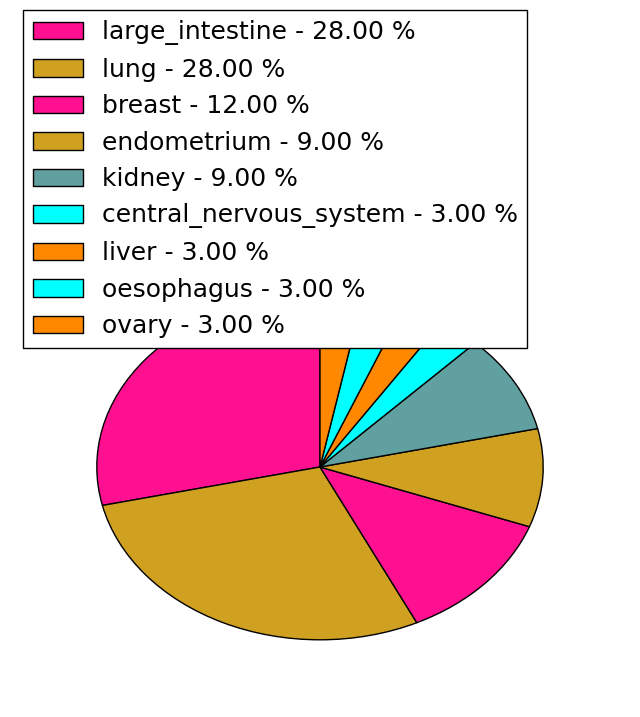
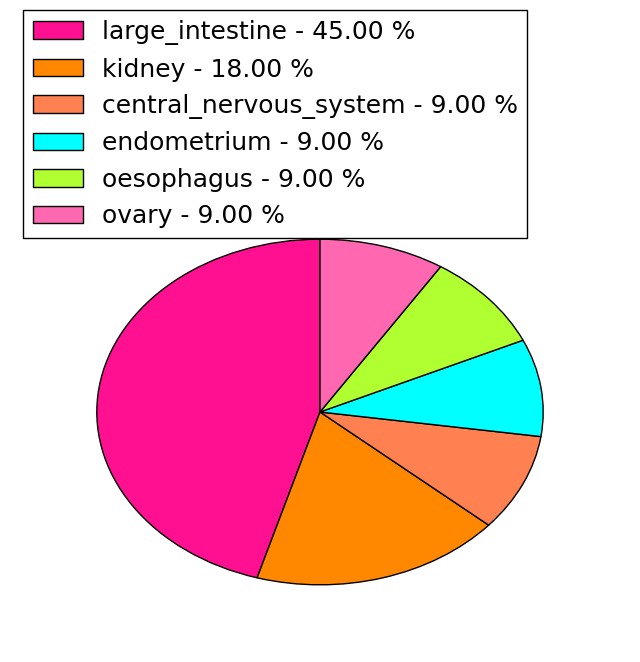
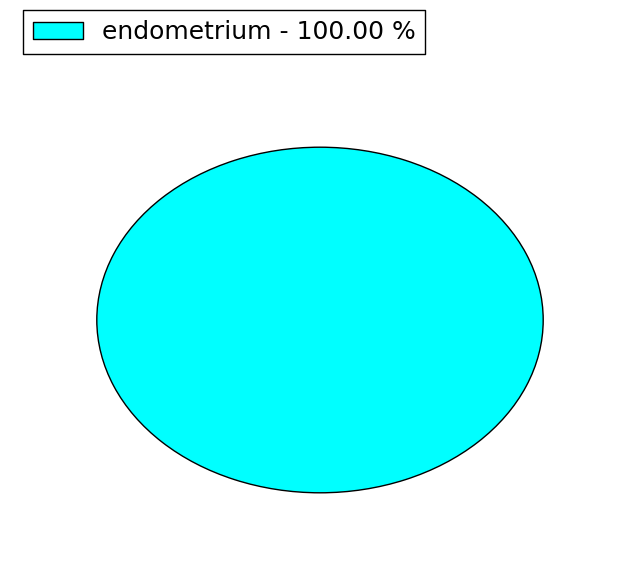
| Mutations for SYT5 |
| * Under tables are showing count per each tissue to give us broad intuition about tissue specific mutation patterns.You can go to the detailed page for each mutation database's web site. |
| There's no structural variation information in COSMIC data for this gene. |
| * From mRNA Sanger sequences, Chitars2.0 arranged chimeric transcripts. This table shows SYT5 related fusion information. |
| ID | Head Gene | Tail Gene | Accession | Gene_a | qStart_a | qEnd_a | Chromosome_a | tStart_a | tEnd_a | Gene_a | qStart_a | qEnd_a | Chromosome_a | tStart_a | tEnd_a |
| Top |
| There's no copy number variation information in COSMIC data for this gene. |
| Top |
|
 |
| Top |
| Stat. for Non-Synonymous SNVs (# total SNVs=32) | (# total SNVs=11) |
 |  |
(# total SNVs=1) | (# total SNVs=1) |
 |  |
| Top |
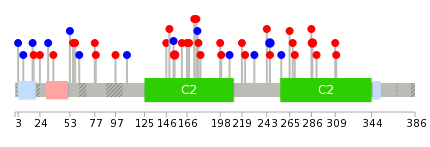
| * When you move the cursor on each content, you can see more deailed mutation information on the Tooltip. Those are primary_site,primary_histology,mutation(aa),pubmedID. |
| GRCh37 position | Mutation(aa) | Unique sampleID count |
| chr19:55686269-55686269 | p.M269I | 2 |
| chr19:55687156-55687156 | p.P154L | 2 |
| chr19:55687497-55687497 | p.? | 2 |
| chr19:55685985-55685985 | p.G287D | 2 |
| chr19:55687114-55687114 | p.T168M | 2 |
| chr19:55686338-55686338 | p.S246S | 2 |
| chr19:55687229-55687229 | p.L130V | 2 |
| chr19:55687076-55687076 | p.? | 1 |
| chr19:55689730-55689730 | p.P29L | 1 |
| chr19:55687154-55687154 | p.D155fs*15 | 1 |
| Top |
|
 |
| Point Mutation/ Tissue ID | 1 | 2 | 3 | 4 | 5 | 6 | 7 | 8 | 9 | 10 | 11 | 12 | 13 | 14 | 15 | 16 | 17 | 18 | 19 | 20 |
| # sample | 4 | 2 | 12 | 1 | 1 | 3 | 1 | 3 | 2 | 1 | 1 | 6 | 5 | 4 | ||||||
| # mutation | 4 | 2 | 11 | 1 | 1 | 3 | 1 | 4 | 2 | 1 | 1 | 6 | 5 | 4 | ||||||
| nonsynonymous SNV | 2 | 2 | 7 | 1 | 1 | 1 | 1 | 4 | 2 | 1 | 3 | 4 | 3 | |||||||
| synonymous SNV | 2 | 4 | 2 | 1 | 3 | 1 | 1 |
| cf) Tissue ID; Tissue type (1; BLCA[Bladder Urothelial Carcinoma], 2; BRCA[Breast invasive carcinoma], 3; CESC[Cervical squamous cell carcinoma and endocervical adenocarcinoma], 4; COAD[Colon adenocarcinoma], 5; GBM[Glioblastoma multiforme], 6; Glioma Low Grade, 7; HNSC[Head and Neck squamous cell carcinoma], 8; KICH[Kidney Chromophobe], 9; KIRC[Kidney renal clear cell carcinoma], 10; KIRP[Kidney renal papillary cell carcinoma], 11; LAML[Acute Myeloid Leukemia], 12; LUAD[Lung adenocarcinoma], 13; LUSC[Lung squamous cell carcinoma], 14; OV[Ovarian serous cystadenocarcinoma ], 15; PAAD[Pancreatic adenocarcinoma], 16; PRAD[Prostate adenocarcinoma], 17; SKCM[Skin Cutaneous Melanoma], 18:STAD[Stomach adenocarcinoma], 19:THCA[Thyroid carcinoma], 20:UCEC[Uterine Corpus Endometrial Carcinoma]) |
| Top |
| * We represented just top 10 SNVs. When you move the cursor on each content, you can see more deailed mutation information on the Tooltip. Those are primary_site, primary_histology, mutation(aa), pubmedID. |
| Genomic Position | Mutation(aa) | Unique sampleID count |
| chr19:55686338 | p.G287D | 2 |
| chr19:55685985 | p.S246S | 2 |
| chr19:55687156 | p.P154L | 2 |
| chr19:55687421 | p.P222T | 1 |
| chr19:55690358 | p.P146L | 1 |
| chr19:55687089 | p.L219M | 1 |
| chr19:55687455 | p.E108E | 1 |
| chr19:55686339 | p.I207I | 1 |
| chr19:55690359 | p.S97Y | 1 |
| chr19:55687094 | p.F310L | 1 |
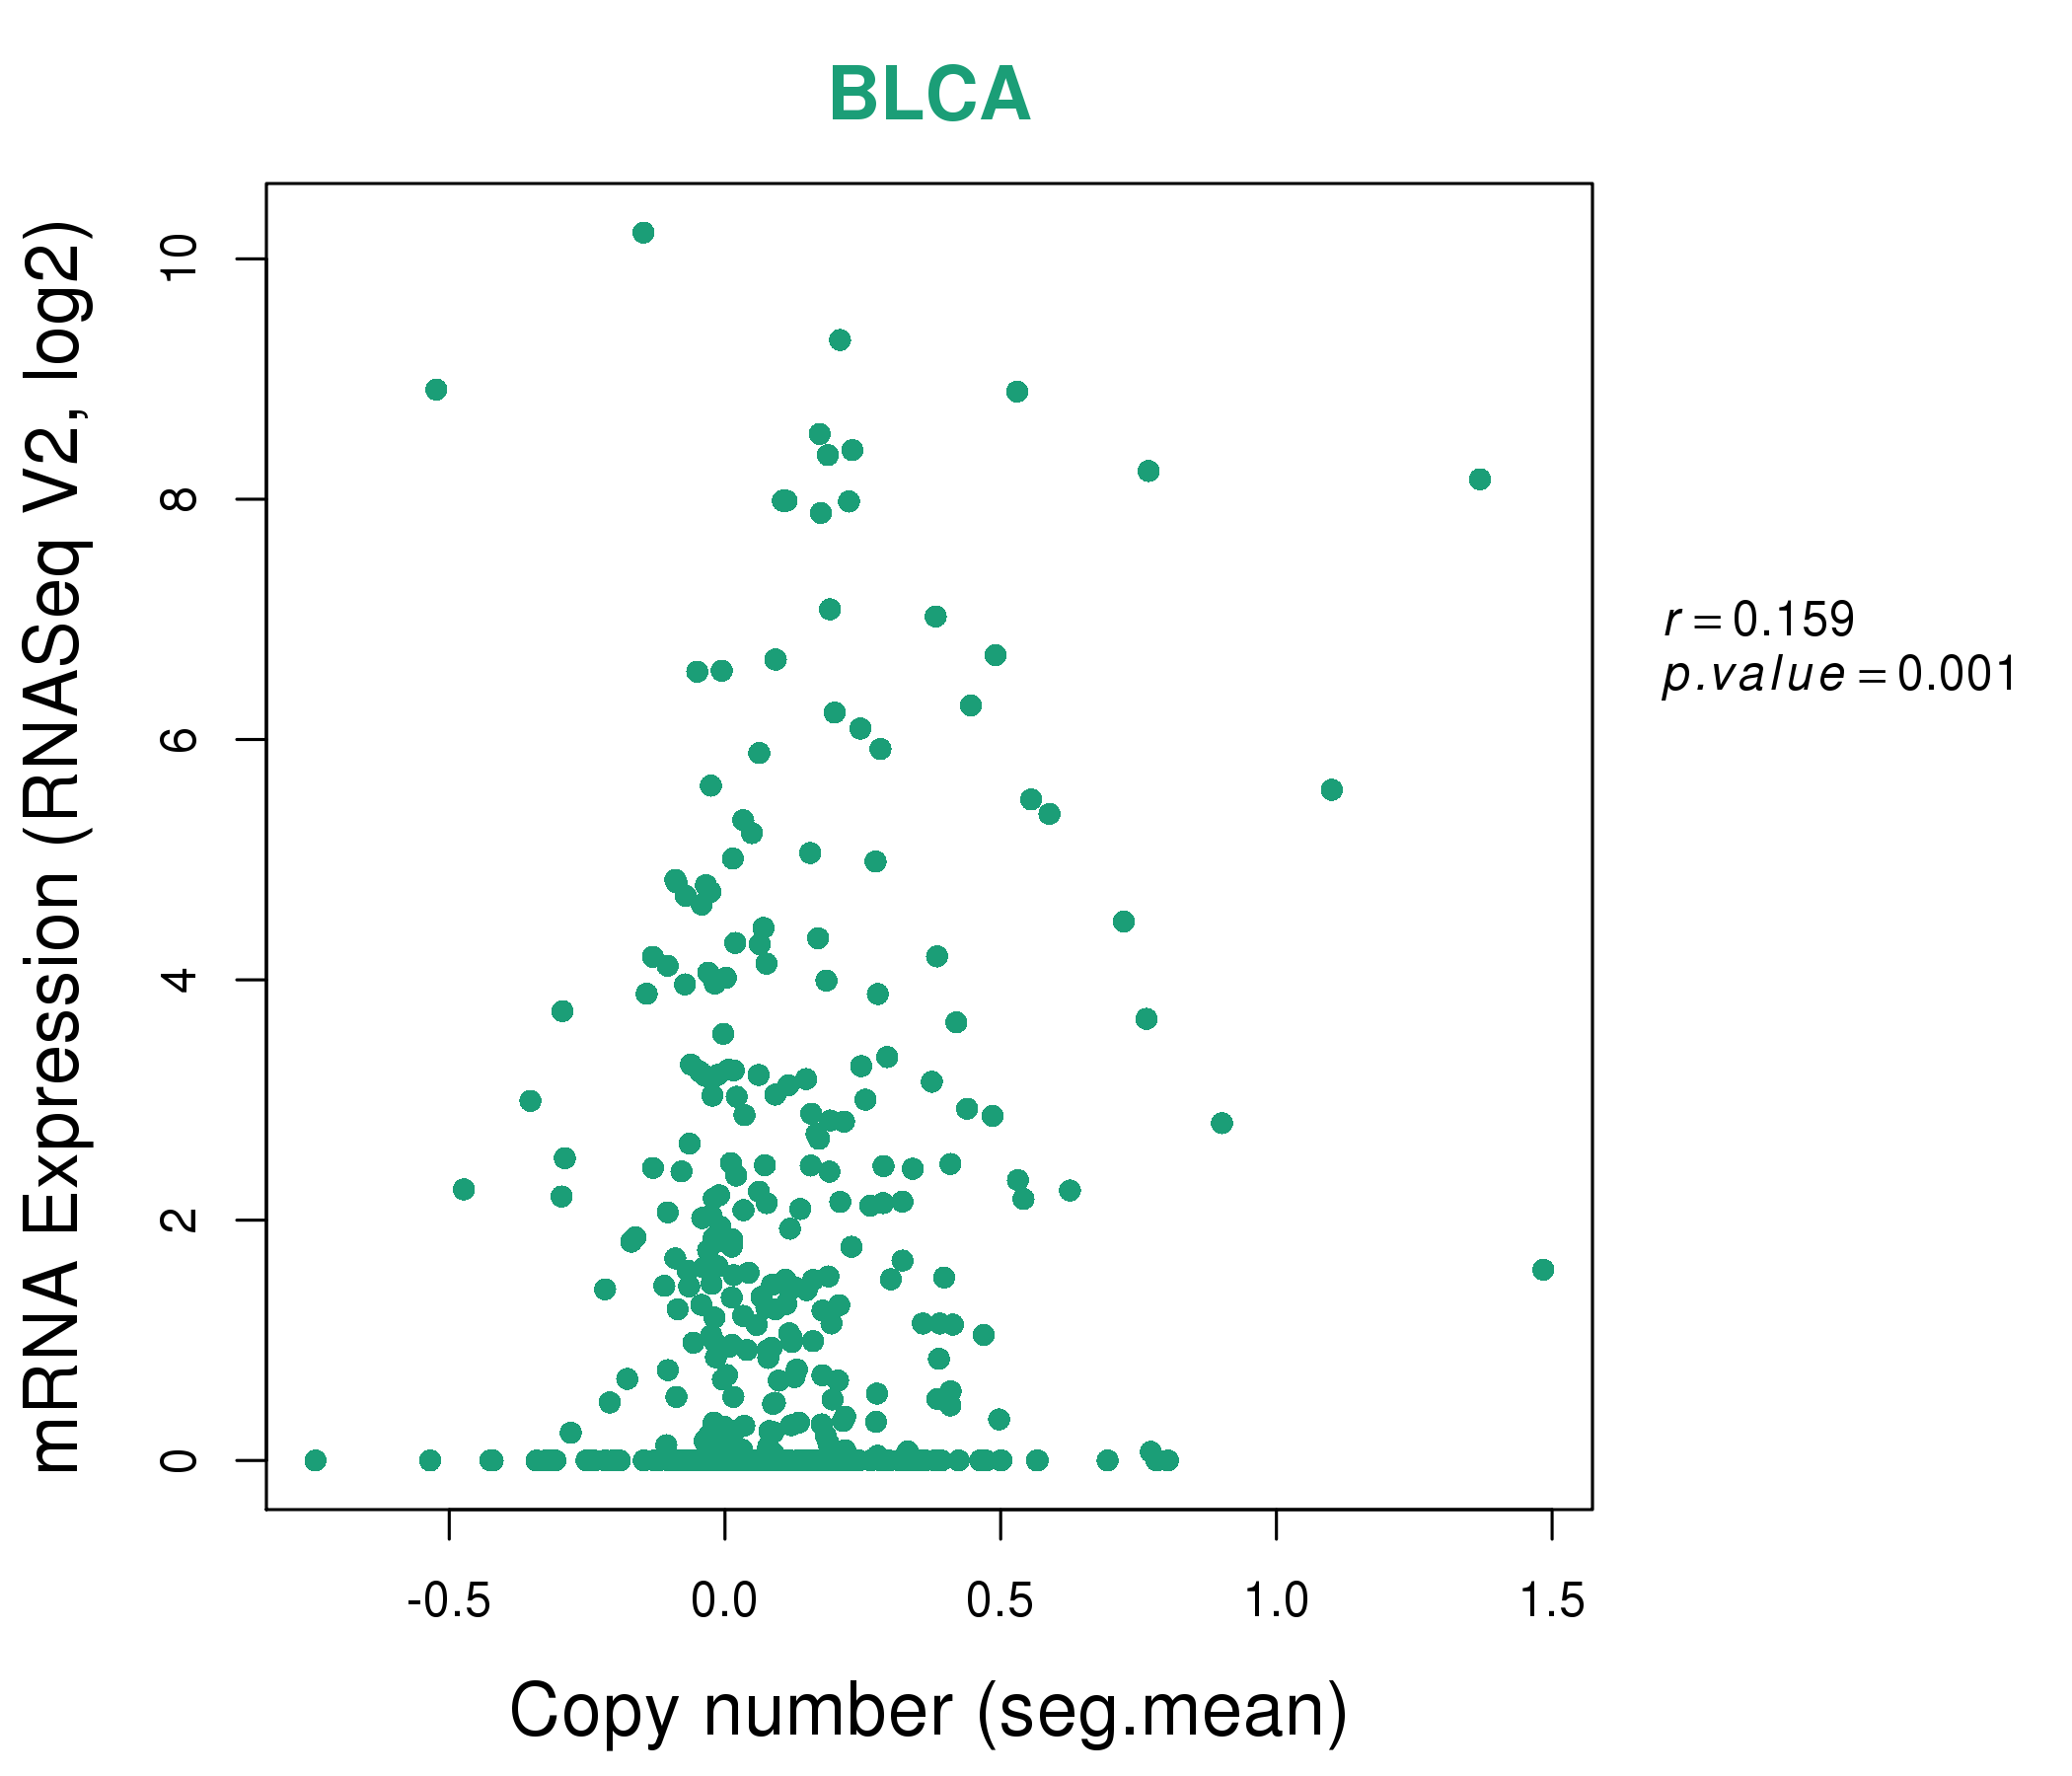
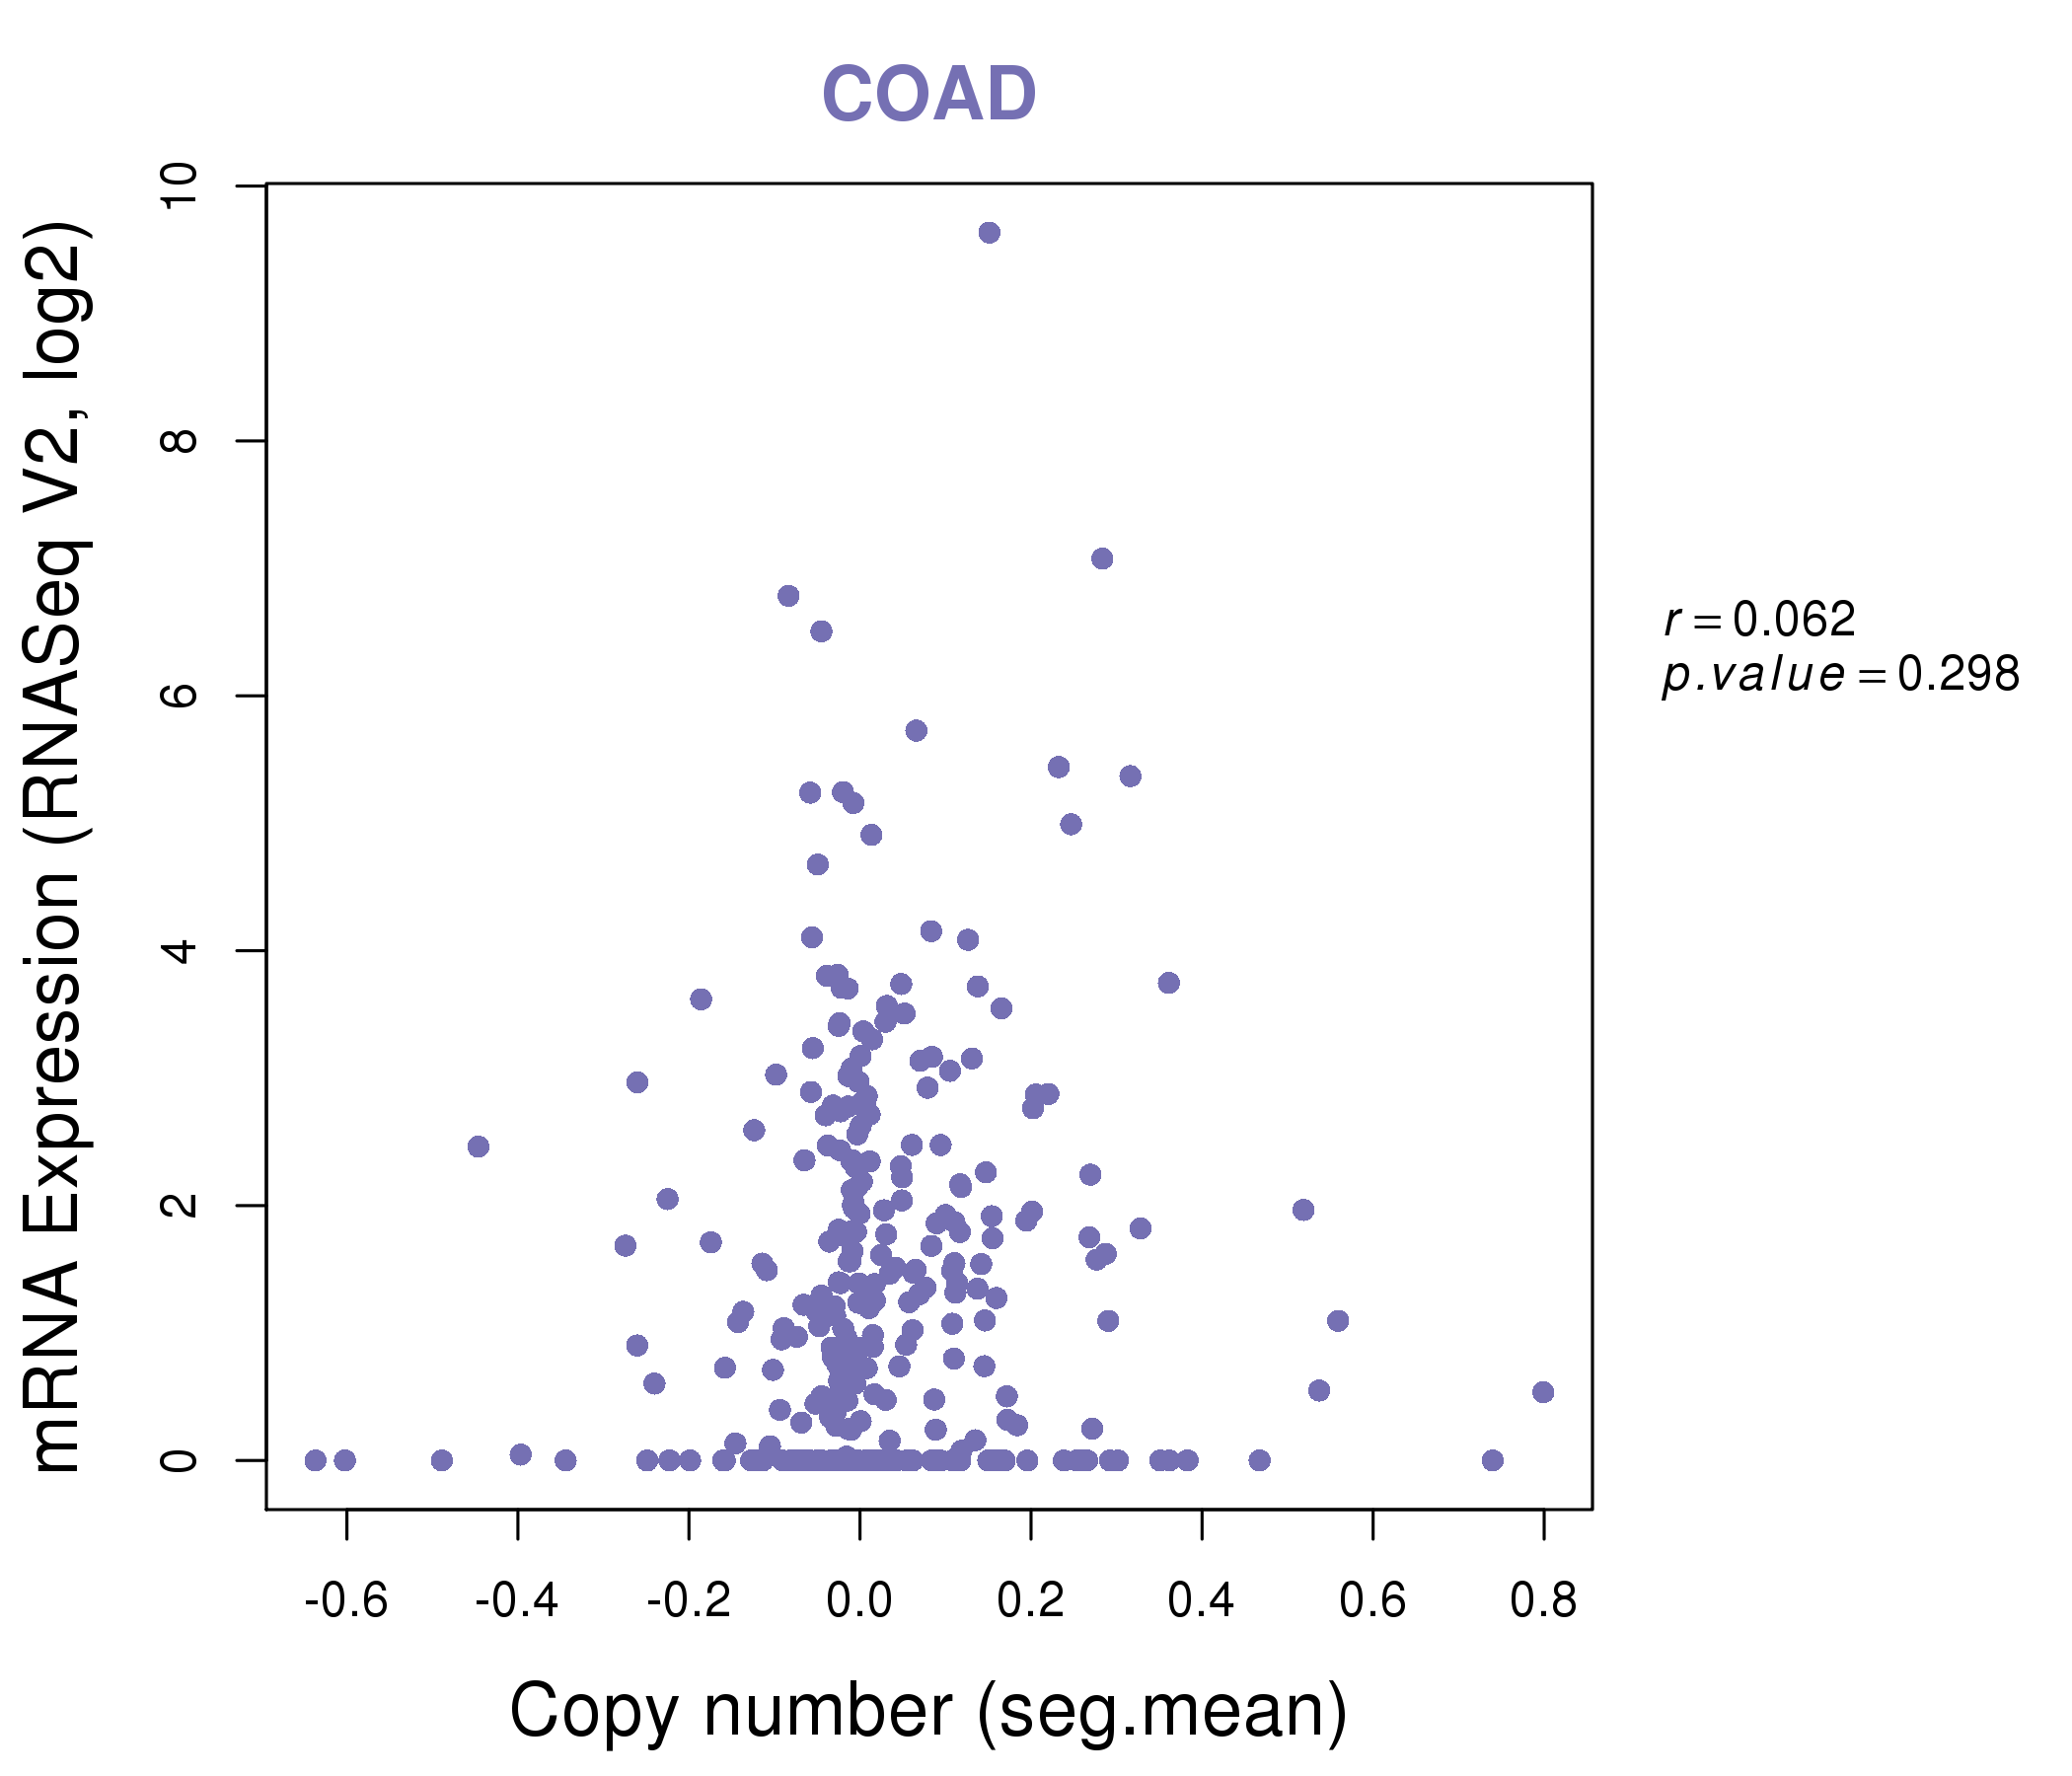
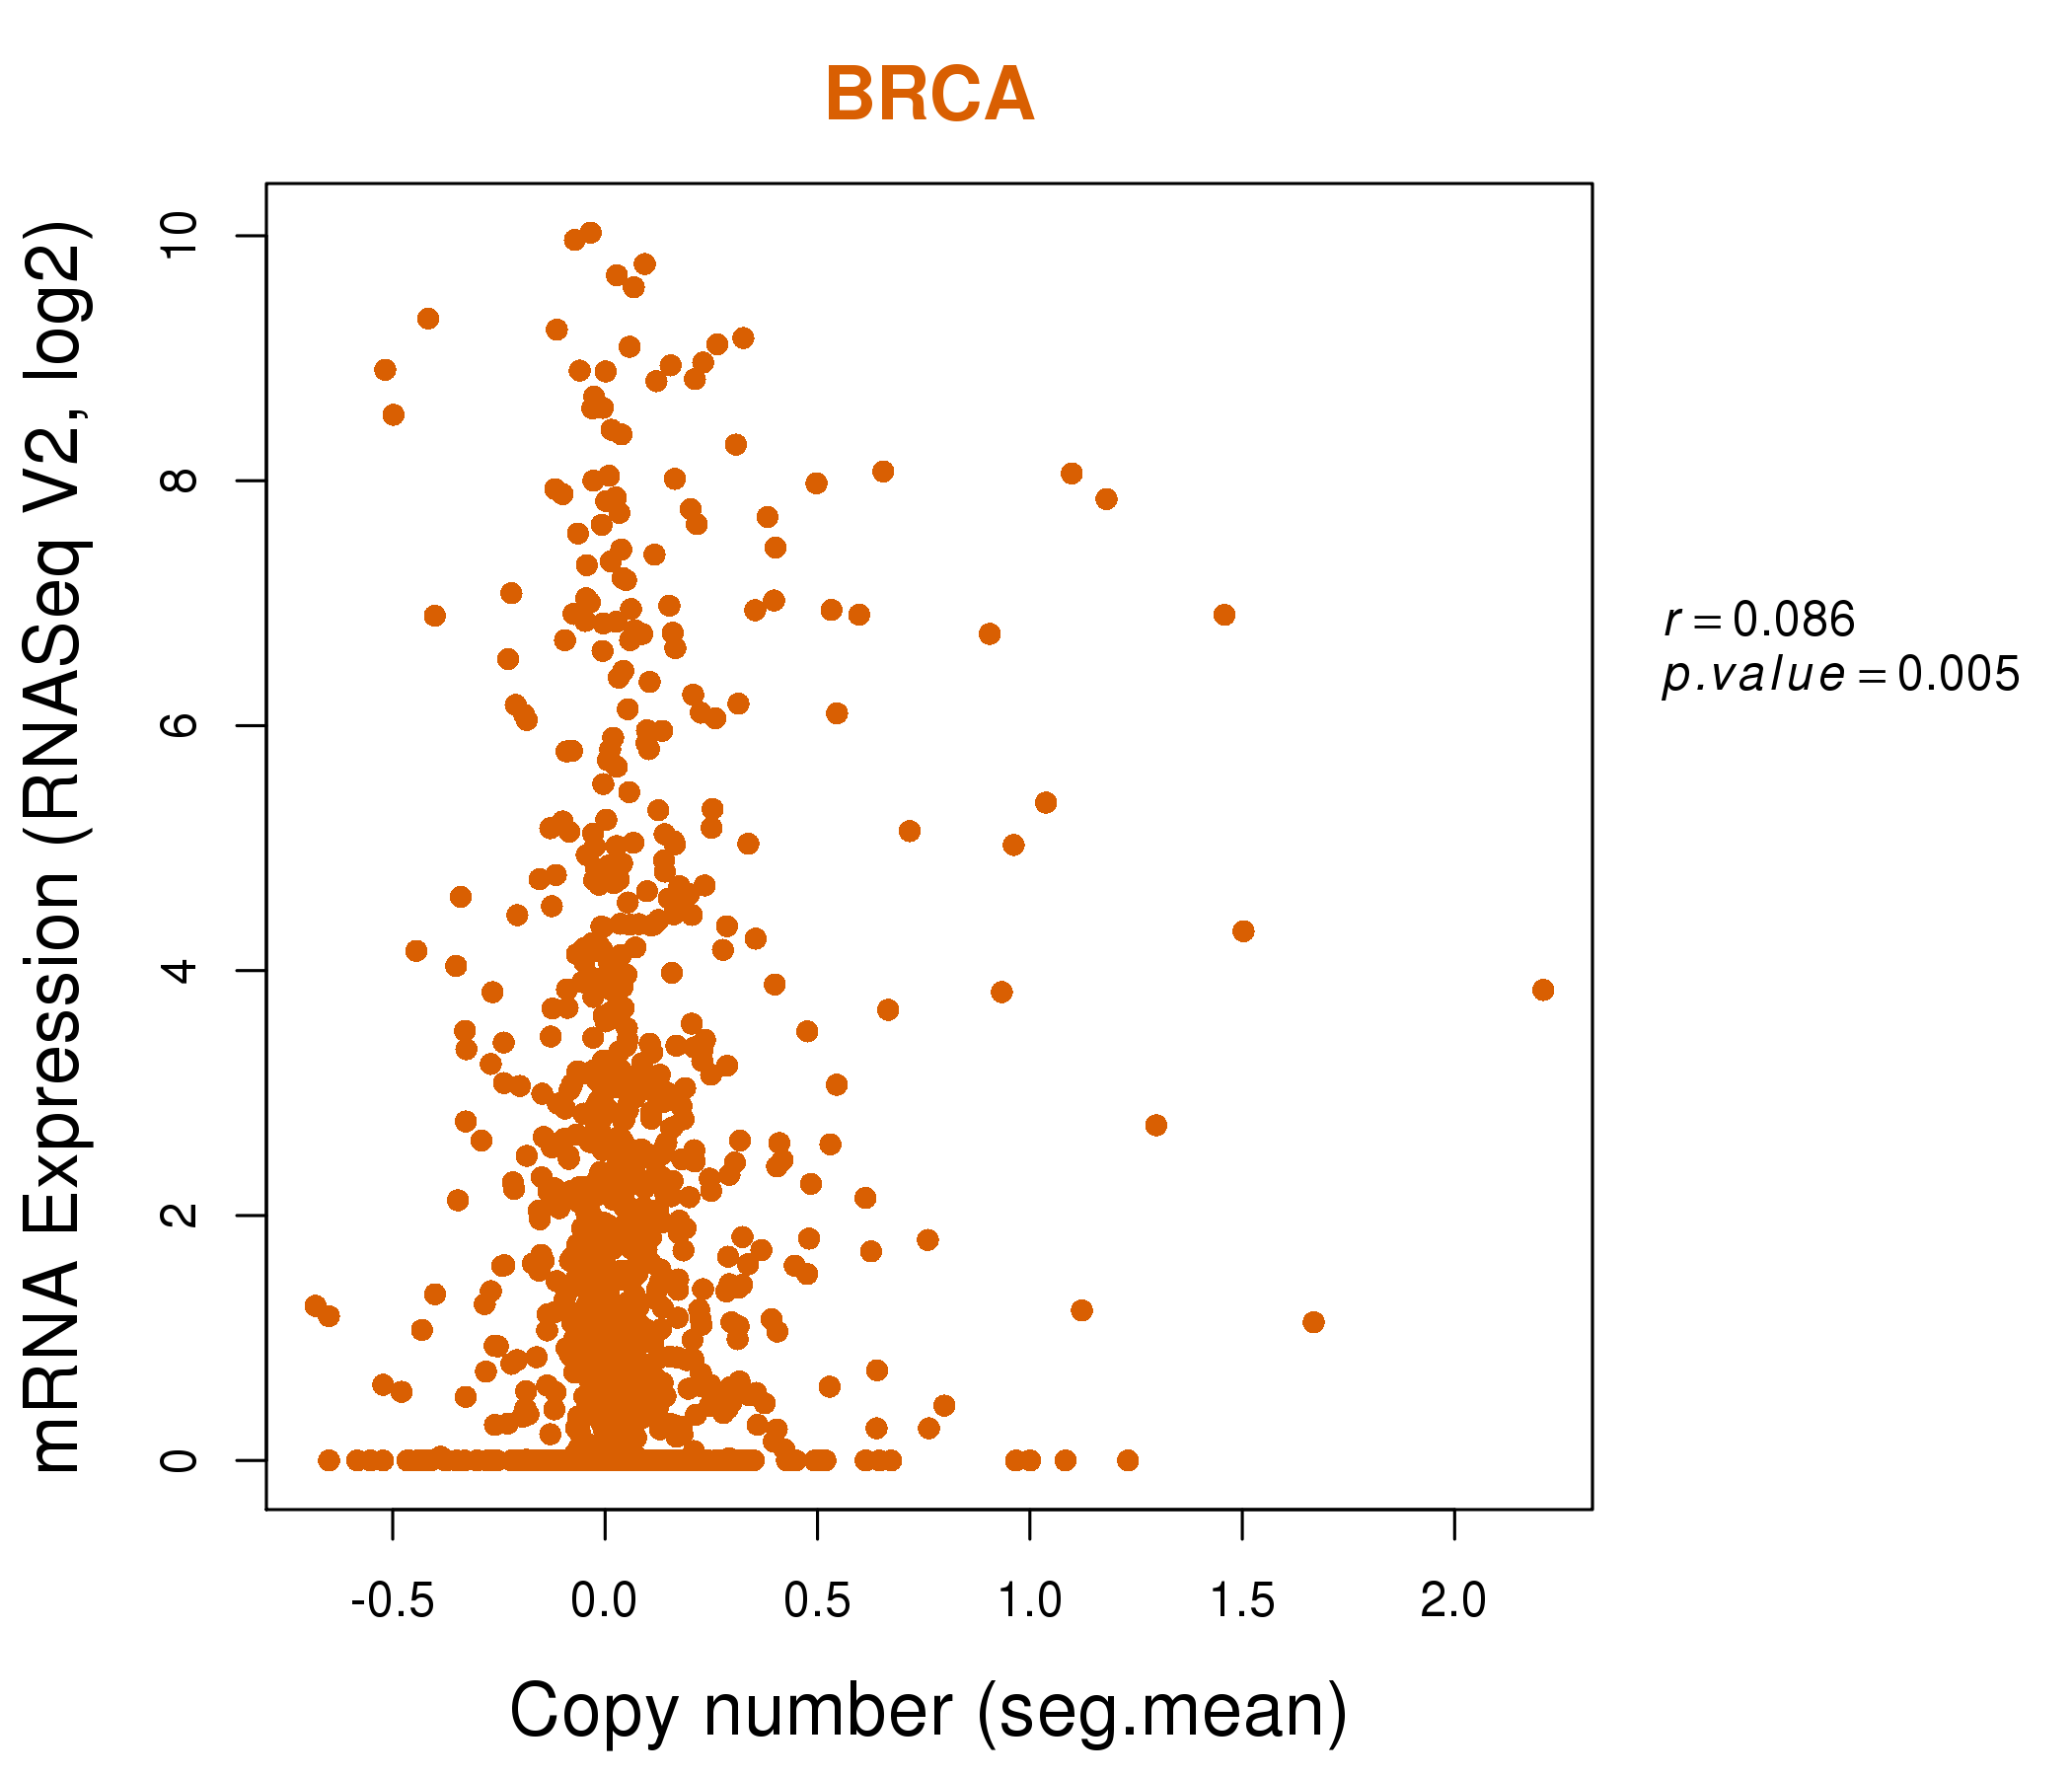
| * Copy number data were extracted from TCGA using R package TCGA-Assembler. The URLs of all public data files on TCGA DCC data server were gathered on Jan-05-2015. Function ProcessCNAData in TCGA-Assembler package was used to obtain gene-level copy number value which is calculated as the average copy number of the genomic region of a gene. |
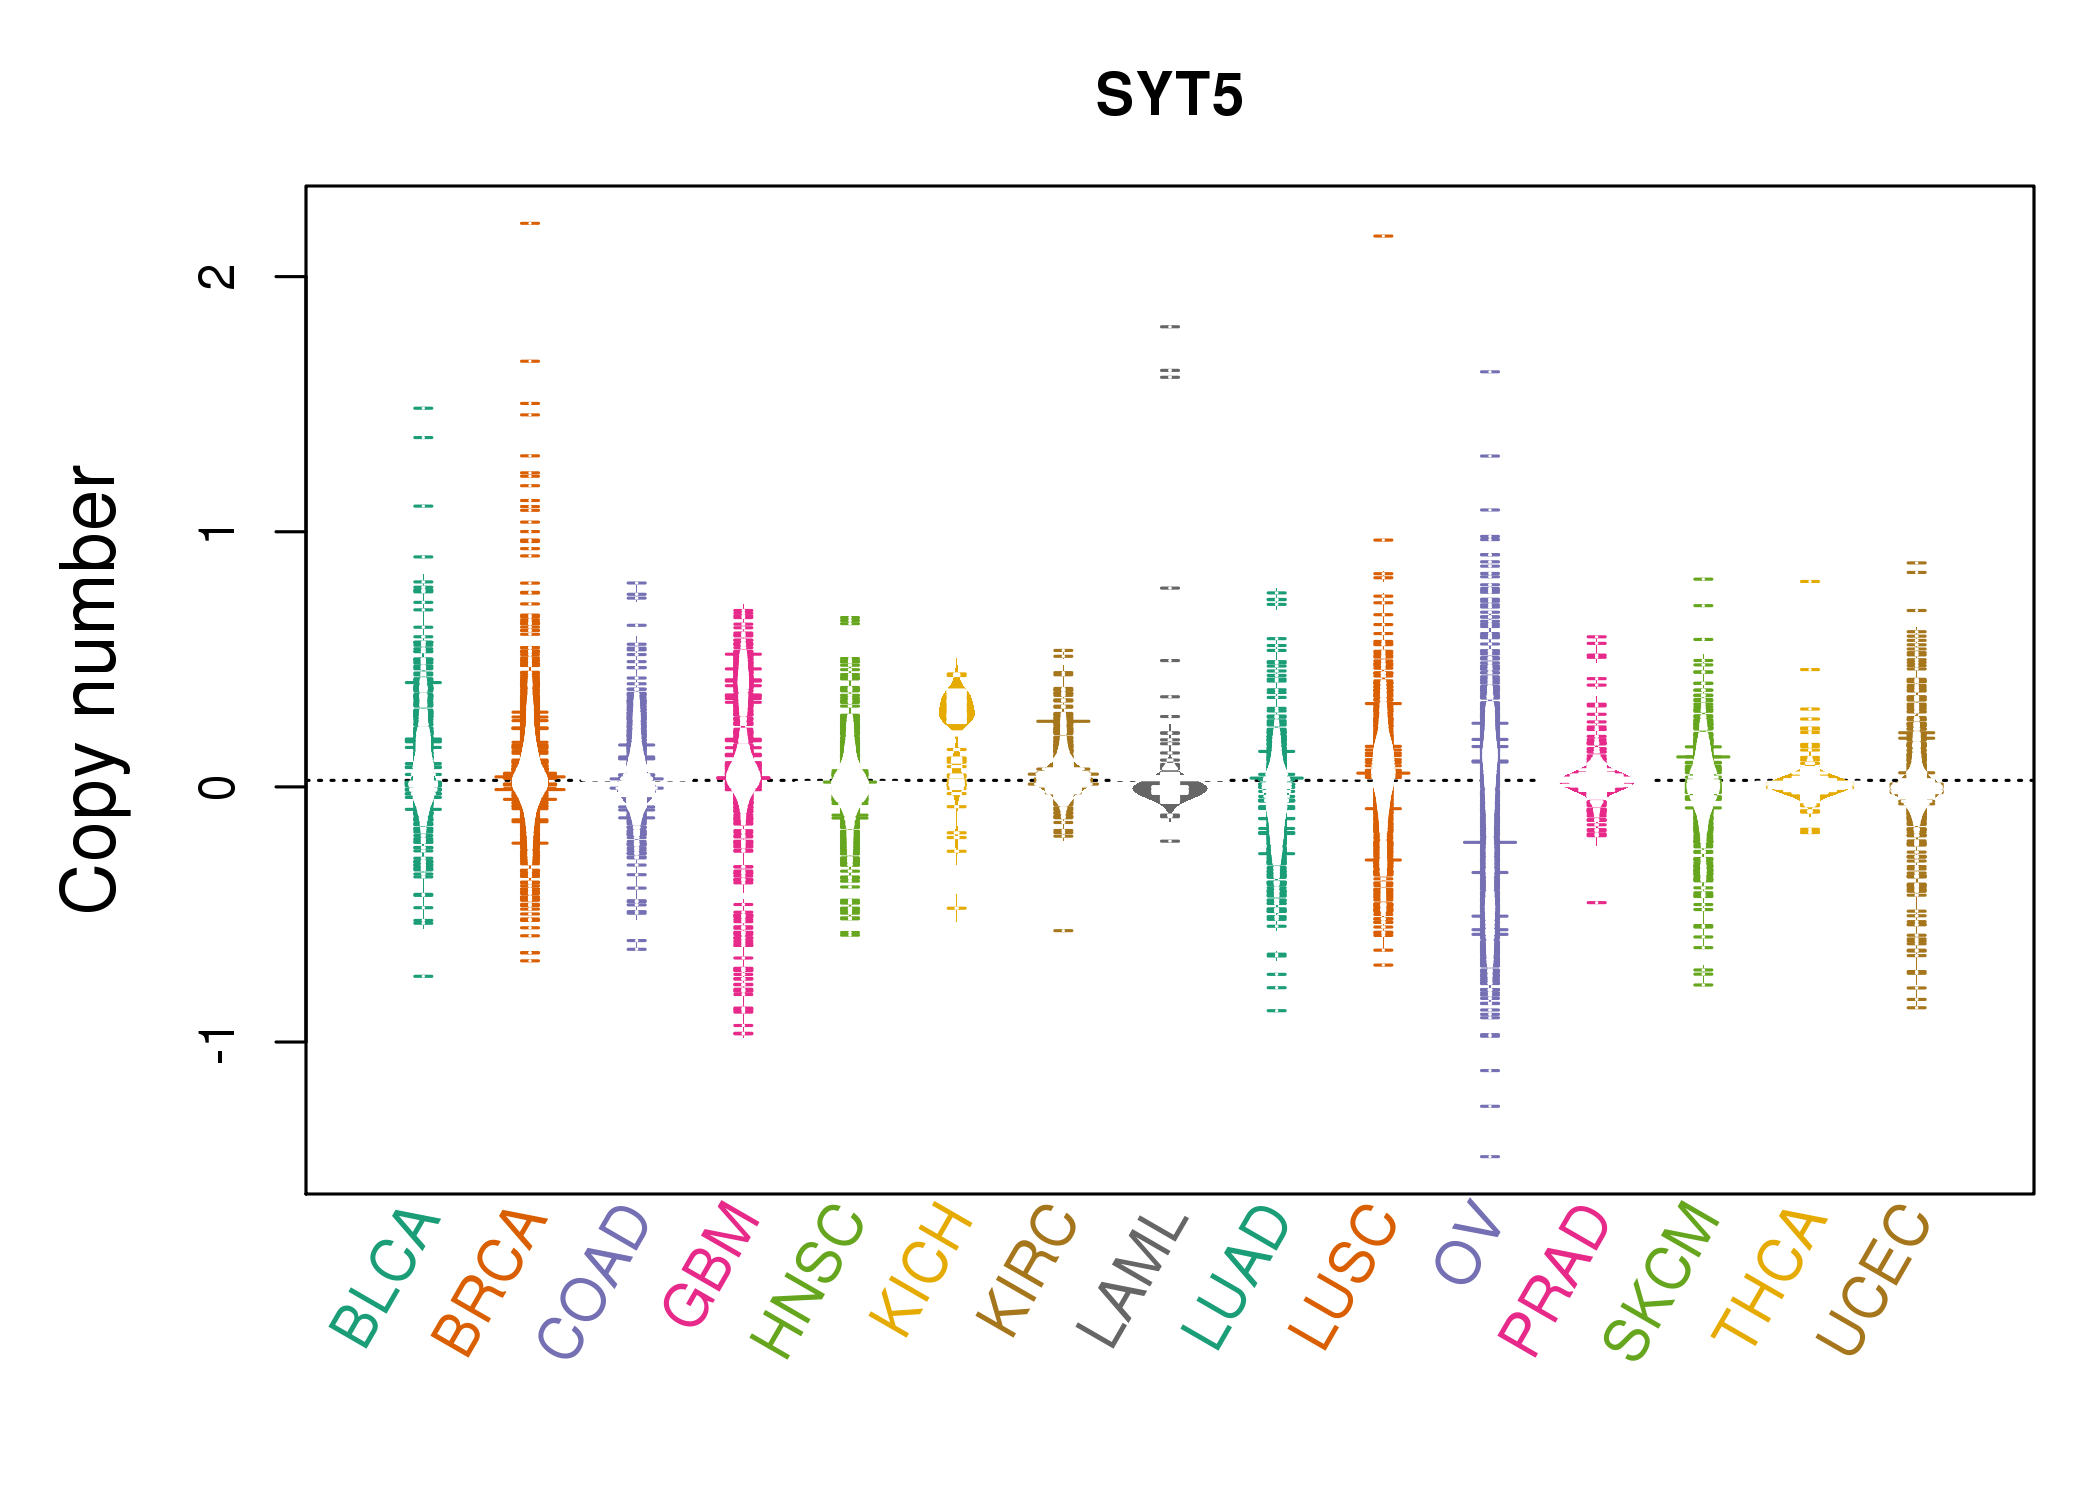 |
| cf) Tissue ID[Tissue type]: BLCA[Bladder Urothelial Carcinoma], BRCA[Breast invasive carcinoma], CESC[Cervical squamous cell carcinoma and endocervical adenocarcinoma], COAD[Colon adenocarcinoma], GBM[Glioblastoma multiforme], Glioma Low Grade, HNSC[Head and Neck squamous cell carcinoma], KICH[Kidney Chromophobe], KIRC[Kidney renal clear cell carcinoma], KIRP[Kidney renal papillary cell carcinoma], LAML[Acute Myeloid Leukemia], LUAD[Lung adenocarcinoma], LUSC[Lung squamous cell carcinoma], OV[Ovarian serous cystadenocarcinoma ], PAAD[Pancreatic adenocarcinoma], PRAD[Prostate adenocarcinoma], SKCM[Skin Cutaneous Melanoma], STAD[Stomach adenocarcinoma], THCA[Thyroid carcinoma], UCEC[Uterine Corpus Endometrial Carcinoma] |
| Top |
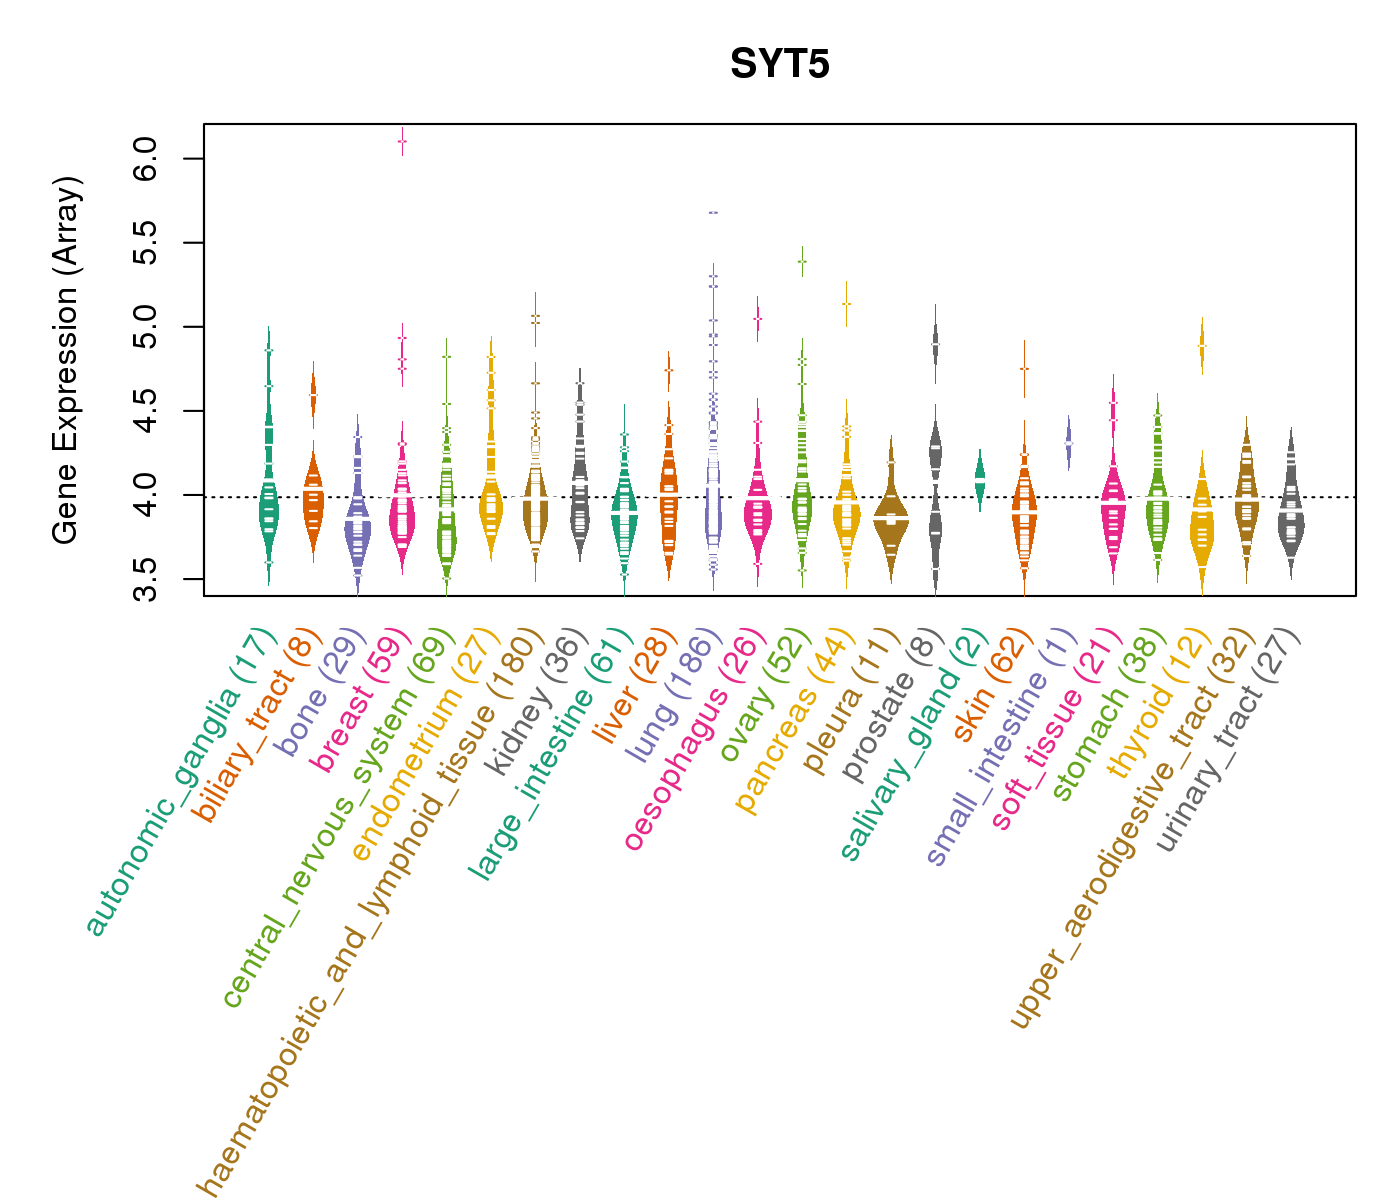
| Gene Expression for SYT5 |
| * CCLE gene expression data were extracted from CCLE_Expression_Entrez_2012-10-18.res: Gene-centric RMA-normalized mRNA expression data. |
 |
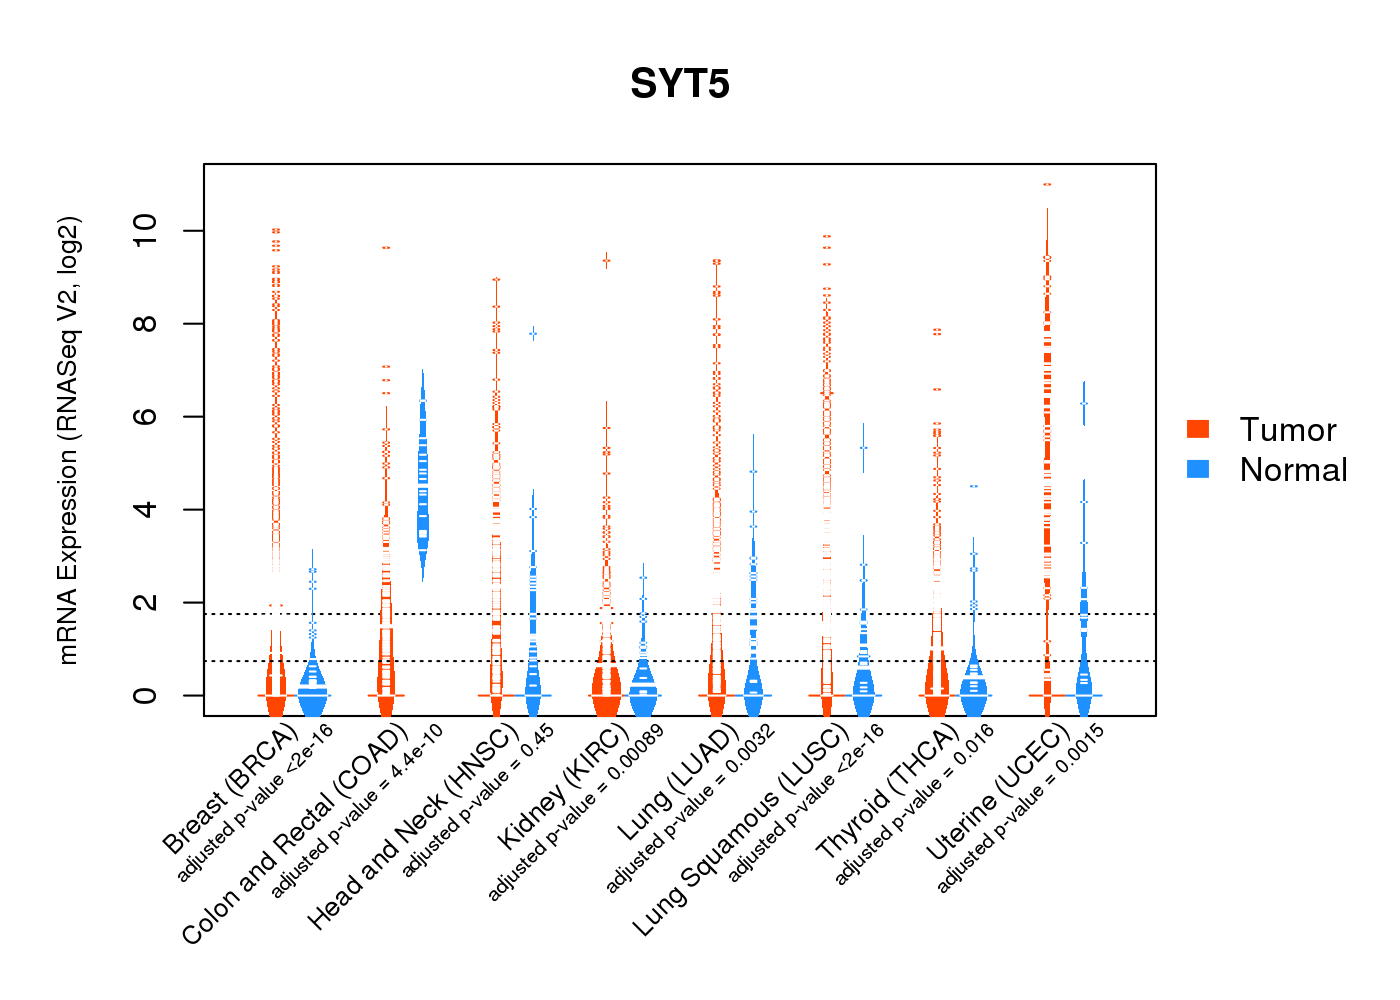
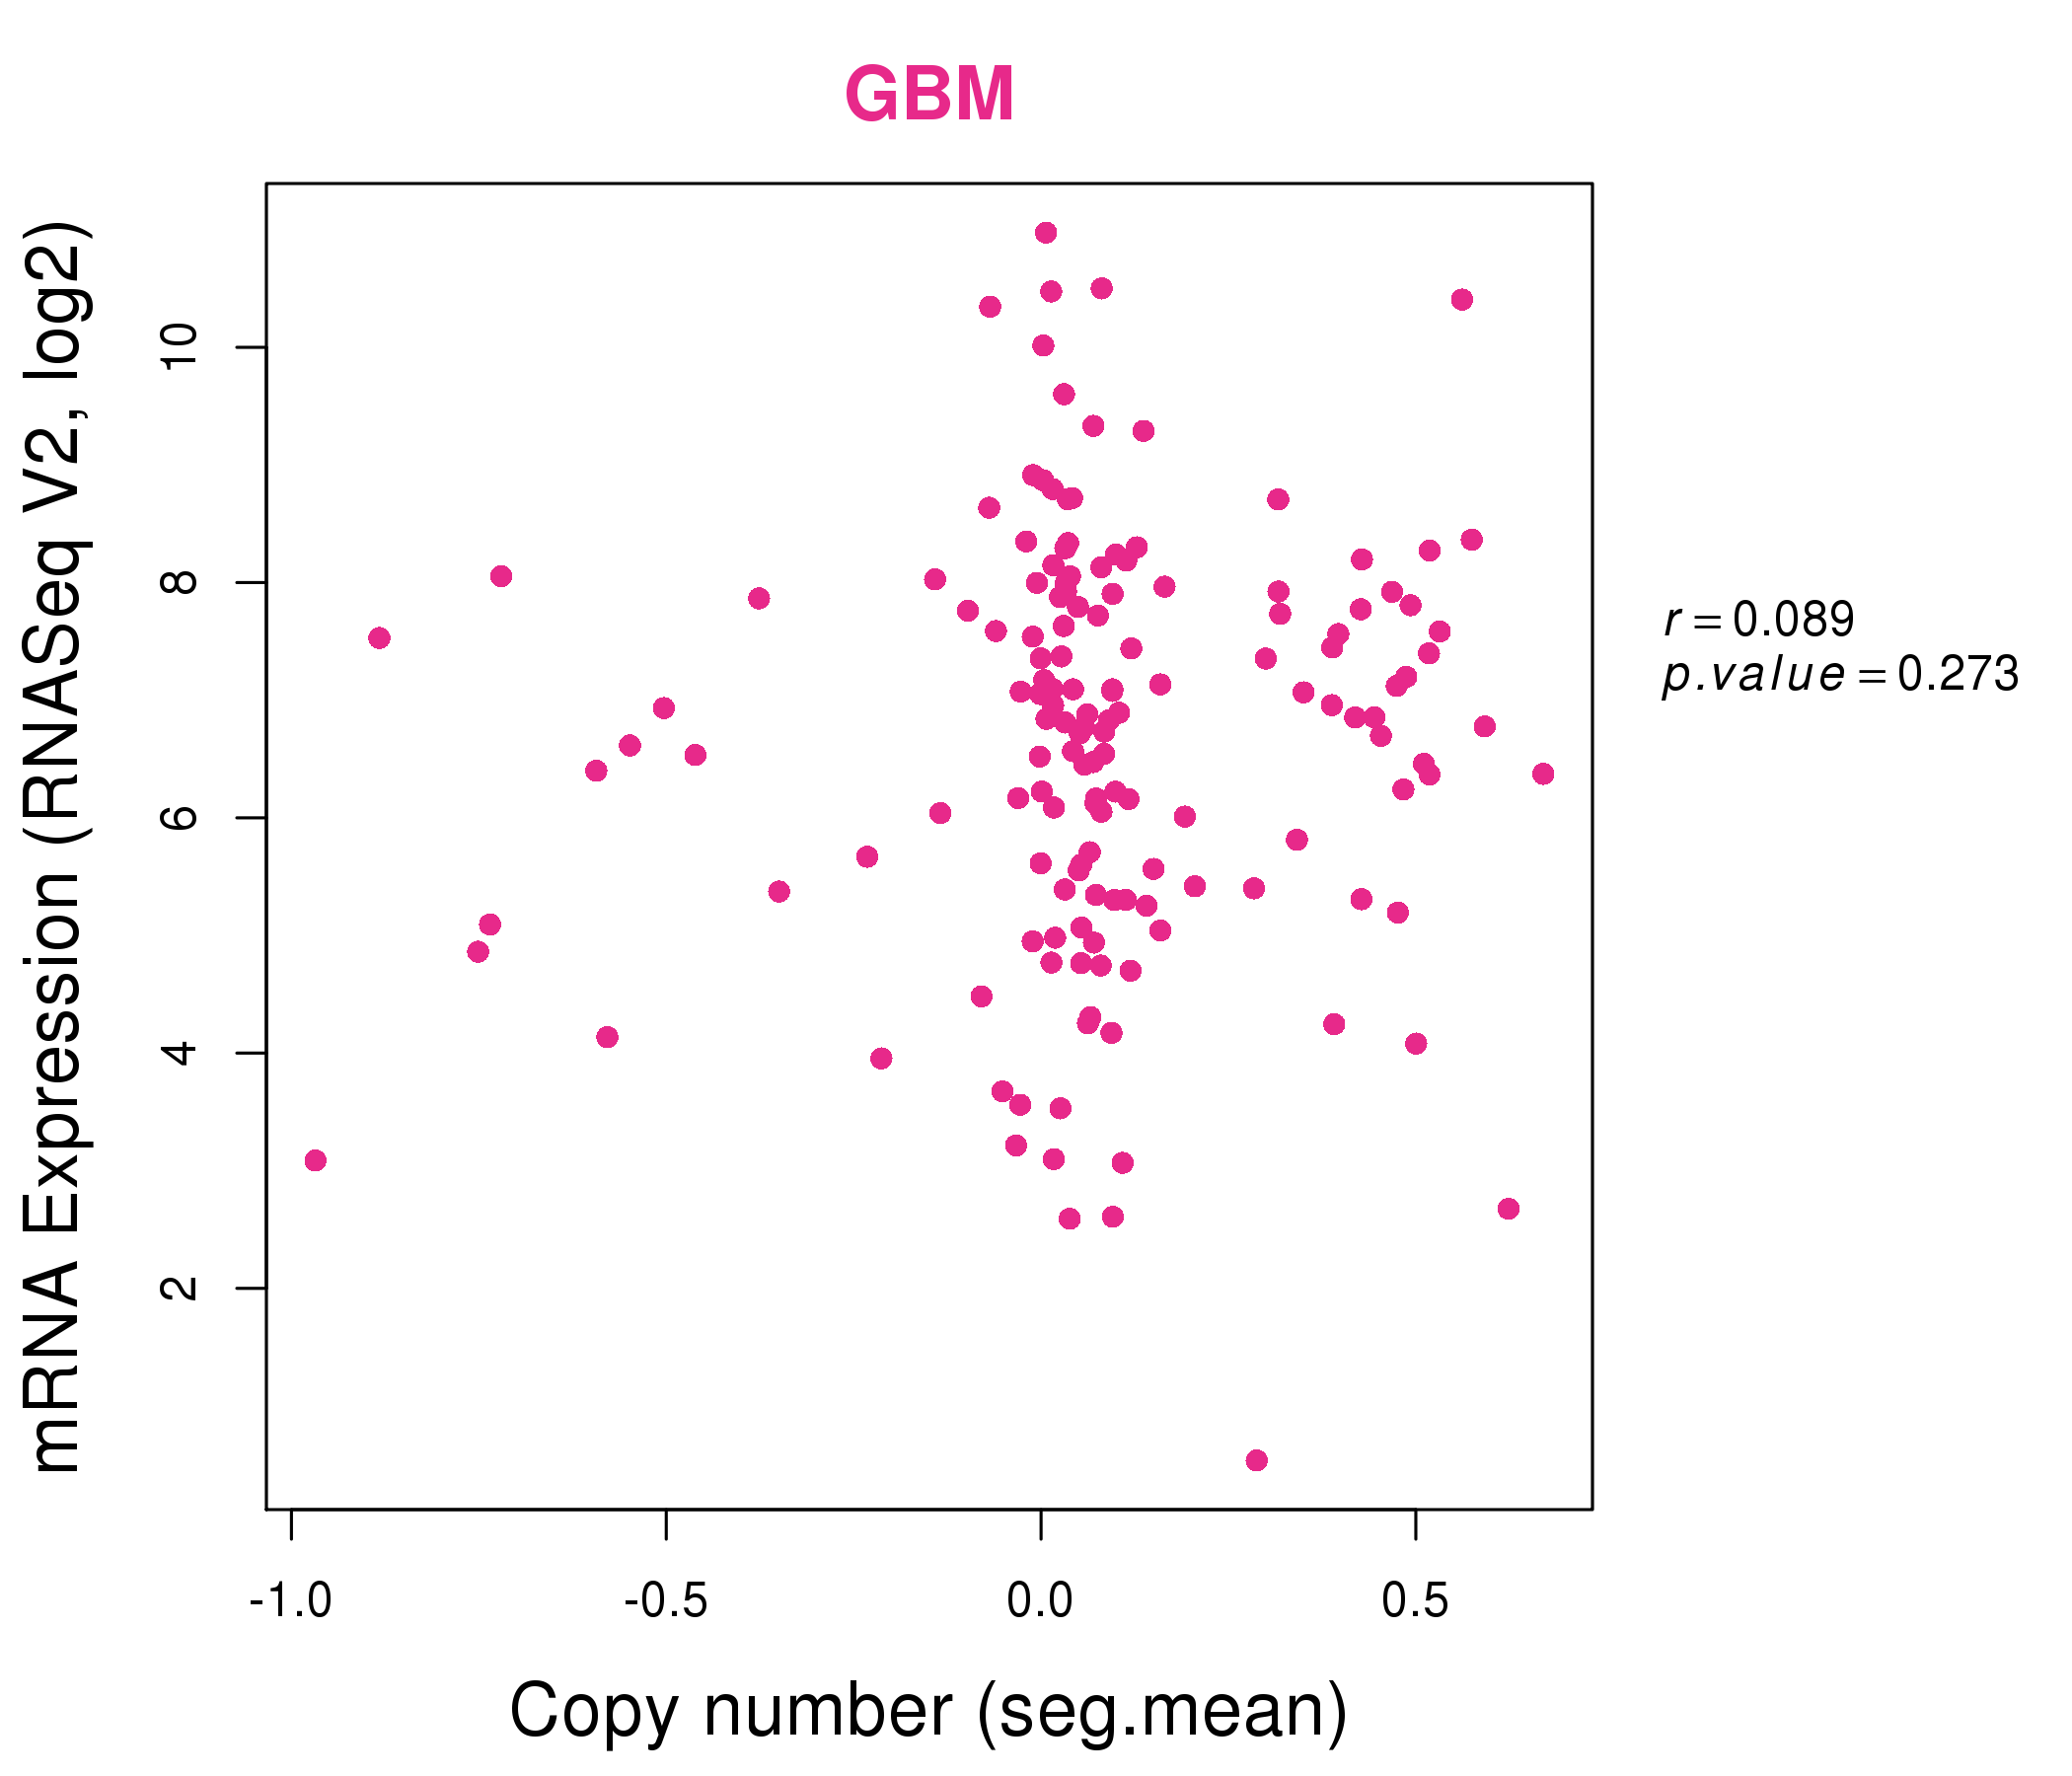
| * Normalized gene expression data of RNASeqV2 was extracted from TCGA using R package TCGA-Assembler. The URLs of all public data files on TCGA DCC data server were gathered at Jan-05-2015. Only eight cancer types have enough normal control samples for differential expression analysis. (t test, adjusted p<0.05 (using Benjamini-Hochberg FDR)) |
 |
| Top |
| * This plots show the correlation between CNV and gene expression. |
: Open all plots for all cancer types
 |
|
 |
|
| Top |
| Gene-Gene Network Information |
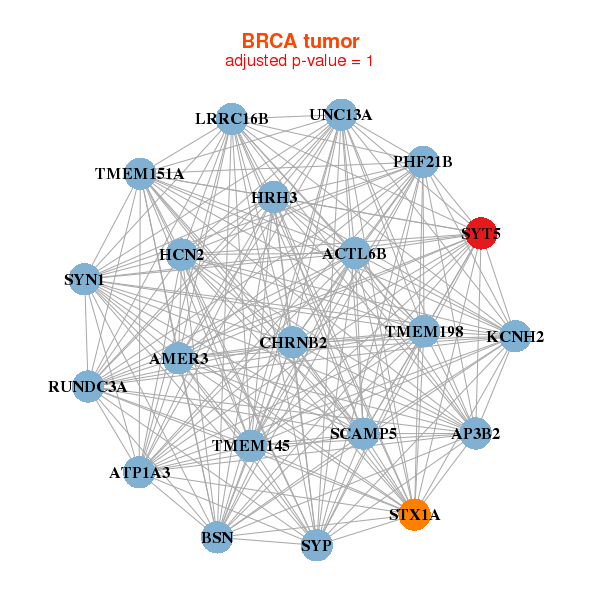
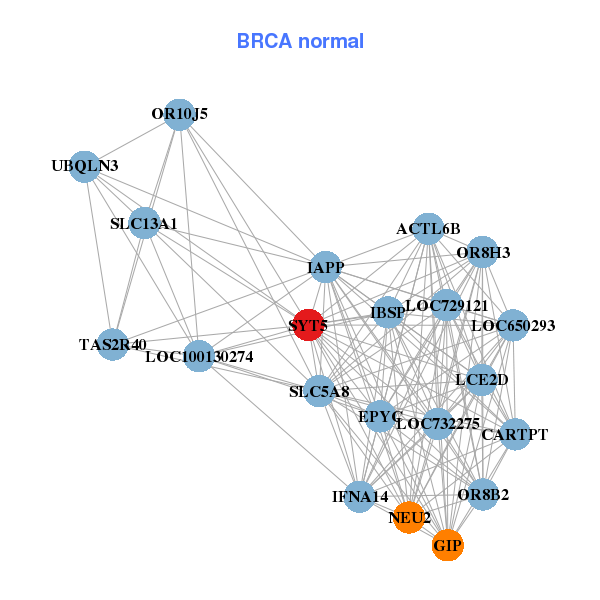
| * Co-Expression network figures were drawn using R package igraph. Only the top 20 genes with the highest correlations were shown. Red circle: input gene, orange circle: cell metabolism gene, sky circle: other gene |
: Open all plots for all cancer types
 |
| ||||
| ACTL6B,AP3B2,ATP1A3,BSN,CHRNB2,AMER3,HCN2, HRH3,KCNH2,LRRC16B,PHF21B,RUNDC3A,SCAMP5,STX1A, SYN1,SYP,SYT5,TMEM145,TMEM151A,TMEM198,UNC13A | ACTL6B,CARTPT,EPYC,GIP,IAPP,IBSP,IFNA14, LCE2D,LOC100130274,LOC650293,LOC729121,LOC732275,NEU2,OR10J5, OR8B2,OR8H3,SLC13A1,SLC5A8,SYT5,TAS2R40,UBQLN3 | ||||
 |
| ||||
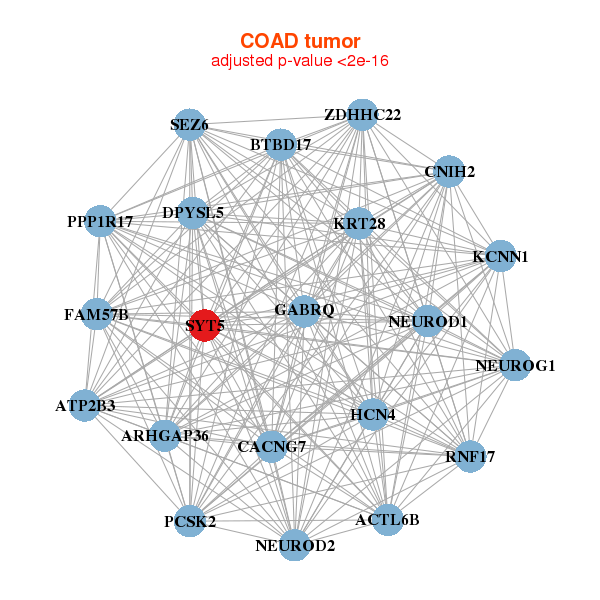
| ACTL6B,ARHGAP36,ATP2B3,BTBD17,PPP1R17,CACNG7,CNIH2, DPYSL5,FAM57B,GABRQ,HCN4,KCNN1,KRT28,NEUROD1, NEUROD2,NEUROG1,PCSK2,RNF17,SEZ6,SYT5,ZDHHC22 | APLP1,ATCAY,CTNNA2,DPYSL5,EPHA5,FGF14,GARNL3, HMP19,HS6ST3,KIF5A,MYT1L,NAPB,NDRG4,PHOX2B, PPP2R2C,PRPH,PTPRN,SEZ6,SYN2,SYT1,SYT5 |
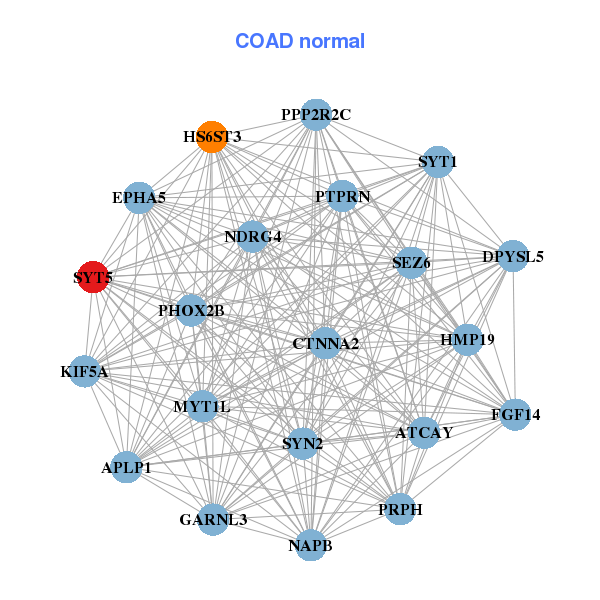
| * Co-Expression network figures were drawn using R package igraph. Only the top 20 genes with the highest correlations were shown. Red circle: input gene, orange circle: cell metabolism gene, sky circle: other gene |
: Open all plots for all cancer types
| Top |
: Open all interacting genes' information including KEGG pathway for all interacting genes from DAVID
| Top |
| Pharmacological Information for SYT5 |
| DB Category | DB Name | DB's ID and Url link |
| * Gene Centered Interaction Network. |
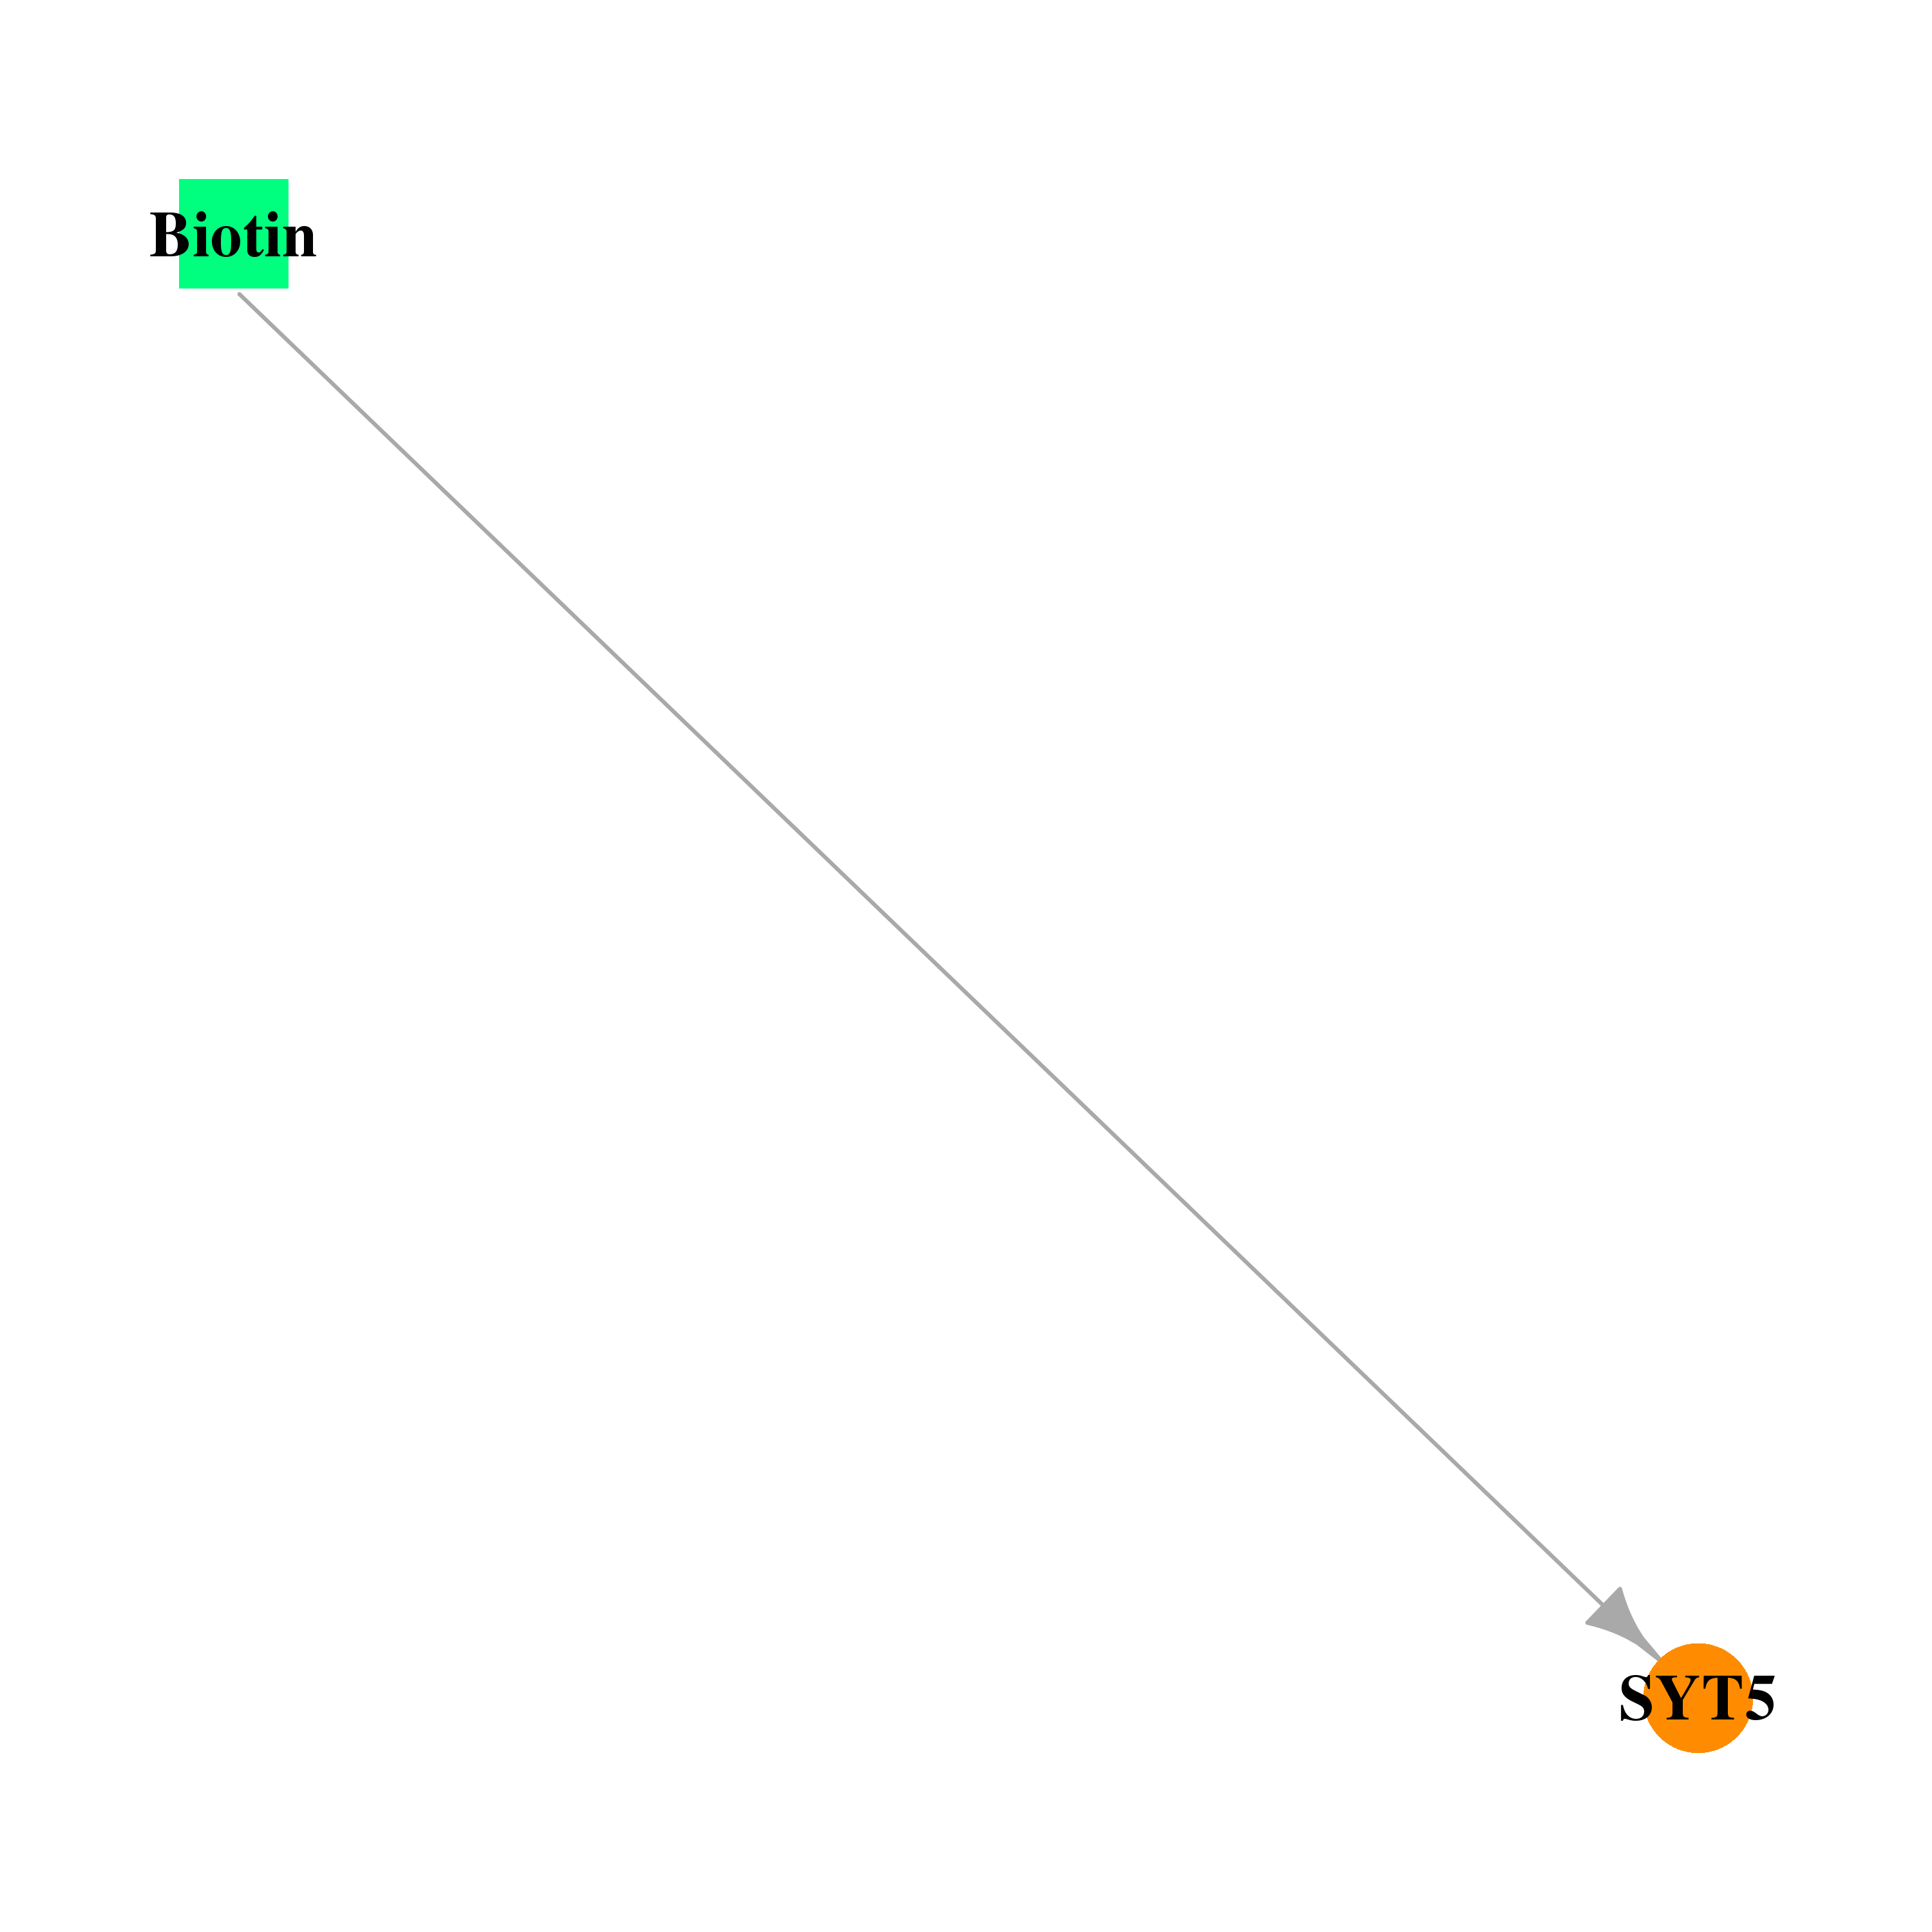 |
| * Drug Centered Interaction Network. |
| DrugBank ID | Target Name | Drug Groups | Generic Name | Drug Centered Network | Drug Structure |
| DB00121 | synaptotagmin V | approved; nutraceutical | Biotin | 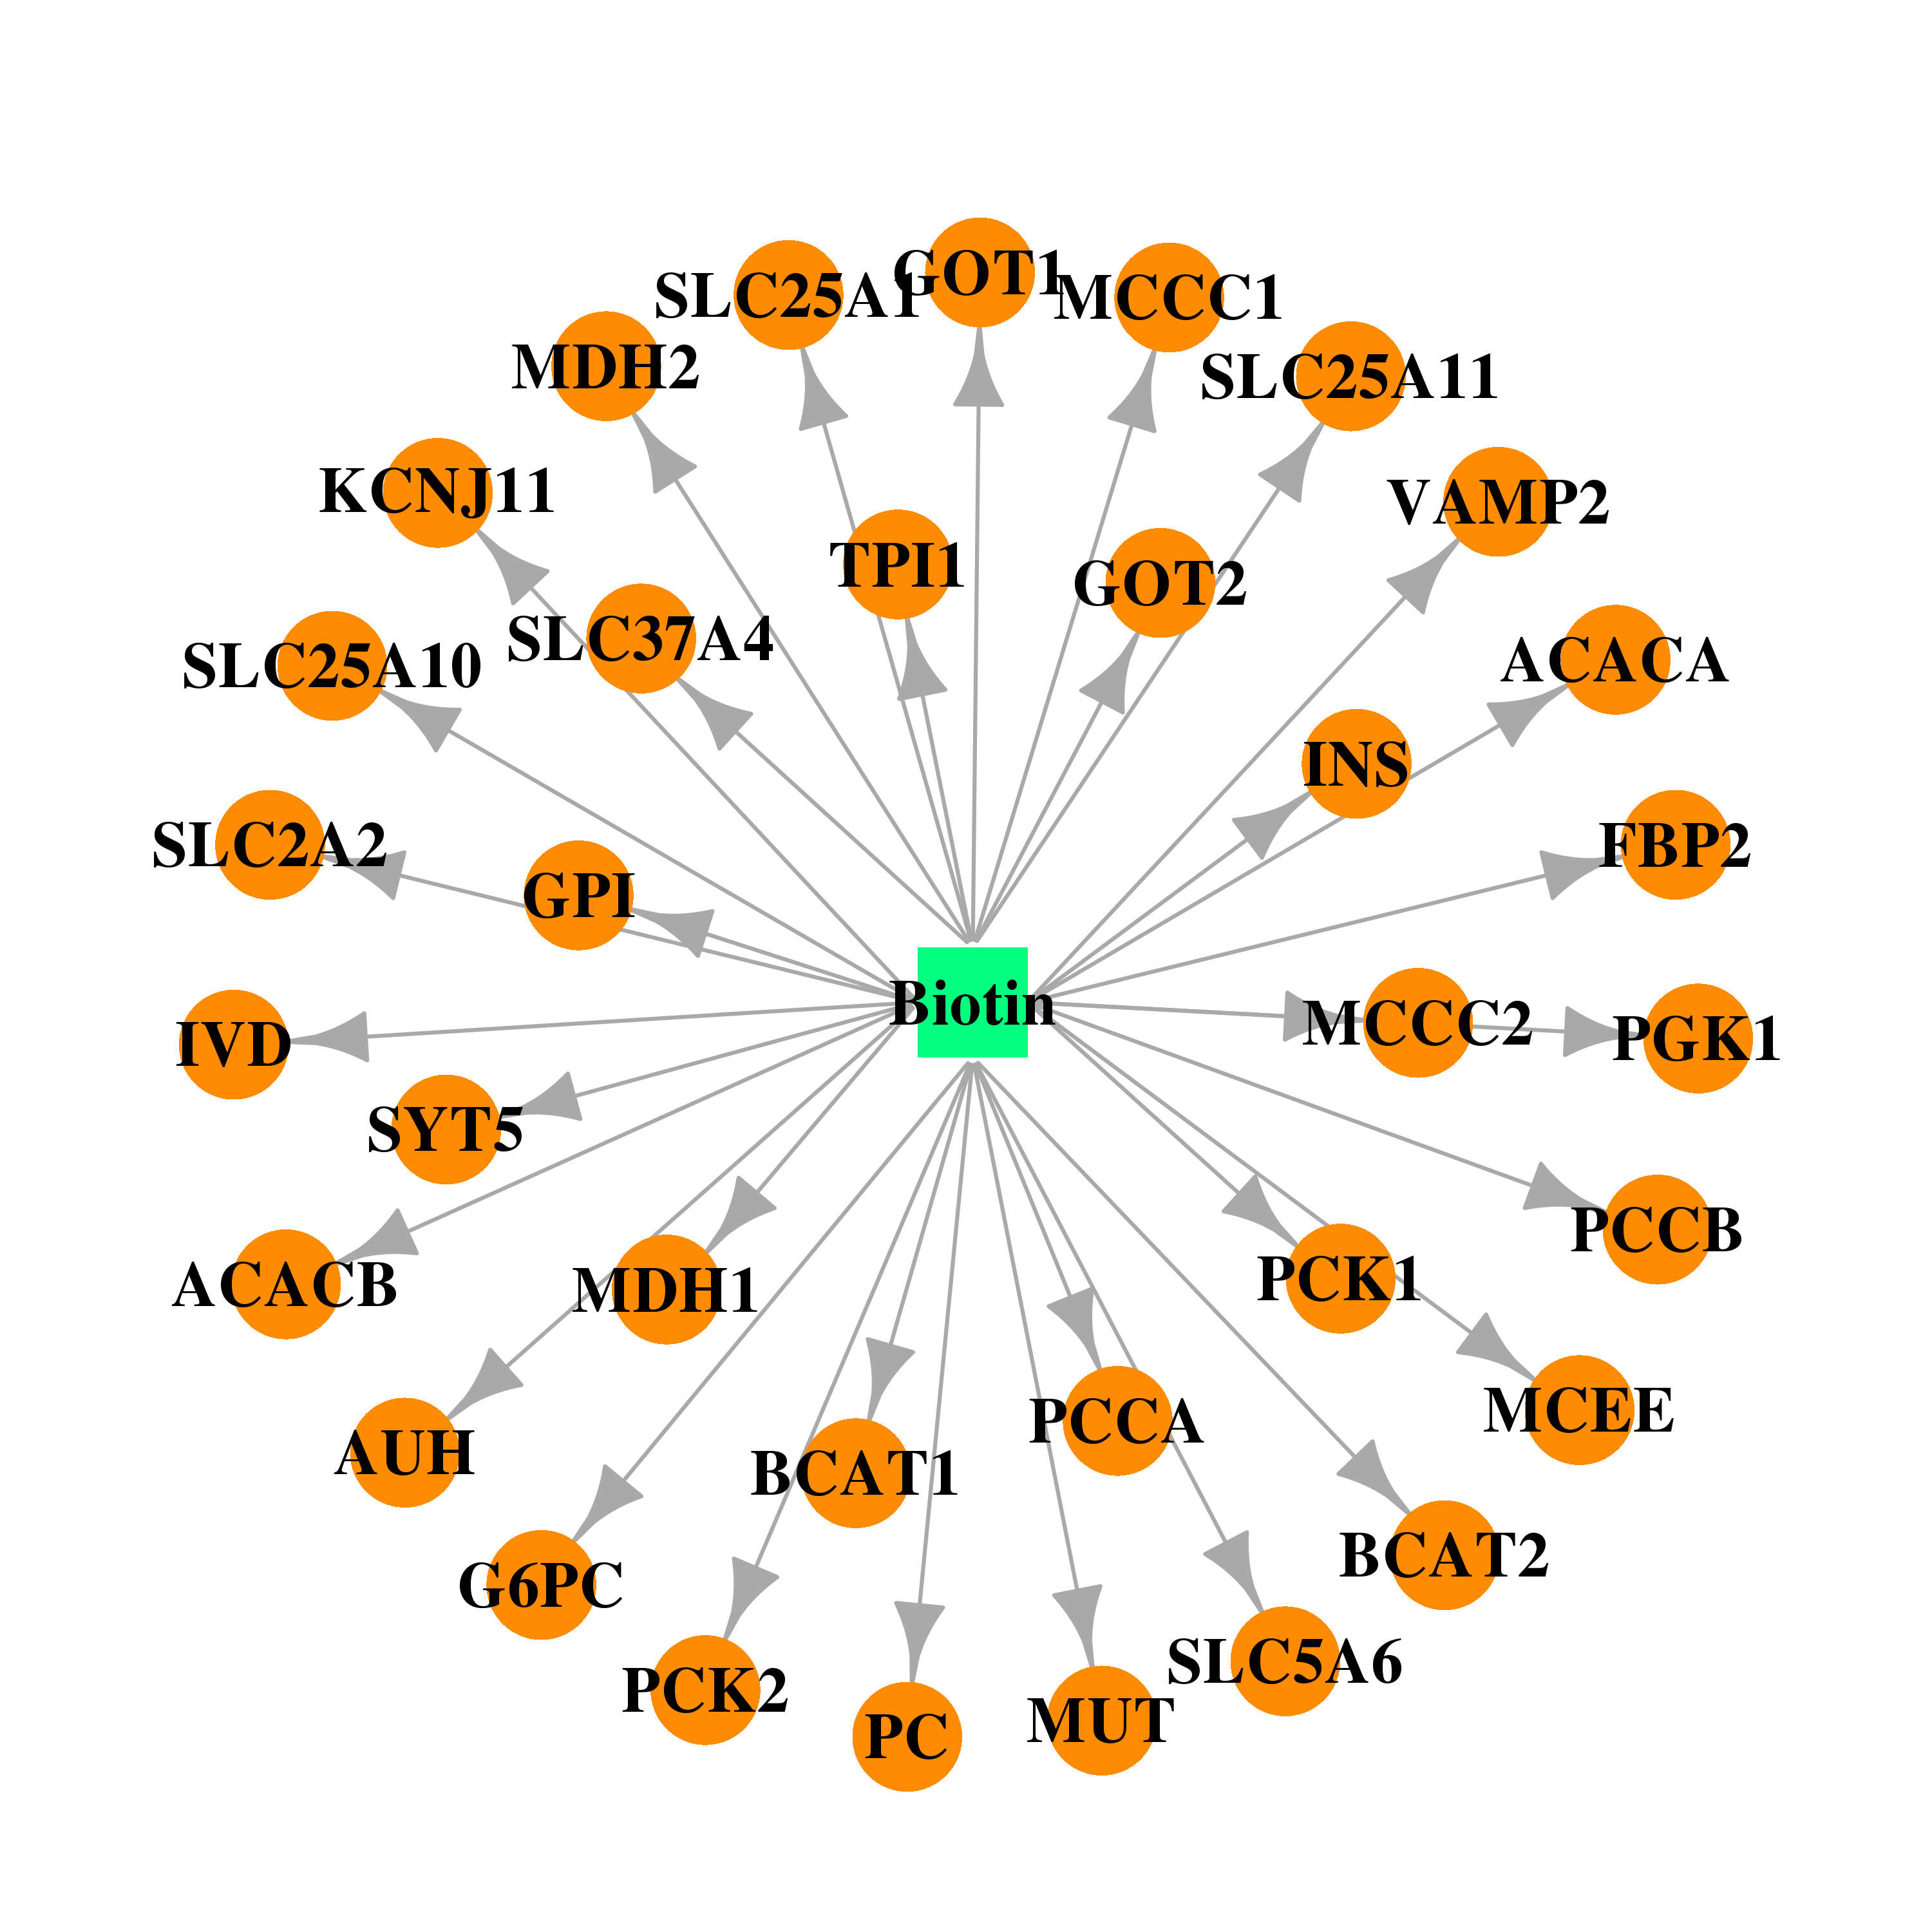 | 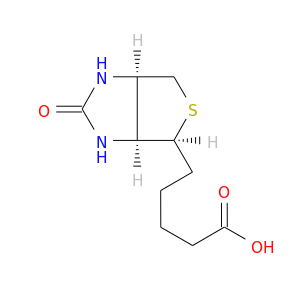 |
| Top |
| Cross referenced IDs for SYT5 |
| * We obtained these cross-references from Uniprot database. It covers 150 different DBs, 18 categories. http://www.uniprot.org/help/cross_references_section |
: Open all cross reference information
|
Copyright © 2016-Present - The Univsersity of Texas Health Science Center at Houston @ |