|
||||||||||||||||||||
| |
| Phenotypic Information (metabolism pathway, cancer, disease, phenome) |
| |
| |
| Gene-Gene Network Information: Co-Expression Network, Interacting Genes & KEGG |
| |
|


| Gene Summary for TAZ |
| Basic gene info. | Gene symbol | TAZ |
| Gene name | tafazzin | |
| Synonyms | BTHS|CMD3A|EFE|EFE2|G4.5|LVNCX|Taz1 | |
| Cytomap | UCSC genome browser: Xq28 | |
| Genomic location | chrX :153639876-153650063 | |
| Type of gene | protein-coding | |
| RefGenes | NM_000116.3, NM_181311.2,NM_181312.2,NM_181313.2,NR_024048.1, NM_181314.1, | |
| Ensembl id | ENSG00000268904 | |
| Description | protein G4.5 | |
| Modification date | 20141221 | |
| dbXrefs | MIM : 300394 | |
| HGNC : HGNC | ||
| Ensembl : ENSG00000102125 | ||
| HPRD : 02316 | ||
| Vega : OTTHUMG00000033190 | ||
| Protein | UniProt: go to UniProt's Cross Reference DB Table | |
| Expression | CleanEX: HS_TAZ | |
| BioGPS: 6901 | ||
| Gene Expression Atlas: ENSG00000268904 | ||
| The Human Protein Atlas: ENSG00000268904 | ||
| Pathway | NCI Pathway Interaction Database: TAZ | |
| KEGG: TAZ | ||
| REACTOME: TAZ | ||
| ConsensusPathDB | ||
| Pathway Commons: TAZ | ||
| Metabolism | MetaCyc: TAZ | |
| HUMANCyc: TAZ | ||
| Regulation | Ensembl's Regulation: ENSG00000268904 | |
| miRBase: chrX :153,639,876-153,650,063 | ||
| TargetScan: NM_000116 | ||
| cisRED: ENSG00000268904 | ||
| Context | iHOP: TAZ | |
| cancer metabolism search in PubMed: TAZ | ||
| UCL Cancer Institute: TAZ | ||
| Assigned class in ccmGDB | C | |
| Top |
| Phenotypic Information for TAZ(metabolism pathway, cancer, disease, phenome) |
| Cancer | CGAP: TAZ |
| Familial Cancer Database: TAZ | |
| * This gene is included in those cancer gene databases. |
|
|
|
|
|
| . | ||||||||||||||
Oncogene 1 | Significant driver gene in | |||||||||||||||||||
| cf) number; DB name 1 Oncogene; http://nar.oxfordjournals.org/content/35/suppl_1/D721.long, 2 Tumor Suppressor gene; https://bioinfo.uth.edu/TSGene/, 3 Cancer Gene Census; http://www.nature.com/nrc/journal/v4/n3/abs/nrc1299.html, 4 CancerGenes; http://nar.oxfordjournals.org/content/35/suppl_1/D721.long, 5 Network of Cancer Gene; http://ncg.kcl.ac.uk/index.php, 1Therapeutic Vulnerabilities in Cancer; http://cbio.mskcc.org/cancergenomics/statius/ |
| KEGG_GLYCEROPHOSPHOLIPID_METABOLISM REACTOME_PHOSPHOLIPID_METABOLISM REACTOME_METABOLISM_OF_PROTEINS REACTOME_METABOLISM_OF_LIPIDS_AND_LIPOPROTEINS | |
| OMIM | |
| Orphanet | |
| Disease | KEGG Disease: TAZ |
| MedGen: TAZ (Human Medical Genetics with Condition) | |
| ClinVar: TAZ | |
| Phenotype | MGI: TAZ (International Mouse Phenotyping Consortium) |
| PhenomicDB: TAZ | |
| Mutations for TAZ |
| * Under tables are showing count per each tissue to give us broad intuition about tissue specific mutation patterns.You can go to the detailed page for each mutation database's web site. |
| There's no structural variation information in COSMIC data for this gene. |
| * From mRNA Sanger sequences, Chitars2.0 arranged chimeric transcripts. This table shows TAZ related fusion information. |
| ID | Head Gene | Tail Gene | Accession | Gene_a | qStart_a | qEnd_a | Chromosome_a | tStart_a | tEnd_a | Gene_a | qStart_a | qEnd_a | Chromosome_a | tStart_a | tEnd_a |
| AW375494 | C21orf33 | 1 | 89 | 21 | 45565491 | 45565579 | TAZ | 81 | 203 | X | 153649922 | 153650046 | |
| Top |
| There's no copy number variation information in COSMIC data for this gene. |
| Top |
|
 |
| Top |
| Stat. for Non-Synonymous SNVs (# total SNVs=3) | (# total SNVs=3) |
 |  |
(# total SNVs=0) | (# total SNVs=0) |
| Top |
| * When you move the cursor on each content, you can see more deailed mutation information on the Tooltip. Those are primary_site,primary_histology,mutation(aa),pubmedID. |
| GRCh37 position | Mutation(aa) | Unique sampleID count |
| chr23:153640228-153640228 | p.T16T | 1 |
| chr23:153640245-153640245 | p.S22N | 1 |
| chr23:153640435-153640435 | p.H41L | 1 |
| chr23:153640454-153640454 | p.R47R | 1 |
| chr23:153640475-153640475 | p.I54I | 1 |
| chr23:153640483-153640483 | p.R57Q | 1 |
| chr23:153640545-153640545 | p.L78I | 1 |
| chr23:153641561-153641561 | p.H86N | 1 |
| chr23:153641587-153641587 | p.R94R | 1 |
| Top |
|
 |
| Point Mutation/ Tissue ID | 1 | 2 | 3 | 4 | 5 | 6 | 7 | 8 | 9 | 10 | 11 | 12 | 13 | 14 | 15 | 16 | 17 | 18 | 19 | 20 |
| # sample | 2 | 1 | 1 | 1 | 2 | 3 | 1 | 2 | 1 | 4 | ||||||||||
| # mutation | 2 | 1 | 1 | 1 | 2 | 3 | 1 | 2 | 1 | 4 | ||||||||||
| nonsynonymous SNV | 2 | 1 | 1 | 1 | 2 | 3 | 1 | 1 | 1 | 3 | ||||||||||
| synonymous SNV | 1 | 1 |
| cf) Tissue ID; Tissue type (1; BLCA[Bladder Urothelial Carcinoma], 2; BRCA[Breast invasive carcinoma], 3; CESC[Cervical squamous cell carcinoma and endocervical adenocarcinoma], 4; COAD[Colon adenocarcinoma], 5; GBM[Glioblastoma multiforme], 6; Glioma Low Grade, 7; HNSC[Head and Neck squamous cell carcinoma], 8; KICH[Kidney Chromophobe], 9; KIRC[Kidney renal clear cell carcinoma], 10; KIRP[Kidney renal papillary cell carcinoma], 11; LAML[Acute Myeloid Leukemia], 12; LUAD[Lung adenocarcinoma], 13; LUSC[Lung squamous cell carcinoma], 14; OV[Ovarian serous cystadenocarcinoma ], 15; PAAD[Pancreatic adenocarcinoma], 16; PRAD[Prostate adenocarcinoma], 17; SKCM[Skin Cutaneous Melanoma], 18:STAD[Stomach adenocarcinoma], 19:THCA[Thyroid carcinoma], 20:UCEC[Uterine Corpus Endometrial Carcinoma]) |
| Top |
| * We represented just top 10 SNVs. When you move the cursor on each content, you can see more deailed mutation information on the Tooltip. Those are primary_site, primary_histology, mutation(aa), pubmedID. |
| Genomic Position | Mutation(aa) | Unique sampleID count |
| chrX:153640245 | p.R47R,TAZ | 1 |
| chrX:153648555 | p.K213N,TAZ | 1 |
| chrX:153640454 | p.T223A,TAZ | 1 |
| chrX:153648575 | p.I54I,TAZ | 1 |
| chrX:153640475 | p.R57Q,TAZ | 1 |
| chrX:153649016 | p.L78I,TAZ | 1 |
| chrX:153640483 | p.P97T,TAZ | 1 |
| chrX:153649022 | p.R151K,TAZ | 1 |
| chrX:153640545 | p.N154S,TAZ | 1 |
| chrX:153649030 | p.S157F,TAZ | 1 |
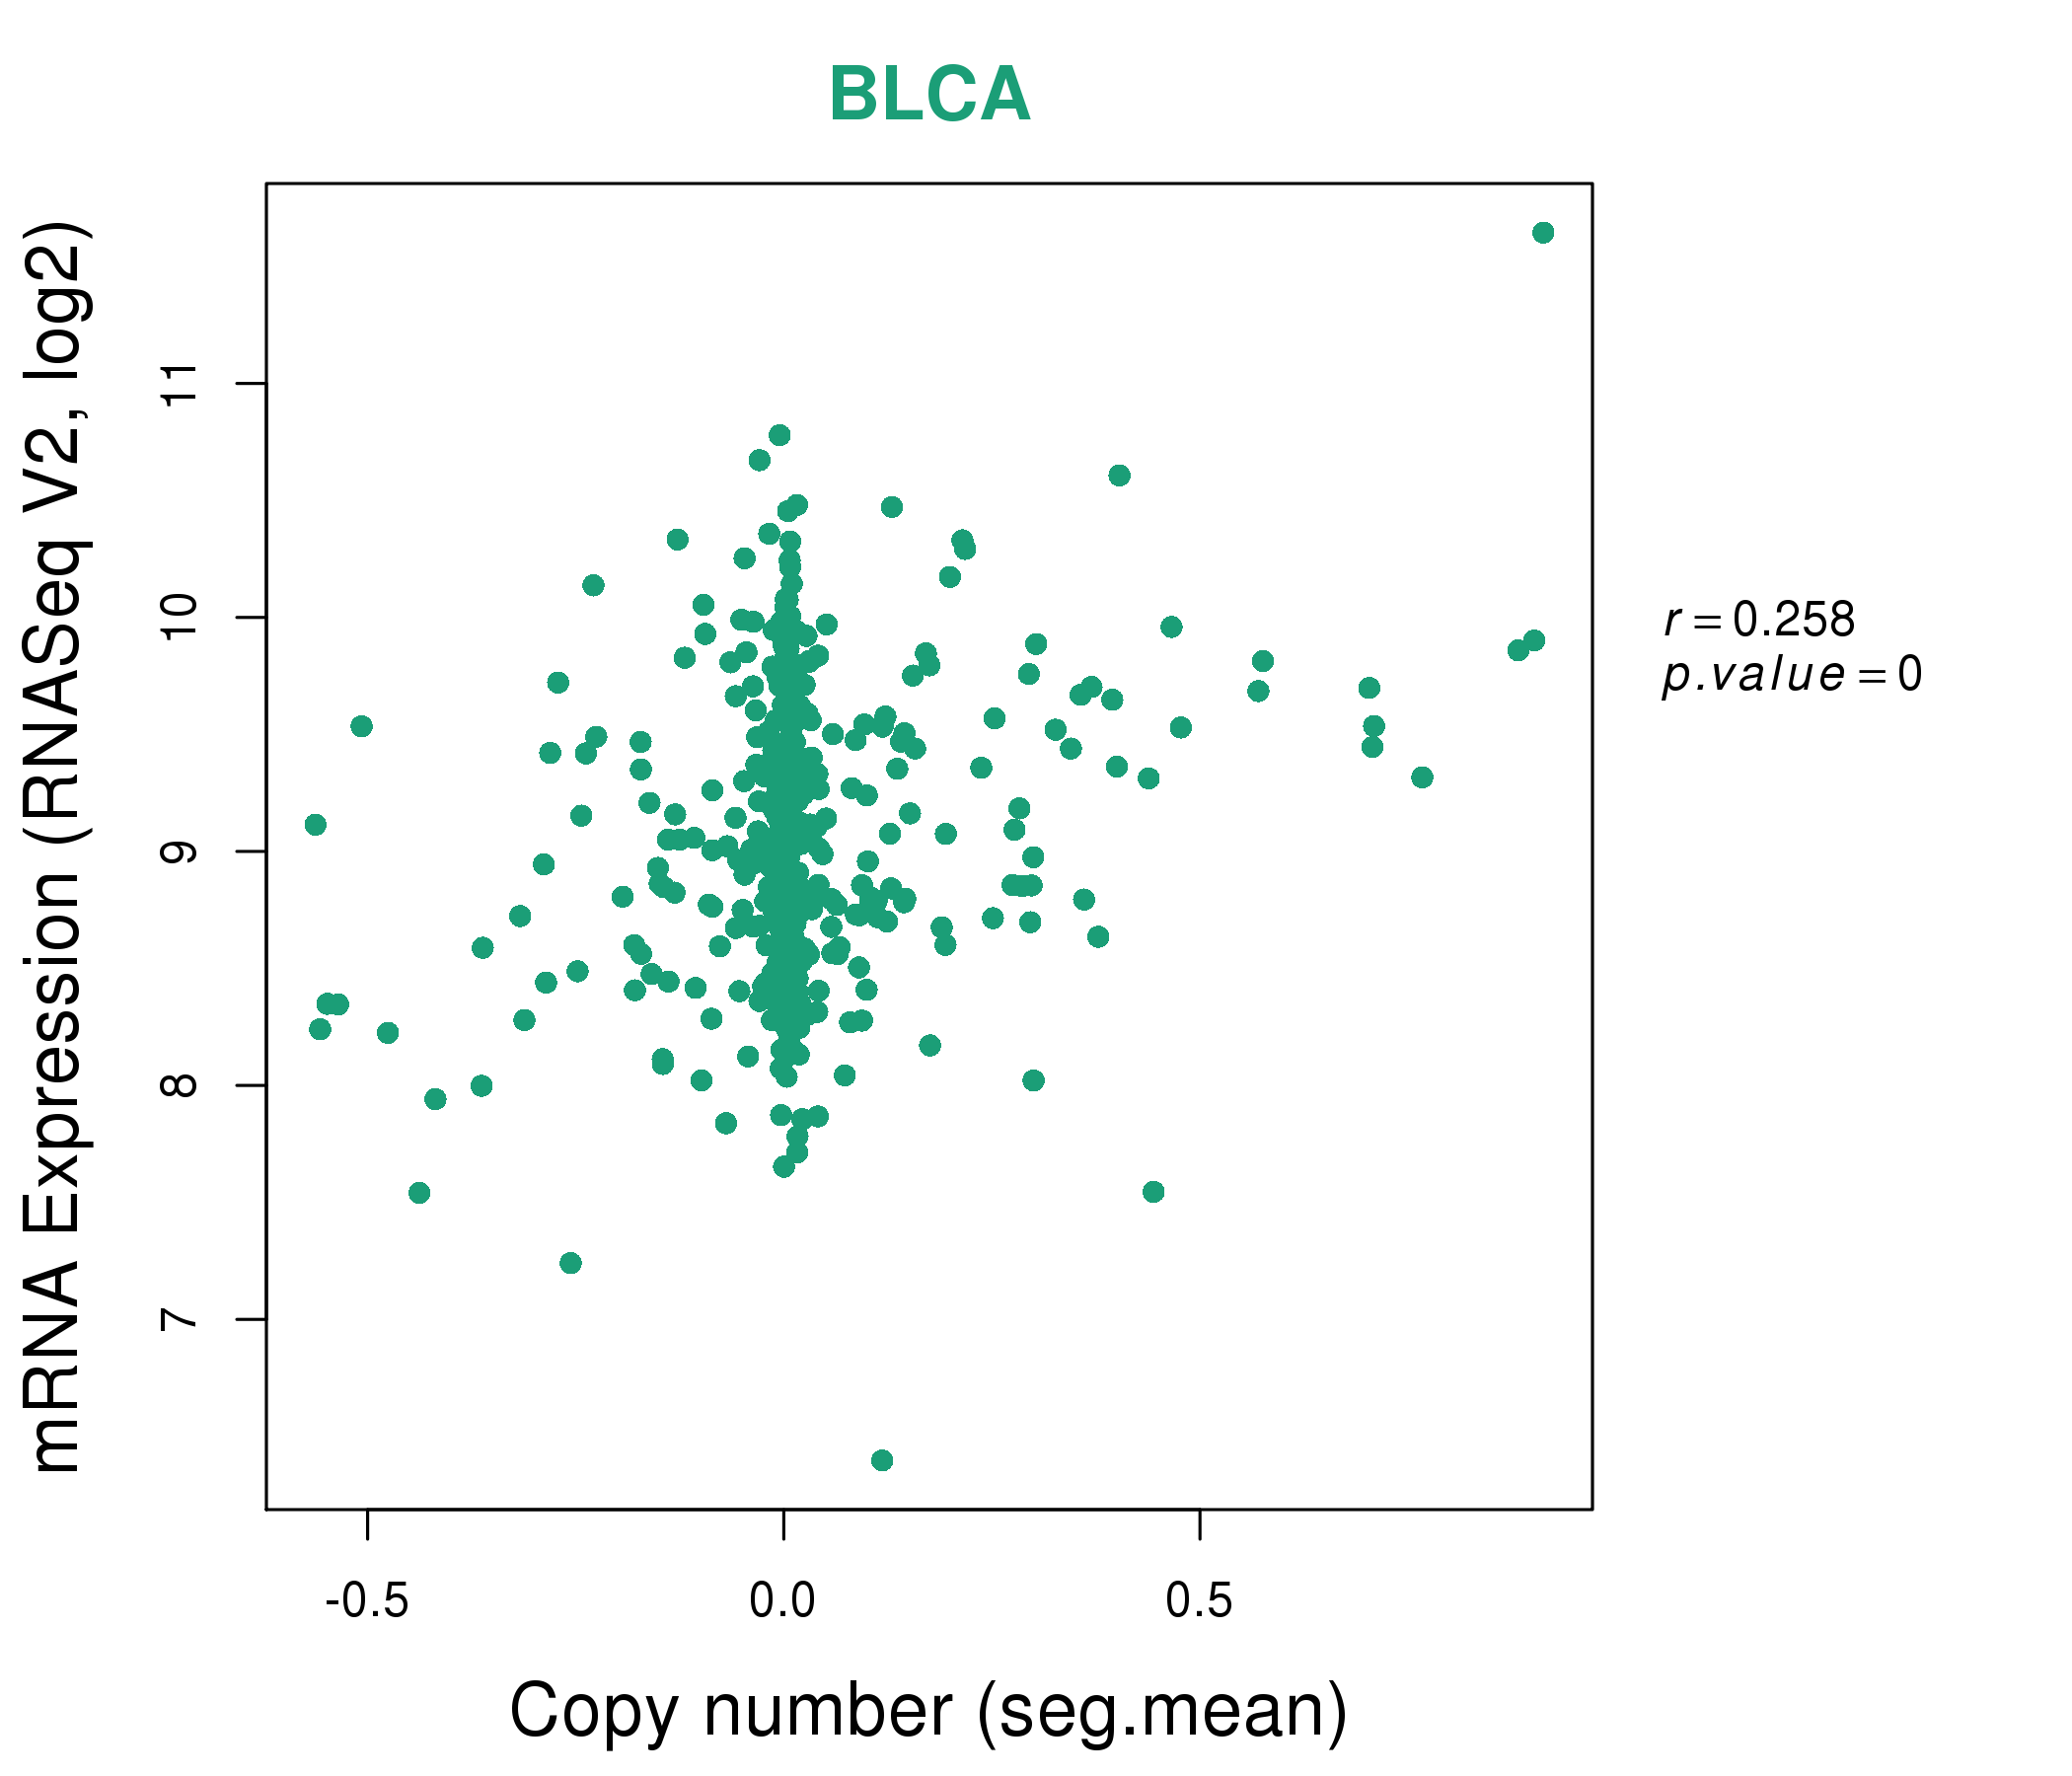
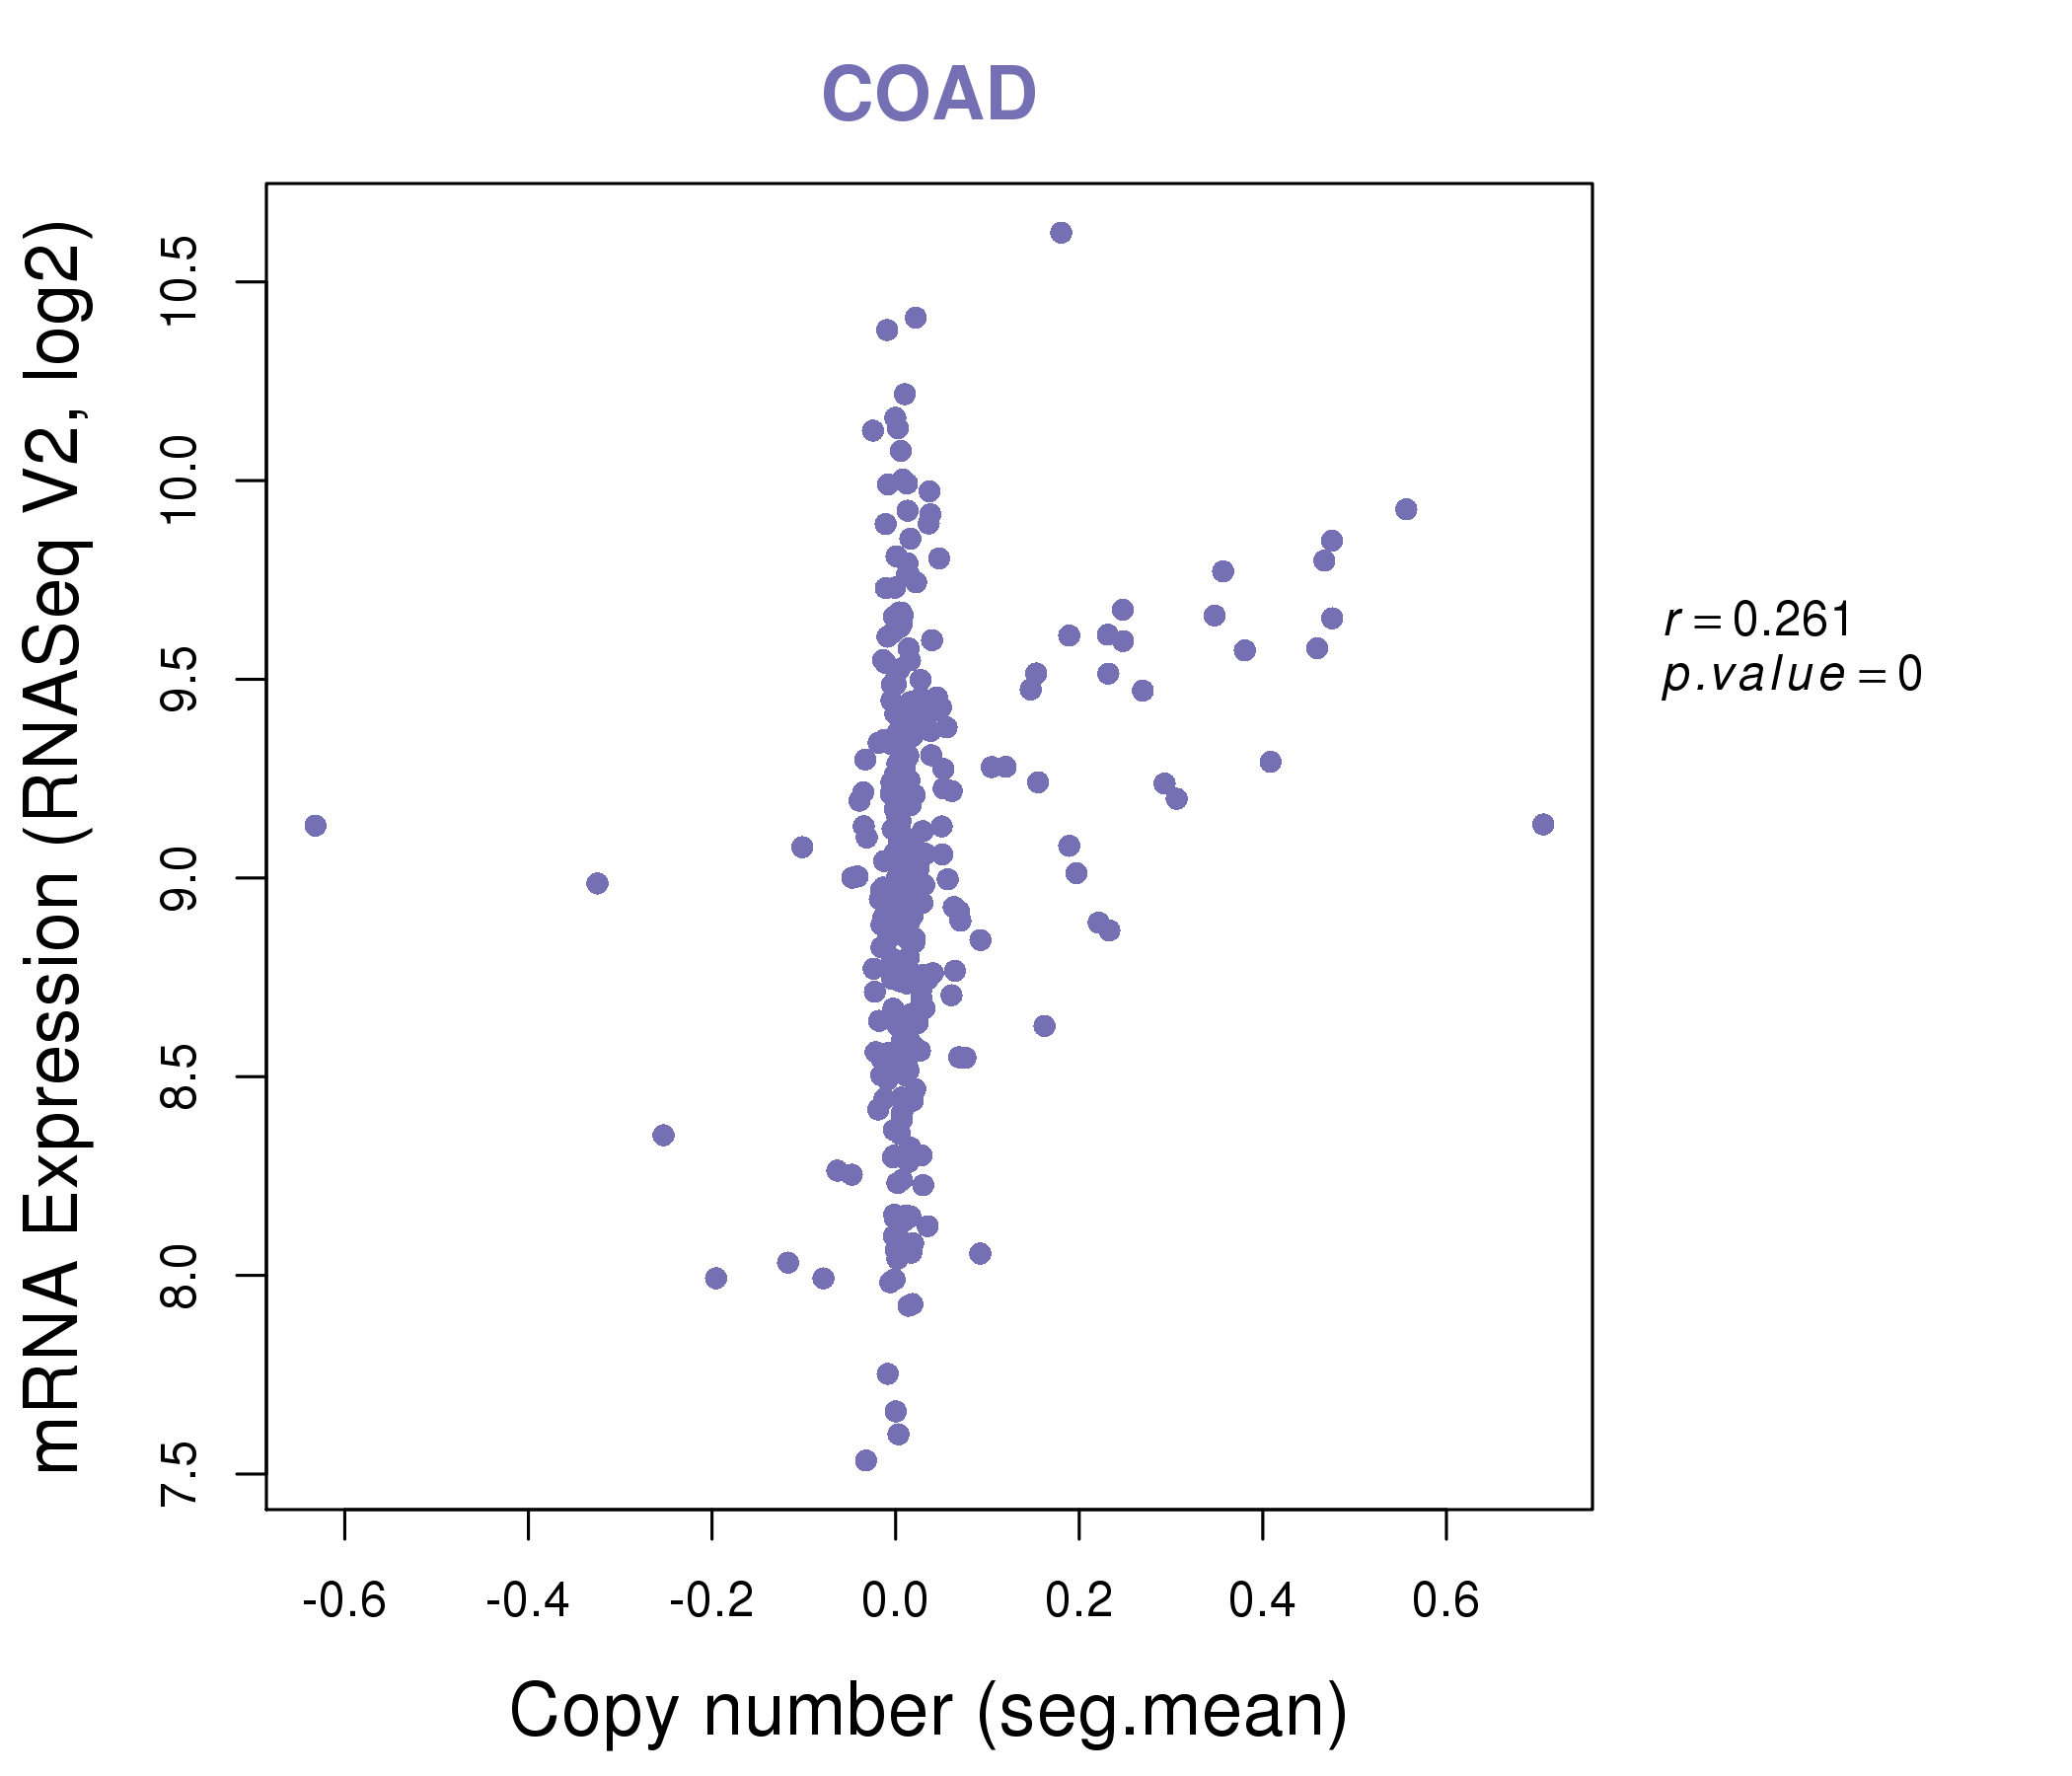
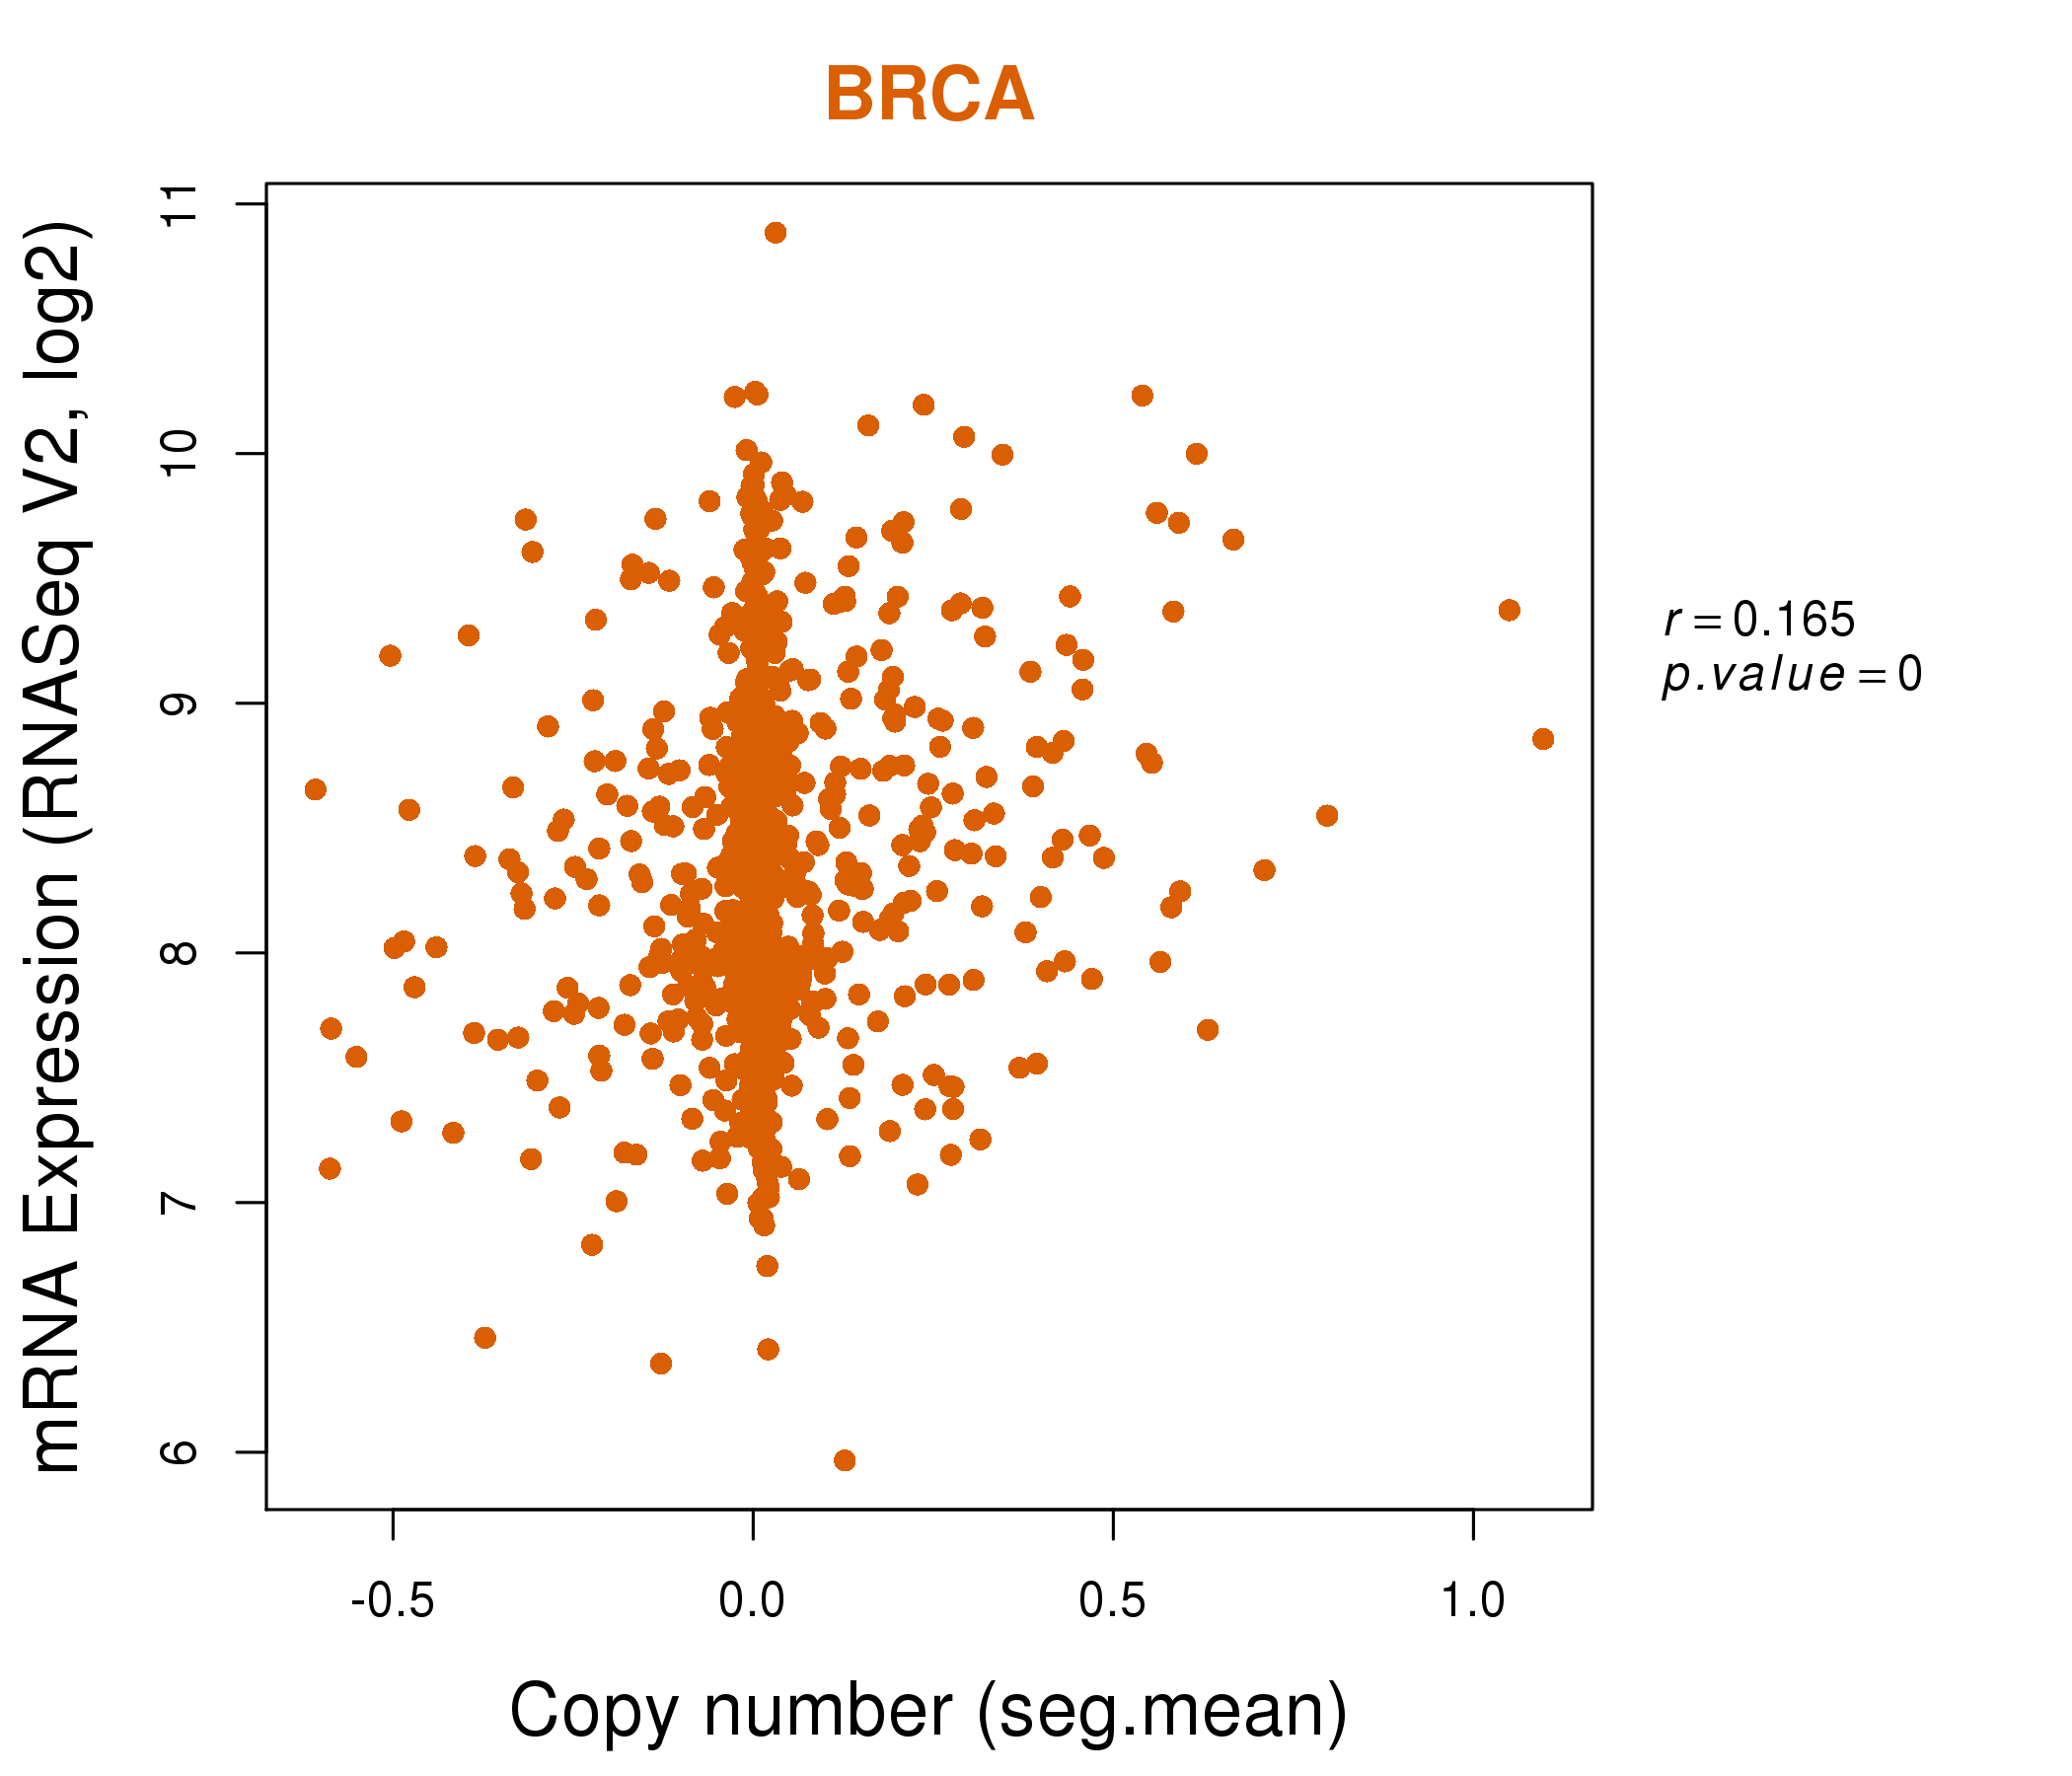
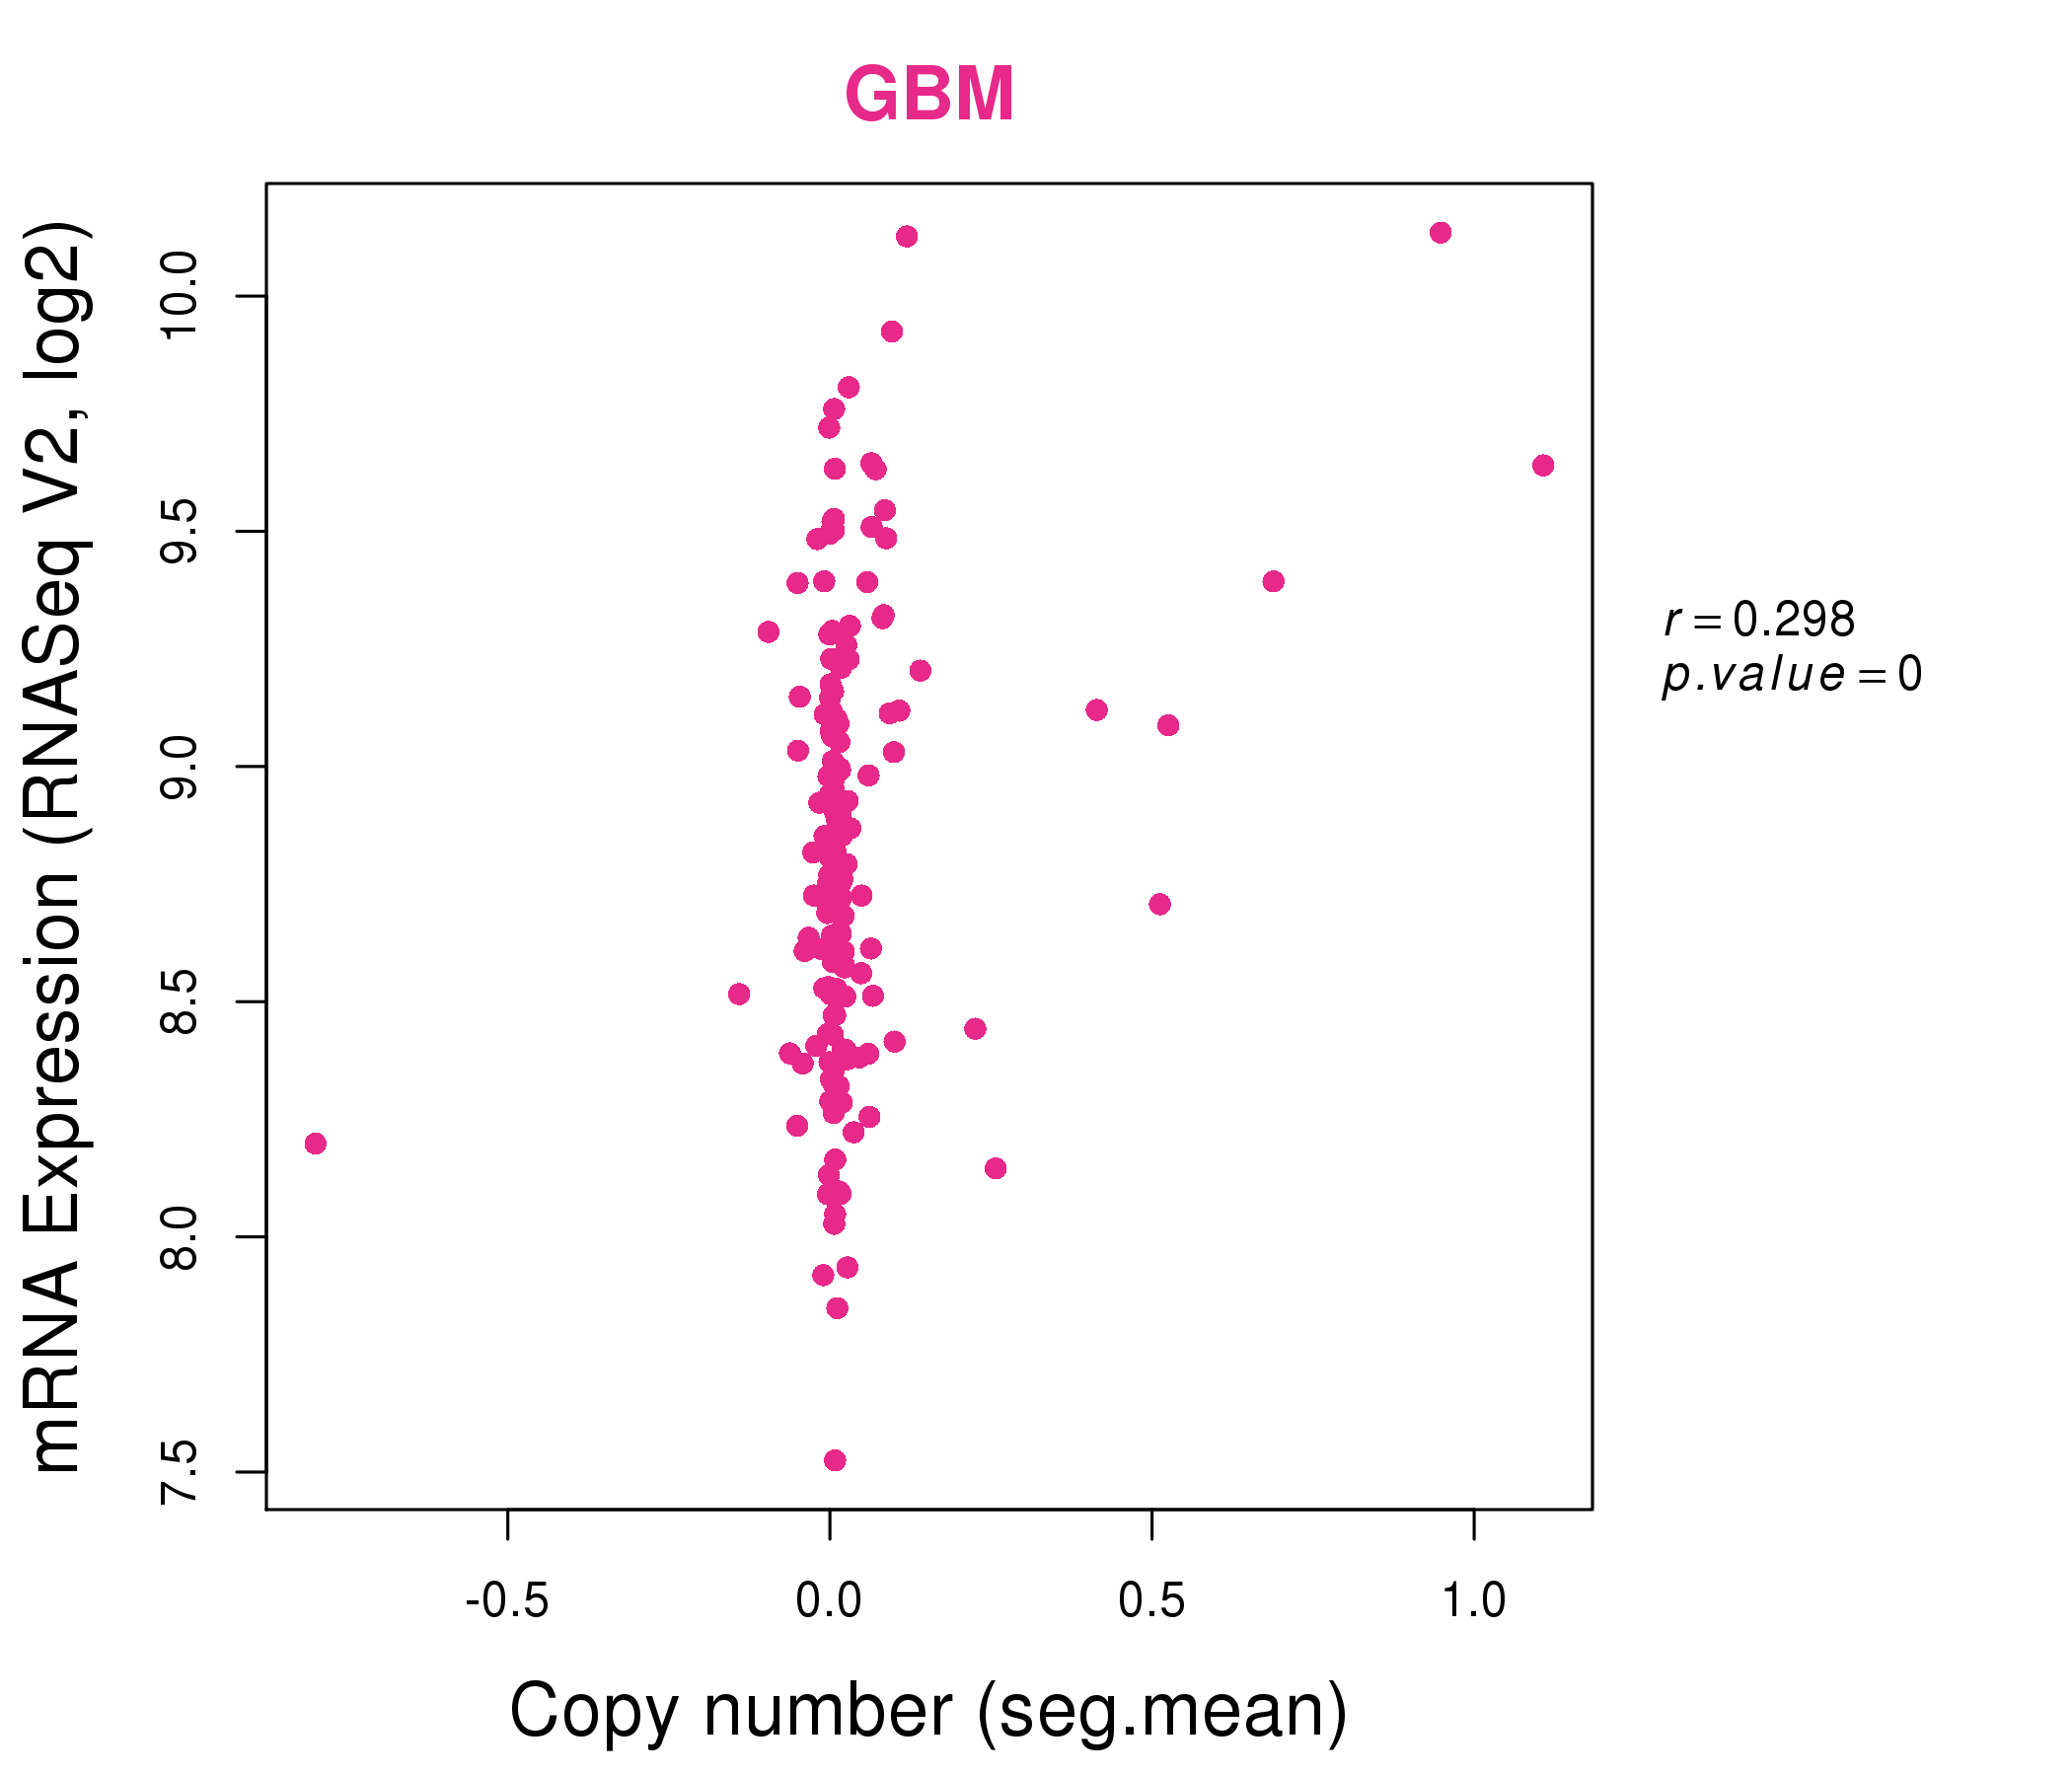
| * Copy number data were extracted from TCGA using R package TCGA-Assembler. The URLs of all public data files on TCGA DCC data server were gathered on Jan-05-2015. Function ProcessCNAData in TCGA-Assembler package was used to obtain gene-level copy number value which is calculated as the average copy number of the genomic region of a gene. |
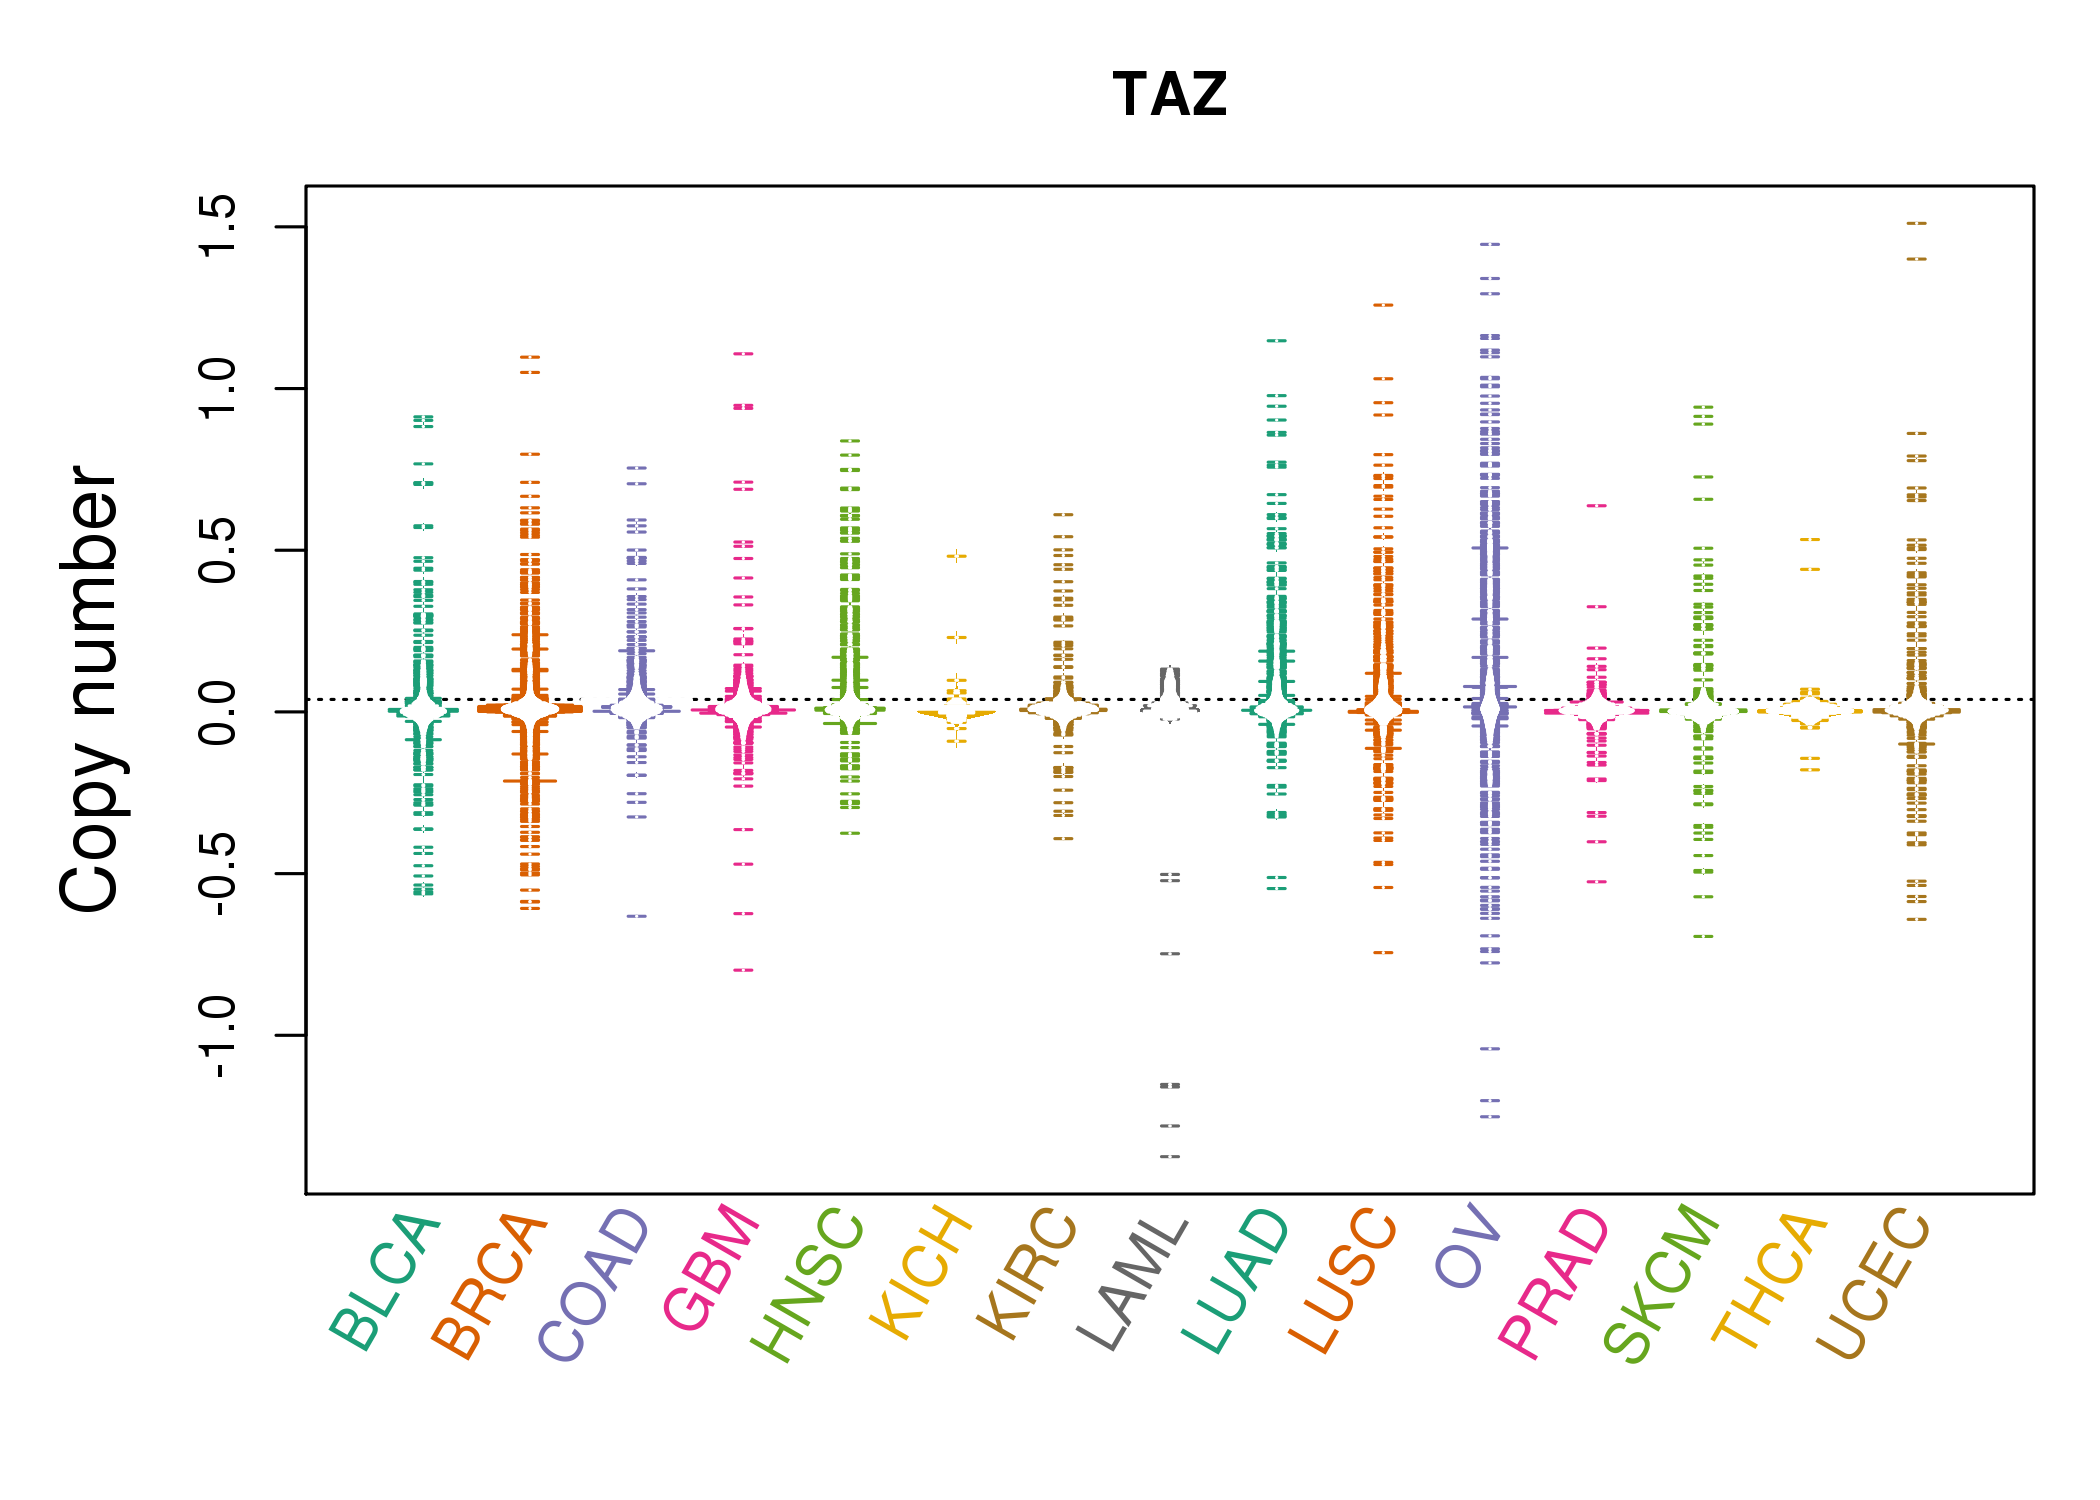 |
| cf) Tissue ID[Tissue type]: BLCA[Bladder Urothelial Carcinoma], BRCA[Breast invasive carcinoma], CESC[Cervical squamous cell carcinoma and endocervical adenocarcinoma], COAD[Colon adenocarcinoma], GBM[Glioblastoma multiforme], Glioma Low Grade, HNSC[Head and Neck squamous cell carcinoma], KICH[Kidney Chromophobe], KIRC[Kidney renal clear cell carcinoma], KIRP[Kidney renal papillary cell carcinoma], LAML[Acute Myeloid Leukemia], LUAD[Lung adenocarcinoma], LUSC[Lung squamous cell carcinoma], OV[Ovarian serous cystadenocarcinoma ], PAAD[Pancreatic adenocarcinoma], PRAD[Prostate adenocarcinoma], SKCM[Skin Cutaneous Melanoma], STAD[Stomach adenocarcinoma], THCA[Thyroid carcinoma], UCEC[Uterine Corpus Endometrial Carcinoma] |
| Top |
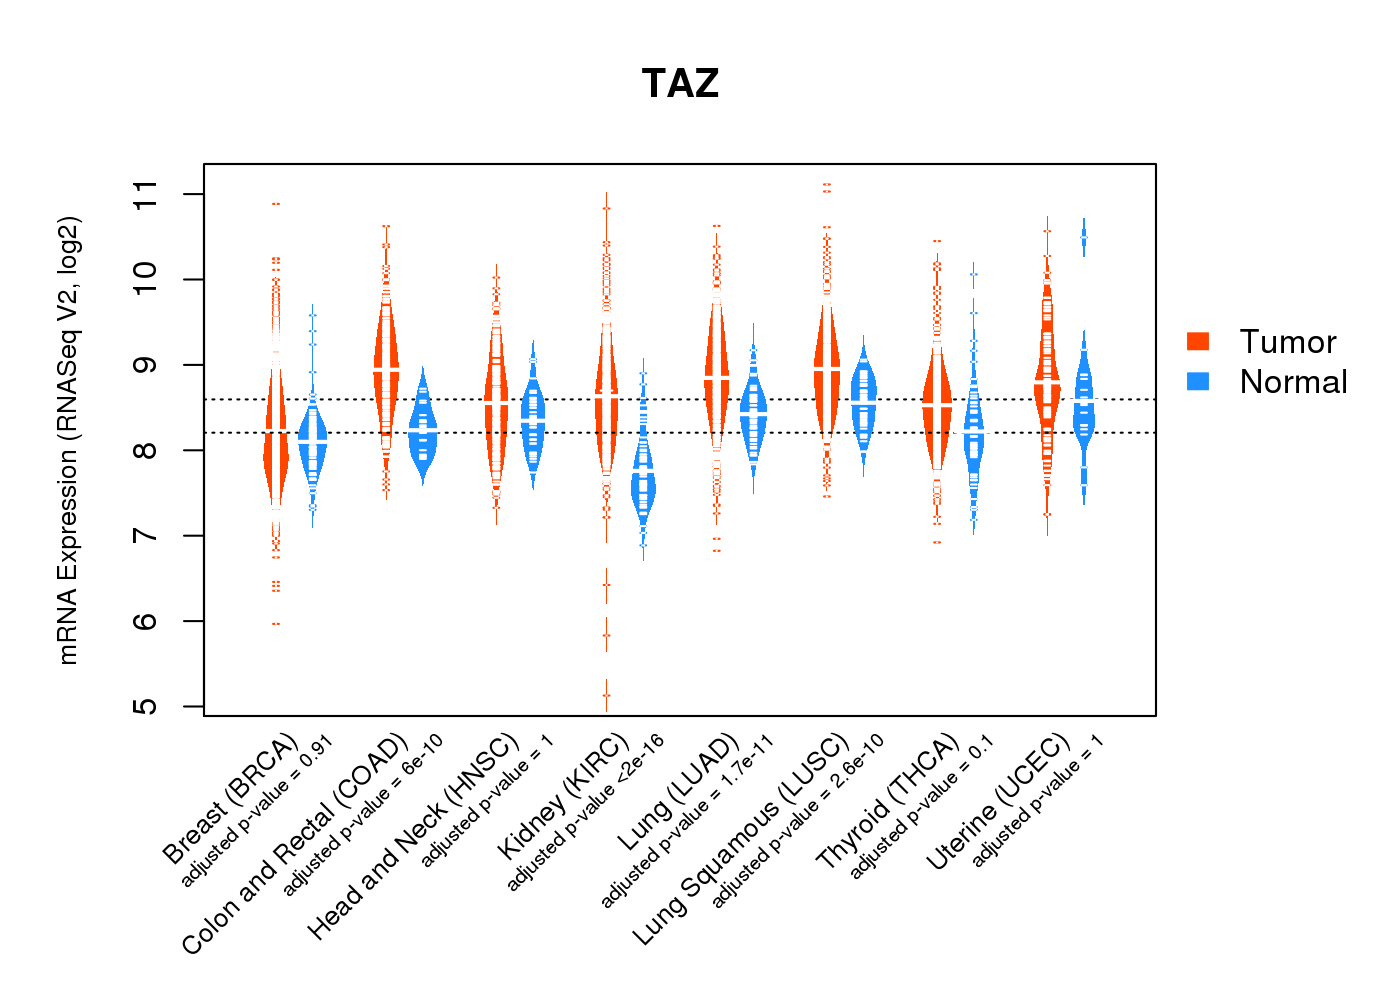
| Gene Expression for TAZ |
| * CCLE gene expression data were extracted from CCLE_Expression_Entrez_2012-10-18.res: Gene-centric RMA-normalized mRNA expression data. |
 |
| * Normalized gene expression data of RNASeqV2 was extracted from TCGA using R package TCGA-Assembler. The URLs of all public data files on TCGA DCC data server were gathered at Jan-05-2015. Only eight cancer types have enough normal control samples for differential expression analysis. (t test, adjusted p<0.05 (using Benjamini-Hochberg FDR)) |
 |
| Top |
| * This plots show the correlation between CNV and gene expression. |
: Open all plots for all cancer types
 |
|
 |
|
| Top |
| Gene-Gene Network Information |
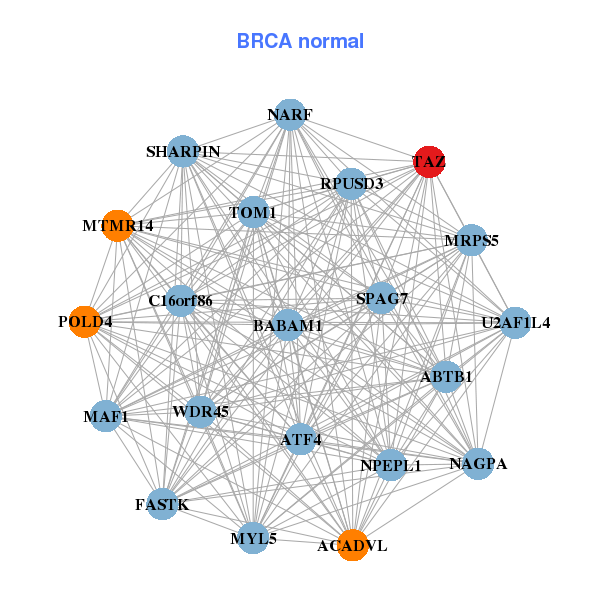
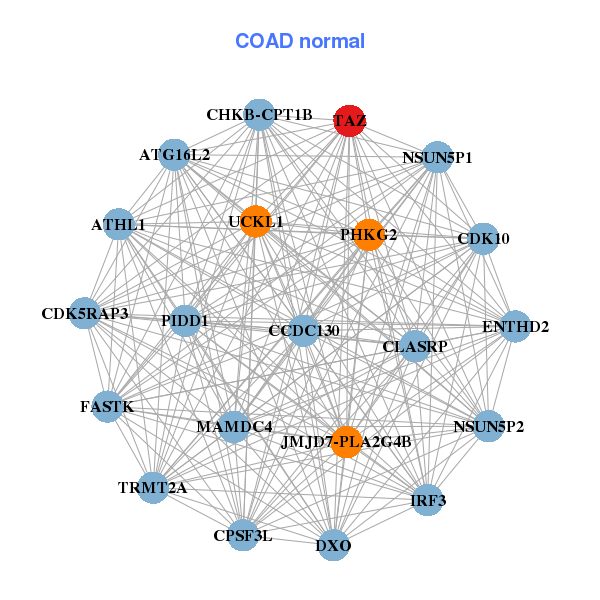
| * Co-Expression network figures were drawn using R package igraph. Only the top 20 genes with the highest correlations were shown. Red circle: input gene, orange circle: cell metabolism gene, sky circle: other gene |
: Open all plots for all cancer types
 |
|
| ANKS3,BRAT1,PPP1R35,CCDC12,CENPT,EMD,FAM3A, FAM50A,FAM58A,FASTK,HAUS7,IDH3G,IKBKG,INO80E, KMT2E-AS1,NSUN5P1,PSMG3,TAZ,TMUB1,WASH3P,WASH7P | ABTB1,ACADVL,ATF4,C16orf86,BABAM1,FASTK,MAF1, MRPS5,MTMR14,MYL5,NAGPA,NARF,NPEPL1,POLD4, RPUSD3,SHARPIN,SPAG7,TAZ,TOM1,U2AF1L4,WDR45 |
 |
|
| BCAP31,EMD,FAM122B,FAM3A,FAM50A,FAM58A,HAUS7, IDH3G,IKBKG,LAGE3,LAS1L,MCTS1,CMC4,NAA10, NKAP,SLC25A14,TAZ,TIMM8A,TSR2,UTP14A,VMA21 | ATG16L2,ATHL1,ENTHD2,CCDC130,CDK10,CDK5RAP3,CHKB-CPT1B, CPSF3L,DXO,FASTK,IRF3,JMJD7-PLA2G4B,PIDD1,MAMDC4, NSUN5P1,NSUN5P2,PHKG2,CLASRP,TAZ,TRMT2A,UCKL1 |
| * Co-Expression network figures were drawn using R package igraph. Only the top 20 genes with the highest correlations were shown. Red circle: input gene, orange circle: cell metabolism gene, sky circle: other gene |
: Open all plots for all cancer types
| Top |
: Open all interacting genes' information including KEGG pathway for all interacting genes from DAVID
| Top |
| Pharmacological Information for TAZ |
| There's no related Drug. |
| Top |
| Cross referenced IDs for TAZ |
| * We obtained these cross-references from Uniprot database. It covers 150 different DBs, 18 categories. http://www.uniprot.org/help/cross_references_section |
: Open all cross reference information
|
Copyright © 2016-Present - The Univsersity of Texas Health Science Center at Houston @ |