|
||||||||||||||||||||
| |
| Phenotypic Information (metabolism pathway, cancer, disease, phenome) |
| |
| |
| Gene-Gene Network Information: Co-Expression Network, Interacting Genes & KEGG |
| |
|


| Gene Summary for TBCC |
| Basic gene info. | Gene symbol | TBCC |
| Gene name | tubulin folding cofactor C | |
| Synonyms | CFC | |
| Cytomap | UCSC genome browser: 6p21.1 | |
| Genomic location | chr6 :42712233-42713884 | |
| Type of gene | protein-coding | |
| RefGenes | NM_003192.2, | |
| Ensembl id | ENSG00000124659 | |
| Description | tubulin-folding cofactor Ctubulin-specific chaperone C | |
| Modification date | 20141207 | |
| dbXrefs | MIM : 602971 | |
| HGNC : HGNC | ||
| Ensembl : ENSG00000124659 | ||
| HPRD : 04276 | ||
| Vega : OTTHUMG00000014704 | ||
| Protein | UniProt: go to UniProt's Cross Reference DB Table | |
| Expression | CleanEX: HS_TBCC | |
| BioGPS: 6903 | ||
| Gene Expression Atlas: ENSG00000124659 | ||
| The Human Protein Atlas: ENSG00000124659 | ||
| Pathway | NCI Pathway Interaction Database: TBCC | |
| KEGG: TBCC | ||
| REACTOME: TBCC | ||
| ConsensusPathDB | ||
| Pathway Commons: TBCC | ||
| Metabolism | MetaCyc: TBCC | |
| HUMANCyc: TBCC | ||
| Regulation | Ensembl's Regulation: ENSG00000124659 | |
| miRBase: chr6 :42,712,233-42,713,884 | ||
| TargetScan: NM_003192 | ||
| cisRED: ENSG00000124659 | ||
| Context | iHOP: TBCC | |
| cancer metabolism search in PubMed: TBCC | ||
| UCL Cancer Institute: TBCC | ||
| Assigned class in ccmGDB | C | |
| Top |
| Phenotypic Information for TBCC(metabolism pathway, cancer, disease, phenome) |
| Cancer | CGAP: TBCC |
| Familial Cancer Database: TBCC | |
| * This gene is included in those cancer gene databases. |
|
|
|
|
|
| . | ||||||||||||||
Oncogene 1 | Significant driver gene in | |||||||||||||||||||
| cf) number; DB name 1 Oncogene; http://nar.oxfordjournals.org/content/35/suppl_1/D721.long, 2 Tumor Suppressor gene; https://bioinfo.uth.edu/TSGene/, 3 Cancer Gene Census; http://www.nature.com/nrc/journal/v4/n3/abs/nrc1299.html, 4 CancerGenes; http://nar.oxfordjournals.org/content/35/suppl_1/D721.long, 5 Network of Cancer Gene; http://ncg.kcl.ac.uk/index.php, 1Therapeutic Vulnerabilities in Cancer; http://cbio.mskcc.org/cancergenomics/statius/ |
| REACTOME_METABOLISM_OF_PROTEINS | |
| OMIM | |
| Orphanet | |
| Disease | KEGG Disease: TBCC |
| MedGen: TBCC (Human Medical Genetics with Condition) | |
| ClinVar: TBCC | |
| Phenotype | MGI: TBCC (International Mouse Phenotyping Consortium) |
| PhenomicDB: TBCC | |
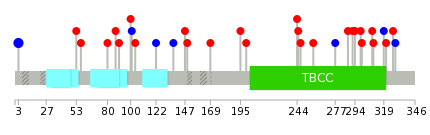
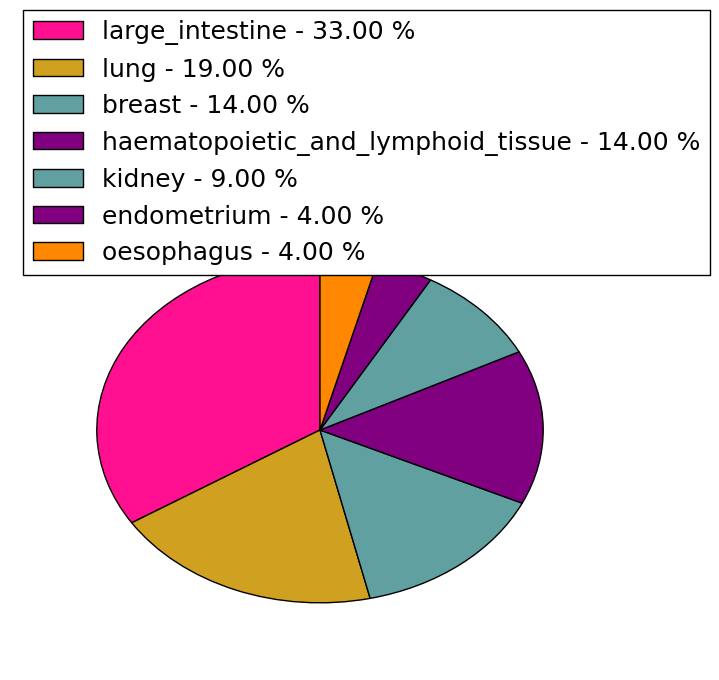
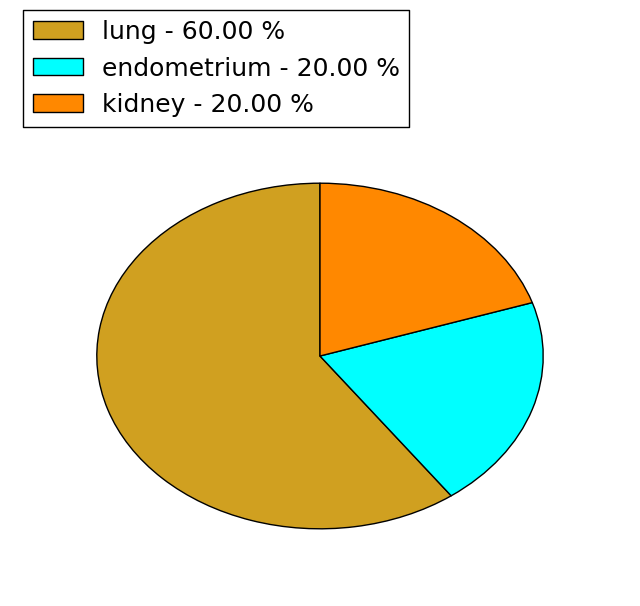
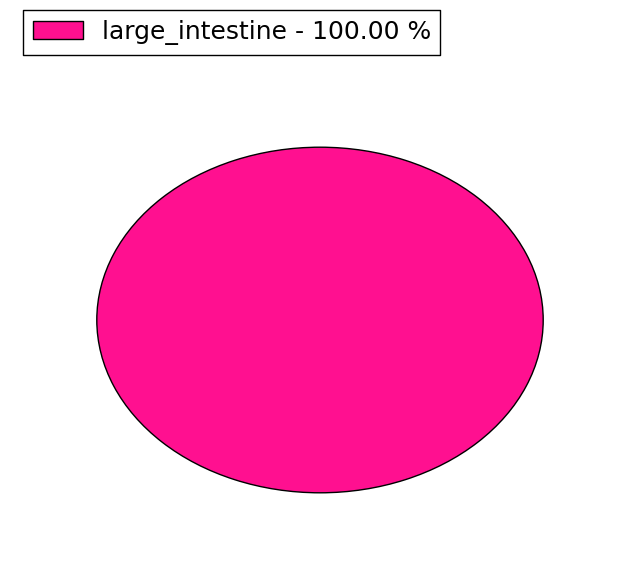
| Mutations for TBCC |
| * Under tables are showing count per each tissue to give us broad intuition about tissue specific mutation patterns.You can go to the detailed page for each mutation database's web site. |
| There's no structural variation information in COSMIC data for this gene. |
| * From mRNA Sanger sequences, Chitars2.0 arranged chimeric transcripts. This table shows TBCC related fusion information. |
| ID | Head Gene | Tail Gene | Accession | Gene_a | qStart_a | qEnd_a | Chromosome_a | tStart_a | tEnd_a | Gene_a | qStart_a | qEnd_a | Chromosome_a | tStart_a | tEnd_a |
| BQ670175 | TBCC | 1 | 439 | 6 | 42712531 | 42712968 | TNFRSF12A | 440 | 565 | 16 | 3072058 | 3072183 | |
| BQ052721 | ISG20 | 1 | 107 | 15 | 89182271 | 89182642 | TBCC | 108 | 374 | 6 | 42713447 | 42713713 | |
| BE349632 | TBCC | 8 | 249 | 6 | 42712236 | 42712477 | ELMO1 | 247 | 451 | 7 | 36954372 | 36954576 | |
| Top |
| There's no copy number variation information in COSMIC data for this gene. |
| Top |
|
 |
| Top |
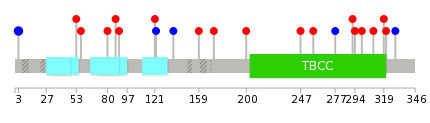
| Stat. for Non-Synonymous SNVs (# total SNVs=21) | (# total SNVs=5) |
 |  |
(# total SNVs=1) | (# total SNVs=0) |
 |
| Top |
| * When you move the cursor on each content, you can see more deailed mutation information on the Tooltip. Those are primary_site,primary_histology,mutation(aa),pubmedID. |
| GRCh37 position | Mutation(aa) | Unique sampleID count |
| chr6:42713803-42713803 | p.S3S | 3 |
| chr6:42712938-42712938 | p.Y292H | 1 |
| chr6:42713367-42713367 | p.S149A | 1 |
| chr6:42712825-42712825 | p.A329A | 1 |
| chr6:42713653-42713653 | p.E53D | 1 |
| chr6:42712950-42712950 | p.Q288K | 1 |
| chr6:42713372-42713372 | p.A147D | 1 |
| chr6:42712831-42712831 | p.D327E | 1 |
| chr6:42712981-42712981 | p.S277S | 1 |
| chr6:42713401-42713401 | p.F137F | 1 |
| Top |
|
 |
| Point Mutation/ Tissue ID | 1 | 2 | 3 | 4 | 5 | 6 | 7 | 8 | 9 | 10 | 11 | 12 | 13 | 14 | 15 | 16 | 17 | 18 | 19 | 20 |
| # sample | 2 | 3 | 4 | 1 | 1 | 2 | 3 | 1 | 1 | 1 | 2 | |||||||||
| # mutation | 4 | 3 | 4 | 1 | 1 | 2 | 3 | 1 | 1 | 1 | 2 | |||||||||
| nonsynonymous SNV | 3 | 3 | 4 | 1 | 2 | 1 | 1 | 1 | 1 | |||||||||||
| synonymous SNV | 1 | 1 | 2 | 1 | 1 |
| cf) Tissue ID; Tissue type (1; BLCA[Bladder Urothelial Carcinoma], 2; BRCA[Breast invasive carcinoma], 3; CESC[Cervical squamous cell carcinoma and endocervical adenocarcinoma], 4; COAD[Colon adenocarcinoma], 5; GBM[Glioblastoma multiforme], 6; Glioma Low Grade, 7; HNSC[Head and Neck squamous cell carcinoma], 8; KICH[Kidney Chromophobe], 9; KIRC[Kidney renal clear cell carcinoma], 10; KIRP[Kidney renal papillary cell carcinoma], 11; LAML[Acute Myeloid Leukemia], 12; LUAD[Lung adenocarcinoma], 13; LUSC[Lung squamous cell carcinoma], 14; OV[Ovarian serous cystadenocarcinoma ], 15; PAAD[Pancreatic adenocarcinoma], 16; PRAD[Prostate adenocarcinoma], 17; SKCM[Skin Cutaneous Melanoma], 18:STAD[Stomach adenocarcinoma], 19:THCA[Thyroid carcinoma], 20:UCEC[Uterine Corpus Endometrial Carcinoma]) |
| Top |
| * We represented just top 10 SNVs. When you move the cursor on each content, you can see more deailed mutation information on the Tooltip. Those are primary_site, primary_histology, mutation(aa), pubmedID. |
| Genomic Position | Mutation(aa) | Unique sampleID count |
| chr6:42713803 | p.S3S | 2 |
| chr6:42713214 | p.K172N | 1 |
| chr6:42712825 | p.P159S | 1 |
| chr6:42713296 | p.F137F | 1 |
| chr6:42712850 | p.A122A | 1 |
| chr6:42713337 | p.Q121H | 1 |
| chr6:42712855 | p.A329A | 1 |
| chr6:42713401 | p.R90P | 1 |
| chr6:42712883 | p.F321C | 1 |
| chr6:42713446 | p.A87E | 1 |
| * Copy number data were extracted from TCGA using R package TCGA-Assembler. The URLs of all public data files on TCGA DCC data server were gathered on Jan-05-2015. Function ProcessCNAData in TCGA-Assembler package was used to obtain gene-level copy number value which is calculated as the average copy number of the genomic region of a gene. |
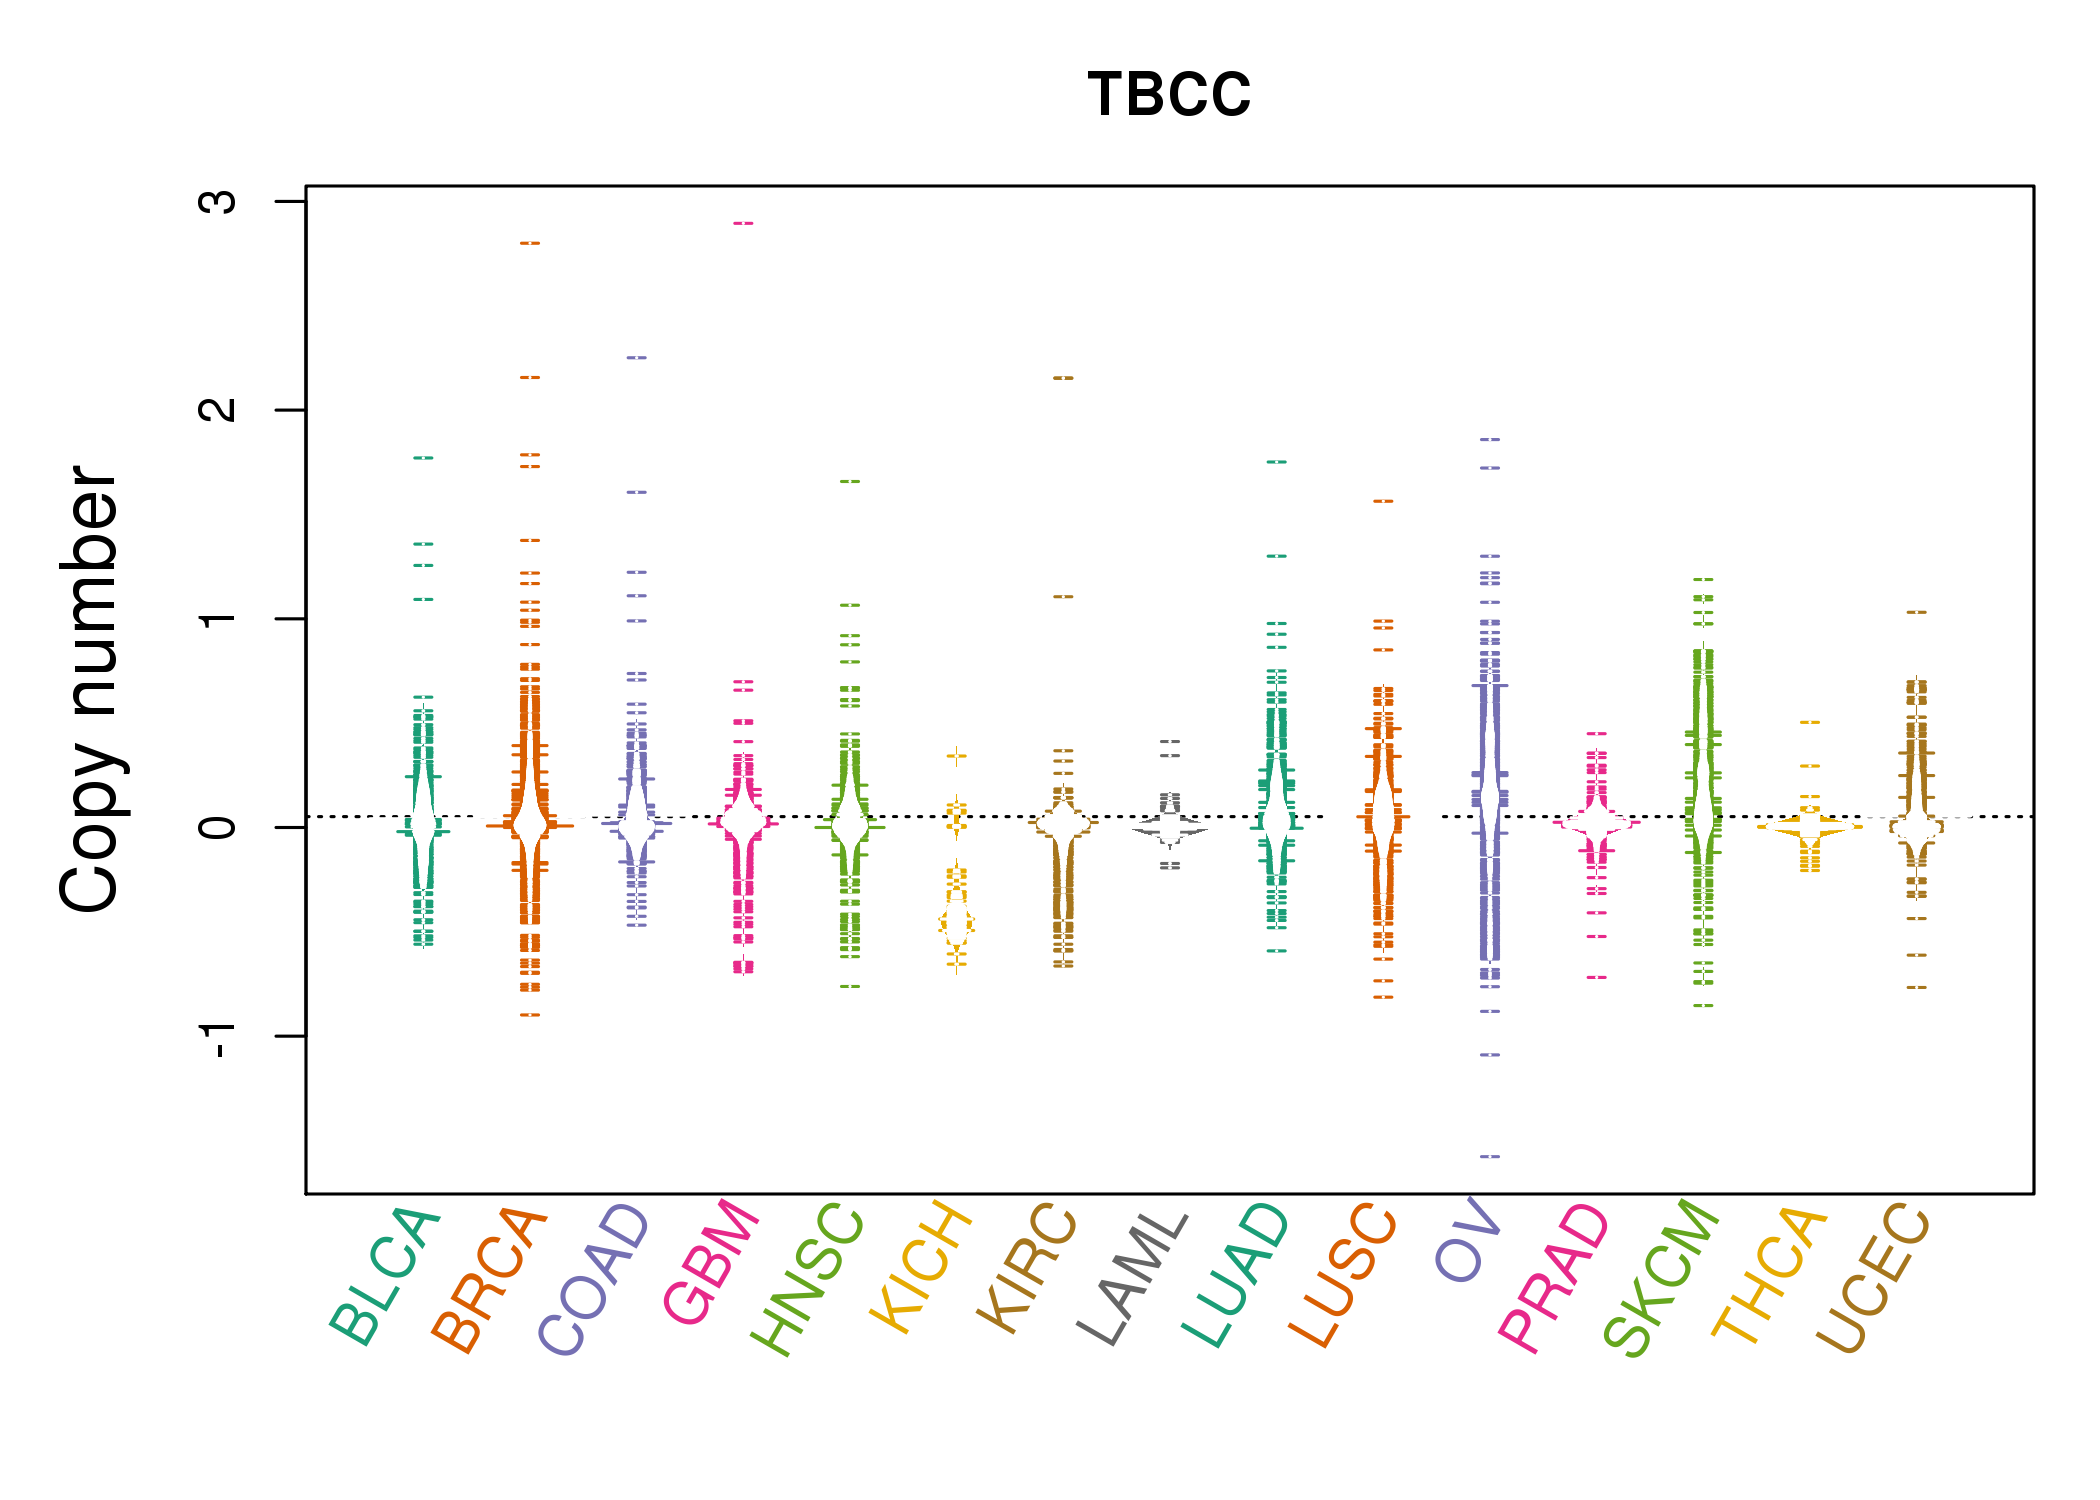 |
| cf) Tissue ID[Tissue type]: BLCA[Bladder Urothelial Carcinoma], BRCA[Breast invasive carcinoma], CESC[Cervical squamous cell carcinoma and endocervical adenocarcinoma], COAD[Colon adenocarcinoma], GBM[Glioblastoma multiforme], Glioma Low Grade, HNSC[Head and Neck squamous cell carcinoma], KICH[Kidney Chromophobe], KIRC[Kidney renal clear cell carcinoma], KIRP[Kidney renal papillary cell carcinoma], LAML[Acute Myeloid Leukemia], LUAD[Lung adenocarcinoma], LUSC[Lung squamous cell carcinoma], OV[Ovarian serous cystadenocarcinoma ], PAAD[Pancreatic adenocarcinoma], PRAD[Prostate adenocarcinoma], SKCM[Skin Cutaneous Melanoma], STAD[Stomach adenocarcinoma], THCA[Thyroid carcinoma], UCEC[Uterine Corpus Endometrial Carcinoma] |
| Top |
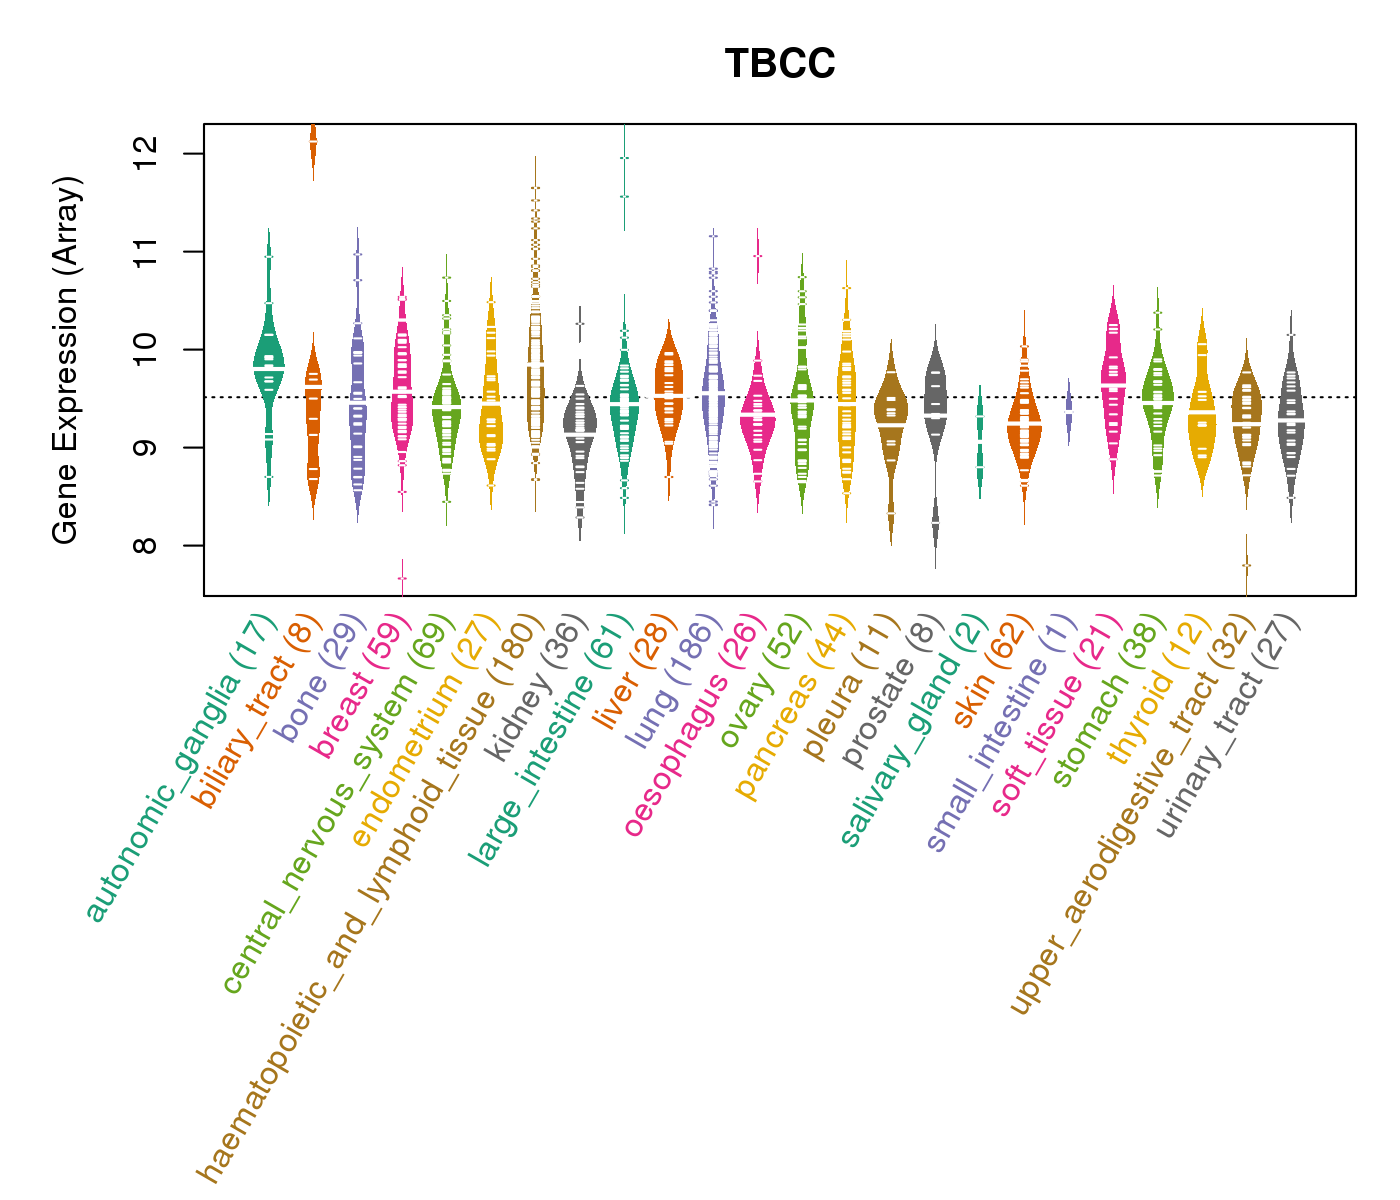
| Gene Expression for TBCC |
| * CCLE gene expression data were extracted from CCLE_Expression_Entrez_2012-10-18.res: Gene-centric RMA-normalized mRNA expression data. |
 |
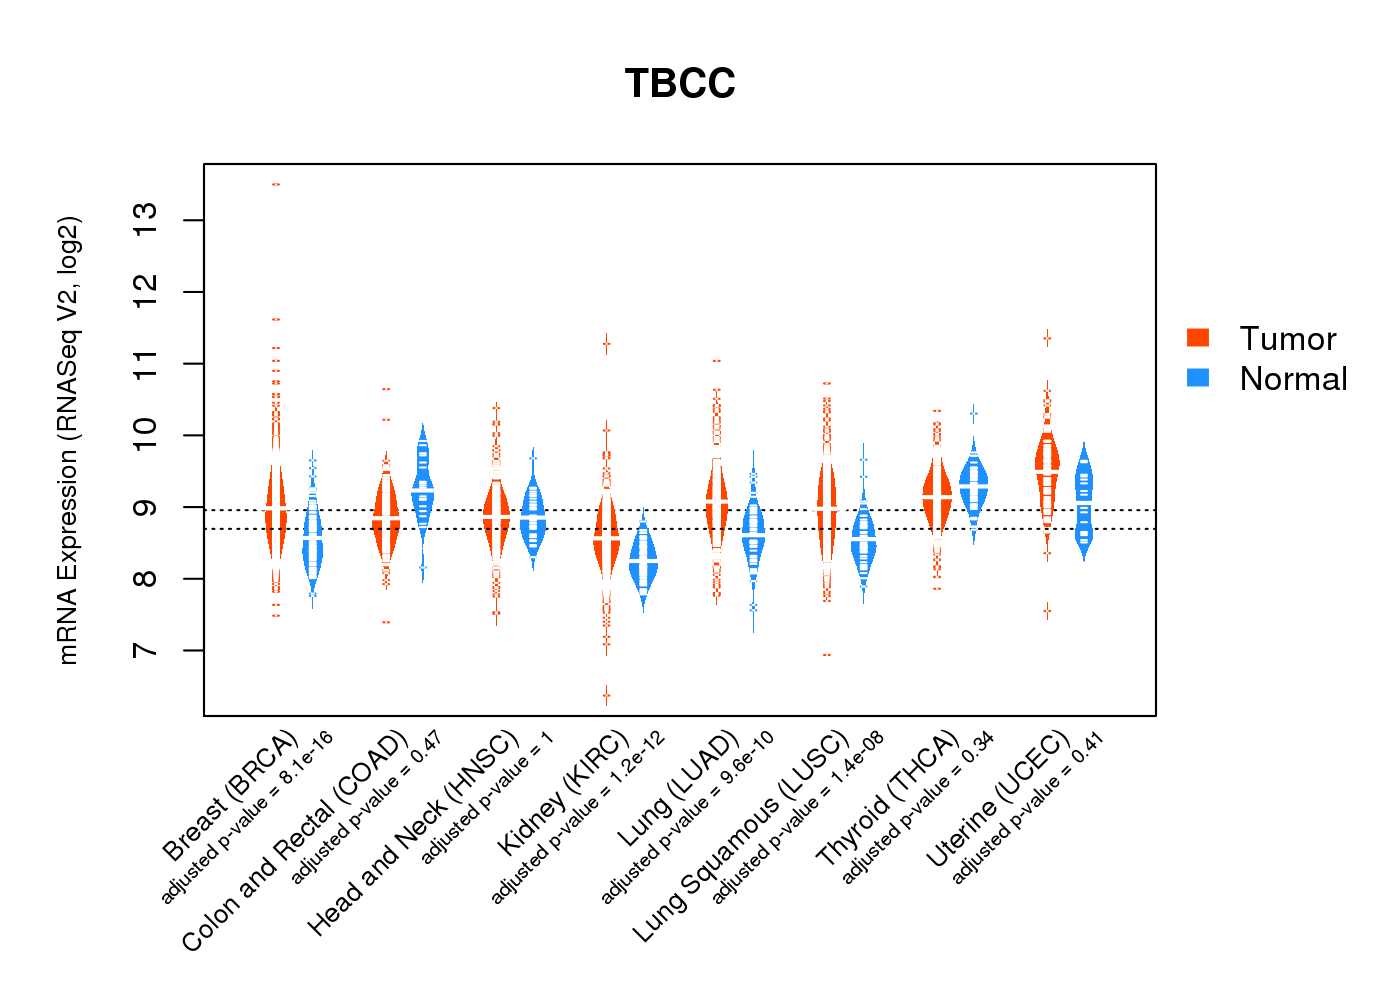
| * Normalized gene expression data of RNASeqV2 was extracted from TCGA using R package TCGA-Assembler. The URLs of all public data files on TCGA DCC data server were gathered at Jan-05-2015. Only eight cancer types have enough normal control samples for differential expression analysis. (t test, adjusted p<0.05 (using Benjamini-Hochberg FDR)) |
 |
| Top |
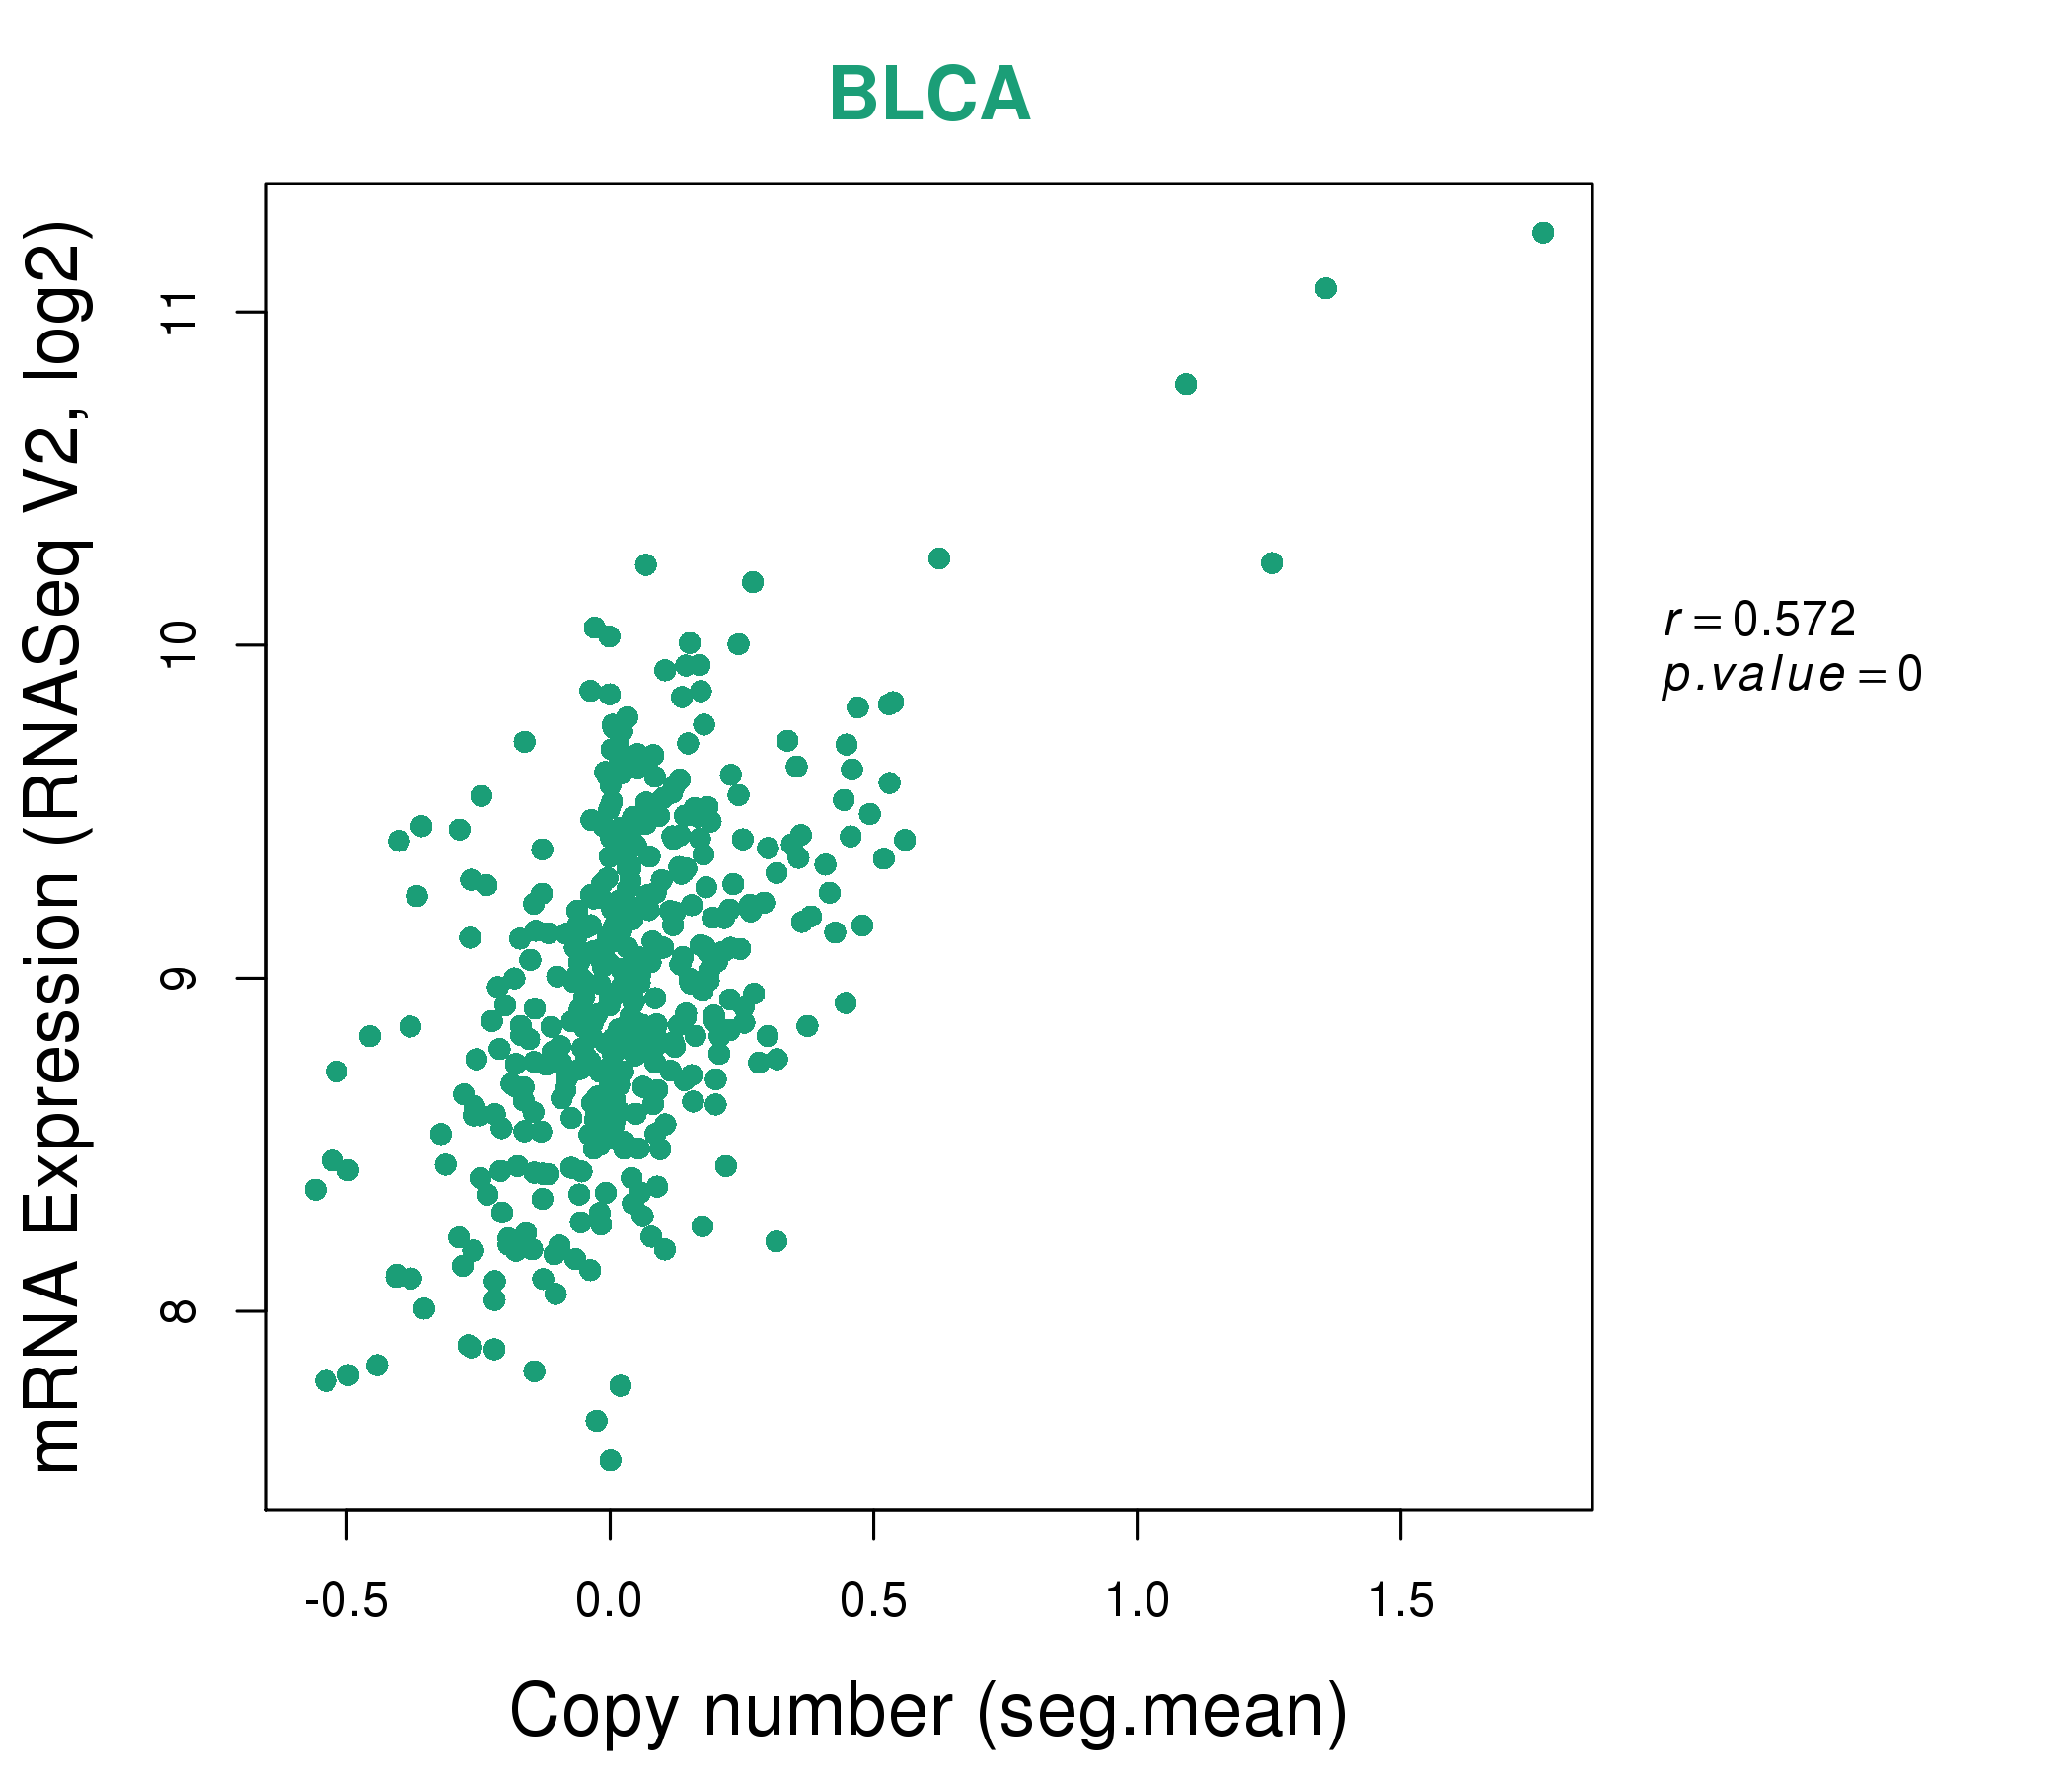
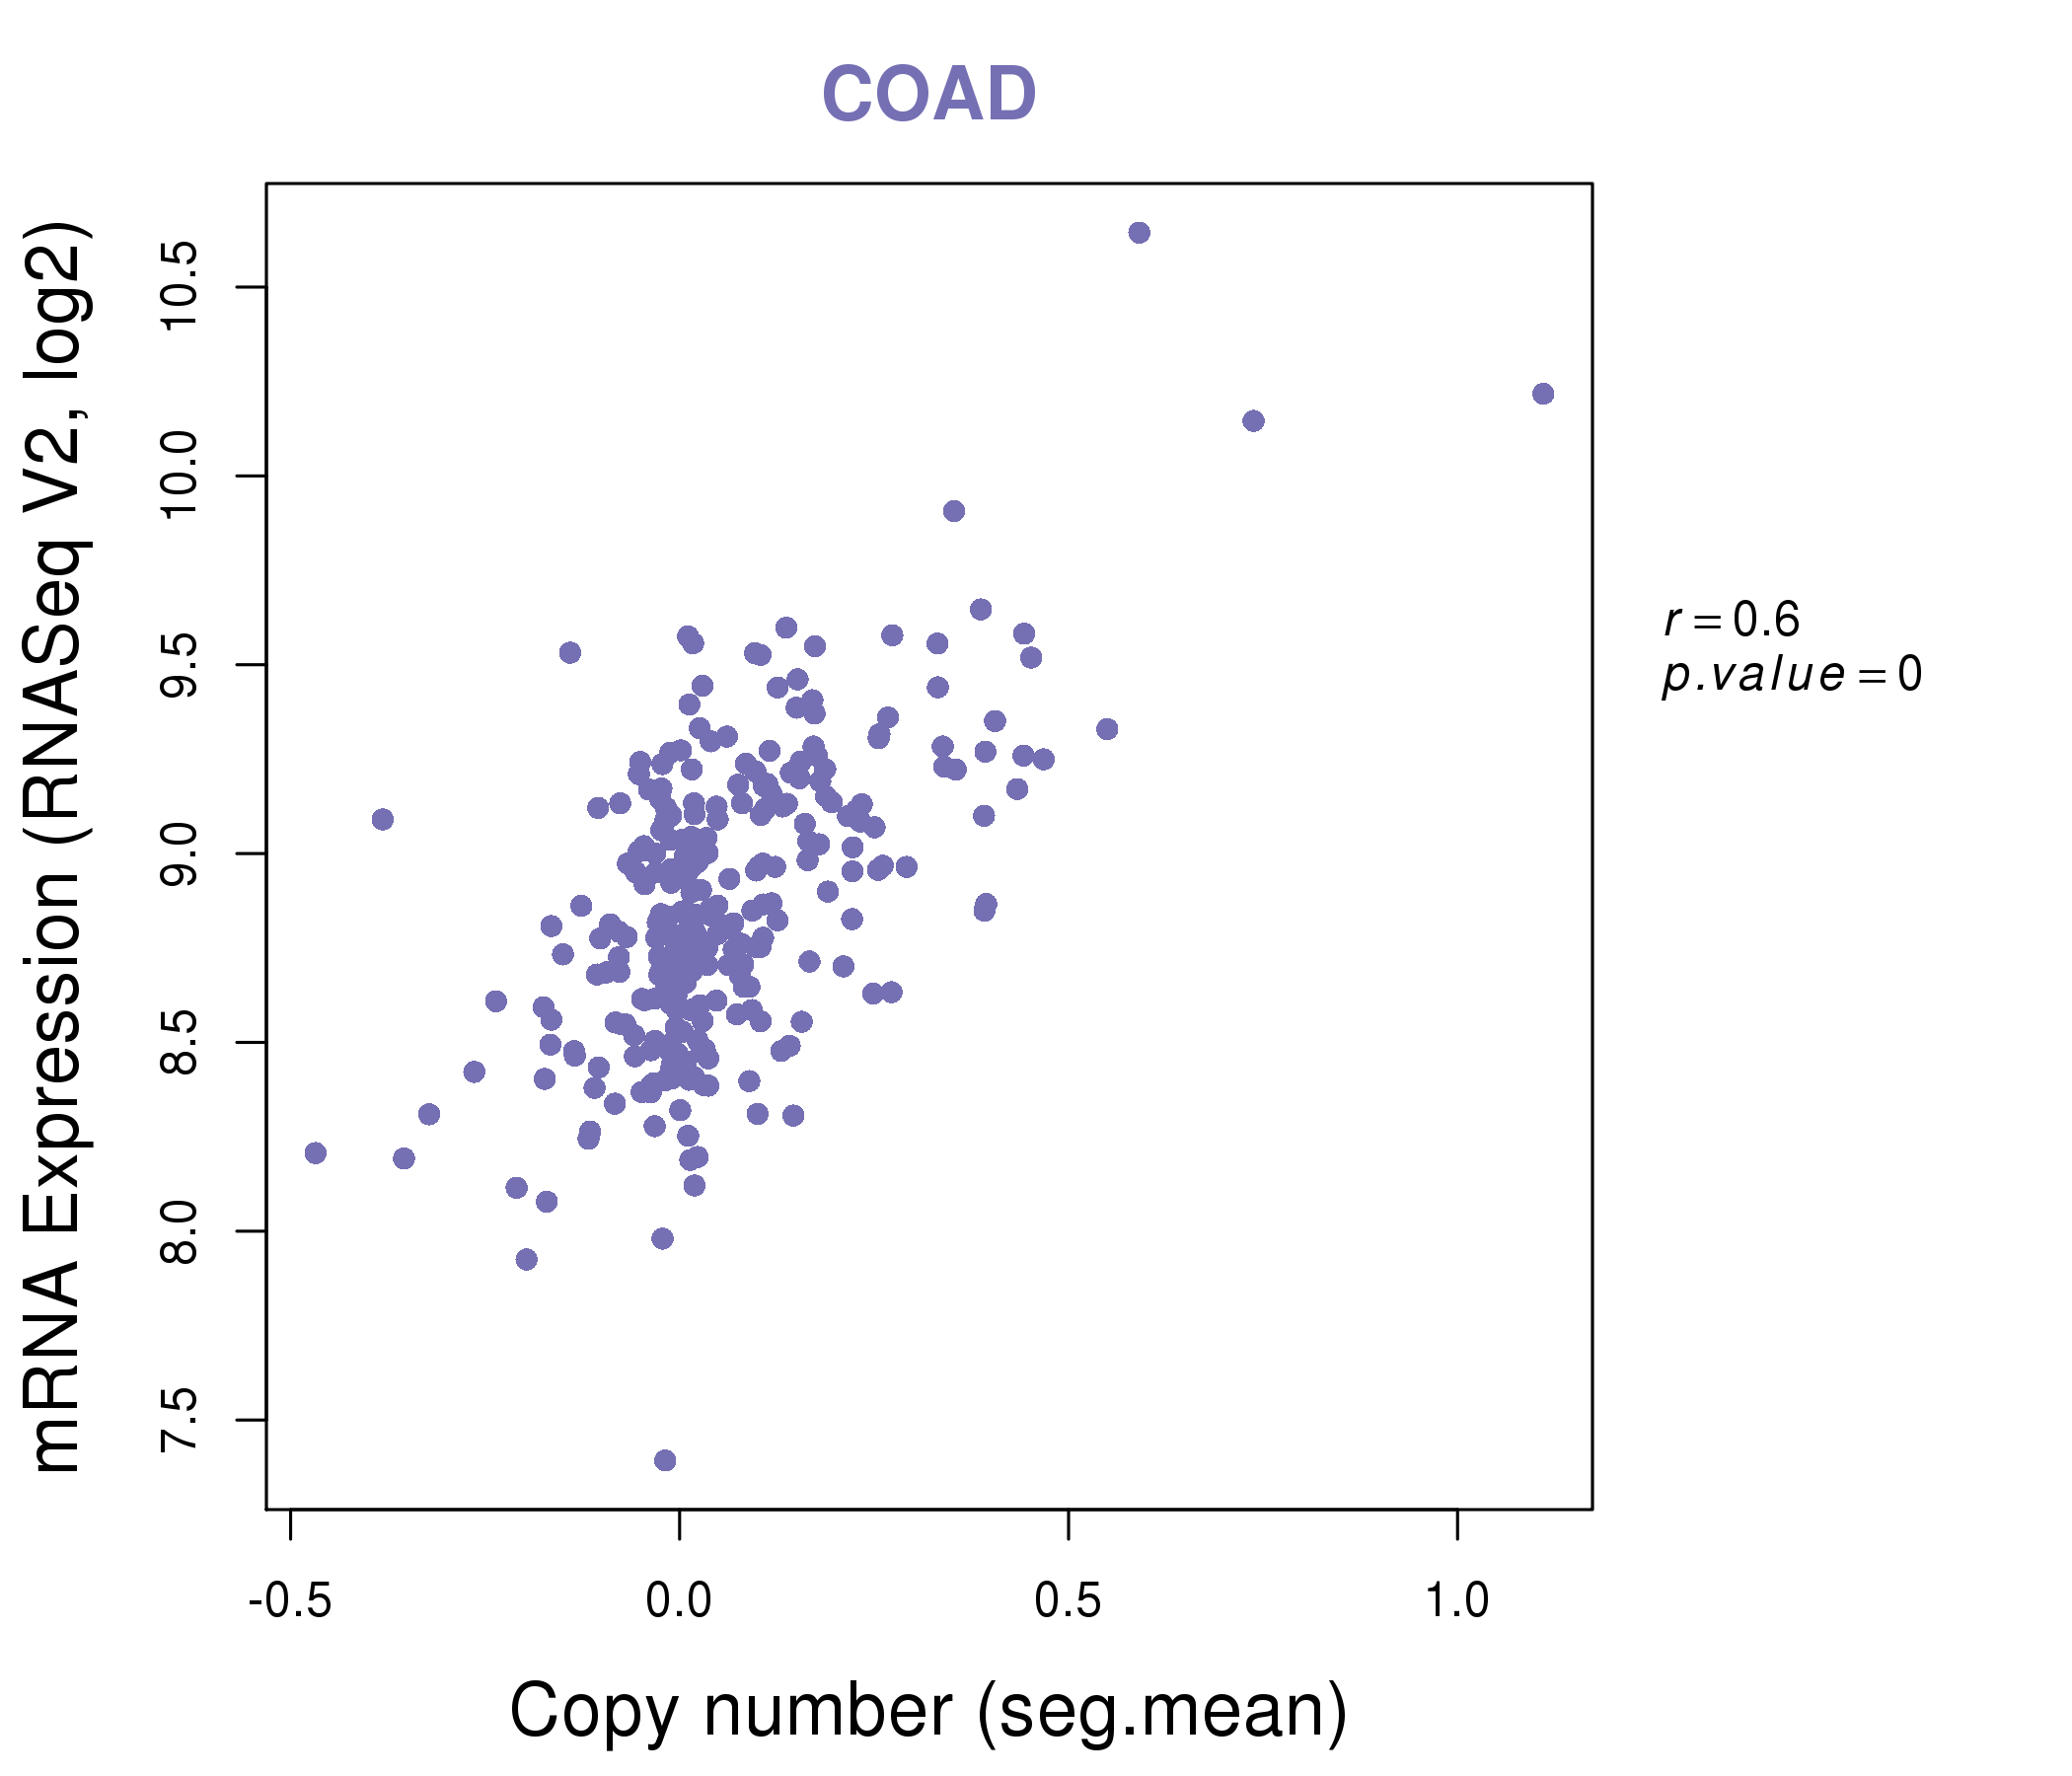
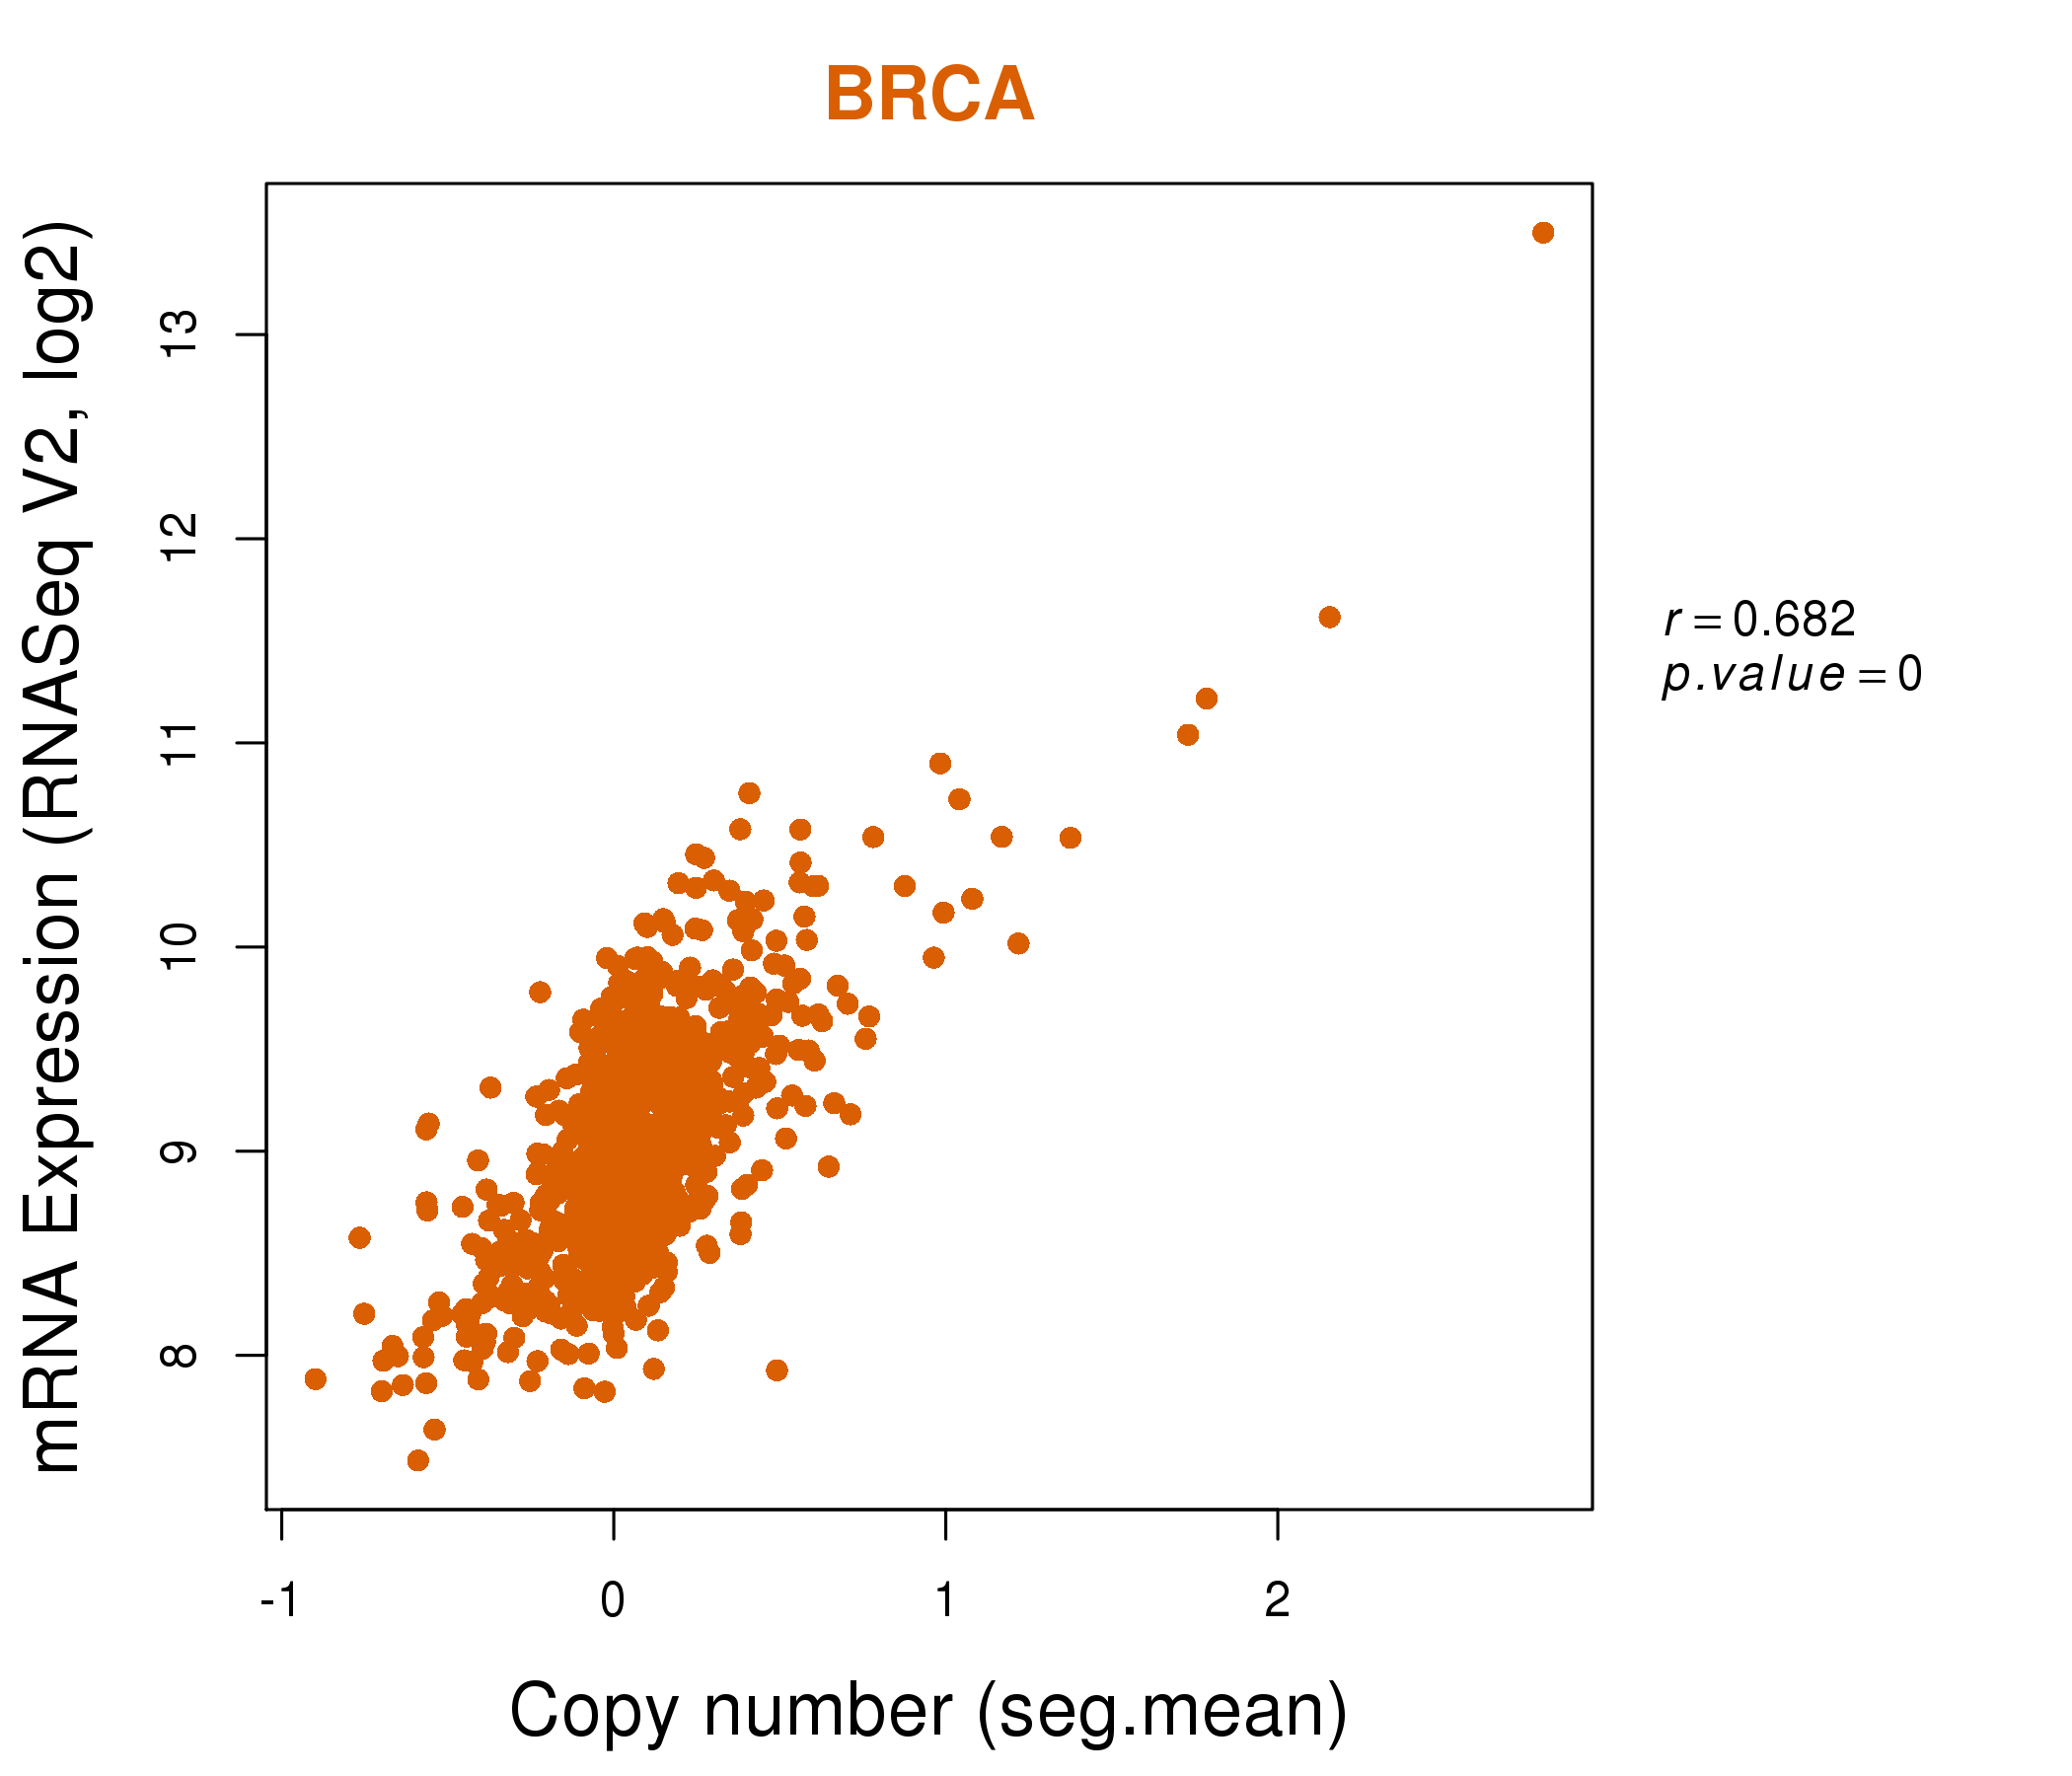
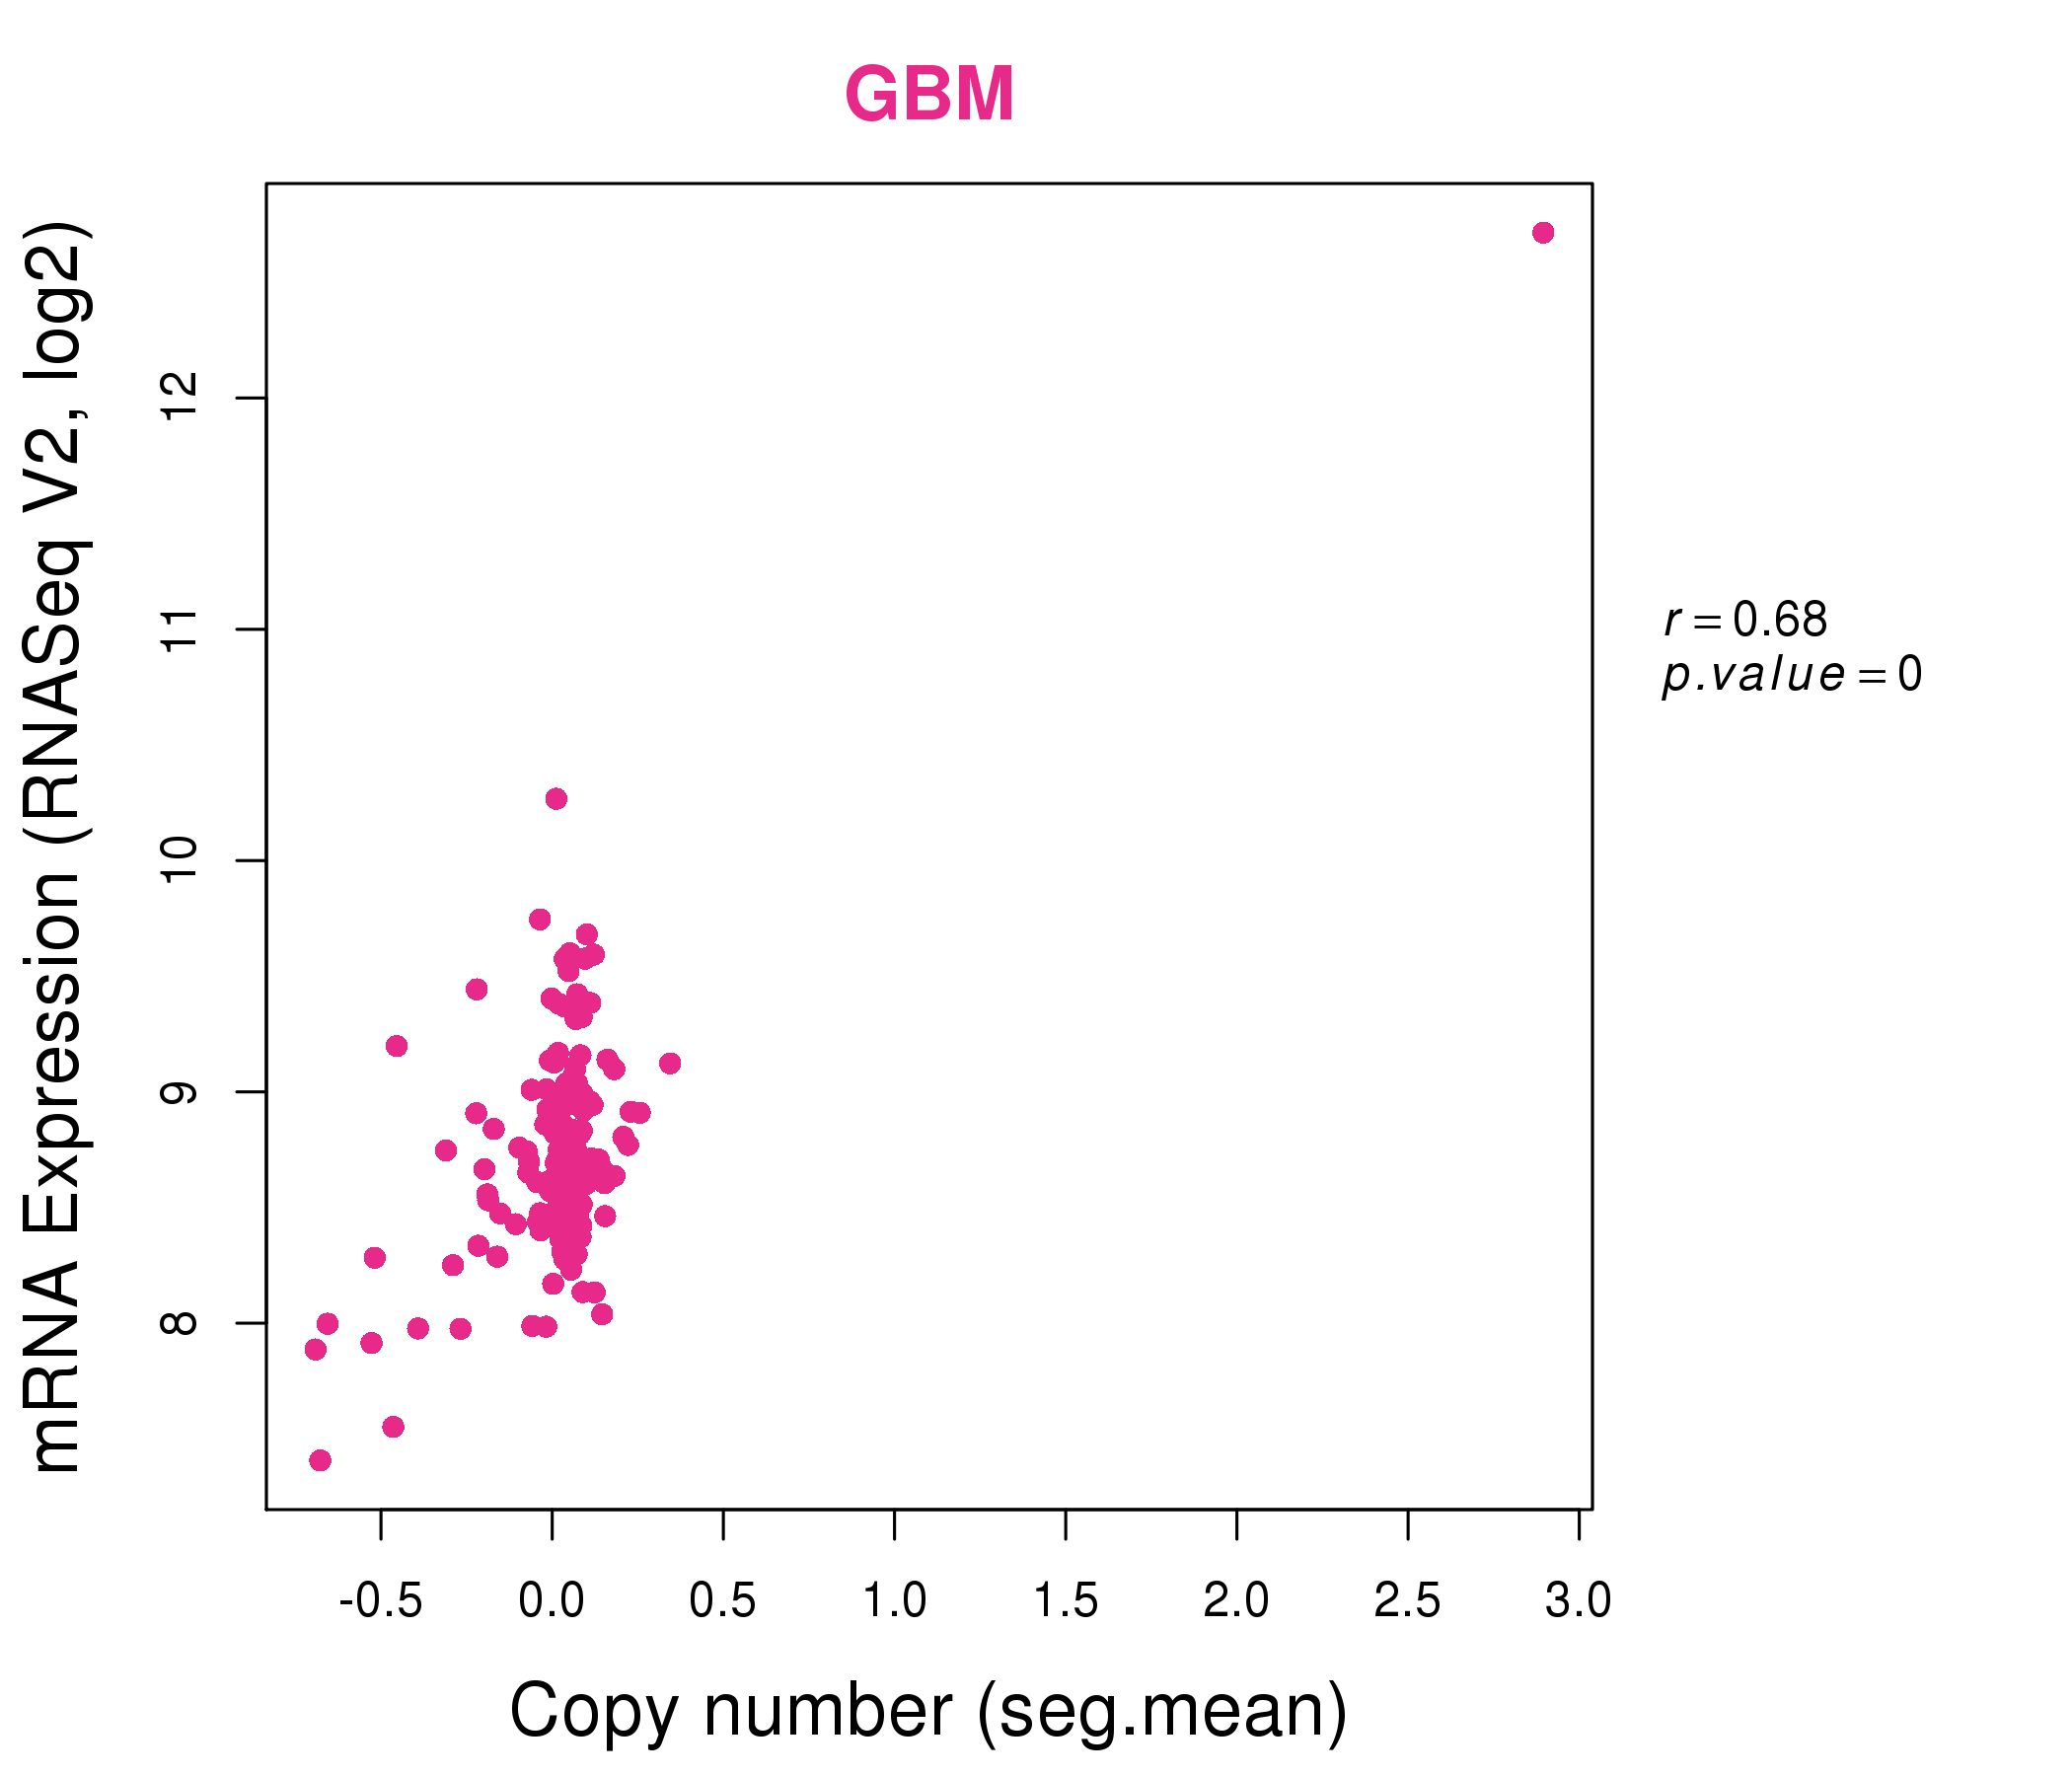
| * This plots show the correlation between CNV and gene expression. |
: Open all plots for all cancer types
 |
|
 |
|
| Top |
| Gene-Gene Network Information |
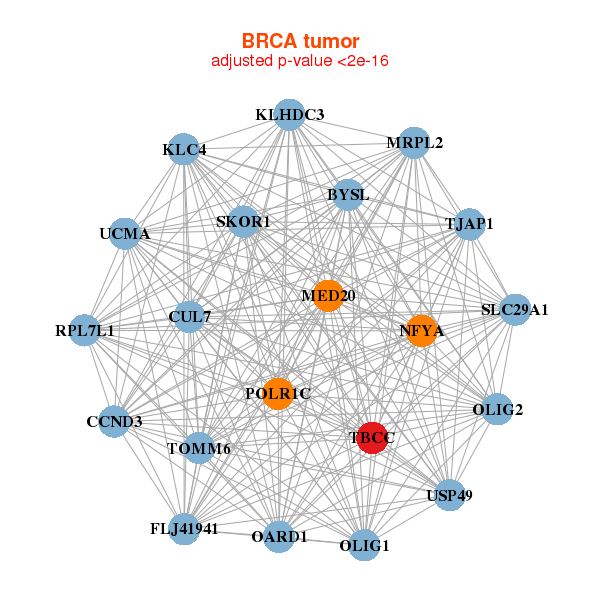
| * Co-Expression network figures were drawn using R package igraph. Only the top 20 genes with the highest correlations were shown. Red circle: input gene, orange circle: cell metabolism gene, sky circle: other gene |
: Open all plots for all cancer types
 |
|
| BYSL,OARD1,CCND3,CUL7,FLJ41941,KLC4,KLHDC3, SKOR1,MED20,MRPL2,NFYA,OLIG1,OLIG2,POLR1C, RPL7L1,SLC29A1,TBCC,TJAP1,TOMM6,UCMA,USP49 | ATP5G2,BANF1,CLP1,IMP3,LCMT1,LSM2,MAD2L1BP, MRPL57,MRPL18,MRPL9,NHP2L1,PDXP,RNF5,SCNM1, SNRPC,TBCC,THAP11,TMEM203,UBL7,ZCCHC3,ZNRD1 |
 |
|
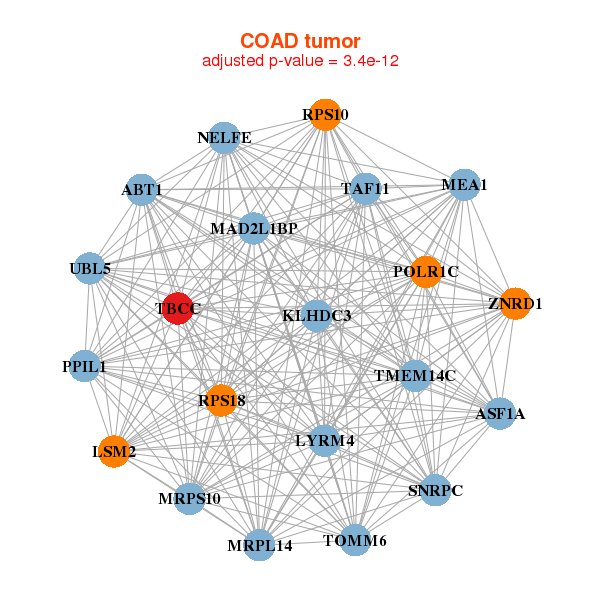
| ABT1,ASF1A,KLHDC3,LSM2,LYRM4,MAD2L1BP,MEA1, MRPL14,MRPS10,POLR1C,PPIL1,NELFE,RPS10,RPS18, SNRPC,TAF11,TBCC,TMEM14C,TOMM6,UBL5,ZNRD1 | AAMP,BAK1,BCL2L10,CASP3,CXCR2P1,DAO,HARBI1, HCCS,IFI27L1,NCR1,NT5C3A,RRAGC,SNORA72,SOD1, TBCC,TDRD7,TMEM54,TMSB4XP8,TRIM31,UBB,USF1 |
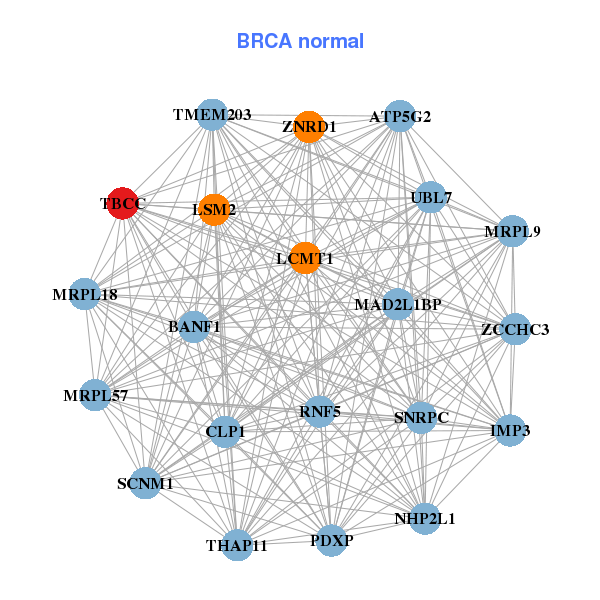

| * Co-Expression network figures were drawn using R package igraph. Only the top 20 genes with the highest correlations were shown. Red circle: input gene, orange circle: cell metabolism gene, sky circle: other gene |
: Open all plots for all cancer types
| Top |
: Open all interacting genes' information including KEGG pathway for all interacting genes from DAVID
| Top |
| Pharmacological Information for TBCC |
| There's no related Drug. |
| Top |
| Cross referenced IDs for TBCC |
| * We obtained these cross-references from Uniprot database. It covers 150 different DBs, 18 categories. http://www.uniprot.org/help/cross_references_section |
: Open all cross reference information
|
Copyright © 2016-Present - The Univsersity of Texas Health Science Center at Houston @ |