|
||||||||||||||||||||
| |
| Phenotypic Information (metabolism pathway, cancer, disease, phenome) |
| |
| |
| Gene-Gene Network Information: Co-Expression Network, Interacting Genes & KEGG |
| |
|


| Gene Summary for TBL1X |
| Top |
| Phenotypic Information for TBL1X(metabolism pathway, cancer, disease, phenome) |
| Cancer | CGAP: TBL1X |
| Familial Cancer Database: TBL1X | |
| * This gene is included in those cancer gene databases. |
|
|
|
|
|
| . | ||||||||||||||
Oncogene 1 | Significant driver gene in | |||||||||||||||||||
| cf) number; DB name 1 Oncogene; http://nar.oxfordjournals.org/content/35/suppl_1/D721.long, 2 Tumor Suppressor gene; https://bioinfo.uth.edu/TSGene/, 3 Cancer Gene Census; http://www.nature.com/nrc/journal/v4/n3/abs/nrc1299.html, 4 CancerGenes; http://nar.oxfordjournals.org/content/35/suppl_1/D721.long, 5 Network of Cancer Gene; http://ncg.kcl.ac.uk/index.php, 1Therapeutic Vulnerabilities in Cancer; http://cbio.mskcc.org/cancergenomics/statius/ |
| REACTOME_METABOLISM_OF_LIPIDS_AND_LIPOPROTEINS | |
| OMIM | |
| Orphanet | |
| Disease | KEGG Disease: TBL1X |
| MedGen: TBL1X (Human Medical Genetics with Condition) | |
| ClinVar: TBL1X | |
| Phenotype | MGI: TBL1X (International Mouse Phenotyping Consortium) |
| PhenomicDB: TBL1X | |
| Mutations for TBL1X |
| * Under tables are showing count per each tissue to give us broad intuition about tissue specific mutation patterns.You can go to the detailed page for each mutation database's web site. |
| There's no structural variation information in COSMIC data for this gene. |
| * From mRNA Sanger sequences, Chitars2.0 arranged chimeric transcripts. This table shows TBL1X related fusion information. |
| ID | Head Gene | Tail Gene | Accession | Gene_a | qStart_a | qEnd_a | Chromosome_a | tStart_a | tEnd_a | Gene_a | qStart_a | qEnd_a | Chromosome_a | tStart_a | tEnd_a |
| DA634796 | NUCKS1 | 1 | 228 | 1 | 205719083 | 205719310 | TBL1X | 224 | 566 | X | 9652080 | 9656250 | |
| BQ436312 | MOSPD2 | 12 | 170 | X | 14891573 | 14891882 | TBL1X | 165 | 859 | X | 9652079 | 9660291 | |
| BE827740 | CEP95 | 9 | 305 | 17 | 62533176 | 62533965 | TBL1X | 304 | 377 | X | 9509441 | 9509514 | |
| BE140570 | LAMB3 | 1 | 83 | 1 | 209789866 | 209789948 | TBL1X | 82 | 292 | X | 9485248 | 9485458 | |
| AW993932 | HEATR5B | 13 | 468 | 2 | 37244126 | 37244584 | TBL1X | 451 | 474 | X | 9596838 | 9596866 | |
| AW629132 | TBL1X | 10 | 155 | X | 9687633 | 9687778 | PAFAH1B2 | 138 | 488 | 11 | 117038809 | 117039159 | |
| BQ774627 | TBL1X | 18 | 97 | X | 9687699 | 9687778 | TBL1X | 91 | 571 | X | 9686972 | 9687451 | |
| AI129599 | TBL1X | 1 | 123 | X | 9686765 | 9686887 | TBL1X | 117 | 417 | X | 9686945 | 9687245 | |
| M86146 | TBL1X | 1 | 74 | X | 9685853 | 9685926 | MPP5 | 75 | 280 | 14 | 67751528 | 67751733 | |
| Top |
| There's no copy number variation information in COSMIC data for this gene. |
| Top |
|
 |
| Top |
| Stat. for Non-Synonymous SNVs (# total SNVs=37) | (# total SNVs=21) |
 |  |
(# total SNVs=2) | (# total SNVs=0) |
 |
| Top |
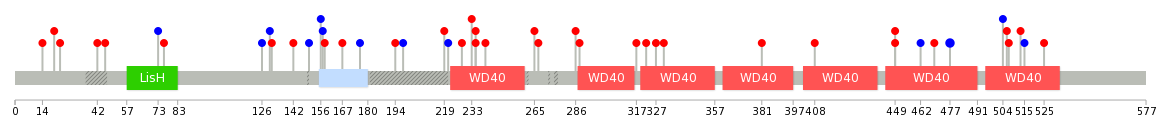
| * When you move the cursor on each content, you can see more deailed mutation information on the Tooltip. Those are primary_site,primary_histology,mutation(aa),pubmedID. |
| GRCh37 position | Mutation(aa) | Unique sampleID count |
| chr23:9656197-9656197 | p.A166A | 3 |
| chr23:9660265-9660265 | p.N288D | 2 |
| chr23:9679795-9679795 | p.C528C | 2 |
| chr23:9659627-9659627 | p.A209T | 2 |
| chr23:9621720-9621720 | p.R32* | 2 |
| chr23:9622285-9622285 | p.S45L | 2 |
| chr23:9656243-9656243 | p.V182I | 1 |
| chr23:9665416-9665416 | p.I354R | 1 |
| chr23:9659696-9659696 | p.E232* | 1 |
| chr23:9679742-9679742 | p.V511I | 1 |
| Top |
|
 |
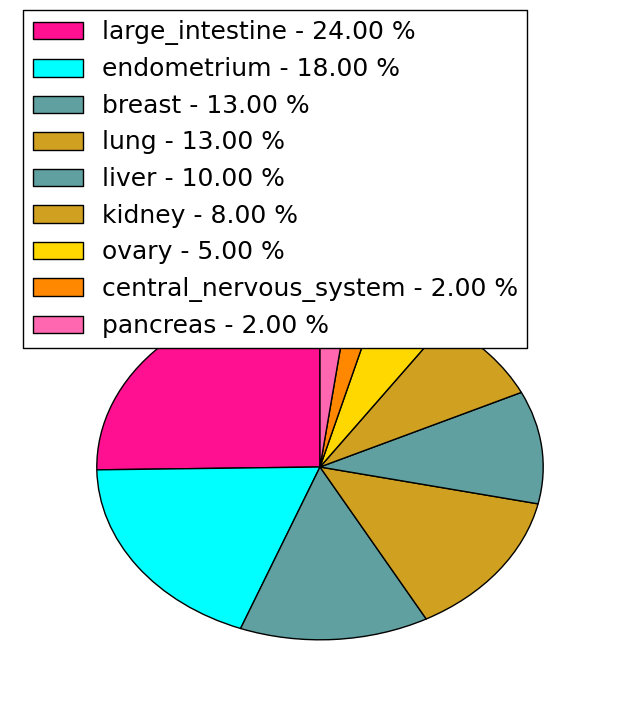
| Point Mutation/ Tissue ID | 1 | 2 | 3 | 4 | 5 | 6 | 7 | 8 | 9 | 10 | 11 | 12 | 13 | 14 | 15 | 16 | 17 | 18 | 19 | 20 |
| # sample | 4 | 8 | 1 | 5 | 2 | 4 | 6 | 3 | 10 | |||||||||||
| # mutation | 4 | 7 | 1 | 5 | 2 | 4 | 6 | 3 | 15 | |||||||||||
| nonsynonymous SNV | 3 | 5 | 1 | 4 | 2 | 3 | 5 | 3 | 7 | |||||||||||
| synonymous SNV | 1 | 2 | 1 | 1 | 1 | 8 |
| cf) Tissue ID; Tissue type (1; BLCA[Bladder Urothelial Carcinoma], 2; BRCA[Breast invasive carcinoma], 3; CESC[Cervical squamous cell carcinoma and endocervical adenocarcinoma], 4; COAD[Colon adenocarcinoma], 5; GBM[Glioblastoma multiforme], 6; Glioma Low Grade, 7; HNSC[Head and Neck squamous cell carcinoma], 8; KICH[Kidney Chromophobe], 9; KIRC[Kidney renal clear cell carcinoma], 10; KIRP[Kidney renal papillary cell carcinoma], 11; LAML[Acute Myeloid Leukemia], 12; LUAD[Lung adenocarcinoma], 13; LUSC[Lung squamous cell carcinoma], 14; OV[Ovarian serous cystadenocarcinoma ], 15; PAAD[Pancreatic adenocarcinoma], 16; PRAD[Prostate adenocarcinoma], 17; SKCM[Skin Cutaneous Melanoma], 18:STAD[Stomach adenocarcinoma], 19:THCA[Thyroid carcinoma], 20:UCEC[Uterine Corpus Endometrial Carcinoma]) |
| Top |
| * We represented just top 10 SNVs. When you move the cursor on each content, you can see more deailed mutation information on the Tooltip. Those are primary_site, primary_histology, mutation(aa), pubmedID. |
| Genomic Position | Mutation(aa) | Unique sampleID count |
| chrX:9679710 | p.T449K,TBL1X | 2 |
| chrX:9679795 | p.C477C,TBL1X | 2 |
| chrX:9659749 | p.R150R,TBL1X | 1 |
| chrX:9661422 | p.D267Y,TBL1X | 1 |
| chrX:9656242 | p.S513R,TBL1X | 1 |
| chrX:9683001 | p.N156N,TBL1X | 1 |
| chrX:9660211 | p.W286C,TBL1X | 1 |
| chrX:9665457 | p.S515S,TBL1X | 1 |
| chrX:9656243 | p.H157H,TBL1X | 1 |
| chrX:9683006 | p.R288Q,TBL1X | 1 |
| * Copy number data were extracted from TCGA using R package TCGA-Assembler. The URLs of all public data files on TCGA DCC data server were gathered on Jan-05-2015. Function ProcessCNAData in TCGA-Assembler package was used to obtain gene-level copy number value which is calculated as the average copy number of the genomic region of a gene. |
 |
| cf) Tissue ID[Tissue type]: BLCA[Bladder Urothelial Carcinoma], BRCA[Breast invasive carcinoma], CESC[Cervical squamous cell carcinoma and endocervical adenocarcinoma], COAD[Colon adenocarcinoma], GBM[Glioblastoma multiforme], Glioma Low Grade, HNSC[Head and Neck squamous cell carcinoma], KICH[Kidney Chromophobe], KIRC[Kidney renal clear cell carcinoma], KIRP[Kidney renal papillary cell carcinoma], LAML[Acute Myeloid Leukemia], LUAD[Lung adenocarcinoma], LUSC[Lung squamous cell carcinoma], OV[Ovarian serous cystadenocarcinoma ], PAAD[Pancreatic adenocarcinoma], PRAD[Prostate adenocarcinoma], SKCM[Skin Cutaneous Melanoma], STAD[Stomach adenocarcinoma], THCA[Thyroid carcinoma], UCEC[Uterine Corpus Endometrial Carcinoma] |
| Top |
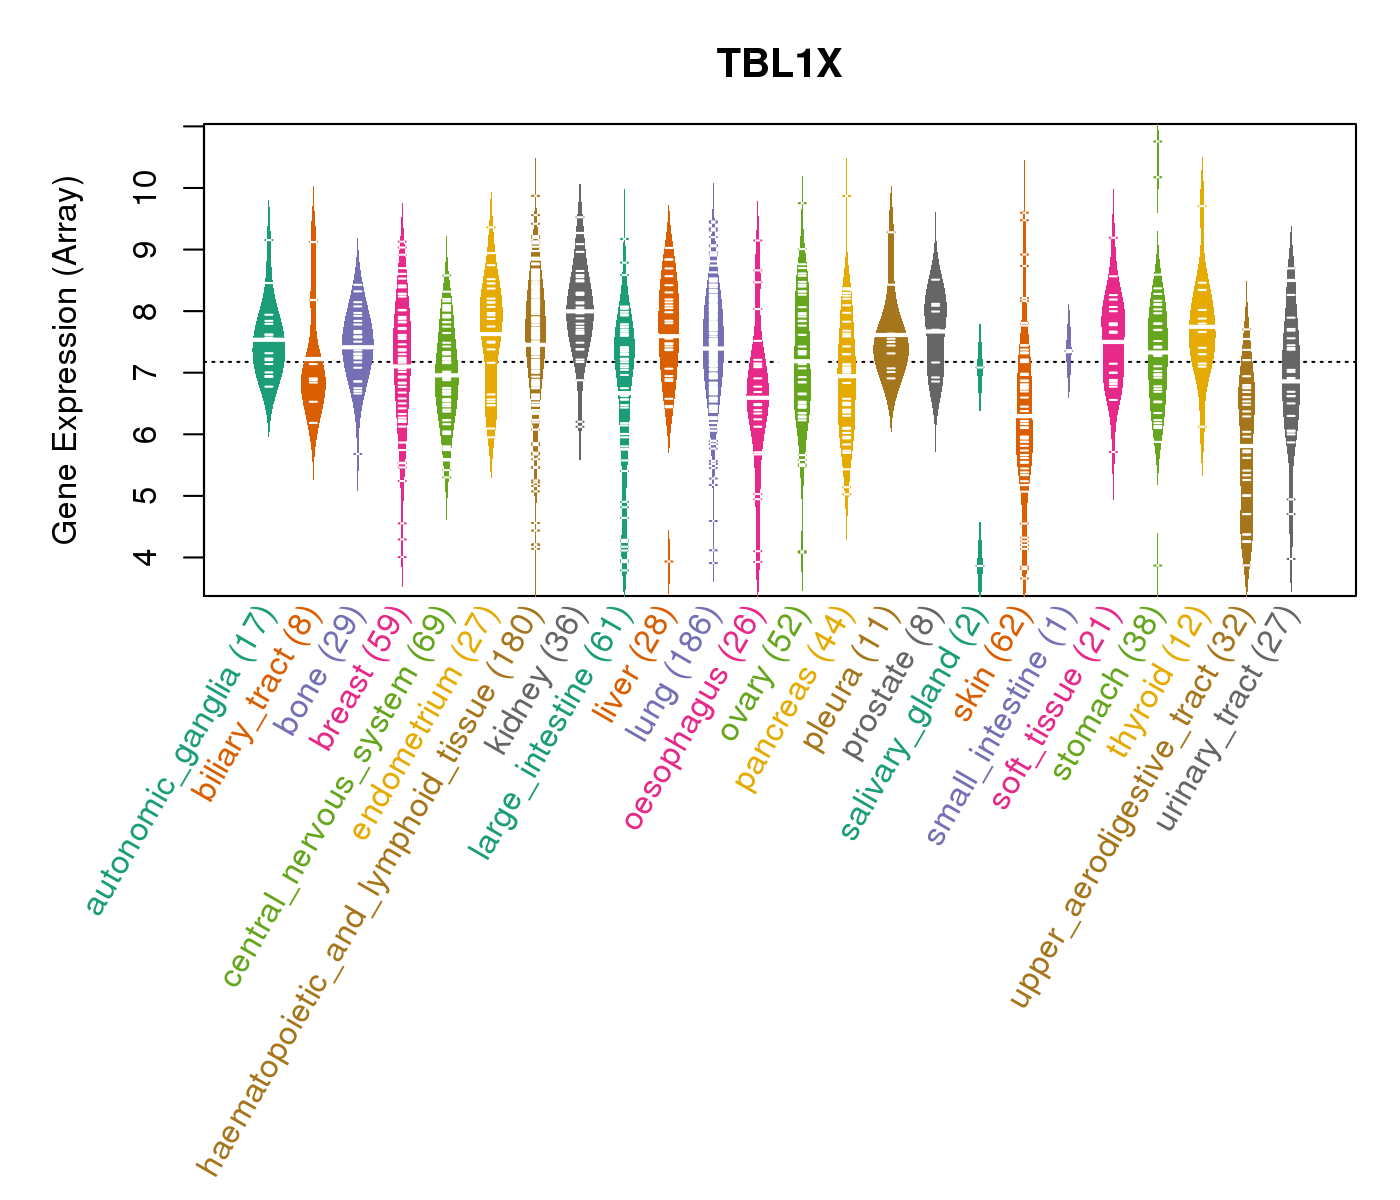
| Gene Expression for TBL1X |
| * CCLE gene expression data were extracted from CCLE_Expression_Entrez_2012-10-18.res: Gene-centric RMA-normalized mRNA expression data. |
 |
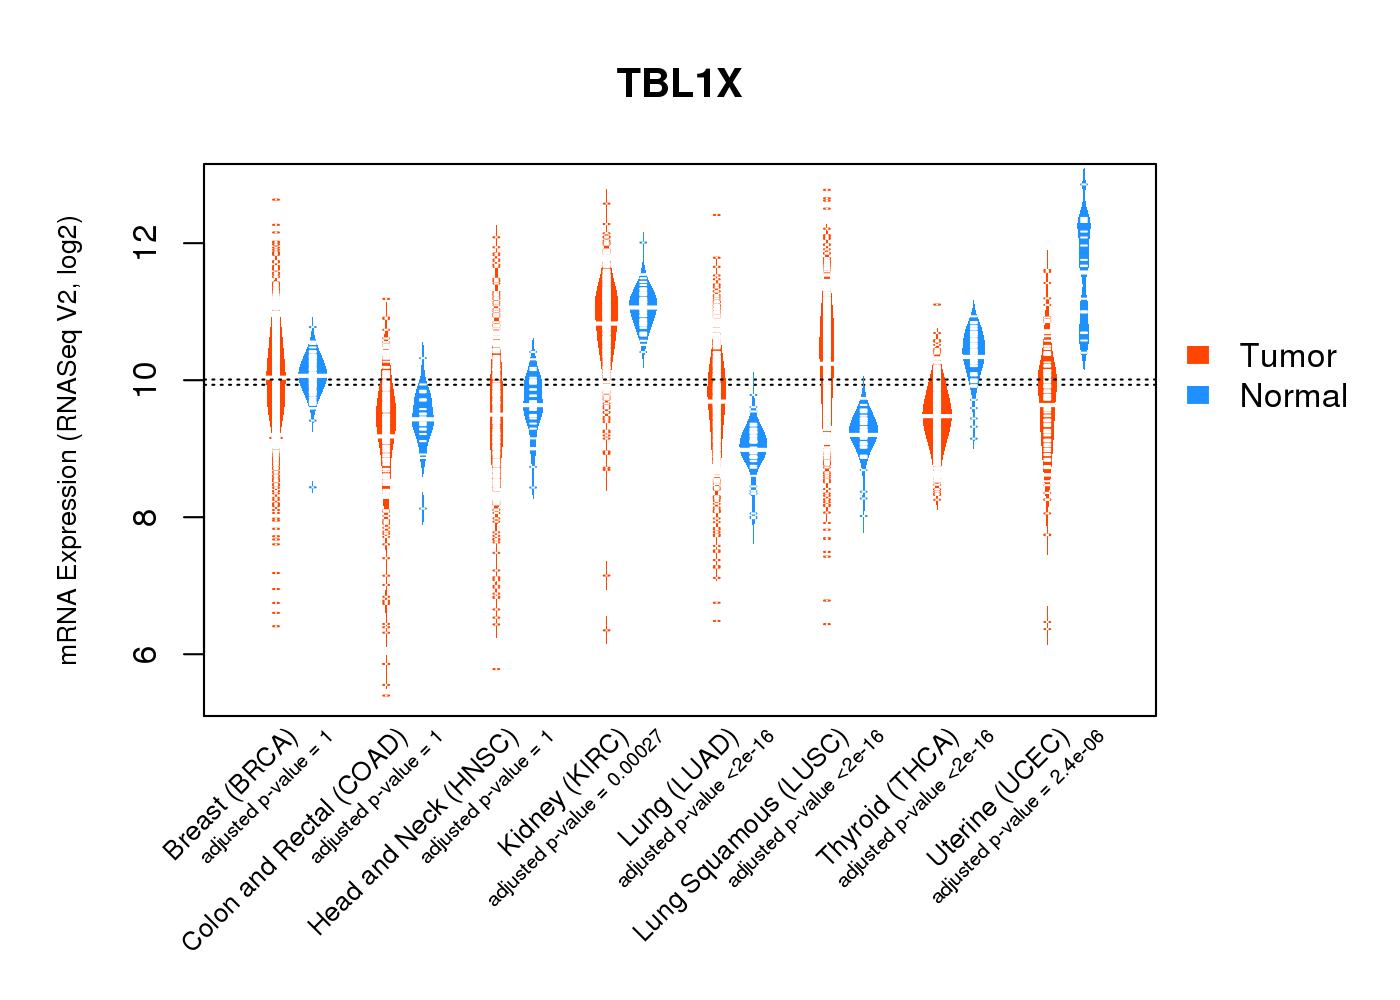
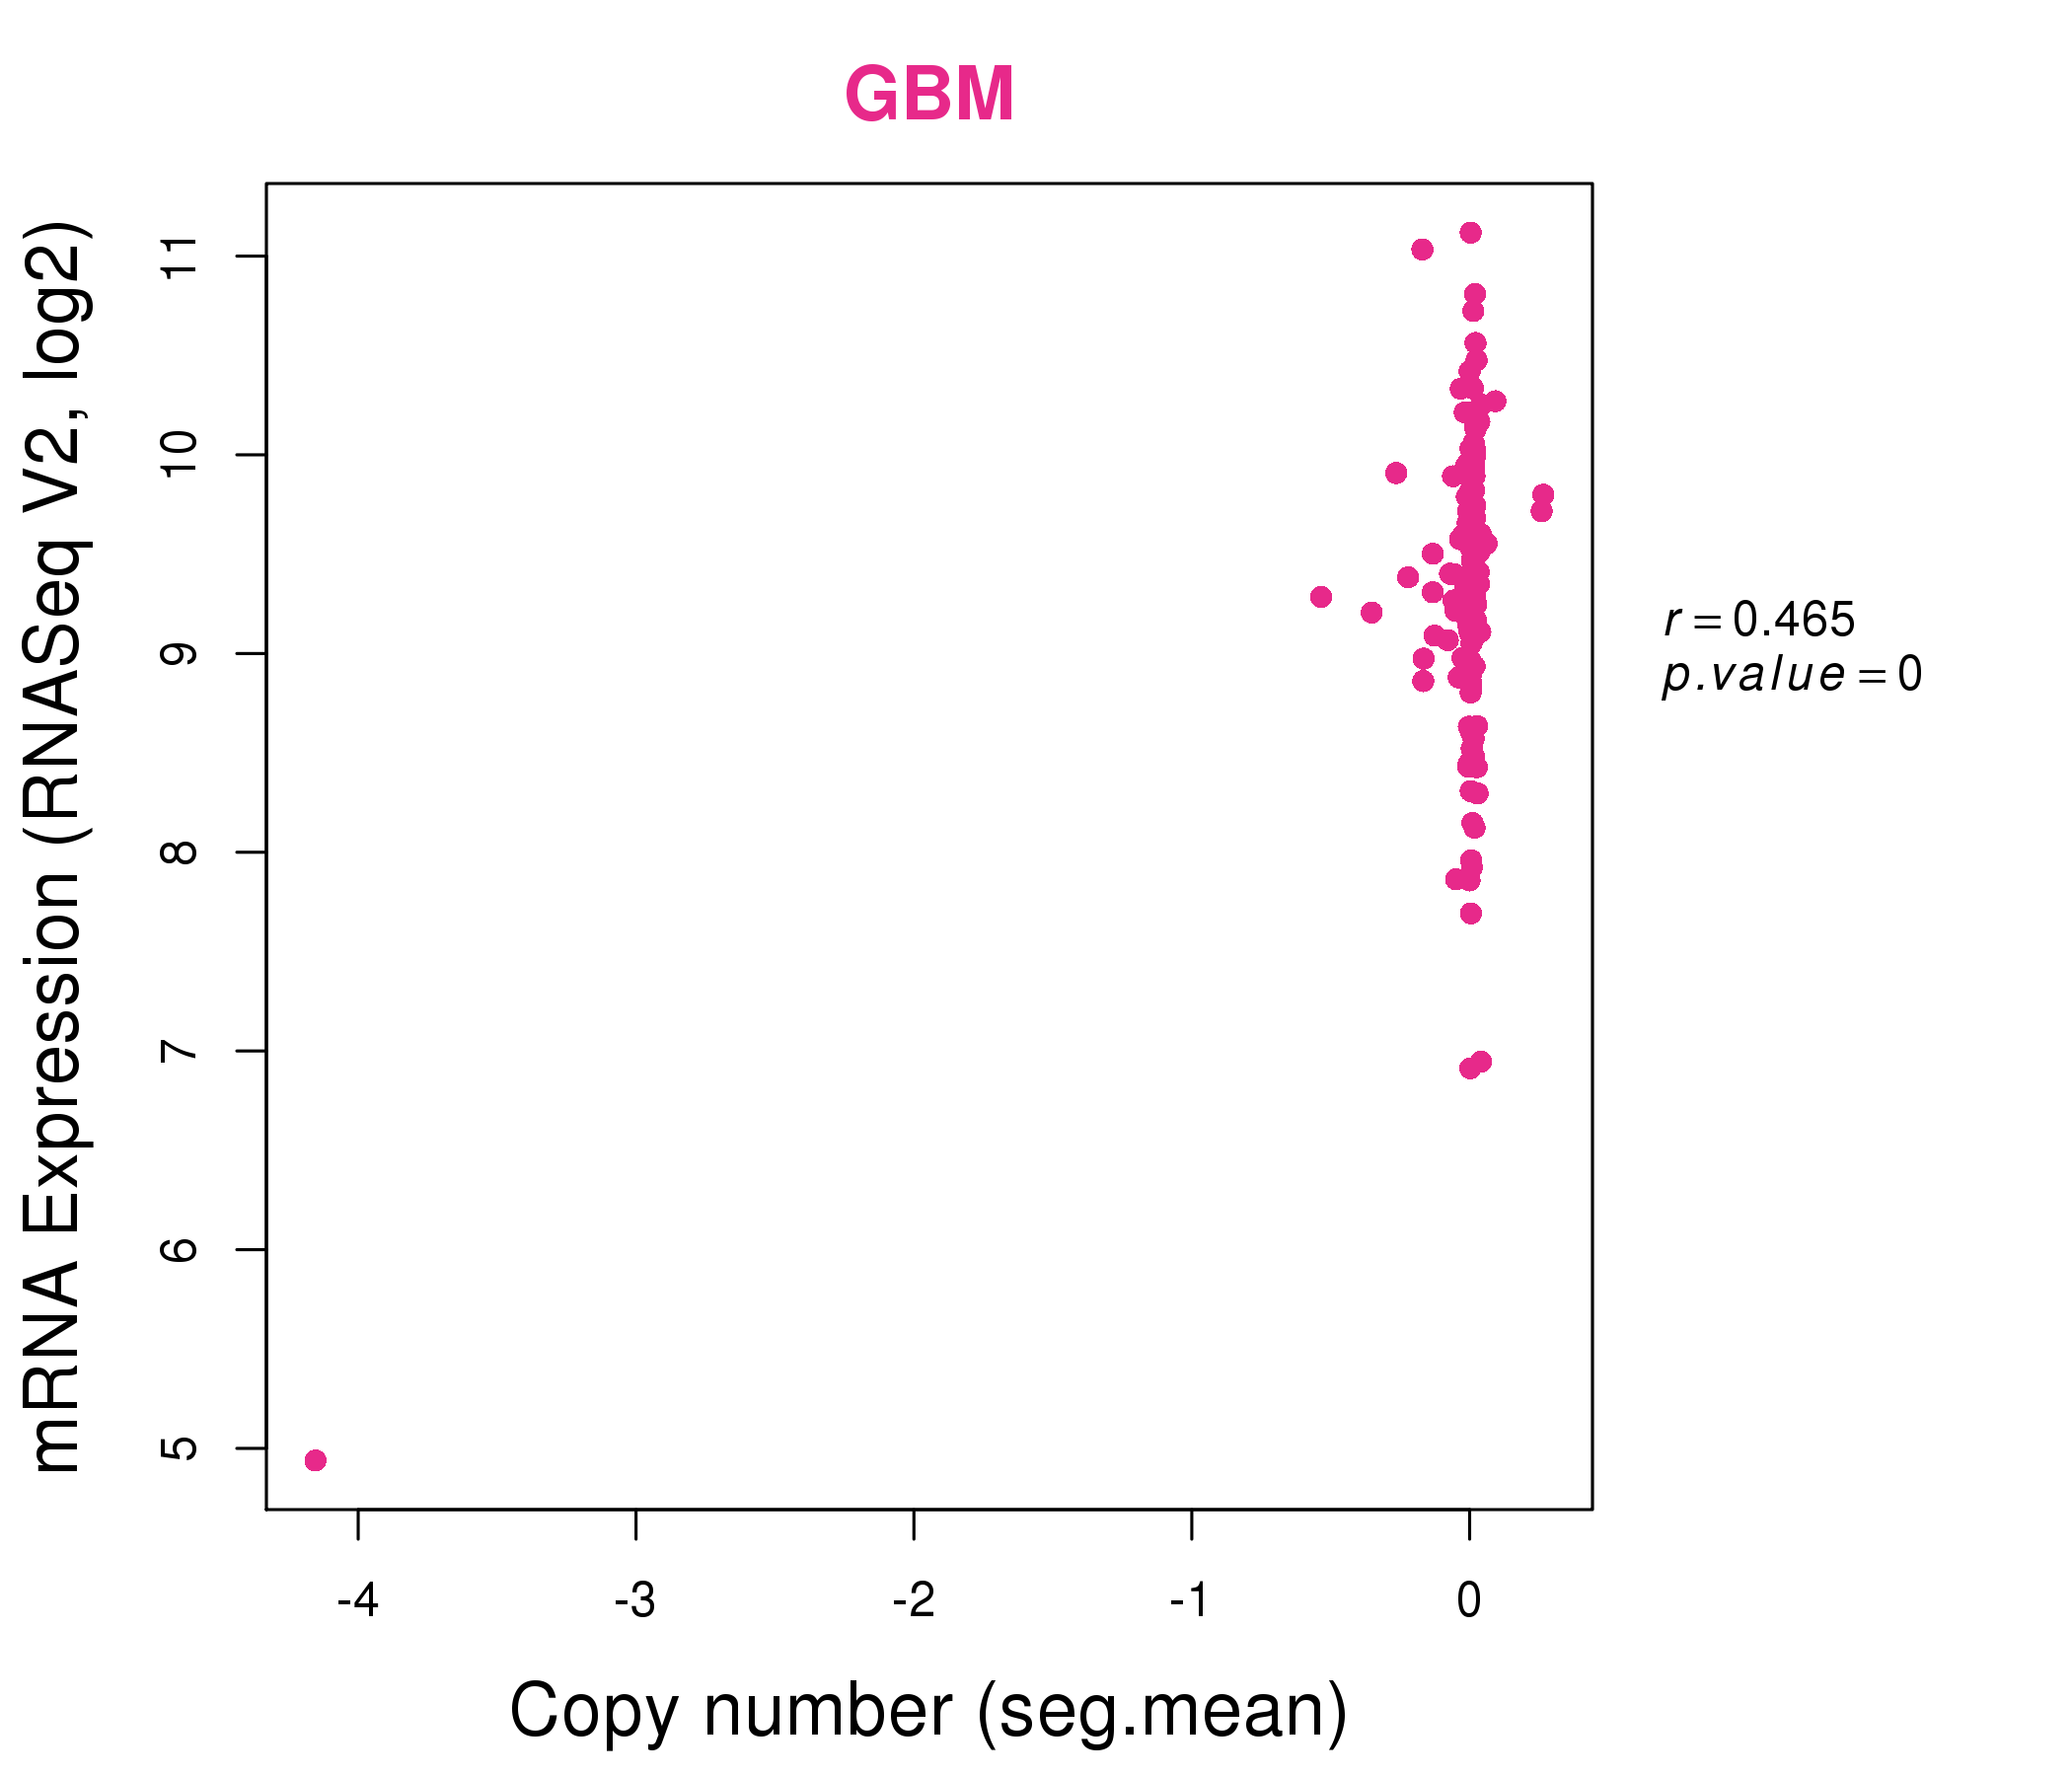
| * Normalized gene expression data of RNASeqV2 was extracted from TCGA using R package TCGA-Assembler. The URLs of all public data files on TCGA DCC data server were gathered at Jan-05-2015. Only eight cancer types have enough normal control samples for differential expression analysis. (t test, adjusted p<0.05 (using Benjamini-Hochberg FDR)) |
 |
| Top |
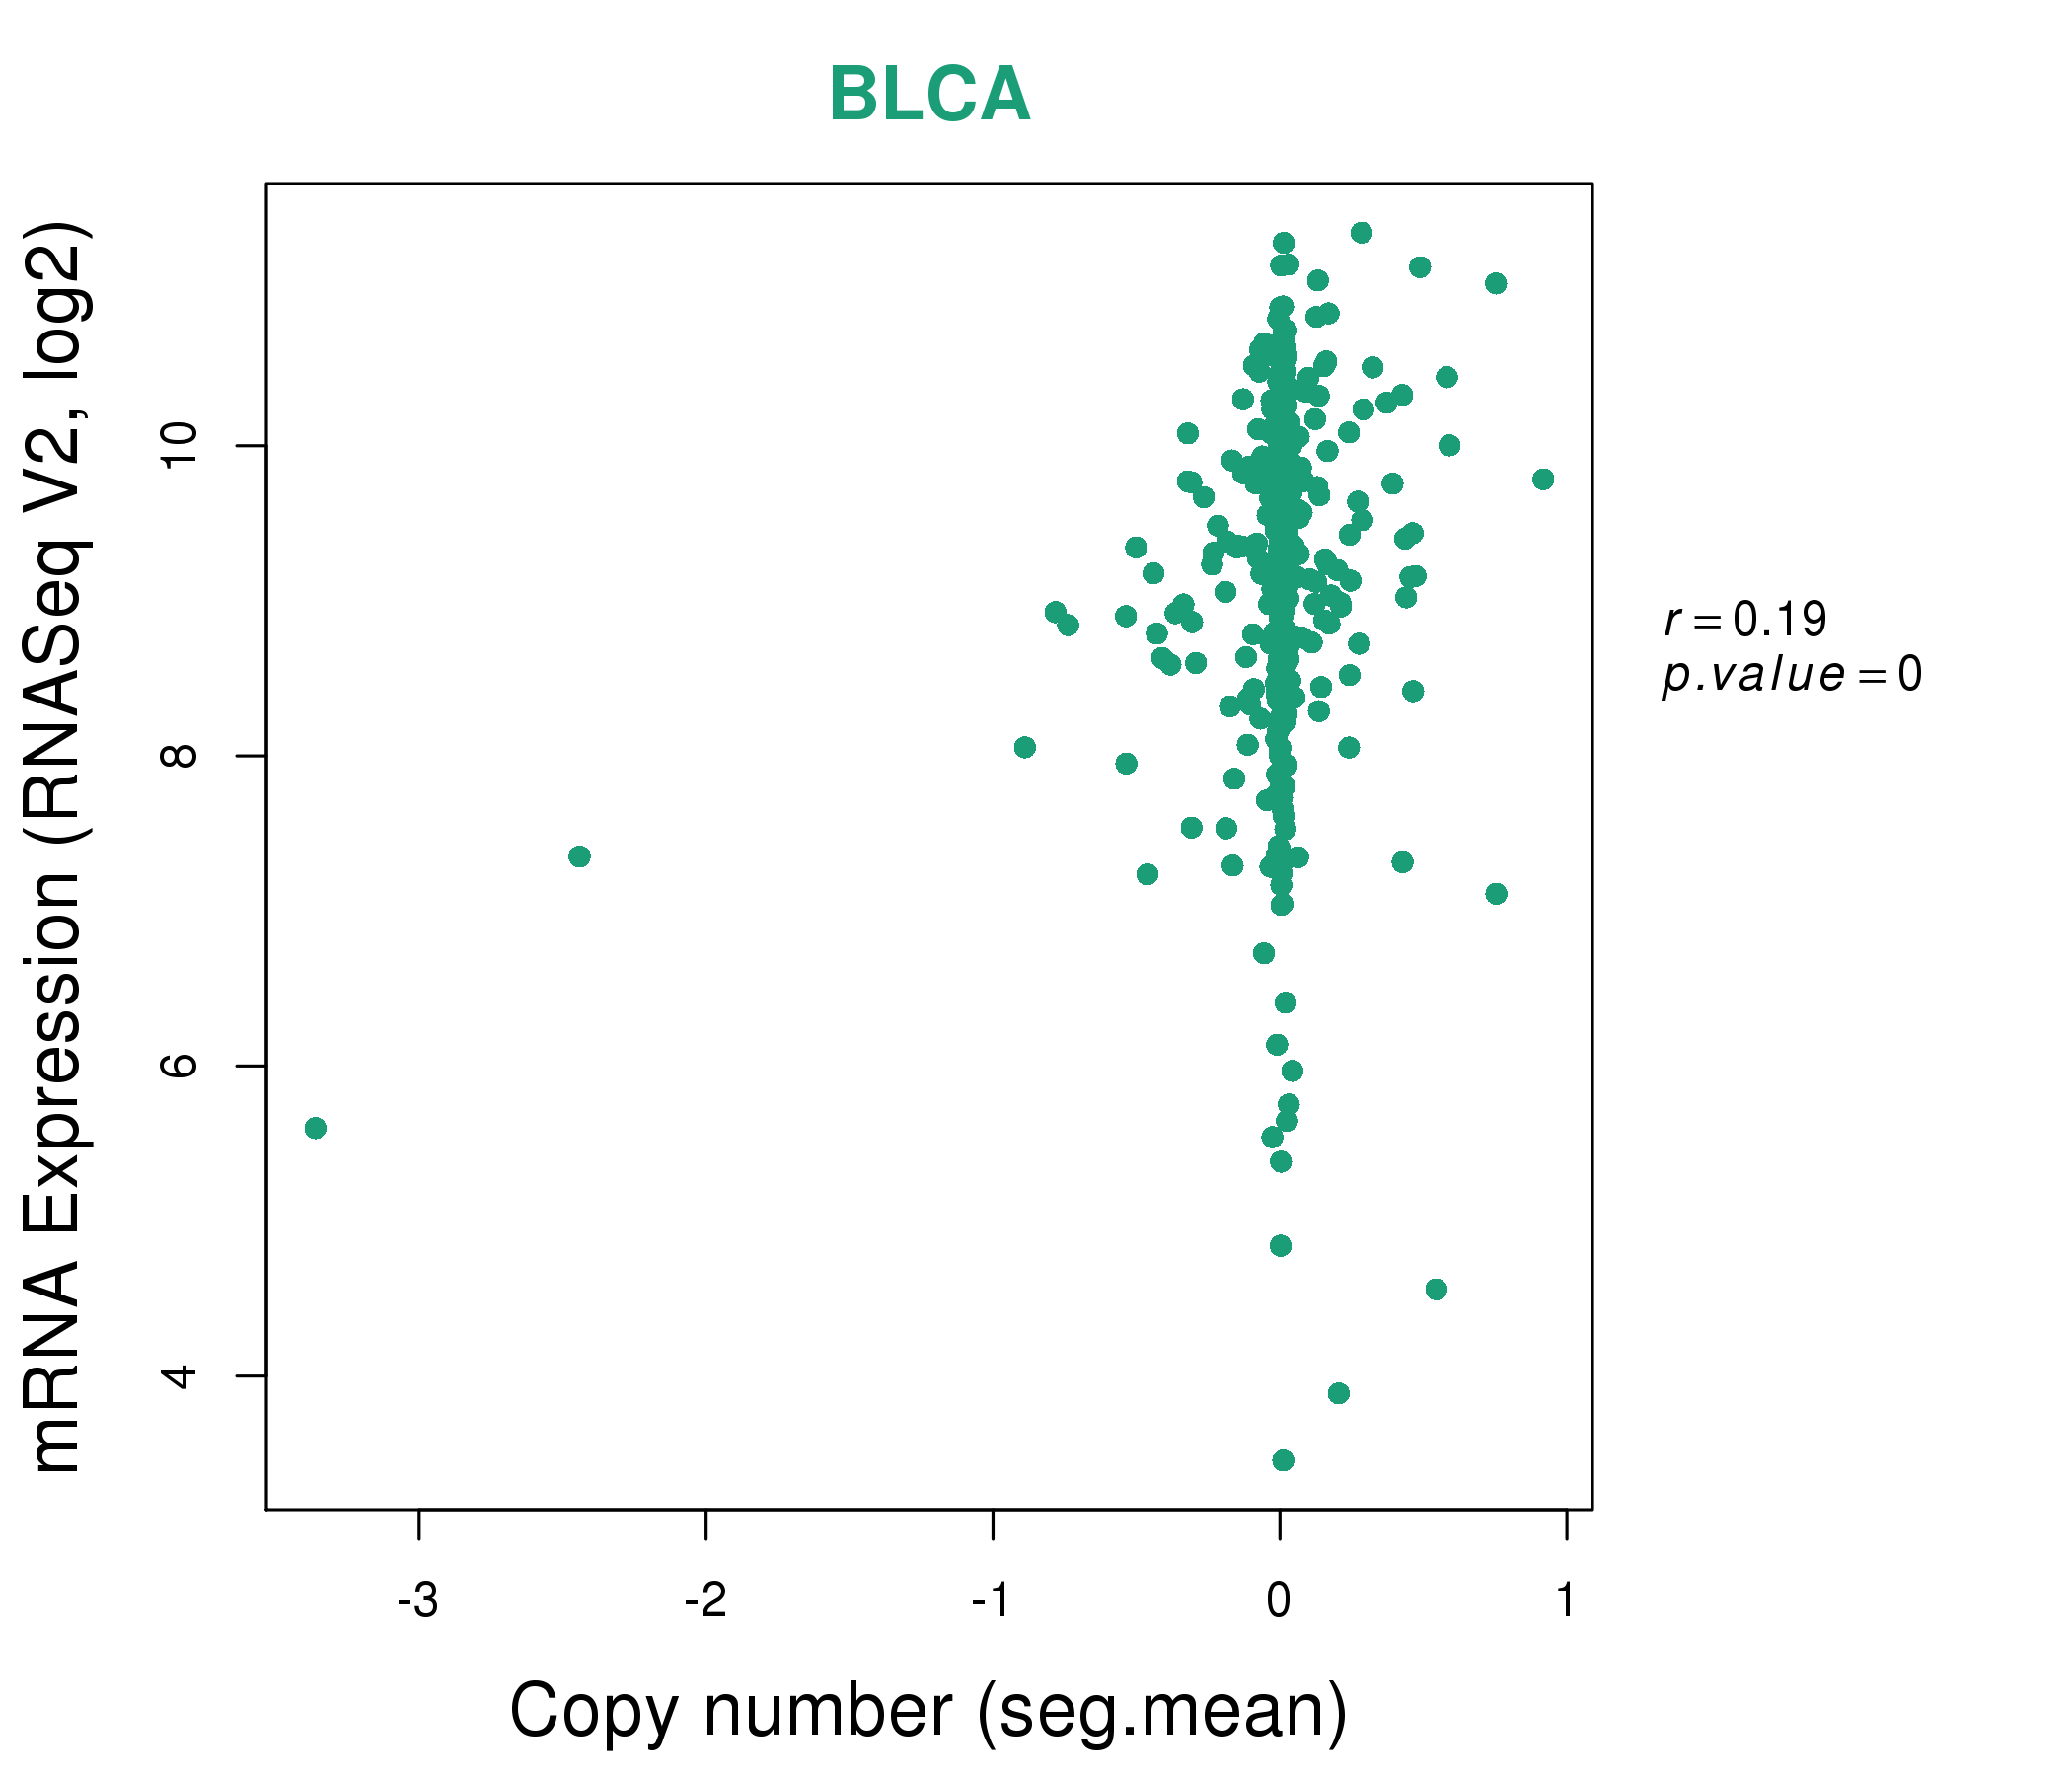
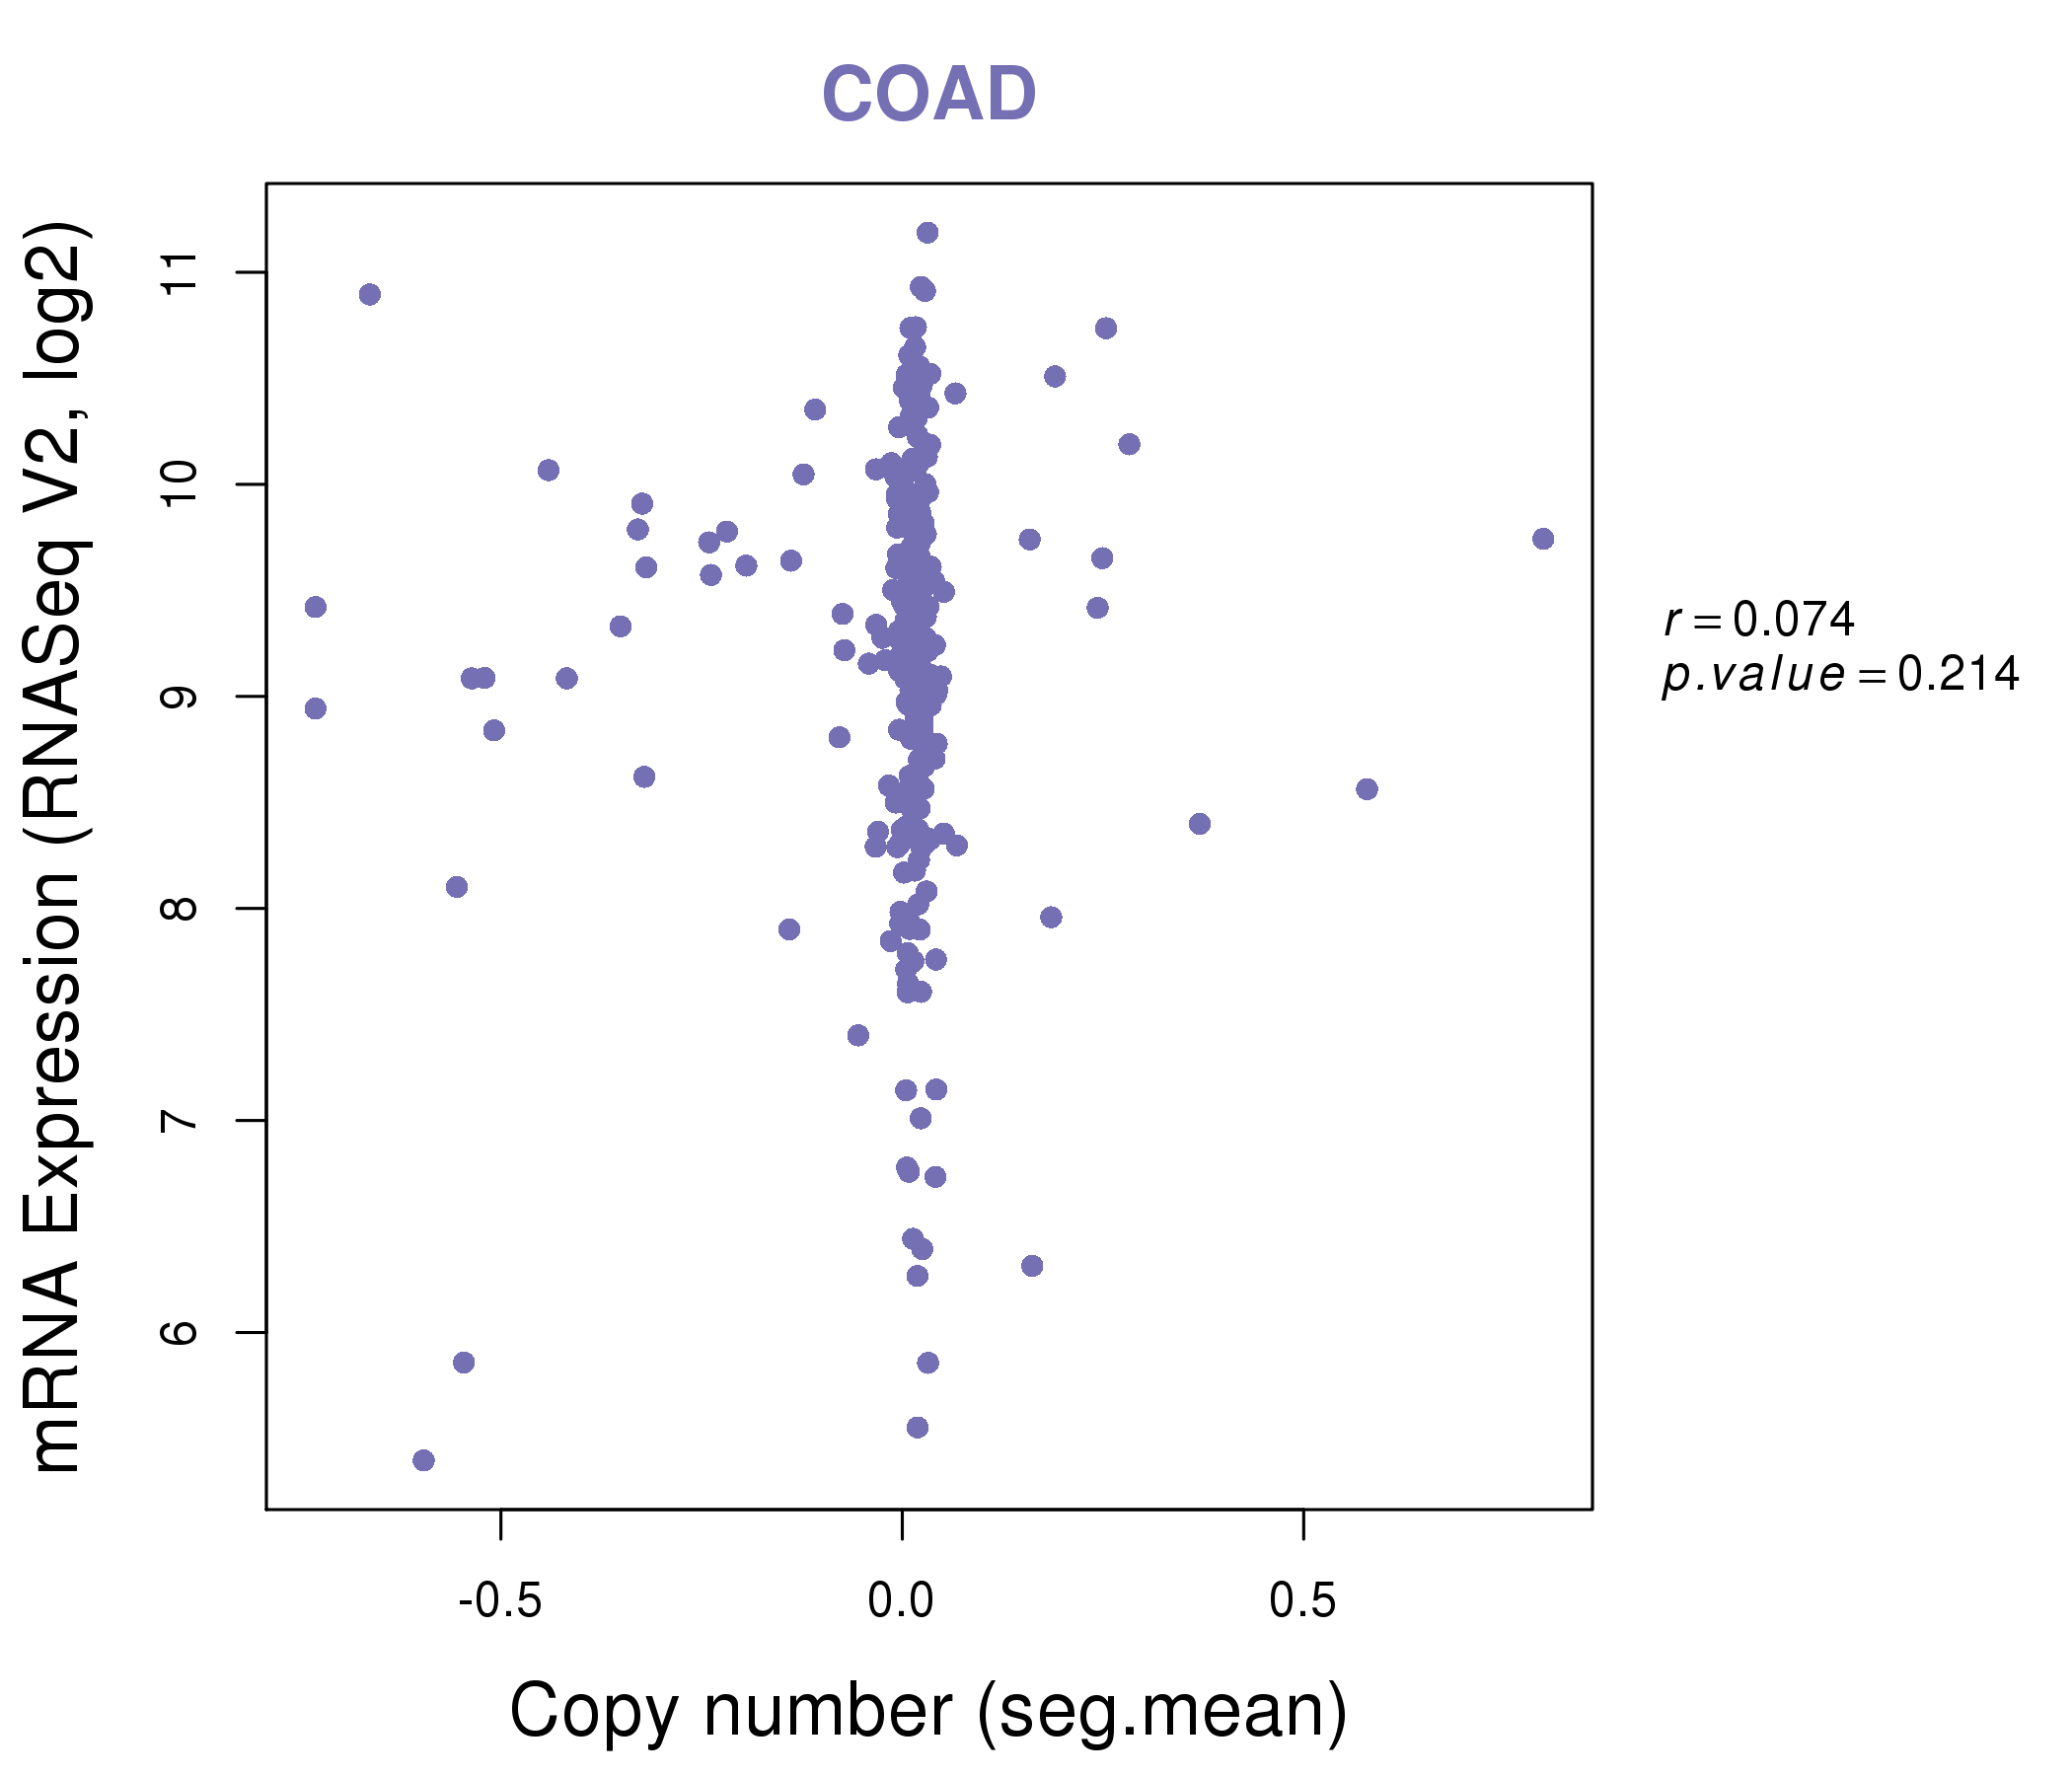
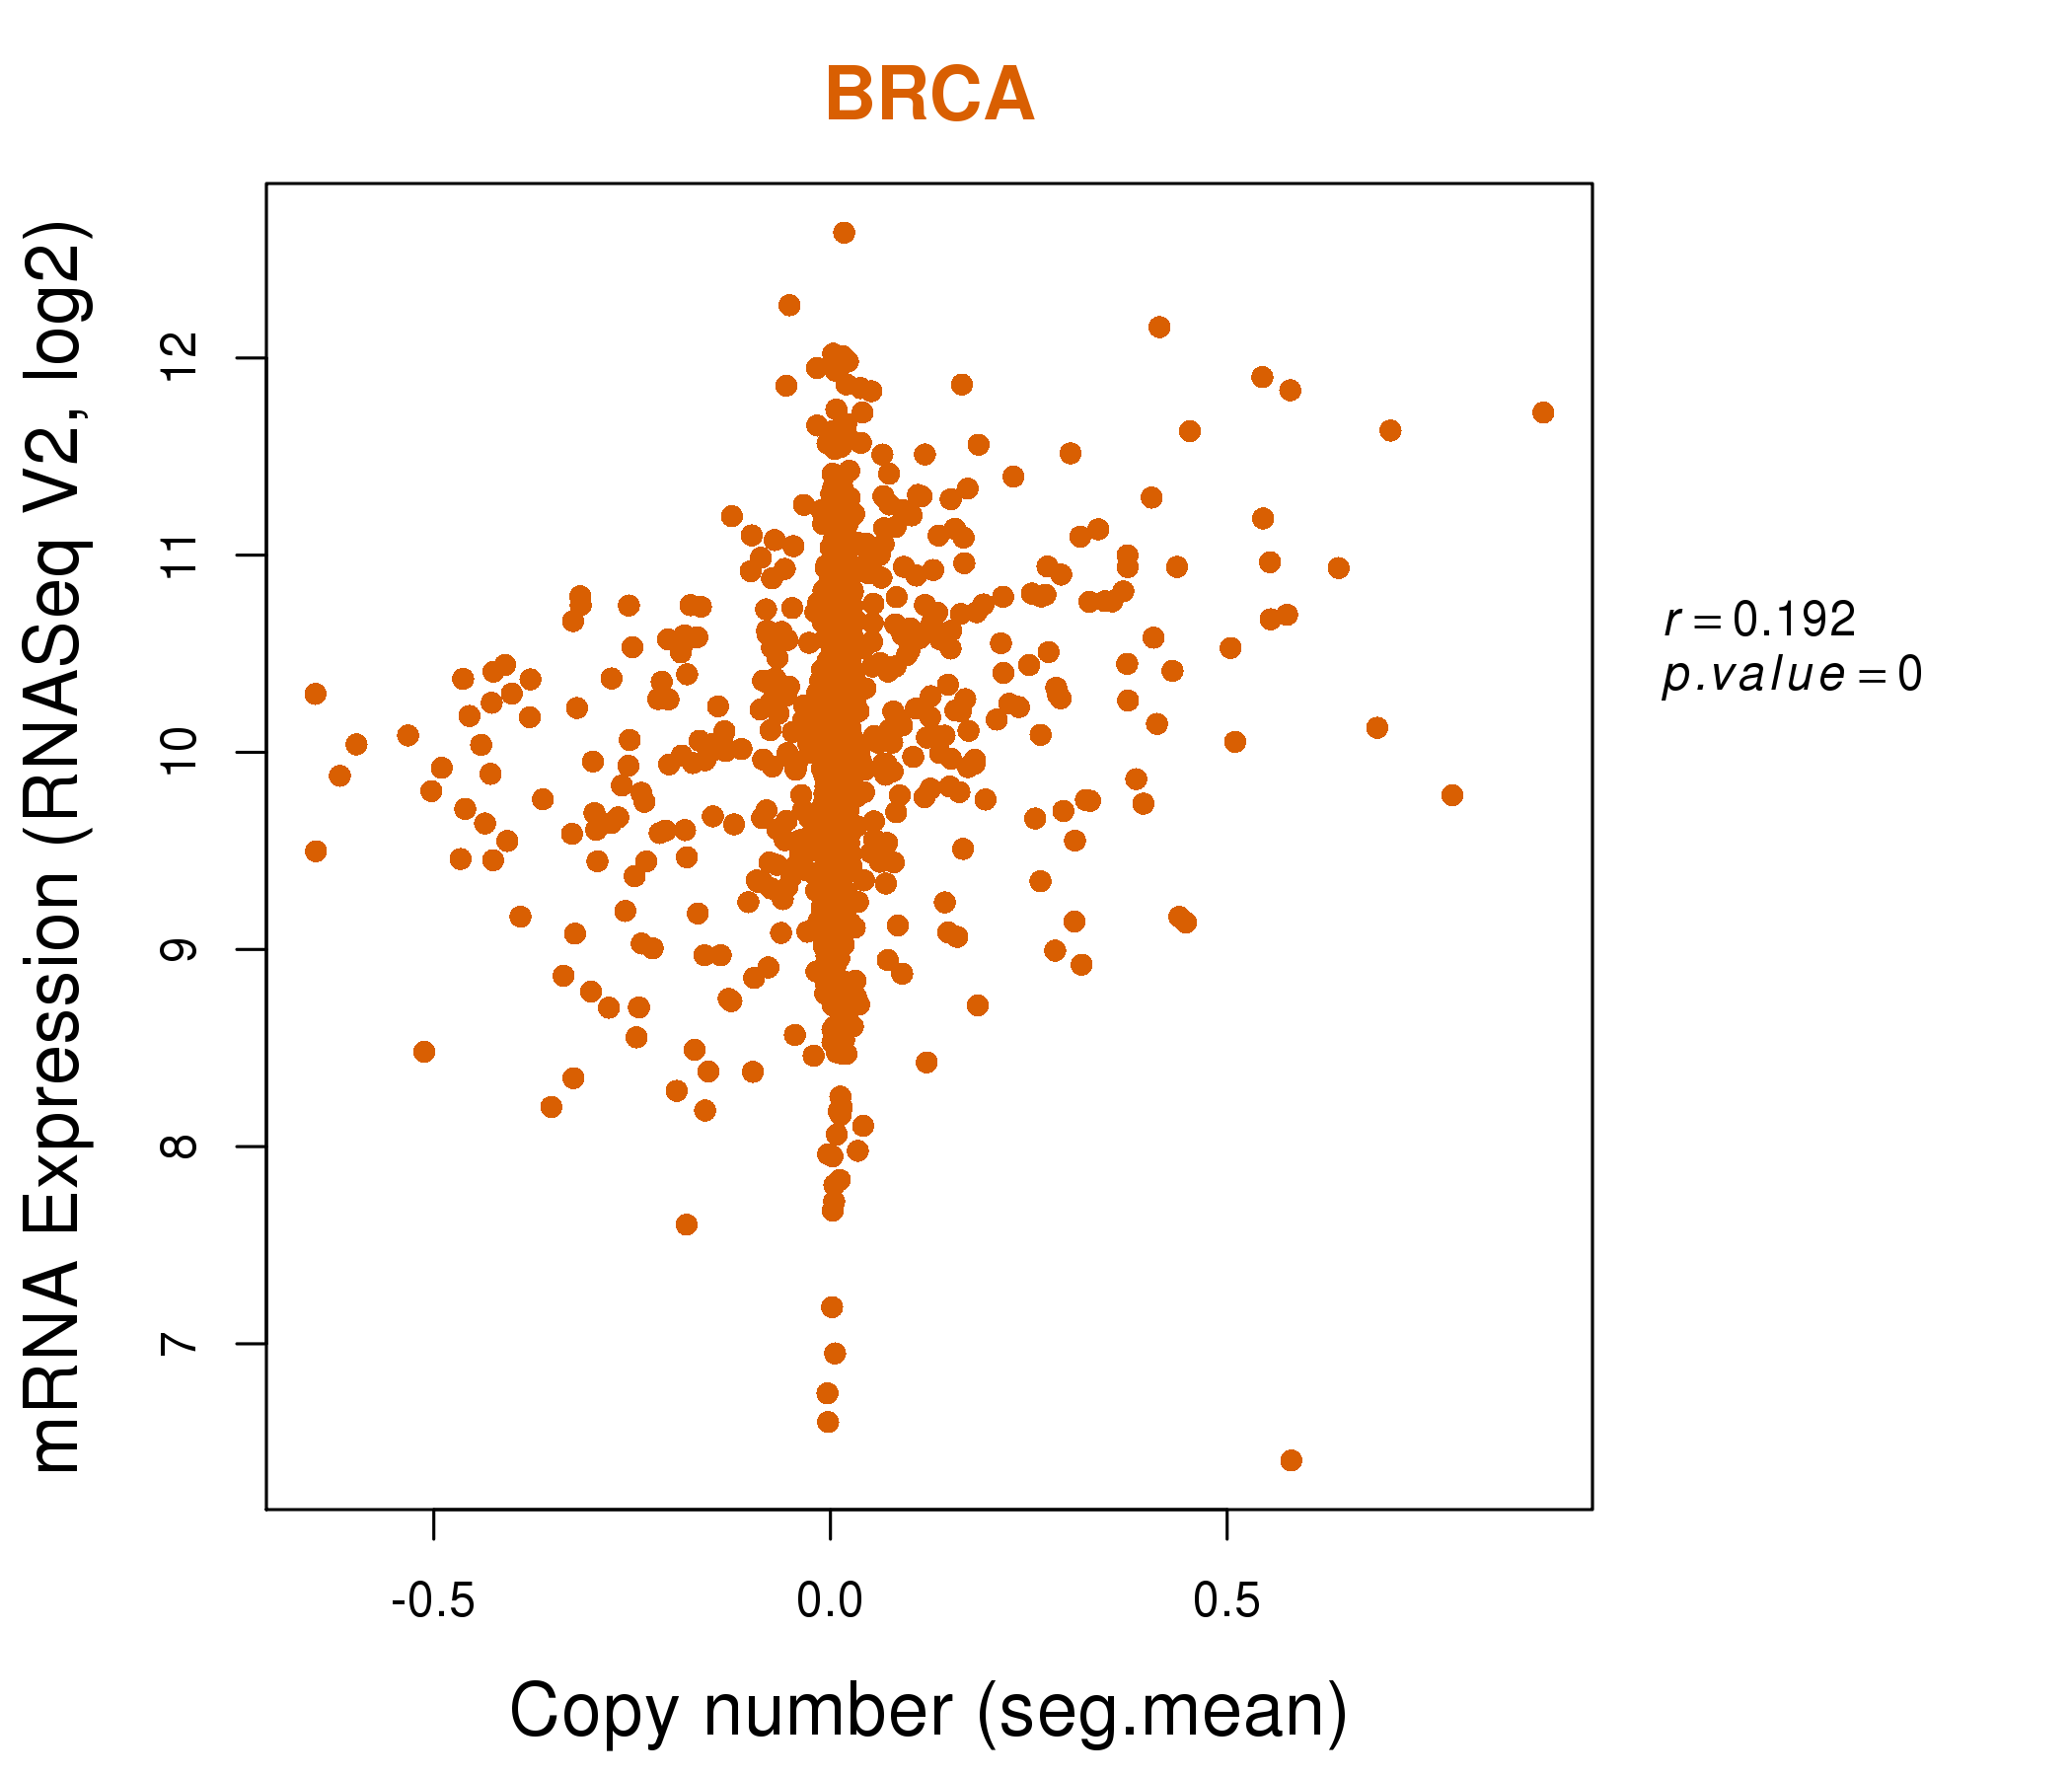
| * This plots show the correlation between CNV and gene expression. |
: Open all plots for all cancer types
 |
|
 |
|
| Top |
| Gene-Gene Network Information |
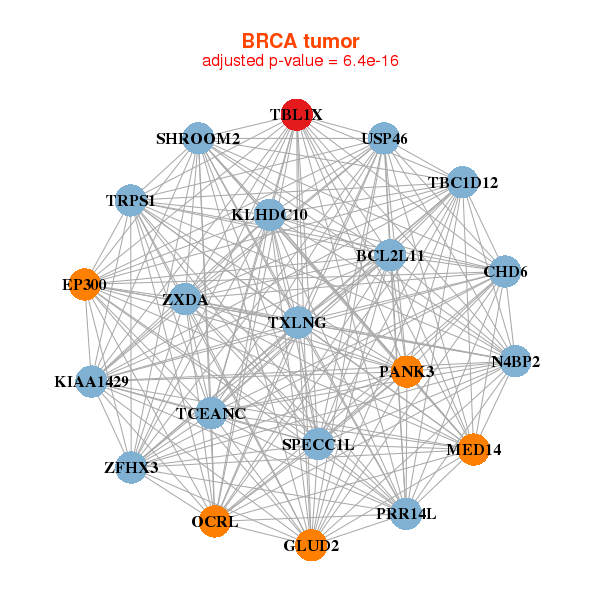
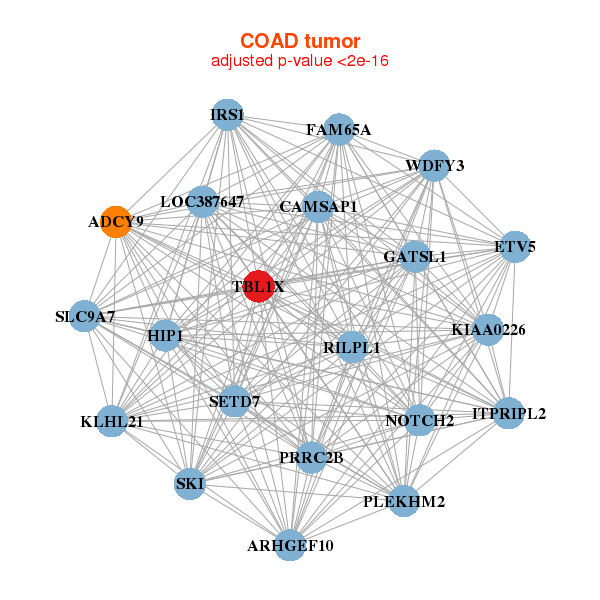
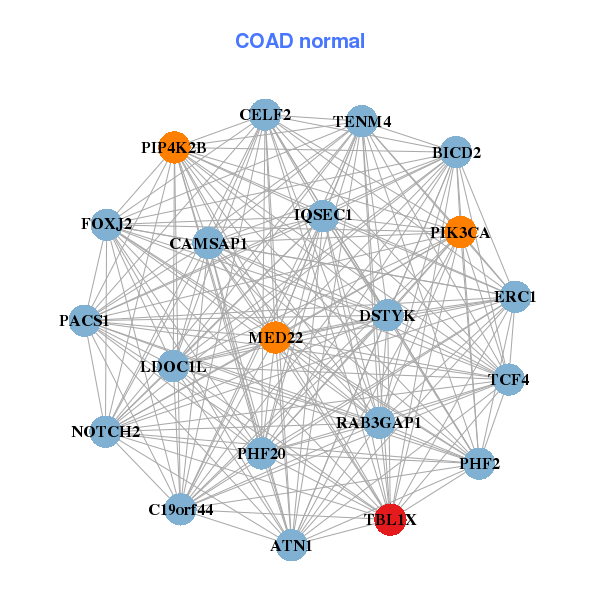
| * Co-Expression network figures were drawn using R package igraph. Only the top 20 genes with the highest correlations were shown. Red circle: input gene, orange circle: cell metabolism gene, sky circle: other gene |
: Open all plots for all cancer types
 |
|
| ACAP2,ATP13A3,DCUN1D1,DLG1,FBXO45,FXR1,FYTTD1, KLHL24,LMLN,LPP,MFN1,OPA1,PAK2,PDCD10, PHC3,RNF168,SENP2,TBL1XR1,TOR1AIP2,UBXN7,VPS8 | BET1,C5orf51,CGGBP1,DCUN1D4,FAM172A,FAM8A1,GABPA, GDAP2,RAB33B,SREK1IP1,SIKE1,SLC30A5,SMAD2,SMAD5, TAF9B,TBL1XR1,TCEA1,TMEM106B,TNPO1,TROVE2,VAMP4 |
 |
|
| ARMC8,CCNK,DCUN1D1,DLG1,GFM1,KLF5,MPP5, OPA1,PAK2,PAPOLA,PDIK1L,PPIL4,PRKCI,RC3H1, RSRC1,SNX4,TBL1XR1,THUMPD1,YY1,ZNF148,ZNF639 | ACAP2,CAMK2D,CD2AP,CMAS,CNOT2,FAM126B,FMR1, GDAP2,GPBP1,C2CD5,OPN3,PLOD2,RAB14,SLC20A1, SLC38A9,SP3,TBL1XR1,TMEM65,VCPIP1,YME1L1,ZNF654 |
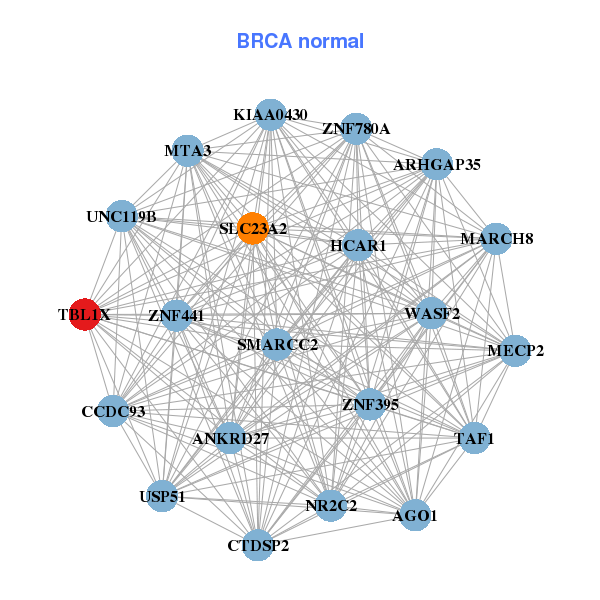
| * Co-Expression network figures were drawn using R package igraph. Only the top 20 genes with the highest correlations were shown. Red circle: input gene, orange circle: cell metabolism gene, sky circle: other gene |
: Open all plots for all cancer types
| Top |
: Open all interacting genes' information including KEGG pathway for all interacting genes from DAVID
| Top |
| Pharmacological Information for TBL1X |
| There's no related Drug. |
| Top |
| Cross referenced IDs for TBL1X |
| * We obtained these cross-references from Uniprot database. It covers 150 different DBs, 18 categories. http://www.uniprot.org/help/cross_references_section |
: Open all cross reference information
|
Copyright © 2016-Present - The Univsersity of Texas Health Science Center at Houston @ |