|
||||||||||||||||||||
| |
| Phenotypic Information (metabolism pathway, cancer, disease, phenome) |
| |
| |
| Gene-Gene Network Information: Co-Expression Network, Interacting Genes & KEGG |
| |
|


| Gene Summary for MLX |
| Top |
| Phenotypic Information for MLX(metabolism pathway, cancer, disease, phenome) |
| Cancer | CGAP: MLX |
| Familial Cancer Database: MLX | |
| * This gene is included in those cancer gene databases. |
|
|
|
|
|
| . | ||||||||||||||
Oncogene 1 | Significant driver gene in | |||||||||||||||||||
| cf) number; DB name 1 Oncogene; http://nar.oxfordjournals.org/content/35/suppl_1/D721.long, 2 Tumor Suppressor gene; https://bioinfo.uth.edu/TSGene/, 3 Cancer Gene Census; http://www.nature.com/nrc/journal/v4/n3/abs/nrc1299.html, 4 CancerGenes; http://nar.oxfordjournals.org/content/35/suppl_1/D721.long, 5 Network of Cancer Gene; http://ncg.kcl.ac.uk/index.php, 1Therapeutic Vulnerabilities in Cancer; http://cbio.mskcc.org/cancergenomics/statius/ |
| REACTOME_INTEGRATION_OF_ENERGY_METABOLISM | |
| OMIM | |
| Orphanet | |
| Disease | KEGG Disease: MLX |
| MedGen: MLX (Human Medical Genetics with Condition) | |
| ClinVar: MLX | |
| Phenotype | MGI: MLX (International Mouse Phenotyping Consortium) |
| PhenomicDB: MLX | |
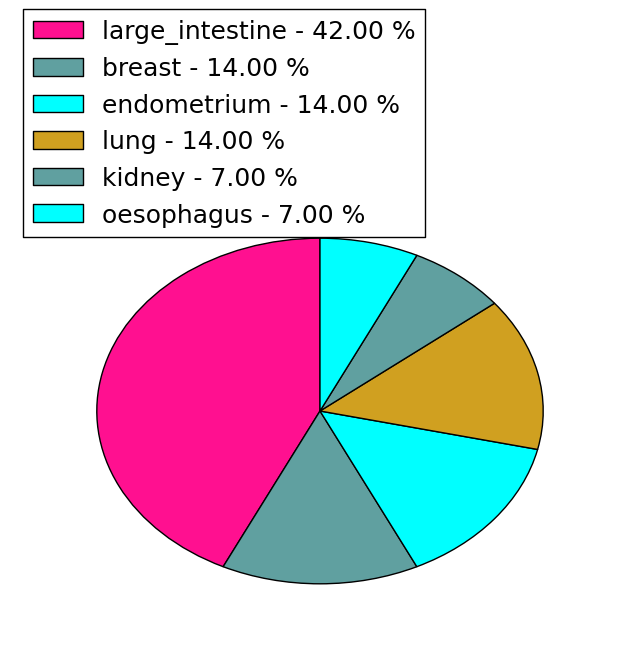
| Mutations for MLX |
| * Under tables are showing count per each tissue to give us broad intuition about tissue specific mutation patterns.You can go to the detailed page for each mutation database's web site. |
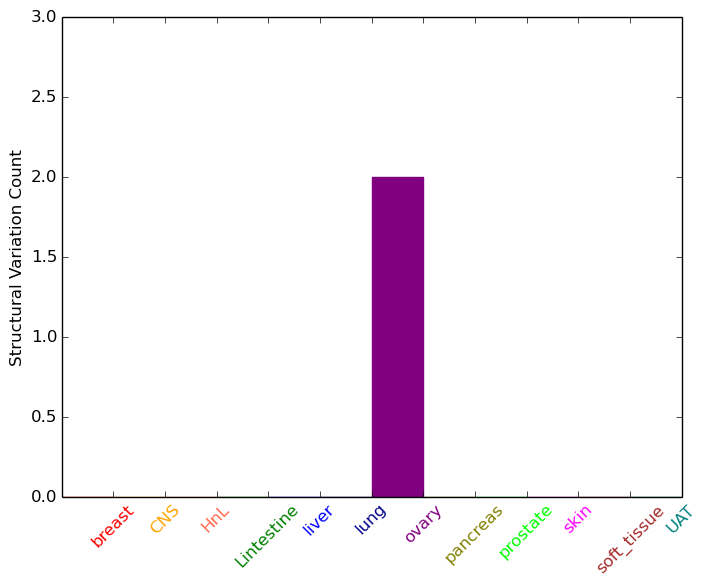
| - Statistics for Tissue and Mutation type | Top |
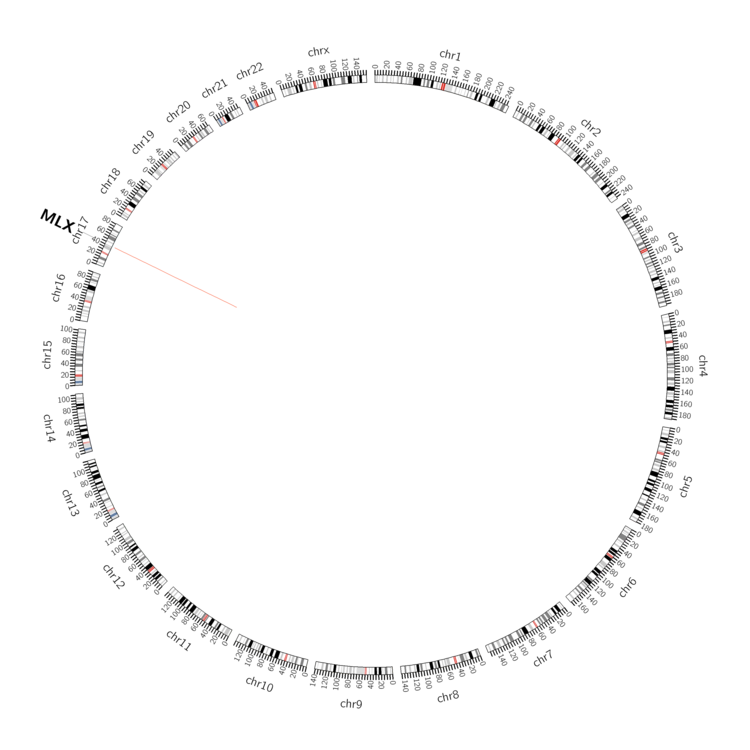 |
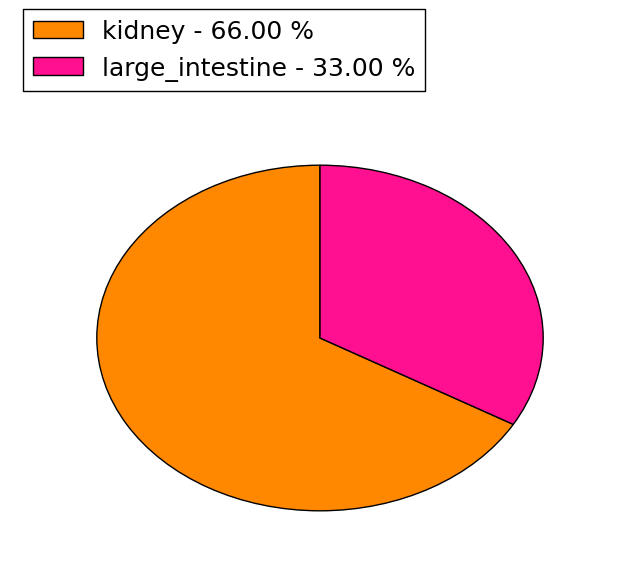
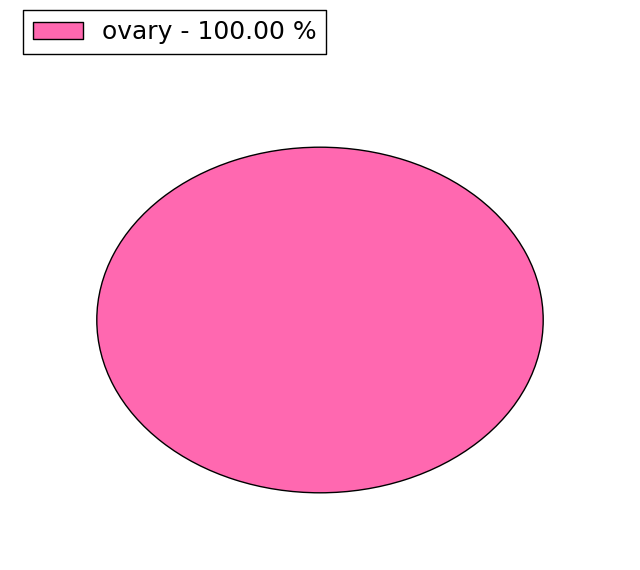
| - For Inter-chromosomal Variations |
| There's no inter-chromosomal structural variation. |
| - For Intra-chromosomal Variations |
| * Intra-chromosomal variantions includes 'intrachromosomal amplicon to amplicon', 'intrachromosomal amplicon to non-amplified dna', 'intrachromosomal deletion', 'intrachromosomal fold-back inversion', 'intrachromosomal inversion', 'intrachromosomal tandem duplication', 'Intrachromosomal unknown type', 'intrachromosomal with inverted orientation', 'intrachromosomal with non-inverted orientation'. |
 |
| Sample | Symbol_a | Chr_a | Start_a | End_a | Symbol_b | Chr_b | Start_b | End_b |
| ovary | MLX | chr17 | 40720945 | 40720965 | MLX | chr17 | 40723092 | 40723112 |
| cf) Tissue number; Tissue name (1;Breast, 2;Central_nervous_system, 3;Haematopoietic_and_lymphoid_tissue, 4;Large_intestine, 5;Liver, 6;Lung, 7;Ovary, 8;Pancreas, 9;Prostate, 10;Skin, 11;Soft_tissue, 12;Upper_aerodigestive_tract) |
| * From mRNA Sanger sequences, Chitars2.0 arranged chimeric transcripts. This table shows MLX related fusion information. |
| ID | Head Gene | Tail Gene | Accession | Gene_a | qStart_a | qEnd_a | Chromosome_a | tStart_a | tEnd_a | Gene_a | qStart_a | qEnd_a | Chromosome_a | tStart_a | tEnd_a |
| AW881454 | PEX2 | 2 | 223 | 8 | 77896302 | 77898518 | MLX | 218 | 279 | 17 | 40724251 | 40724312 | |
| L38933 | BCL2L2-PABPN1 | 5 | 99 | 14 | 23793345 | 23793439 | MLX | 90 | 1438 | 17 | 40724333 | 40729748 | |
| BE085890 | MLX | 5 | 250 | 17 | 40722062 | 40723674 | MLX | 243 | 303 | 17 | 40723723 | 40723783 | |
| Top |
| There's no copy number variation information in COSMIC data for this gene. |
| Top |
|
 |
| Top |
| Stat. for Non-Synonymous SNVs (# total SNVs=14) | (# total SNVs=3) |
 |  |
(# total SNVs=1) | (# total SNVs=0) |
 |
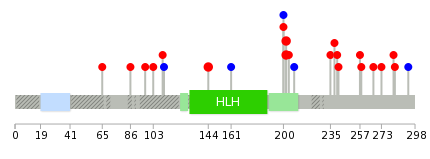
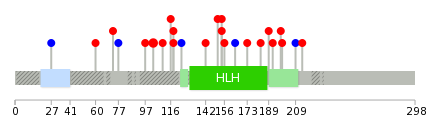
| Top |
| * When you move the cursor on each content, you can see more deailed mutation information on the Tooltip. Those are primary_site,primary_histology,mutation(aa),pubmedID. |
| GRCh37 position | Mutation(aa) | Unique sampleID count |
| chr17:40720953-40720953 | p.A144T | 2 |
| chr17:40721590-40721590 | p.R202C | 2 |
| chr17:40721591-40721591 | p.R202H | 2 |
| chr17:40723569-40723569 | p.L282P | 1 |
| chr17:40720554-40720554 | p.S103N | 1 |
| chr17:40721596-40721596 | p.D204N | 1 |
| chr17:40723571-40723571 | p.R283W | 1 |
| chr17:40720575-40720575 | p.T110I | 1 |
| chr17:40721610-40721610 | p.L208L | 1 |
| chr17:40723603-40723603 | p.L293L | 1 |
| Top |
|
 |
| Point Mutation/ Tissue ID | 1 | 2 | 3 | 4 | 5 | 6 | 7 | 8 | 9 | 10 | 11 | 12 | 13 | 14 | 15 | 16 | 17 | 18 | 19 | 20 |
| # sample | 2 | 1 | 5 | 1 | 4 | 1 | 3 | 1 | 6 | 2 | ||||||||||
| # mutation | 2 | 1 | 4 | 1 | 4 | 1 | 3 | 1 | 6 | 2 | ||||||||||
| nonsynonymous SNV | 1 | 1 | 4 | 3 | 3 | 1 | 5 | 2 | ||||||||||||
| synonymous SNV | 1 | 1 | 1 | 1 | 1 |
| cf) Tissue ID; Tissue type (1; BLCA[Bladder Urothelial Carcinoma], 2; BRCA[Breast invasive carcinoma], 3; CESC[Cervical squamous cell carcinoma and endocervical adenocarcinoma], 4; COAD[Colon adenocarcinoma], 5; GBM[Glioblastoma multiforme], 6; Glioma Low Grade, 7; HNSC[Head and Neck squamous cell carcinoma], 8; KICH[Kidney Chromophobe], 9; KIRC[Kidney renal clear cell carcinoma], 10; KIRP[Kidney renal papillary cell carcinoma], 11; LAML[Acute Myeloid Leukemia], 12; LUAD[Lung adenocarcinoma], 13; LUSC[Lung squamous cell carcinoma], 14; OV[Ovarian serous cystadenocarcinoma ], 15; PAAD[Pancreatic adenocarcinoma], 16; PRAD[Prostate adenocarcinoma], 17; SKCM[Skin Cutaneous Melanoma], 18:STAD[Stomach adenocarcinoma], 19:THCA[Thyroid carcinoma], 20:UCEC[Uterine Corpus Endometrial Carcinoma]) |
| Top |
| * We represented just top 10 SNVs. When you move the cursor on each content, you can see more deailed mutation information on the Tooltip. Those are primary_site, primary_histology, mutation(aa), pubmedID. |
| Genomic Position | Mutation(aa) | Unique sampleID count |
| chr17:40720554 | p.S103N,MLX | 2 |
| chr17:40723617 | p.K154N,MLX | 1 |
| chr17:40720856 | p.N156S,MLX | 1 |
| chr17:40722075 | p.N97S,MLX | 1 |
| chr17:40720953 | p.S164S,MLX | 1 |
| chr17:40722080 | p.I173S,MLX | 1 |
| chr17:40721253 | p.T110I,MLX | 1 |
| chr17:40722105 | p.A183V,MLX | 1 |
| chr17:40721266 | p.D27D,MLX | 1 |
| chr17:40722131 | p.I189M,MLX | 1 |
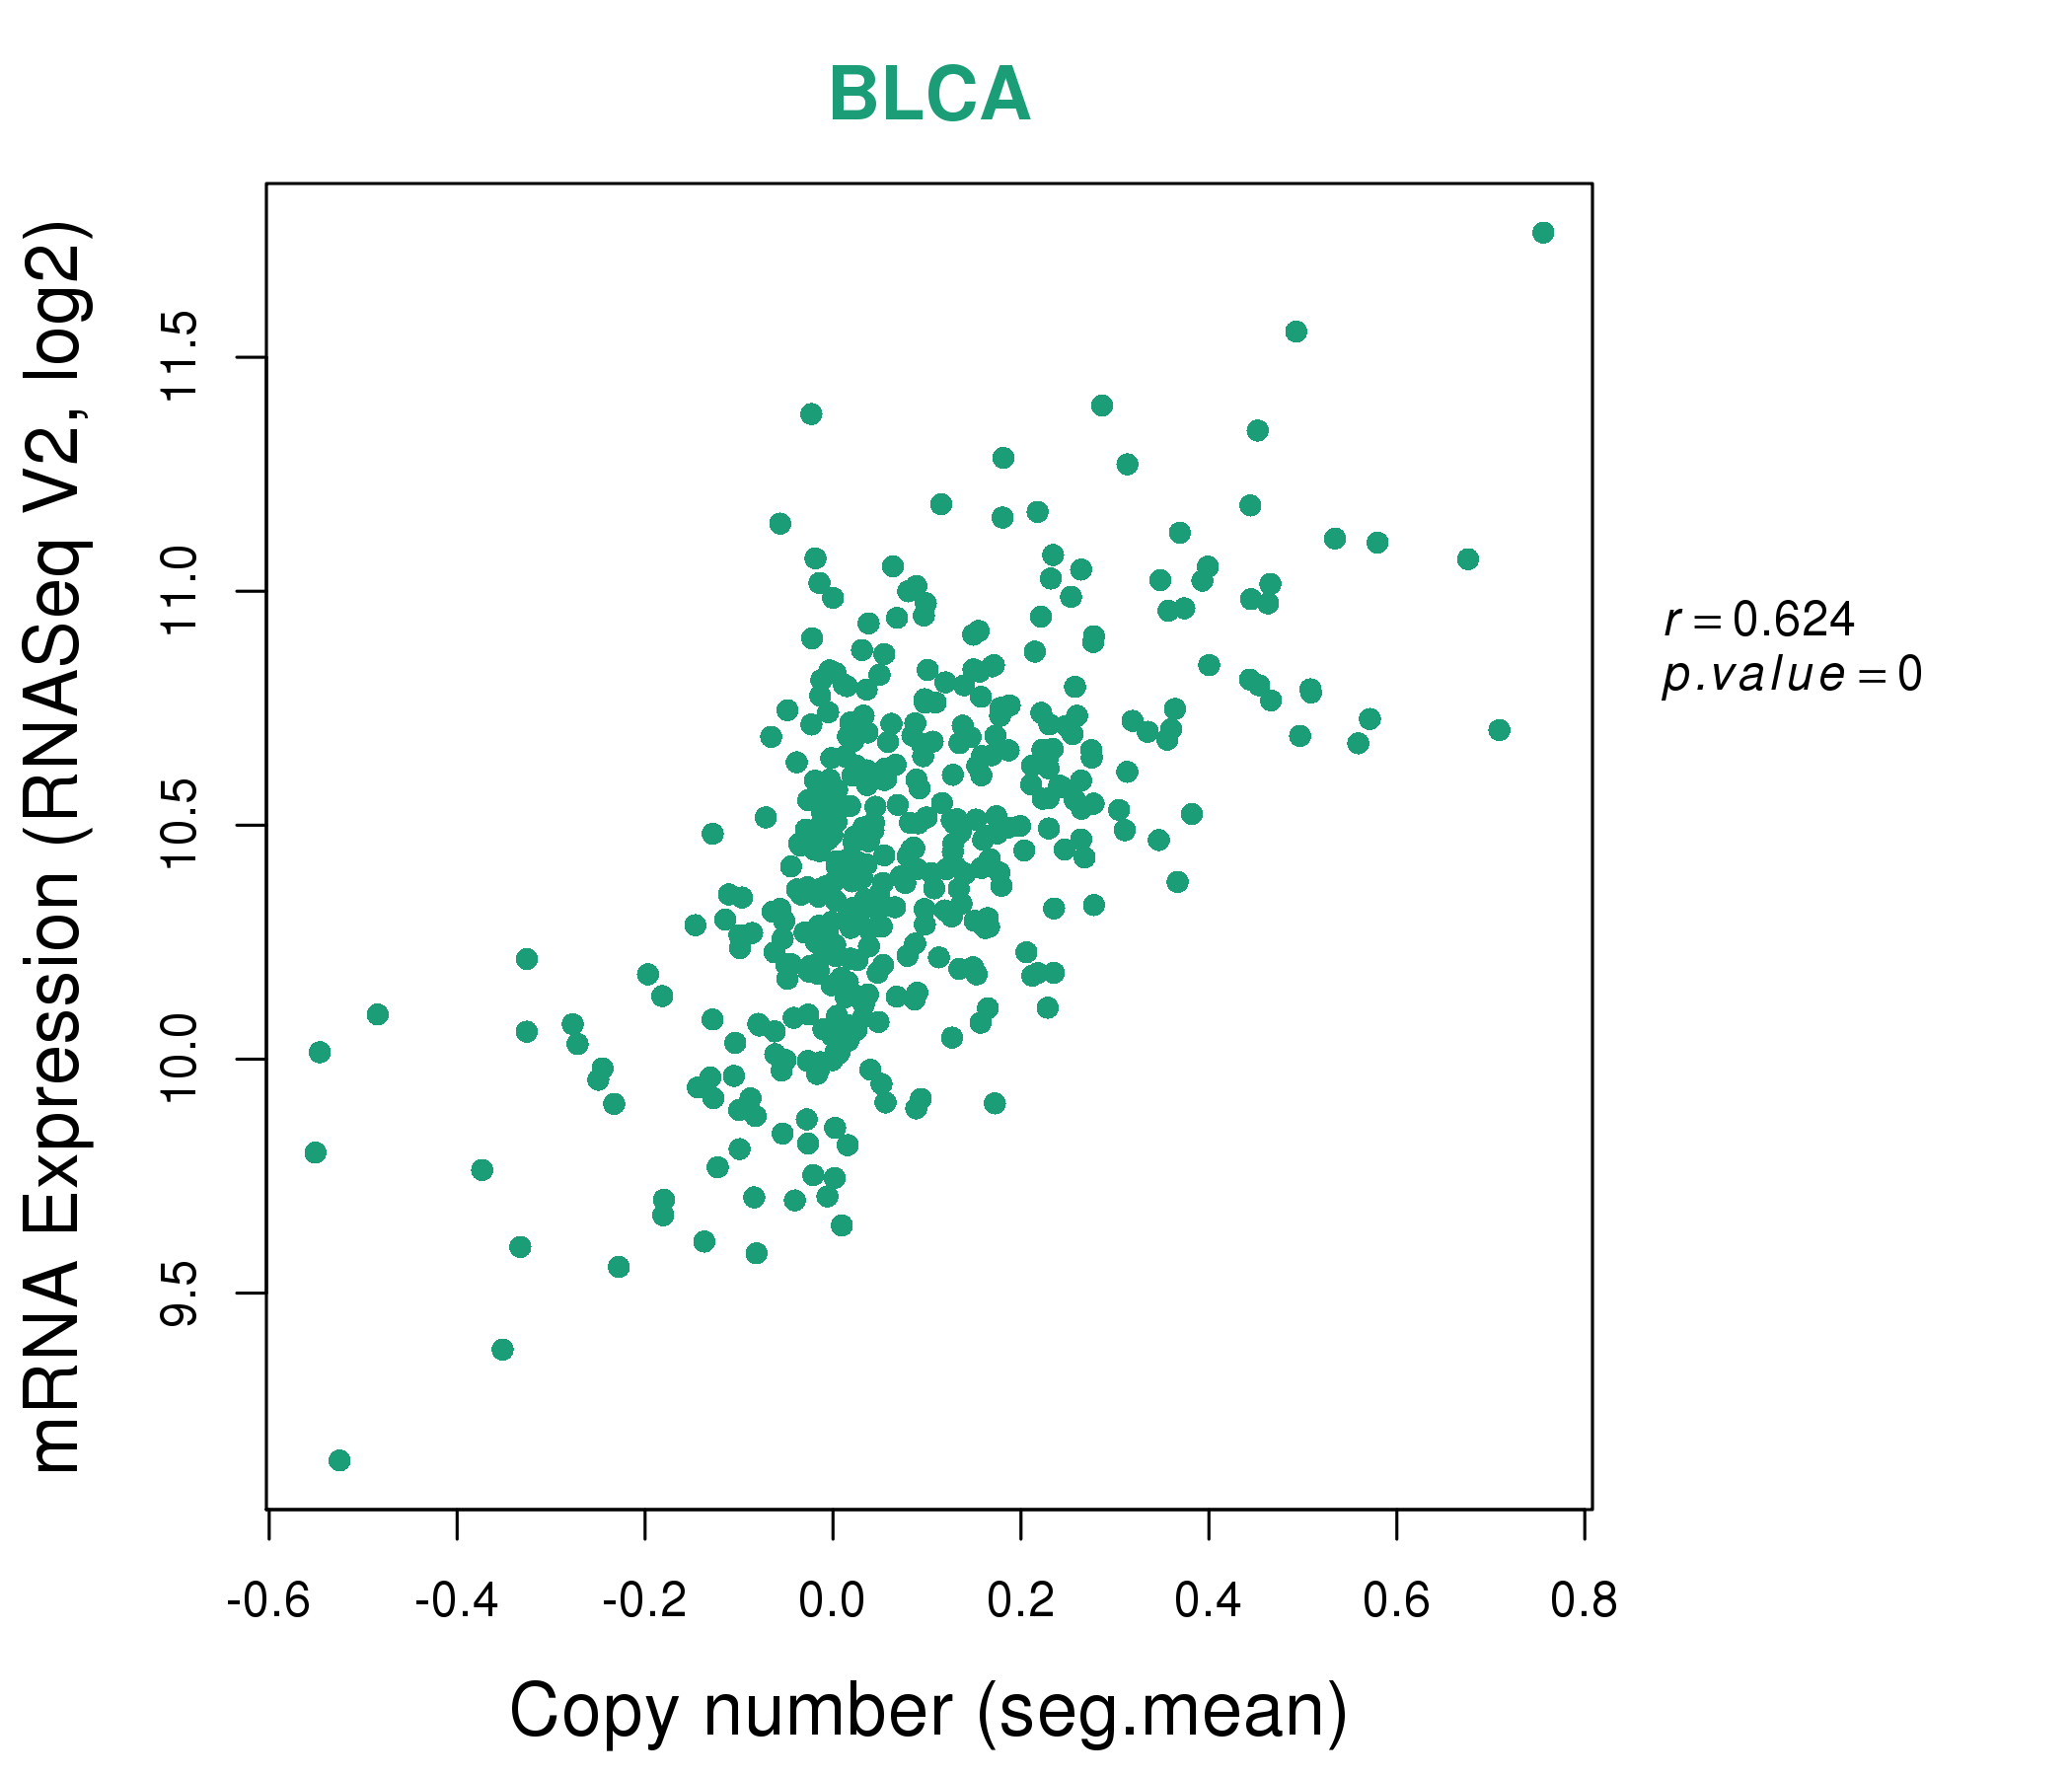
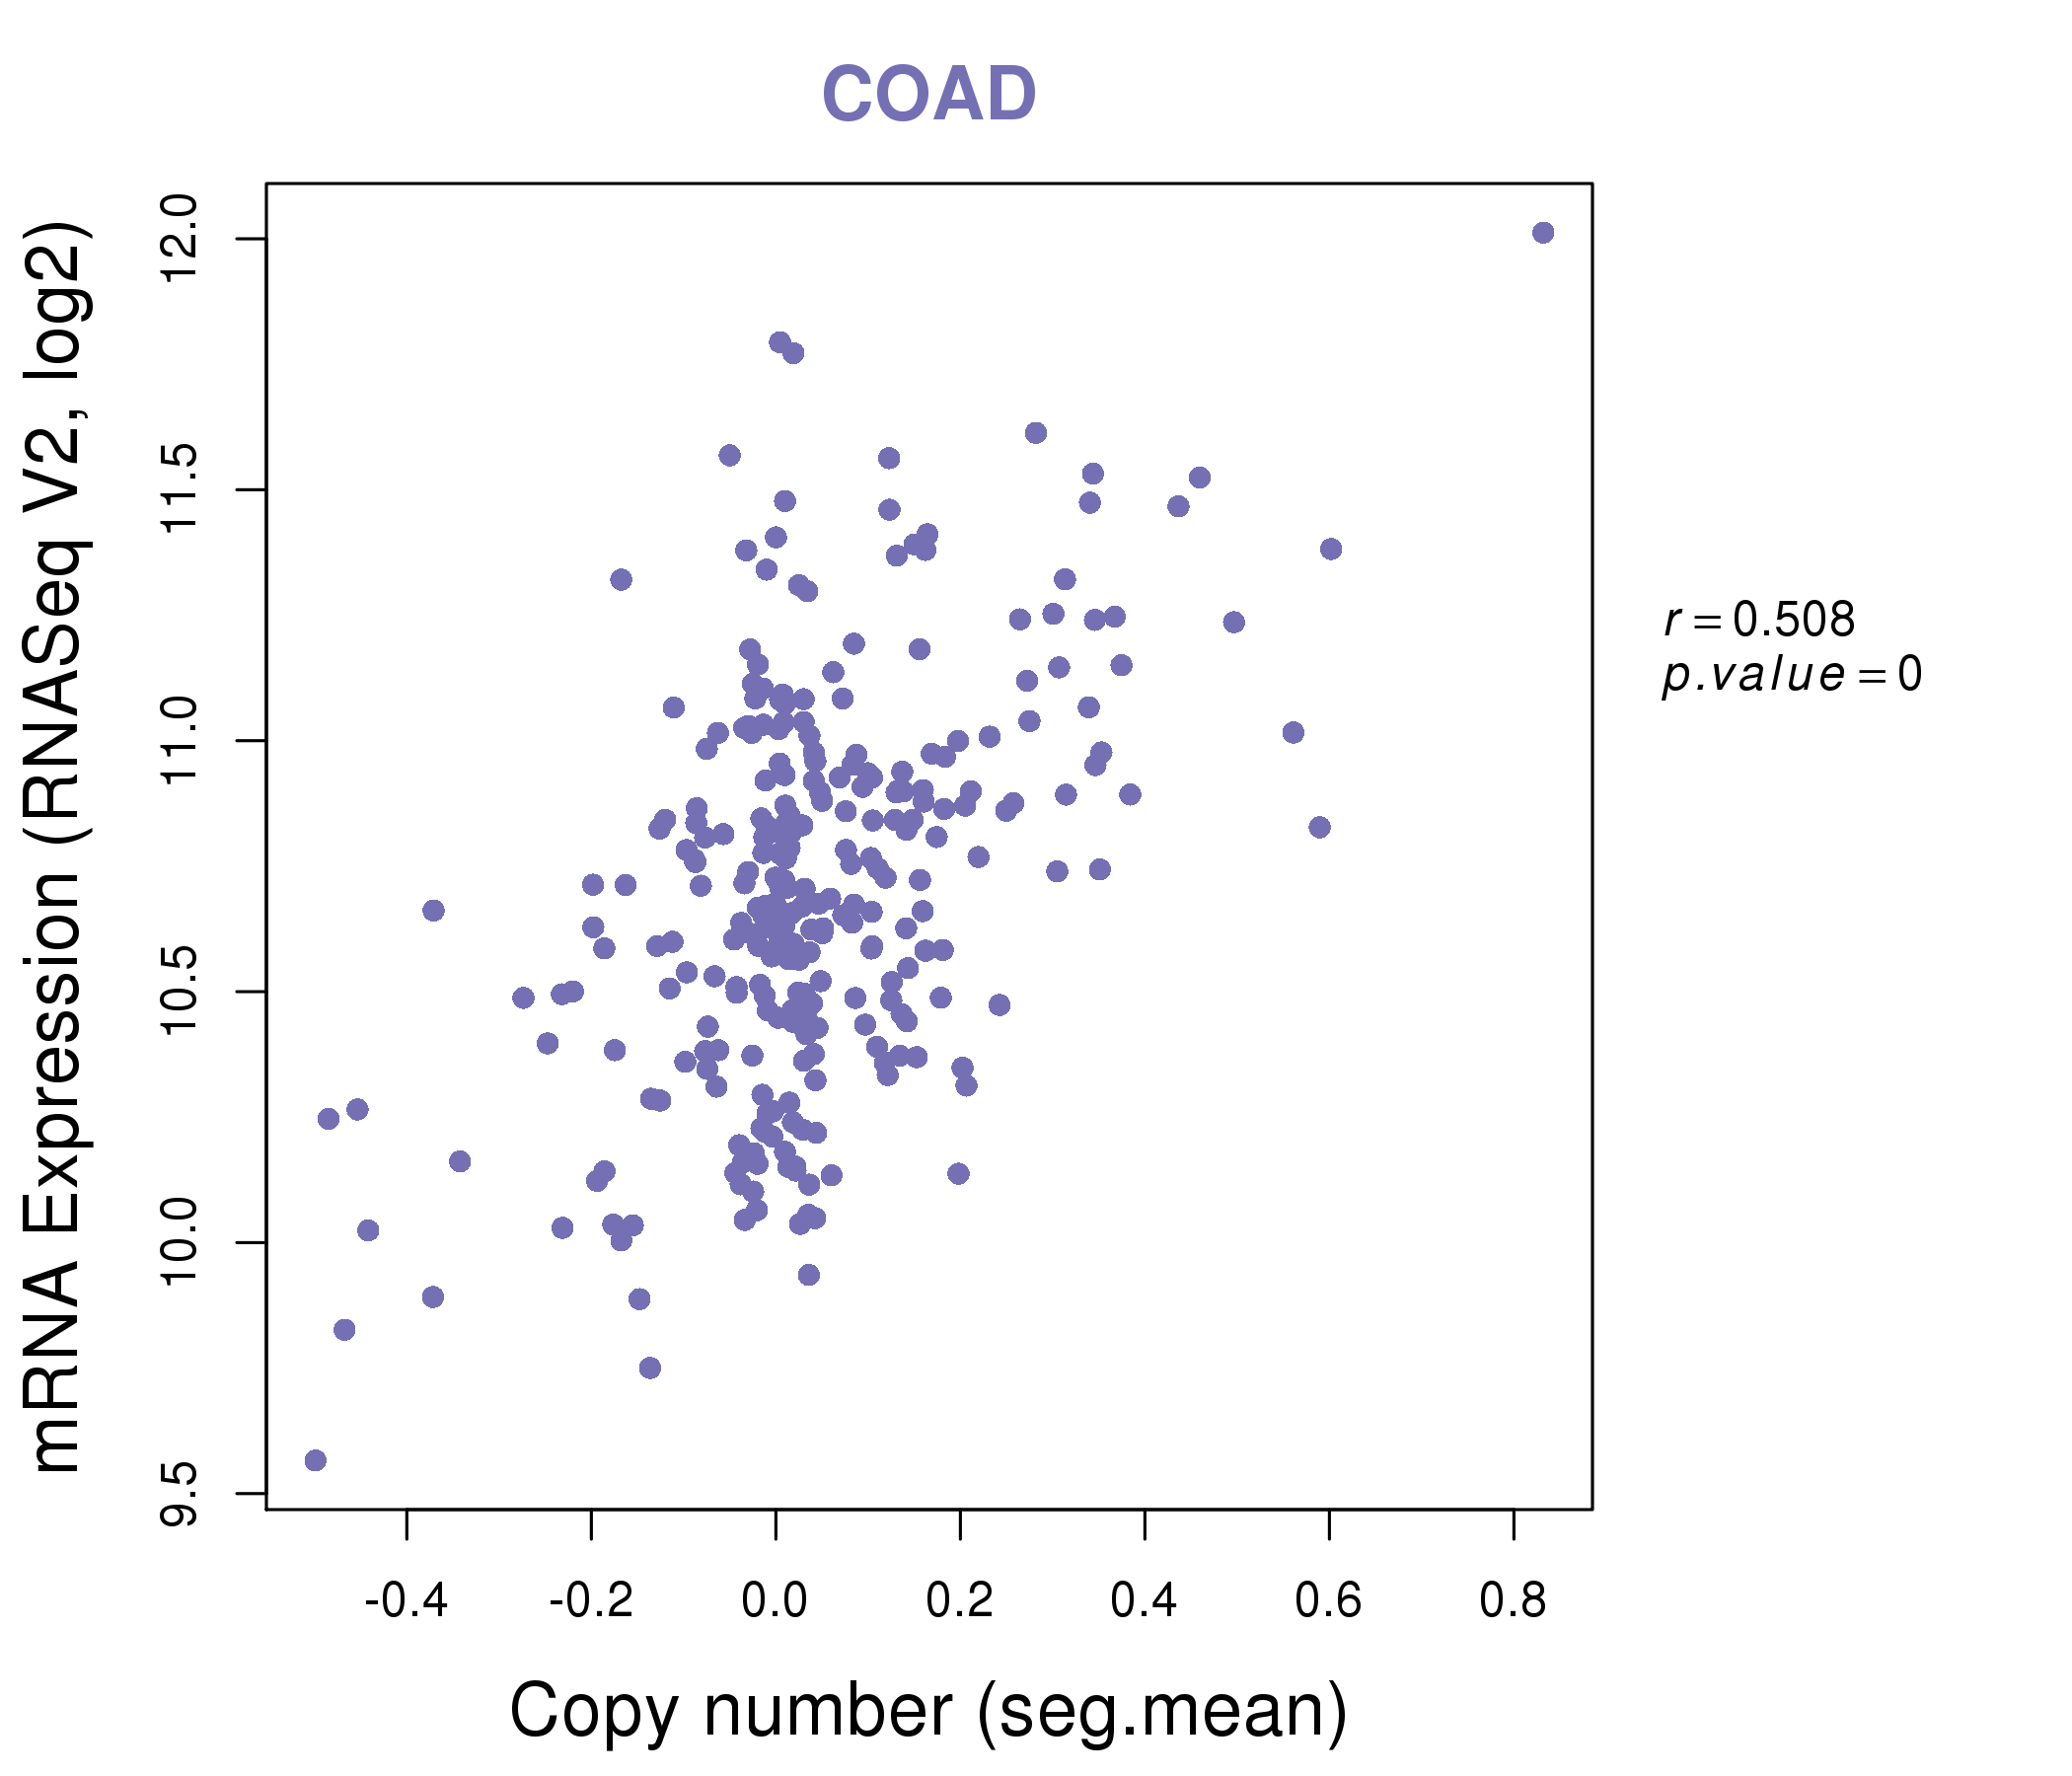
| * Copy number data were extracted from TCGA using R package TCGA-Assembler. The URLs of all public data files on TCGA DCC data server were gathered on Jan-05-2015. Function ProcessCNAData in TCGA-Assembler package was used to obtain gene-level copy number value which is calculated as the average copy number of the genomic region of a gene. |
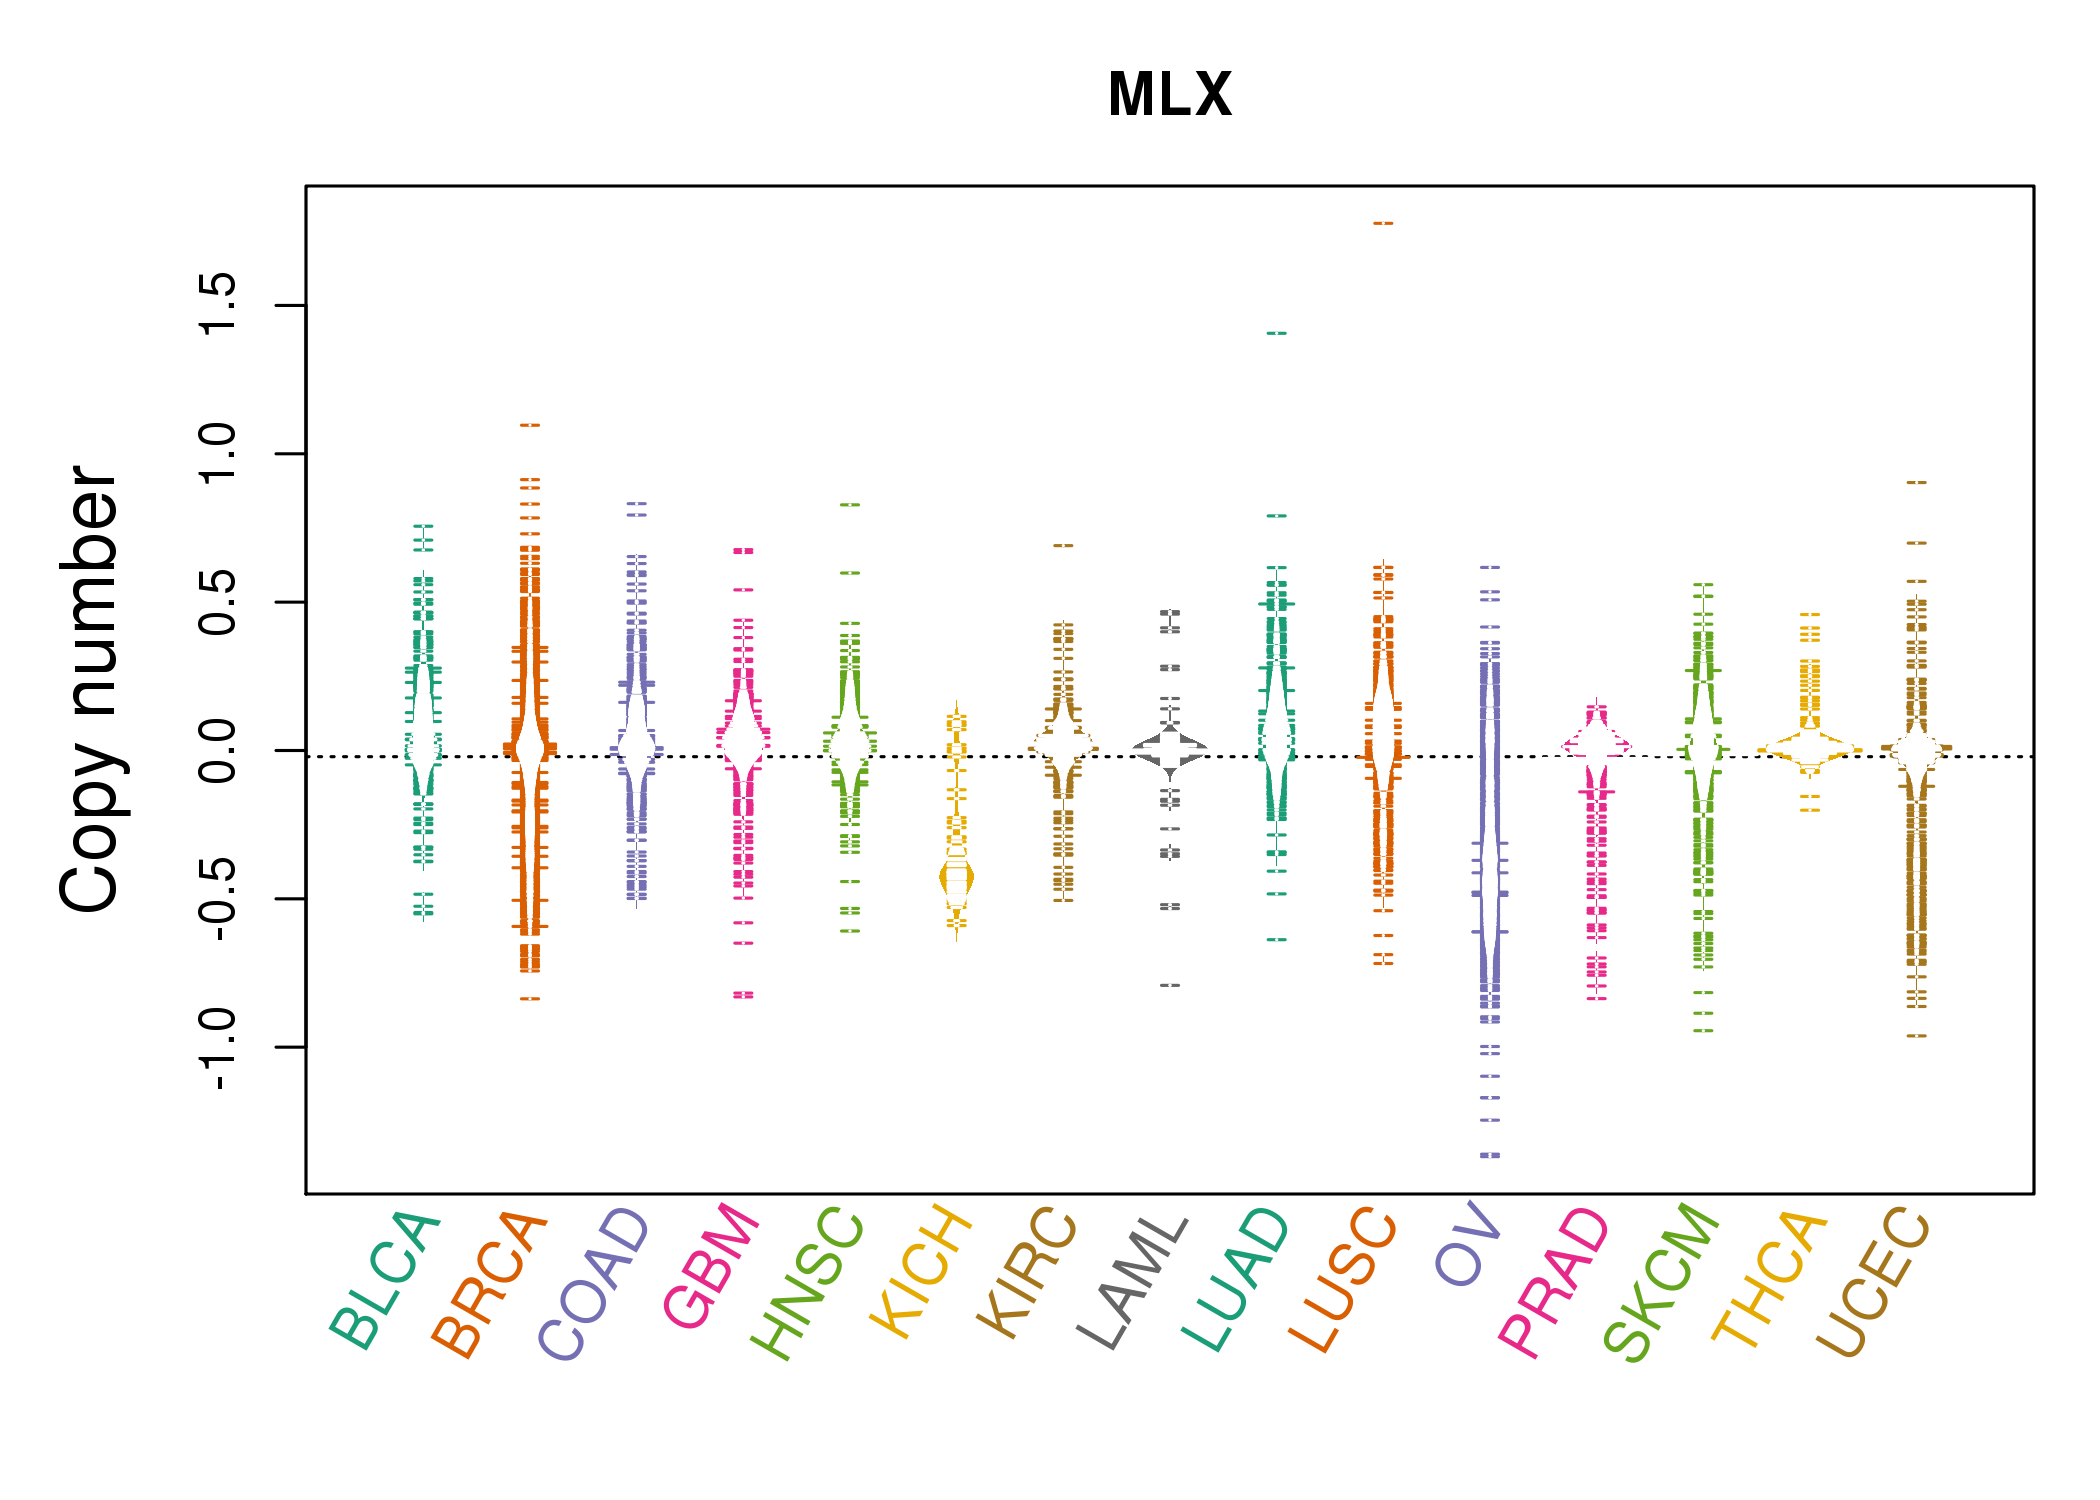 |
| cf) Tissue ID[Tissue type]: BLCA[Bladder Urothelial Carcinoma], BRCA[Breast invasive carcinoma], CESC[Cervical squamous cell carcinoma and endocervical adenocarcinoma], COAD[Colon adenocarcinoma], GBM[Glioblastoma multiforme], Glioma Low Grade, HNSC[Head and Neck squamous cell carcinoma], KICH[Kidney Chromophobe], KIRC[Kidney renal clear cell carcinoma], KIRP[Kidney renal papillary cell carcinoma], LAML[Acute Myeloid Leukemia], LUAD[Lung adenocarcinoma], LUSC[Lung squamous cell carcinoma], OV[Ovarian serous cystadenocarcinoma ], PAAD[Pancreatic adenocarcinoma], PRAD[Prostate adenocarcinoma], SKCM[Skin Cutaneous Melanoma], STAD[Stomach adenocarcinoma], THCA[Thyroid carcinoma], UCEC[Uterine Corpus Endometrial Carcinoma] |
| Top |
| Gene Expression for MLX |
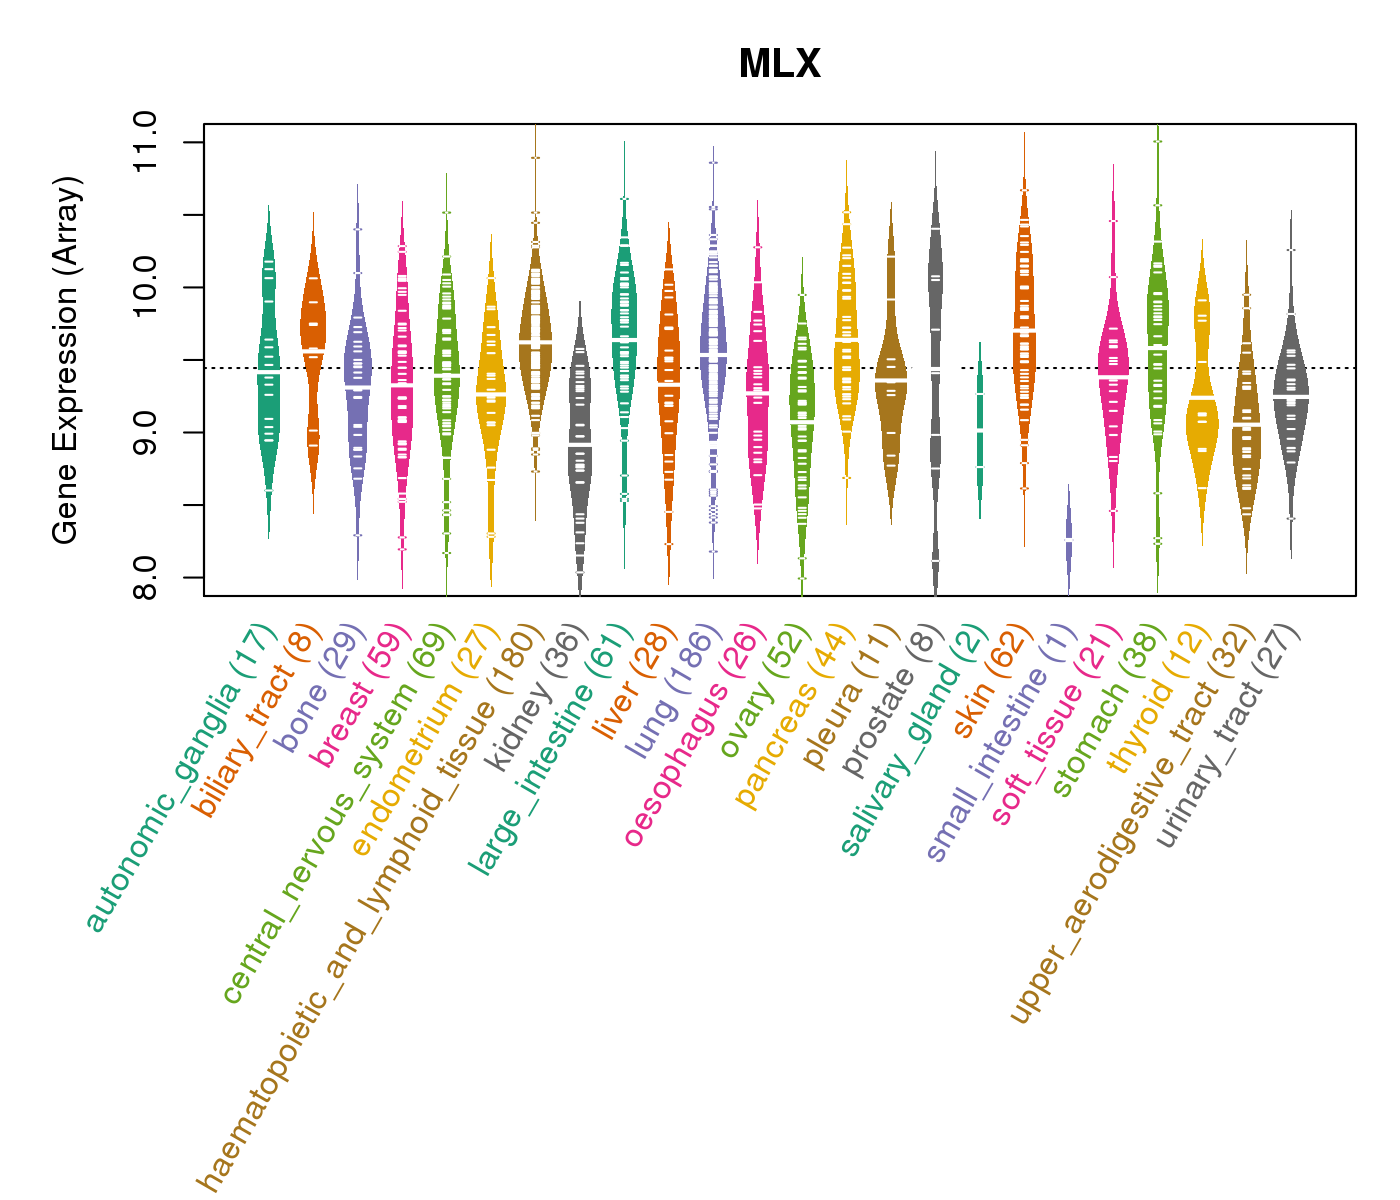
| * CCLE gene expression data were extracted from CCLE_Expression_Entrez_2012-10-18.res: Gene-centric RMA-normalized mRNA expression data. |
 |
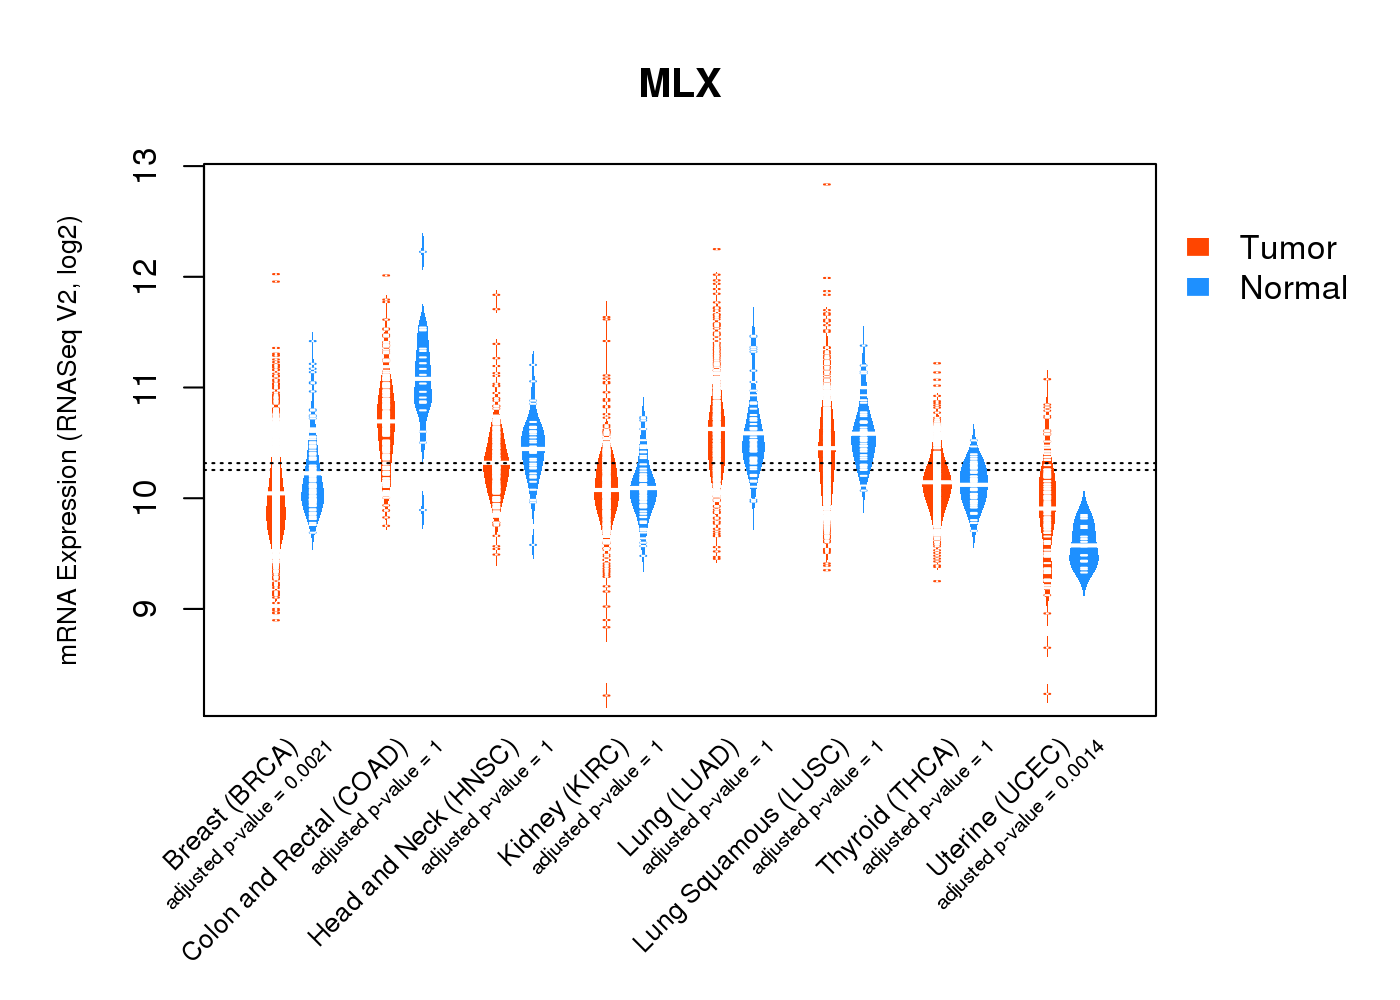
| * Normalized gene expression data of RNASeqV2 was extracted from TCGA using R package TCGA-Assembler. The URLs of all public data files on TCGA DCC data server were gathered at Jan-05-2015. Only eight cancer types have enough normal control samples for differential expression analysis. (t test, adjusted p<0.05 (using Benjamini-Hochberg FDR)) |
 |
| Top |
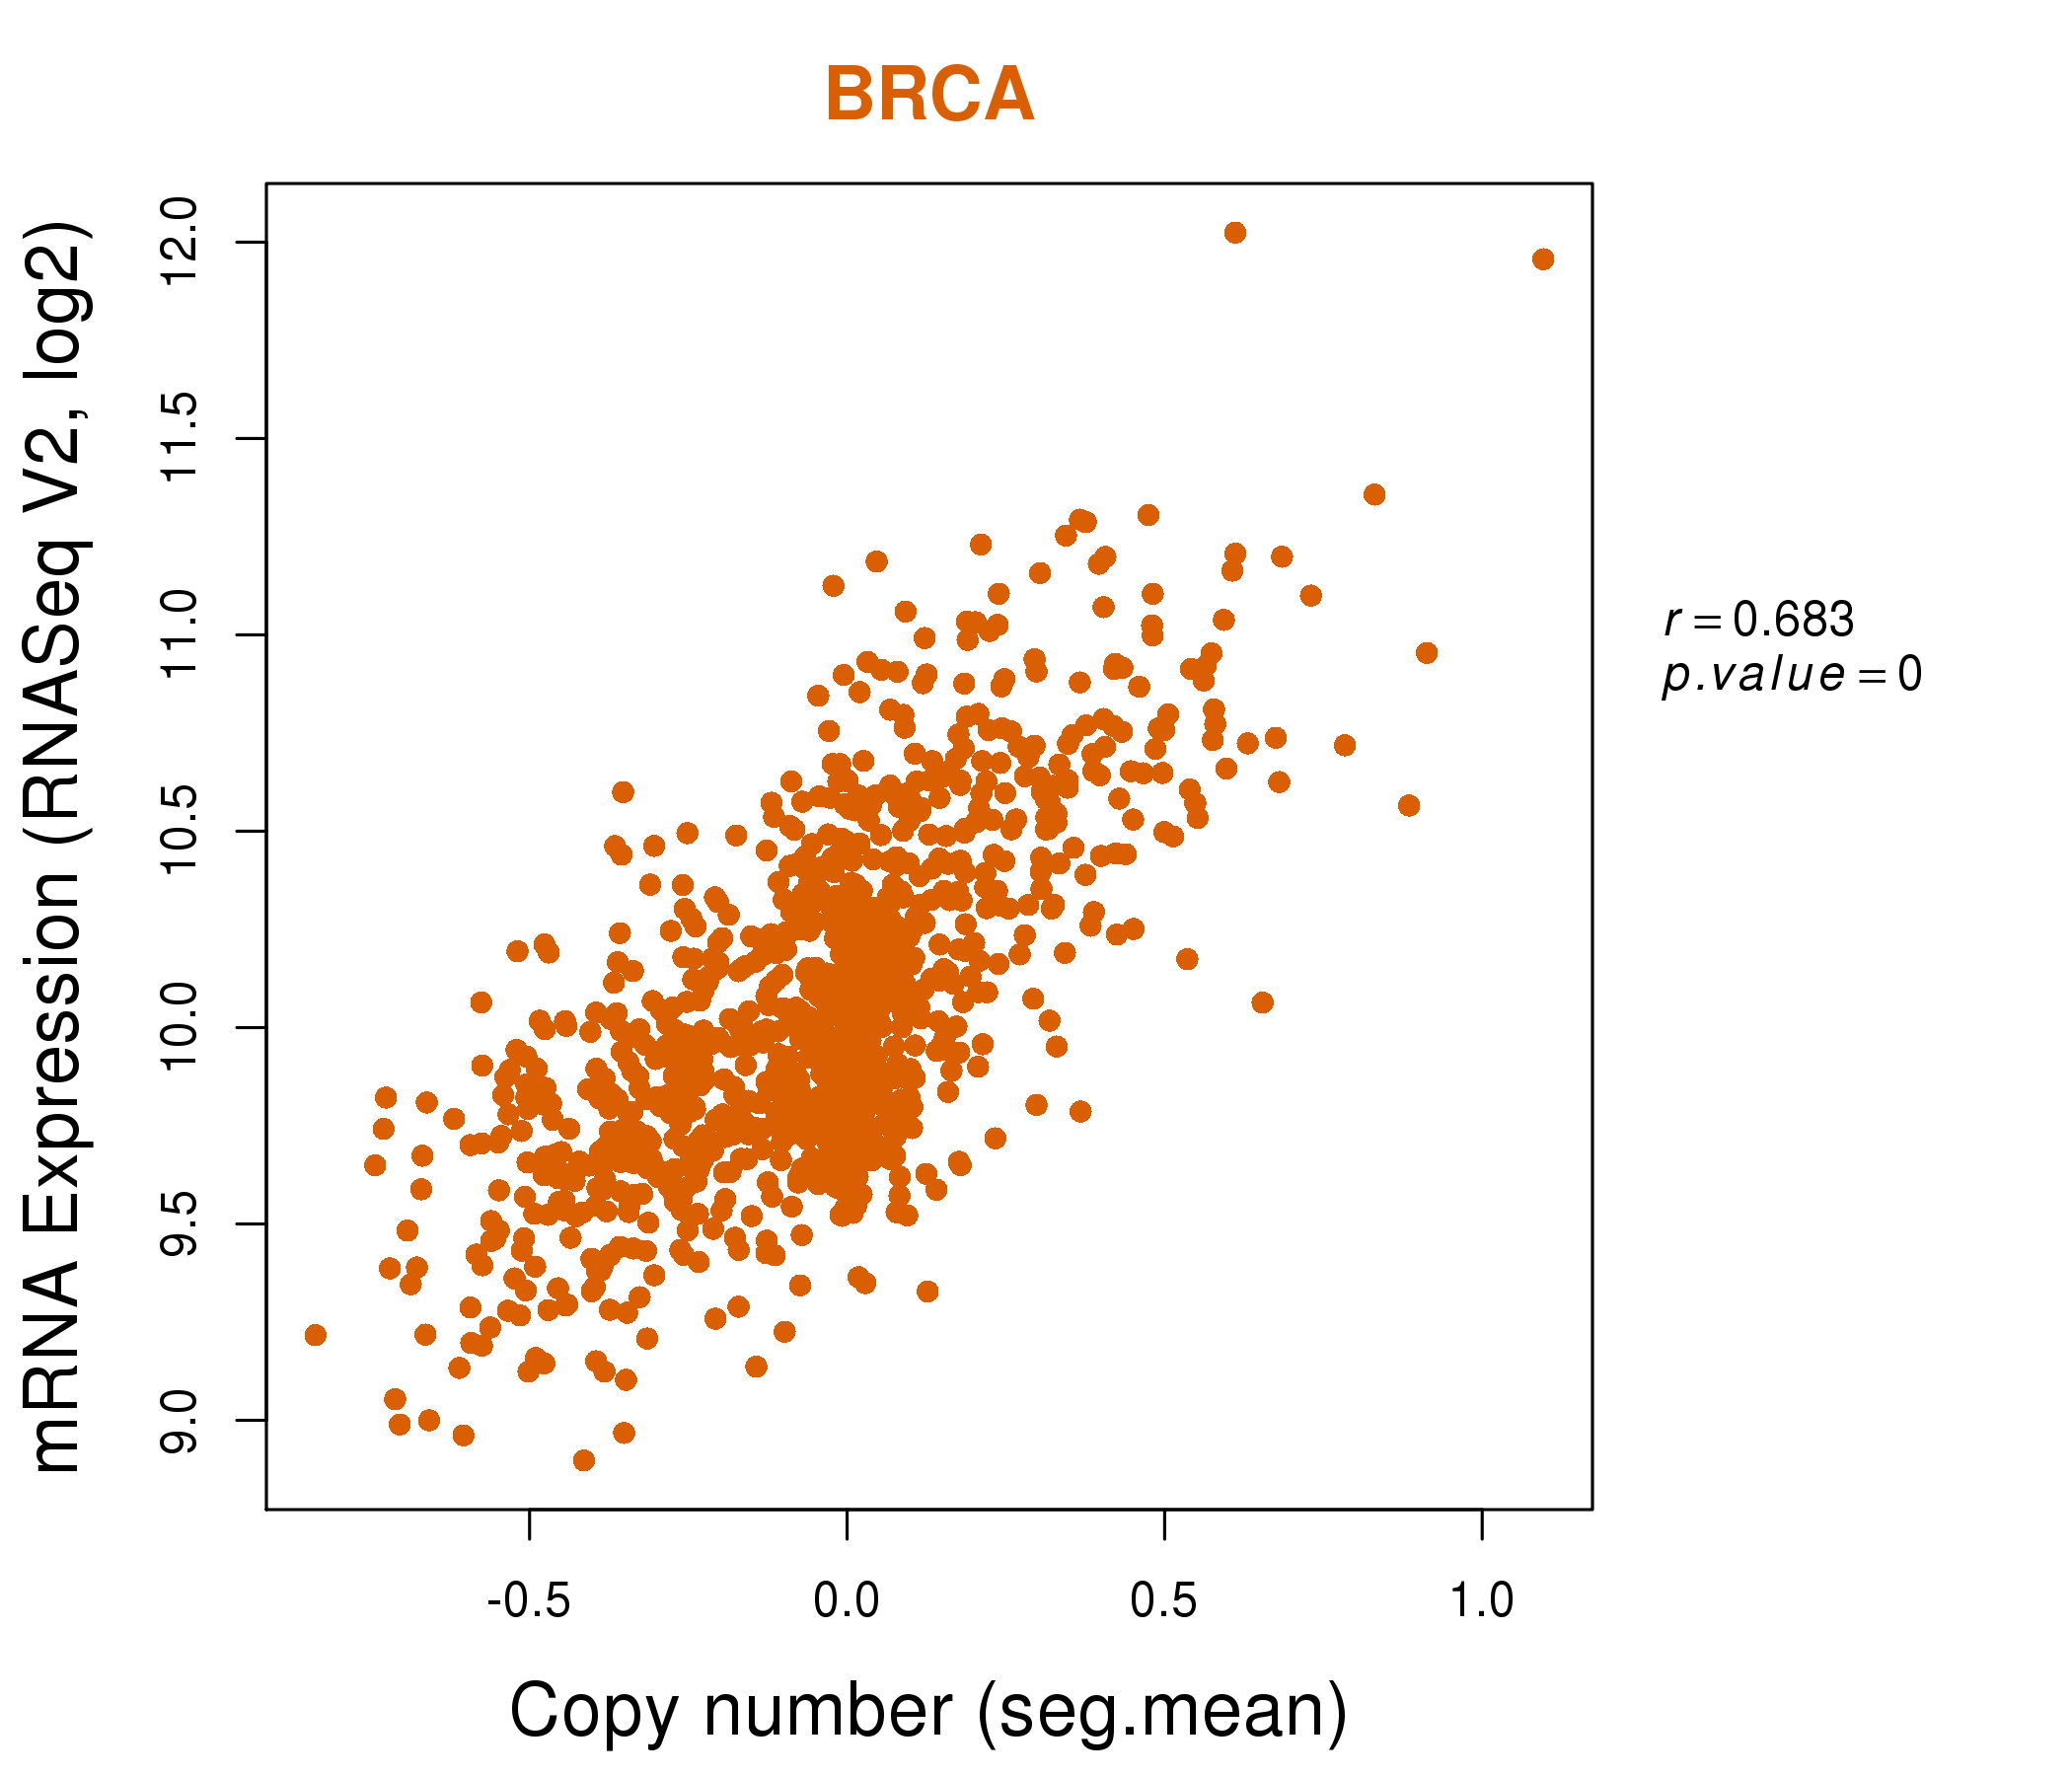
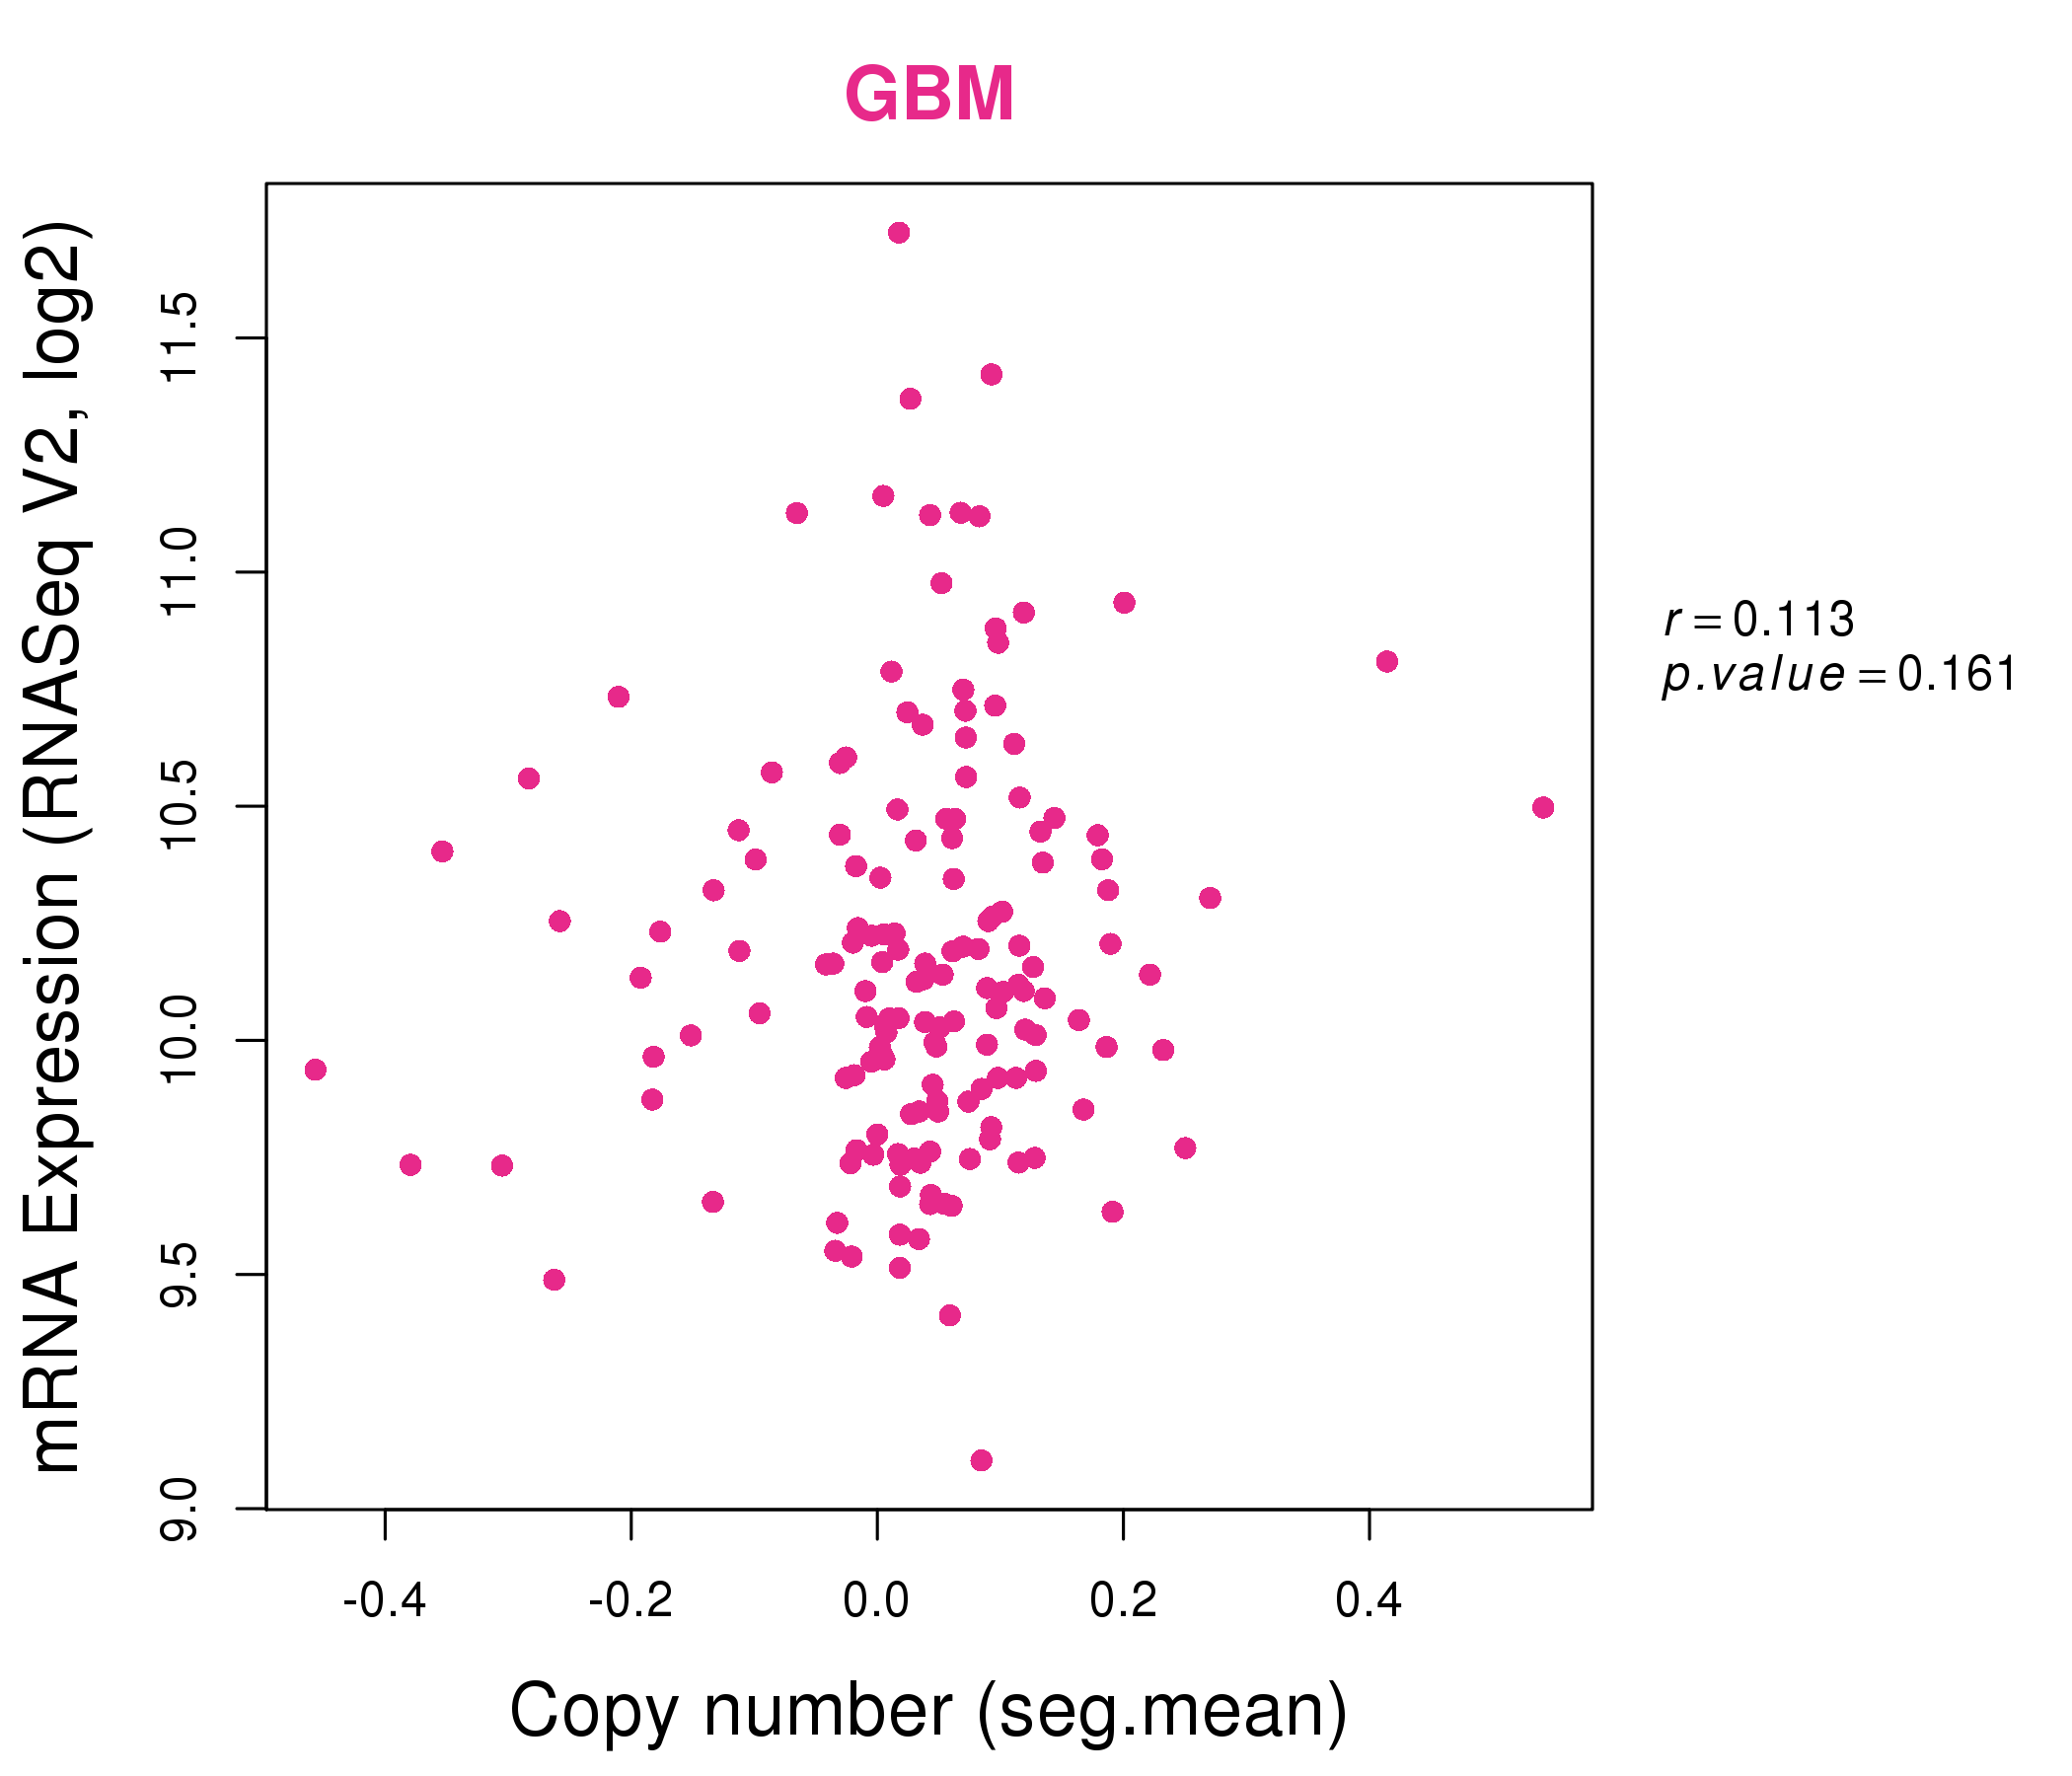
| * This plots show the correlation between CNV and gene expression. |
: Open all plots for all cancer types
 |
|
 |
|
| Top |
| Gene-Gene Network Information |
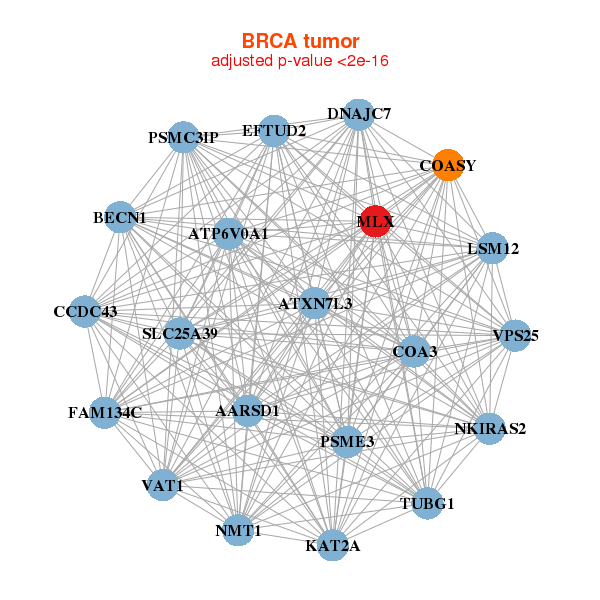
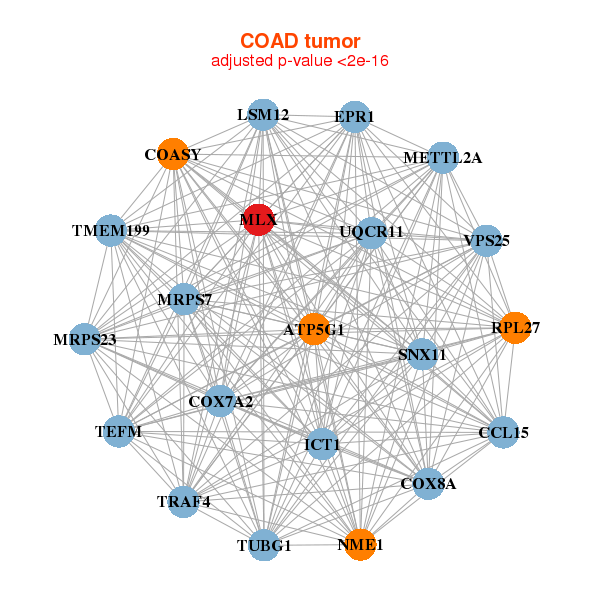
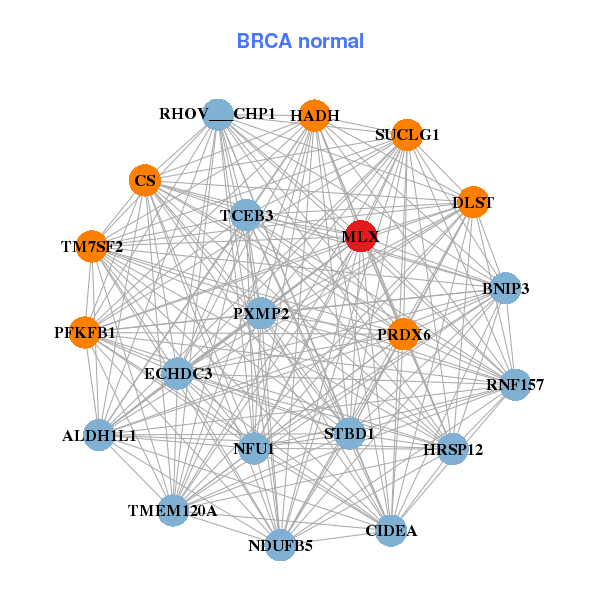
| * Co-Expression network figures were drawn using R package igraph. Only the top 20 genes with the highest correlations were shown. Red circle: input gene, orange circle: cell metabolism gene, sky circle: other gene |
: Open all plots for all cancer types
 |
|
| ADH1B,ADIPOQ,AQP7,AQP7P1,C14orf180,CIDEA,CIDEC, FRMD1,GPD1,HEPACAM,HSD17B13,KCNIP2,LIPE,LOC283392, MLXIPL,PLIN1,PLIN4,RDH5,SLC19A3,TMEM132C,TUSC5 | ABHD15,ACACB,AGPAT2,ALDH1L1,ANKRD53,AQP7,C14orf180, CIDEC,CNTFR,CSPG4,ECHDC3,FGFRL1,LGALS12,MLXIPL, ORMDL3,PC,PECR,PLA2G16,PNPLA2,SHMT1,TMEM132C |
 |
|
| ADCK5,BRAT1,DMTF1,DICER1-AS1,GIGYF1,LOC349114,LTB4R, MLXIPL,MSH5,NSUN5P1,NSUN5P2,OGT,PABPC1L,PILRB, PRKRIP1,SLC12A9,STX16,TAZ,ZMIZ2,ZNF335,ZNF3 | ABCC2,CCDC108,CREB3L3,CYP3A4,DNASE1,GPR112,GRAMD1B, GSTA1,KCNH6,KCNJ3,MLXIPL,MME,MRO,NR0B2, PLB1,PRODH,RBP3,REEP6,SI,SLC13A1,ZNF488 |
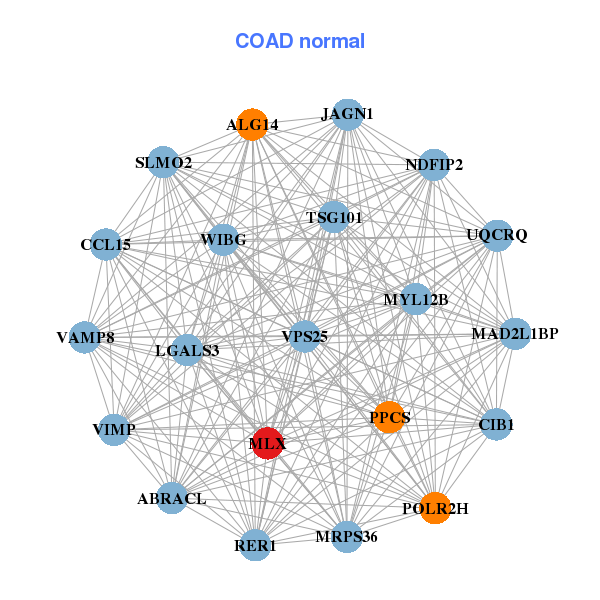
| * Co-Expression network figures were drawn using R package igraph. Only the top 20 genes with the highest correlations were shown. Red circle: input gene, orange circle: cell metabolism gene, sky circle: other gene |
: Open all plots for all cancer types
| Top |
: Open all interacting genes' information including KEGG pathway for all interacting genes from DAVID
| Top |
| Pharmacological Information for MLX |
| There's no related Drug. |
| Top |
| Cross referenced IDs for MLX |
| * We obtained these cross-references from Uniprot database. It covers 150 different DBs, 18 categories. http://www.uniprot.org/help/cross_references_section |
: Open all cross reference information
|
Copyright © 2016-Present - The Univsersity of Texas Health Science Center at Houston @ |