|
||||||||||||||||||||||||||||||||||||||||||||||||||||||||||||||||||||||||||||||||||||||||||||||||||||||||||||||||||||||||||||||||||||||||||||||||||||||||||||||||||||||||||||||||||||||||||||||||||||||||||||||||||||||||||||||||||||||||||||||||||||||||||||||||||||||||||||||||||||||||||||||||||||||||||||||||||||||||||
| |
| Phenotypic Information (metabolism pathway, cancer, disease, phenome) |
| |
| |
| Gene-Gene Network Information: Co-Expression Network, Interacting Genes & KEGG |
| |
|


| Gene Summary for TEAD1 |
| Top |
| Phenotypic Information for TEAD1(metabolism pathway, cancer, disease, phenome) |
| Cancer | CGAP: TEAD1 |
| Familial Cancer Database: TEAD1 | |
| * This gene is included in those cancer gene databases. |
|
|
|
|
|
| . | ||||||||||||||||||||||||||||||||||||||||||||||||||||||||||||||||||||||||||||||||||||||||||||||||||||||||||||||||||||||||||||||||||||||||||||||||||||||||||||||||||||||||||||||||||||||||||||||||||||||||||||||||||||||||||||||||||||||||||||||||||||||||||||||||||||||||||||||||||||||||||||||||||||||||||||||||||||
Oncogene 1 | Significant driver gene in | |||||||||||||||||||||||||||||||||||||||||||||||||||||||||||||||||||||||||||||||||||||||||||||||||||||||||||||||||||||||||||||||||||||||||||||||||||||||||||||||||||||||||||||||||||||||||||||||||||||||||||||||||||||||||||||||||||||||||||||||||||||||||||||||||||||||||||||||||||||||||||||||||||||||||||||||||||||||||
| cf) number; DB name 1 Oncogene; http://nar.oxfordjournals.org/content/35/suppl_1/D721.long, 2 Tumor Suppressor gene; https://bioinfo.uth.edu/TSGene/, 3 Cancer Gene Census; http://www.nature.com/nrc/journal/v4/n3/abs/nrc1299.html, 4 CancerGenes; http://nar.oxfordjournals.org/content/35/suppl_1/D721.long, 5 Network of Cancer Gene; http://ncg.kcl.ac.uk/index.php, 1Therapeutic Vulnerabilities in Cancer; http://cbio.mskcc.org/cancergenomics/statius/ |
| REACTOME_METABOLISM_OF_LIPIDS_AND_LIPOPROTEINS | |
| OMIM | |
| Orphanet | |
| Disease | KEGG Disease: TEAD1 |
| MedGen: TEAD1 (Human Medical Genetics with Condition) | |
| ClinVar: TEAD1 | |
| Phenotype | MGI: TEAD1 (International Mouse Phenotyping Consortium) |
| PhenomicDB: TEAD1 | |
| Mutations for TEAD1 |
| * Under tables are showing count per each tissue to give us broad intuition about tissue specific mutation patterns.You can go to the detailed page for each mutation database's web site. |
| - Statistics for Tissue and Mutation type | Top |
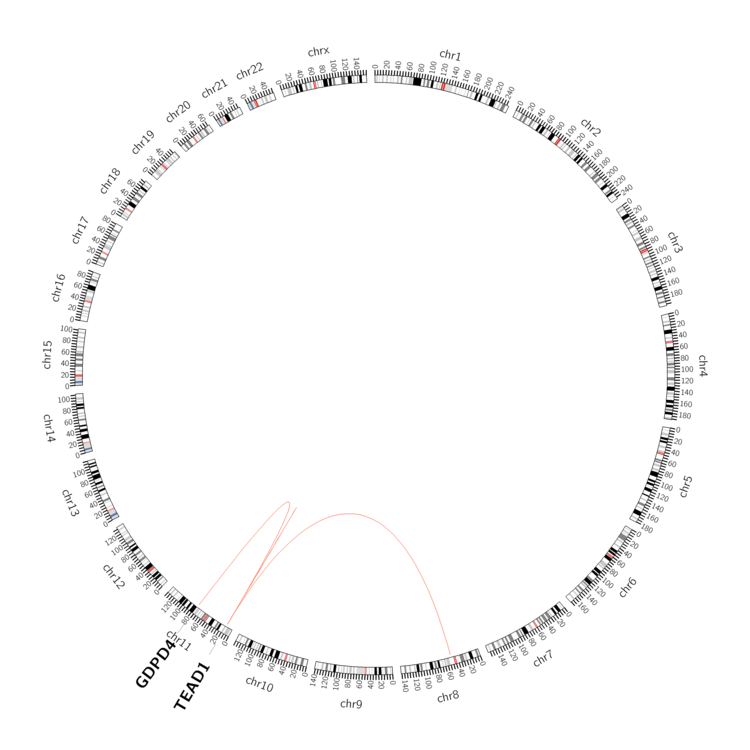 |
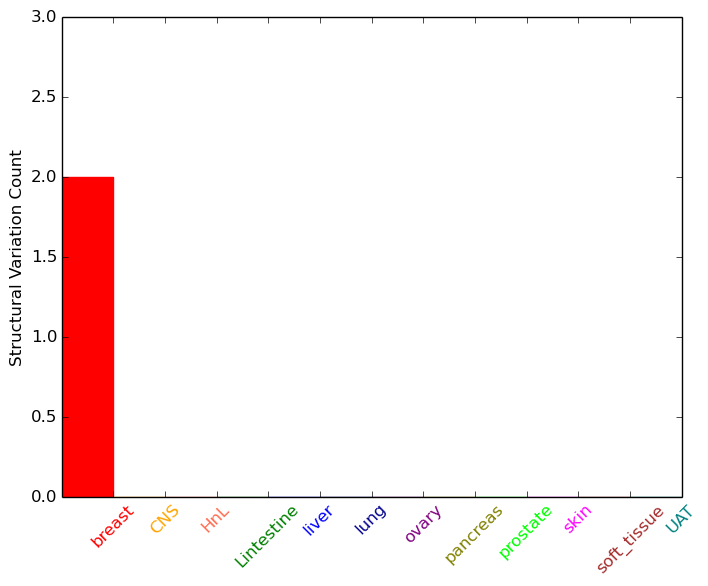
| - For Inter-chromosomal Variations |
| * Inter-chromosomal variantions includes 'interchromosomal amplicon to amplicon', 'interchromosomal amplicon to non-amplified dna', 'interchromosomal insertion', 'Interchromosomal unknown type'. |
 |
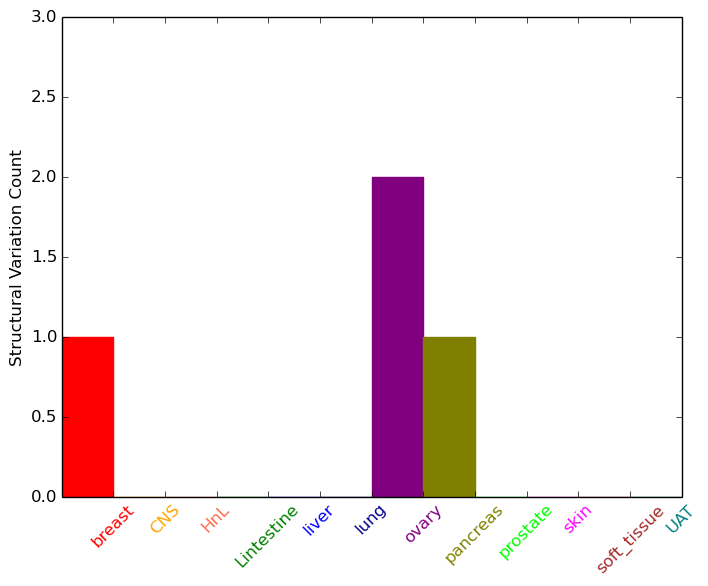
| - For Intra-chromosomal Variations |
| * Intra-chromosomal variantions includes 'intrachromosomal amplicon to amplicon', 'intrachromosomal amplicon to non-amplified dna', 'intrachromosomal deletion', 'intrachromosomal fold-back inversion', 'intrachromosomal inversion', 'intrachromosomal tandem duplication', 'Intrachromosomal unknown type', 'intrachromosomal with inverted orientation', 'intrachromosomal with non-inverted orientation'. |
 |
| Sample | Symbol_a | Chr_a | Start_a | End_a | Symbol_b | Chr_b | Start_b | End_b |
| breast | TEAD1 | chr11 | 12741296 | 12741296 | TEAD1 | chr11 | 12841126 | 12841126 |
| ovary | TEAD1 | chr11 | 12738782 | 12738802 | TEAD1 | chr11 | 12738862 | 12738882 |
| ovary | TEAD1 | chr11 | 12774223 | 12774243 | GDPD4 | chr11 | 76929957 | 76929977 |
| pancreas | TEAD1 | chr11 | 12945288 | 12945308 | TEAD1 | chr11 | 12948203 | 12948223 |
| cf) Tissue number; Tissue name (1;Breast, 2;Central_nervous_system, 3;Haematopoietic_and_lymphoid_tissue, 4;Large_intestine, 5;Liver, 6;Lung, 7;Ovary, 8;Pancreas, 9;Prostate, 10;Skin, 11;Soft_tissue, 12;Upper_aerodigestive_tract) |
| * From mRNA Sanger sequences, Chitars2.0 arranged chimeric transcripts. This table shows TEAD1 related fusion information. |
| ID | Head Gene | Tail Gene | Accession | Gene_a | qStart_a | qEnd_a | Chromosome_a | tStart_a | tEnd_a | Gene_a | qStart_a | qEnd_a | Chromosome_a | tStart_a | tEnd_a |
| BF753132 | TEAD1 | 14 | 128 | 11 | 12960559 | 12960678 | WDR41 | 125 | 240 | 5 | 76733290 | 76733405 | |
| AI126955 | SEMA6A | 1 | 172 | 5 | 115781820 | 115781995 | TEAD1 | 173 | 507 | 11 | 12696339 | 12883832 | |
| BF990638 | C9 | 70 | 93 | 5 | 39301378 | 39301401 | TEAD1 | 76 | 476 | 11 | 12961391 | 12961792 | |
| BF353523 | TEAD1 | 13 | 240 | 11 | 12799041 | 12799268 | TEAD1 | 235 | 389 | 11 | 12798919 | 12799073 | |
| Top |
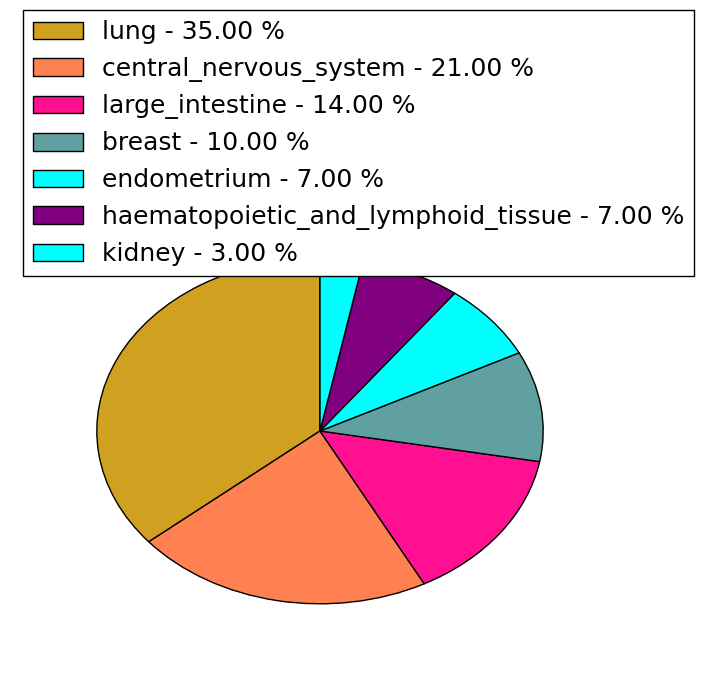
| Mutation type/ Tissue ID | brca | cns | cerv | endome | haematopo | kidn | Lintest | liver | lung | ns | ovary | pancre | prost | skin | stoma | thyro | urina | |||
| Total # sample | 4 | 1 | 2 | 1 | 1 | |||||||||||||||
| GAIN (# sample) | 3 | 2 | ||||||||||||||||||
| LOSS (# sample) | 1 | 1 | 1 | 1 |
| cf) Tissue ID; Tissue type (1; Breast, 2; Central_nervous_system, 3; Cervix, 4; Endometrium, 5; Haematopoietic_and_lymphoid_tissue, 6; Kidney, 7; Large_intestine, 8; Liver, 9; Lung, 10; NS, 11; Ovary, 12; Pancreas, 13; Prostate, 14; Skin, 15; Stomach, 16; Thyroid, 17; Urinary_tract) |
| Top |
|
 |
| Top |
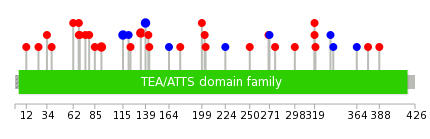
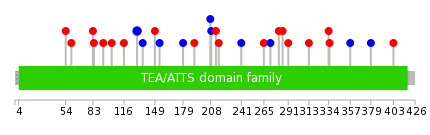
| Stat. for Non-Synonymous SNVs (# total SNVs=28) | (# total SNVs=7) |
 |  |
(# total SNVs=0) | (# total SNVs=0) |
| Top |
| * When you move the cursor on each content, you can see more deailed mutation information on the Tooltip. Those are primary_site,primary_histology,mutation(aa),pubmedID. |
| GRCh37 position | Mutation(aa) | Unique sampleID count |
| chr11:12946585-12946585 | p.V319L | 2 |
| chr11:12886437-12886437 | p.S92C | 2 |
| chr11:12901314-12901314 | p.I115I | 2 |
| chr11:12901370-12901370 | p.T134I | 2 |
| chr11:12901386-12901386 | p.P139P | 2 |
| chr11:12946524-12946524 | p.E298D | 1 |
| chr11:12785909-12785909 | p.Q29* | 1 |
| chr11:12886416-12886416 | p.R85K | 1 |
| chr11:12903501-12903501 | p.P176S | 1 |
| chr11:12785924-12785924 | p.I34V | 1 |
| Top |
|
 |
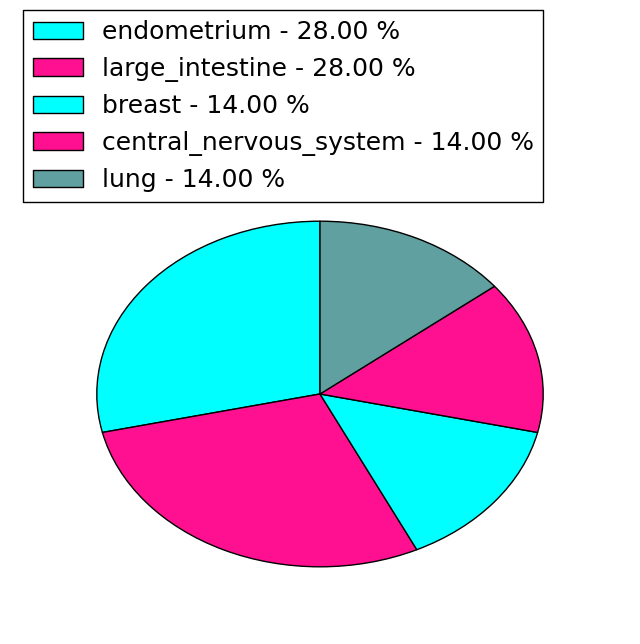
| Point Mutation/ Tissue ID | 1 | 2 | 3 | 4 | 5 | 6 | 7 | 8 | 9 | 10 | 11 | 12 | 13 | 14 | 15 | 16 | 17 | 18 | 19 | 20 |
| # sample | 2 | 1 | 4 | 2 | 2 | 4 | 1 | 1 | 2 | 3 | 4 | |||||||||
| # mutation | 2 | 1 | 4 | 2 | 2 | 4 | 1 | 1 | 2 | 3 | 4 | |||||||||
| nonsynonymous SNV | 1 | 1 | 3 | 2 | 2 | 3 | 1 | 1 | 1 | 1 | 2 | |||||||||
| synonymous SNV | 1 | 1 | 1 | 1 | 2 | 2 |
| cf) Tissue ID; Tissue type (1; BLCA[Bladder Urothelial Carcinoma], 2; BRCA[Breast invasive carcinoma], 3; CESC[Cervical squamous cell carcinoma and endocervical adenocarcinoma], 4; COAD[Colon adenocarcinoma], 5; GBM[Glioblastoma multiforme], 6; Glioma Low Grade, 7; HNSC[Head and Neck squamous cell carcinoma], 8; KICH[Kidney Chromophobe], 9; KIRC[Kidney renal clear cell carcinoma], 10; KIRP[Kidney renal papillary cell carcinoma], 11; LAML[Acute Myeloid Leukemia], 12; LUAD[Lung adenocarcinoma], 13; LUSC[Lung squamous cell carcinoma], 14; OV[Ovarian serous cystadenocarcinoma ], 15; PAAD[Pancreatic adenocarcinoma], 16; PRAD[Prostate adenocarcinoma], 17; SKCM[Skin Cutaneous Melanoma], 18:STAD[Stomach adenocarcinoma], 19:THCA[Thyroid carcinoma], 20:UCEC[Uterine Corpus Endometrial Carcinoma]) |
| Top |
| * We represented just top 10 SNVs. When you move the cursor on each content, you can see more deailed mutation information on the Tooltip. Those are primary_site, primary_histology, mutation(aa), pubmedID. |
| Genomic Position | Mutation(aa) | Unique sampleID count |
| chr11:12901314 | p.I130I | 2 |
| chr11:12883843 | p.I94V | 1 |
| chr11:12904597 | p.P281H | 1 |
| chr11:12946585 | p.R103C | 1 |
| chr11:12883845 | p.F285L | 1 |
| chr11:12904600 | p.D116Y | 1 |
| chr11:12946588 | p.W291L | 1 |
| chr11:12886397 | p.E313D | 1 |
| chr11:12904613 | p.V334I | 1 |
| chr11:12951777 | p.I136I | 1 |
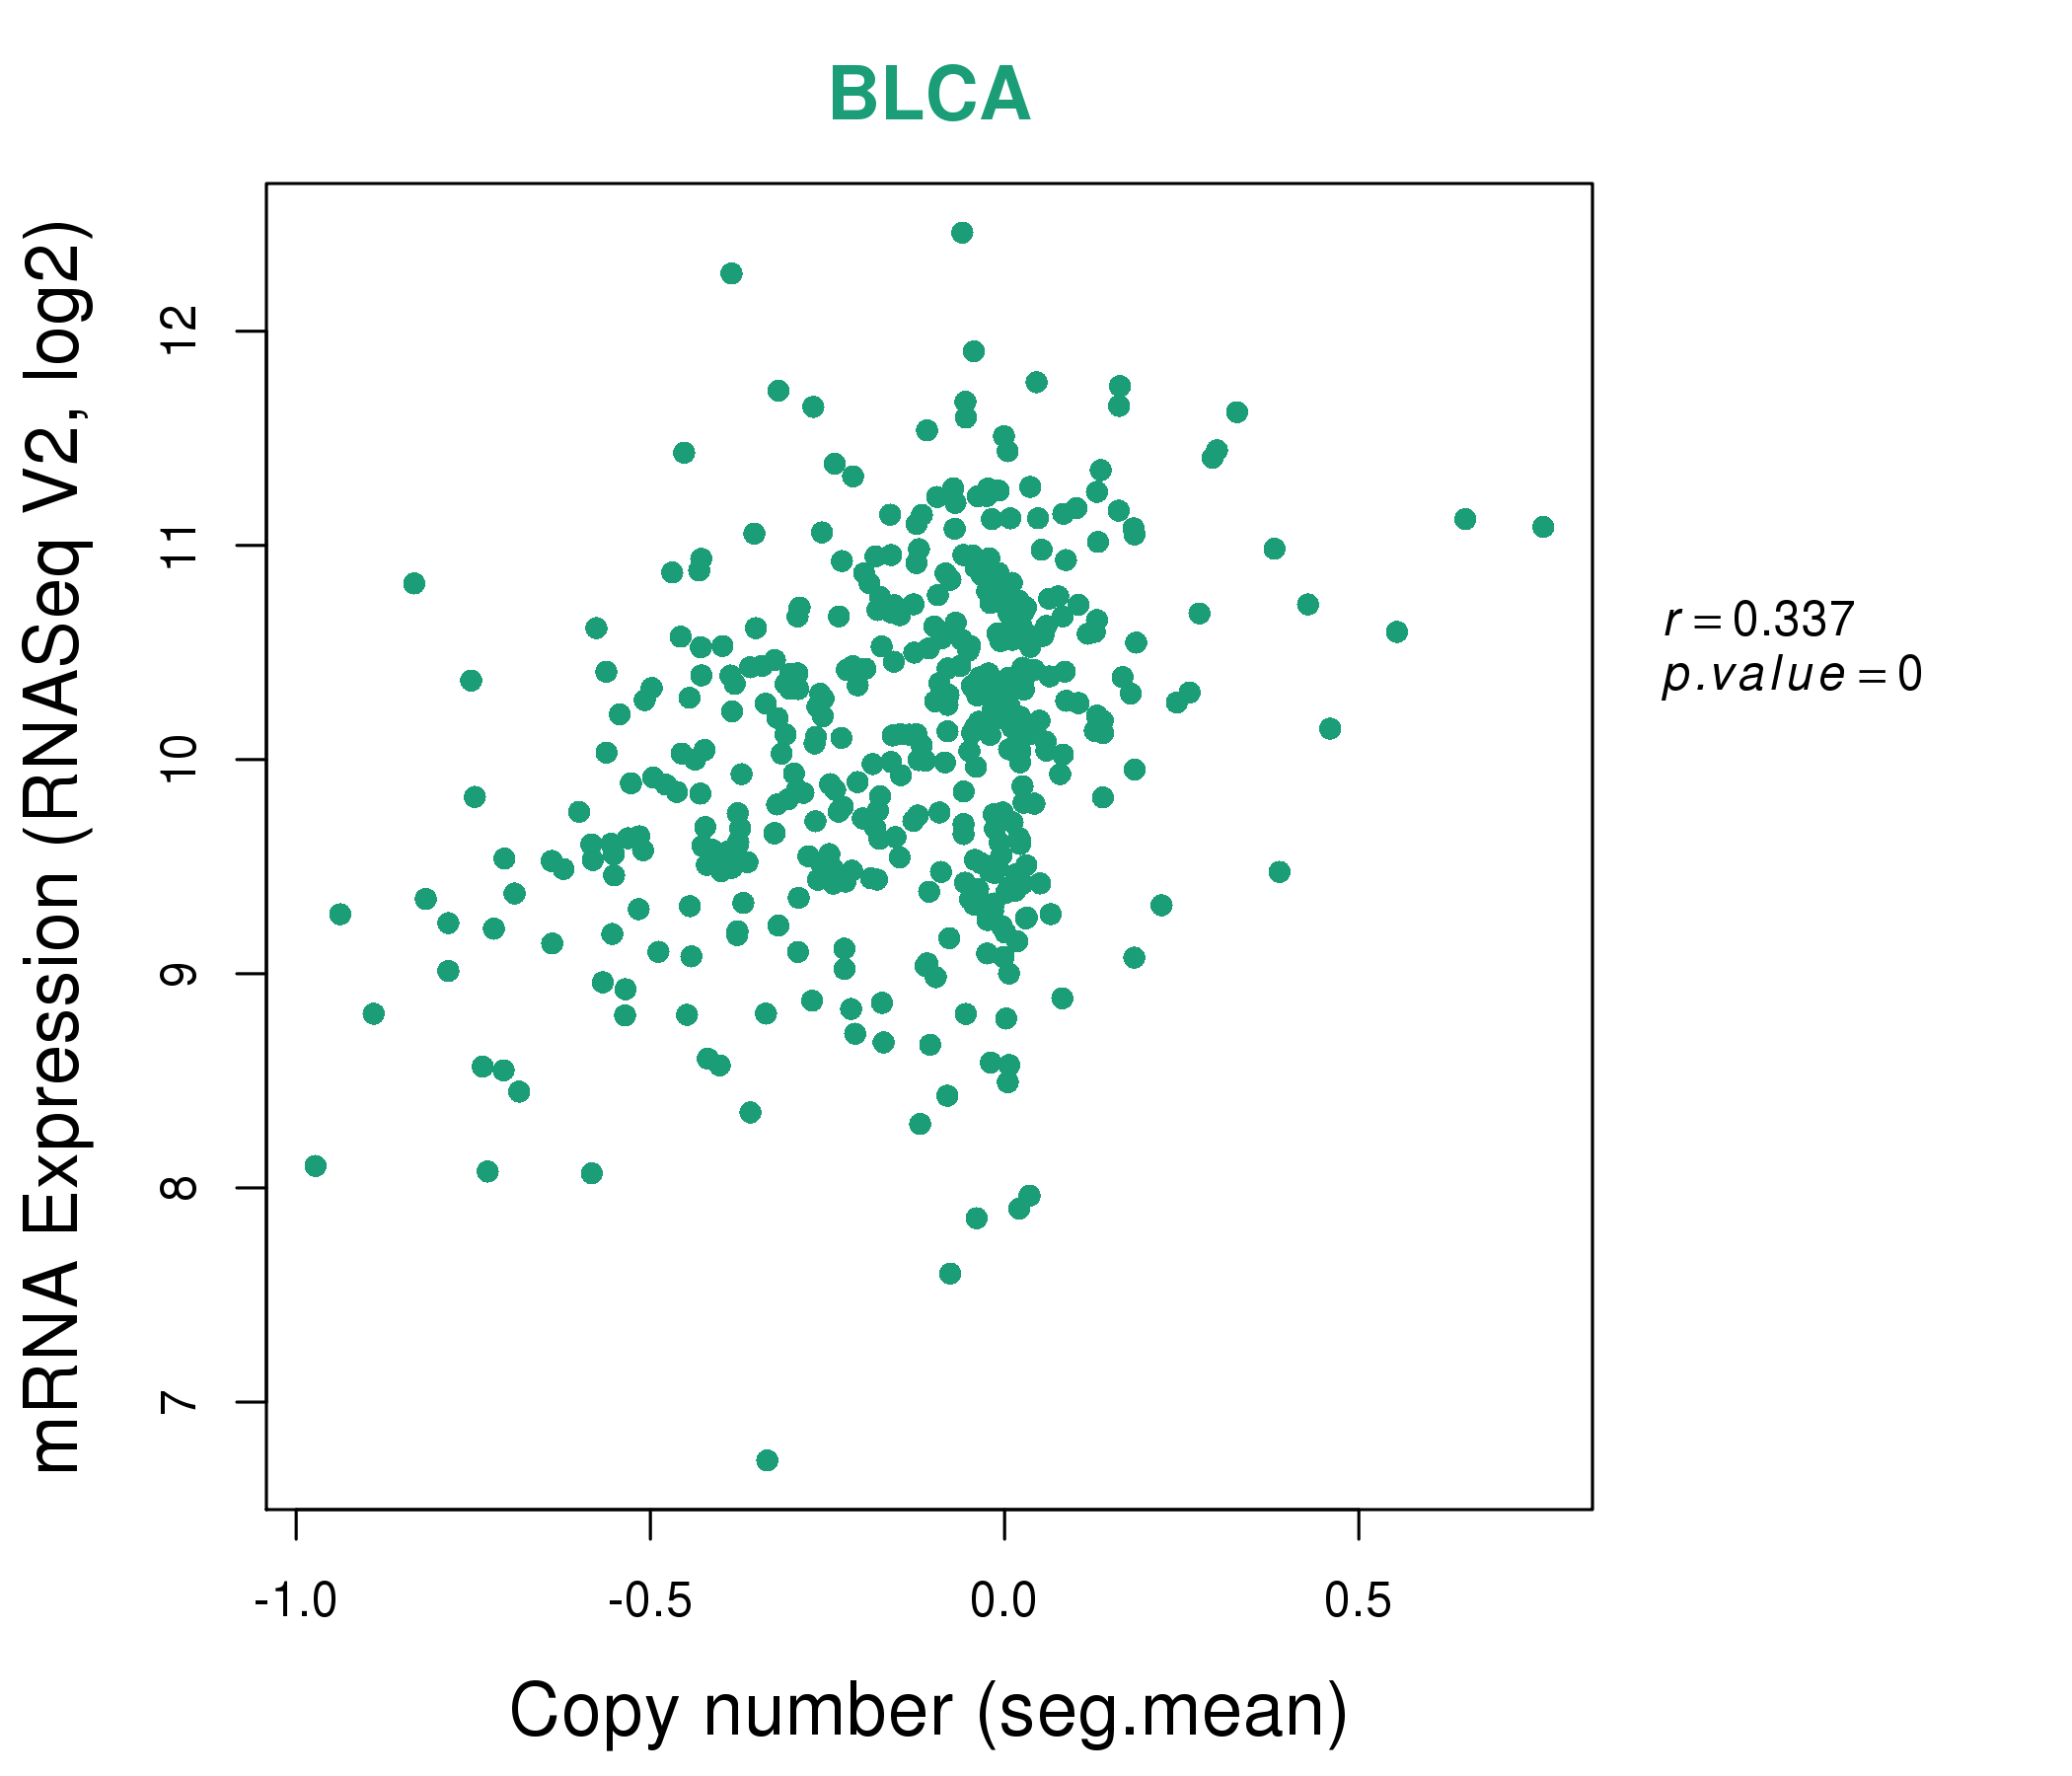
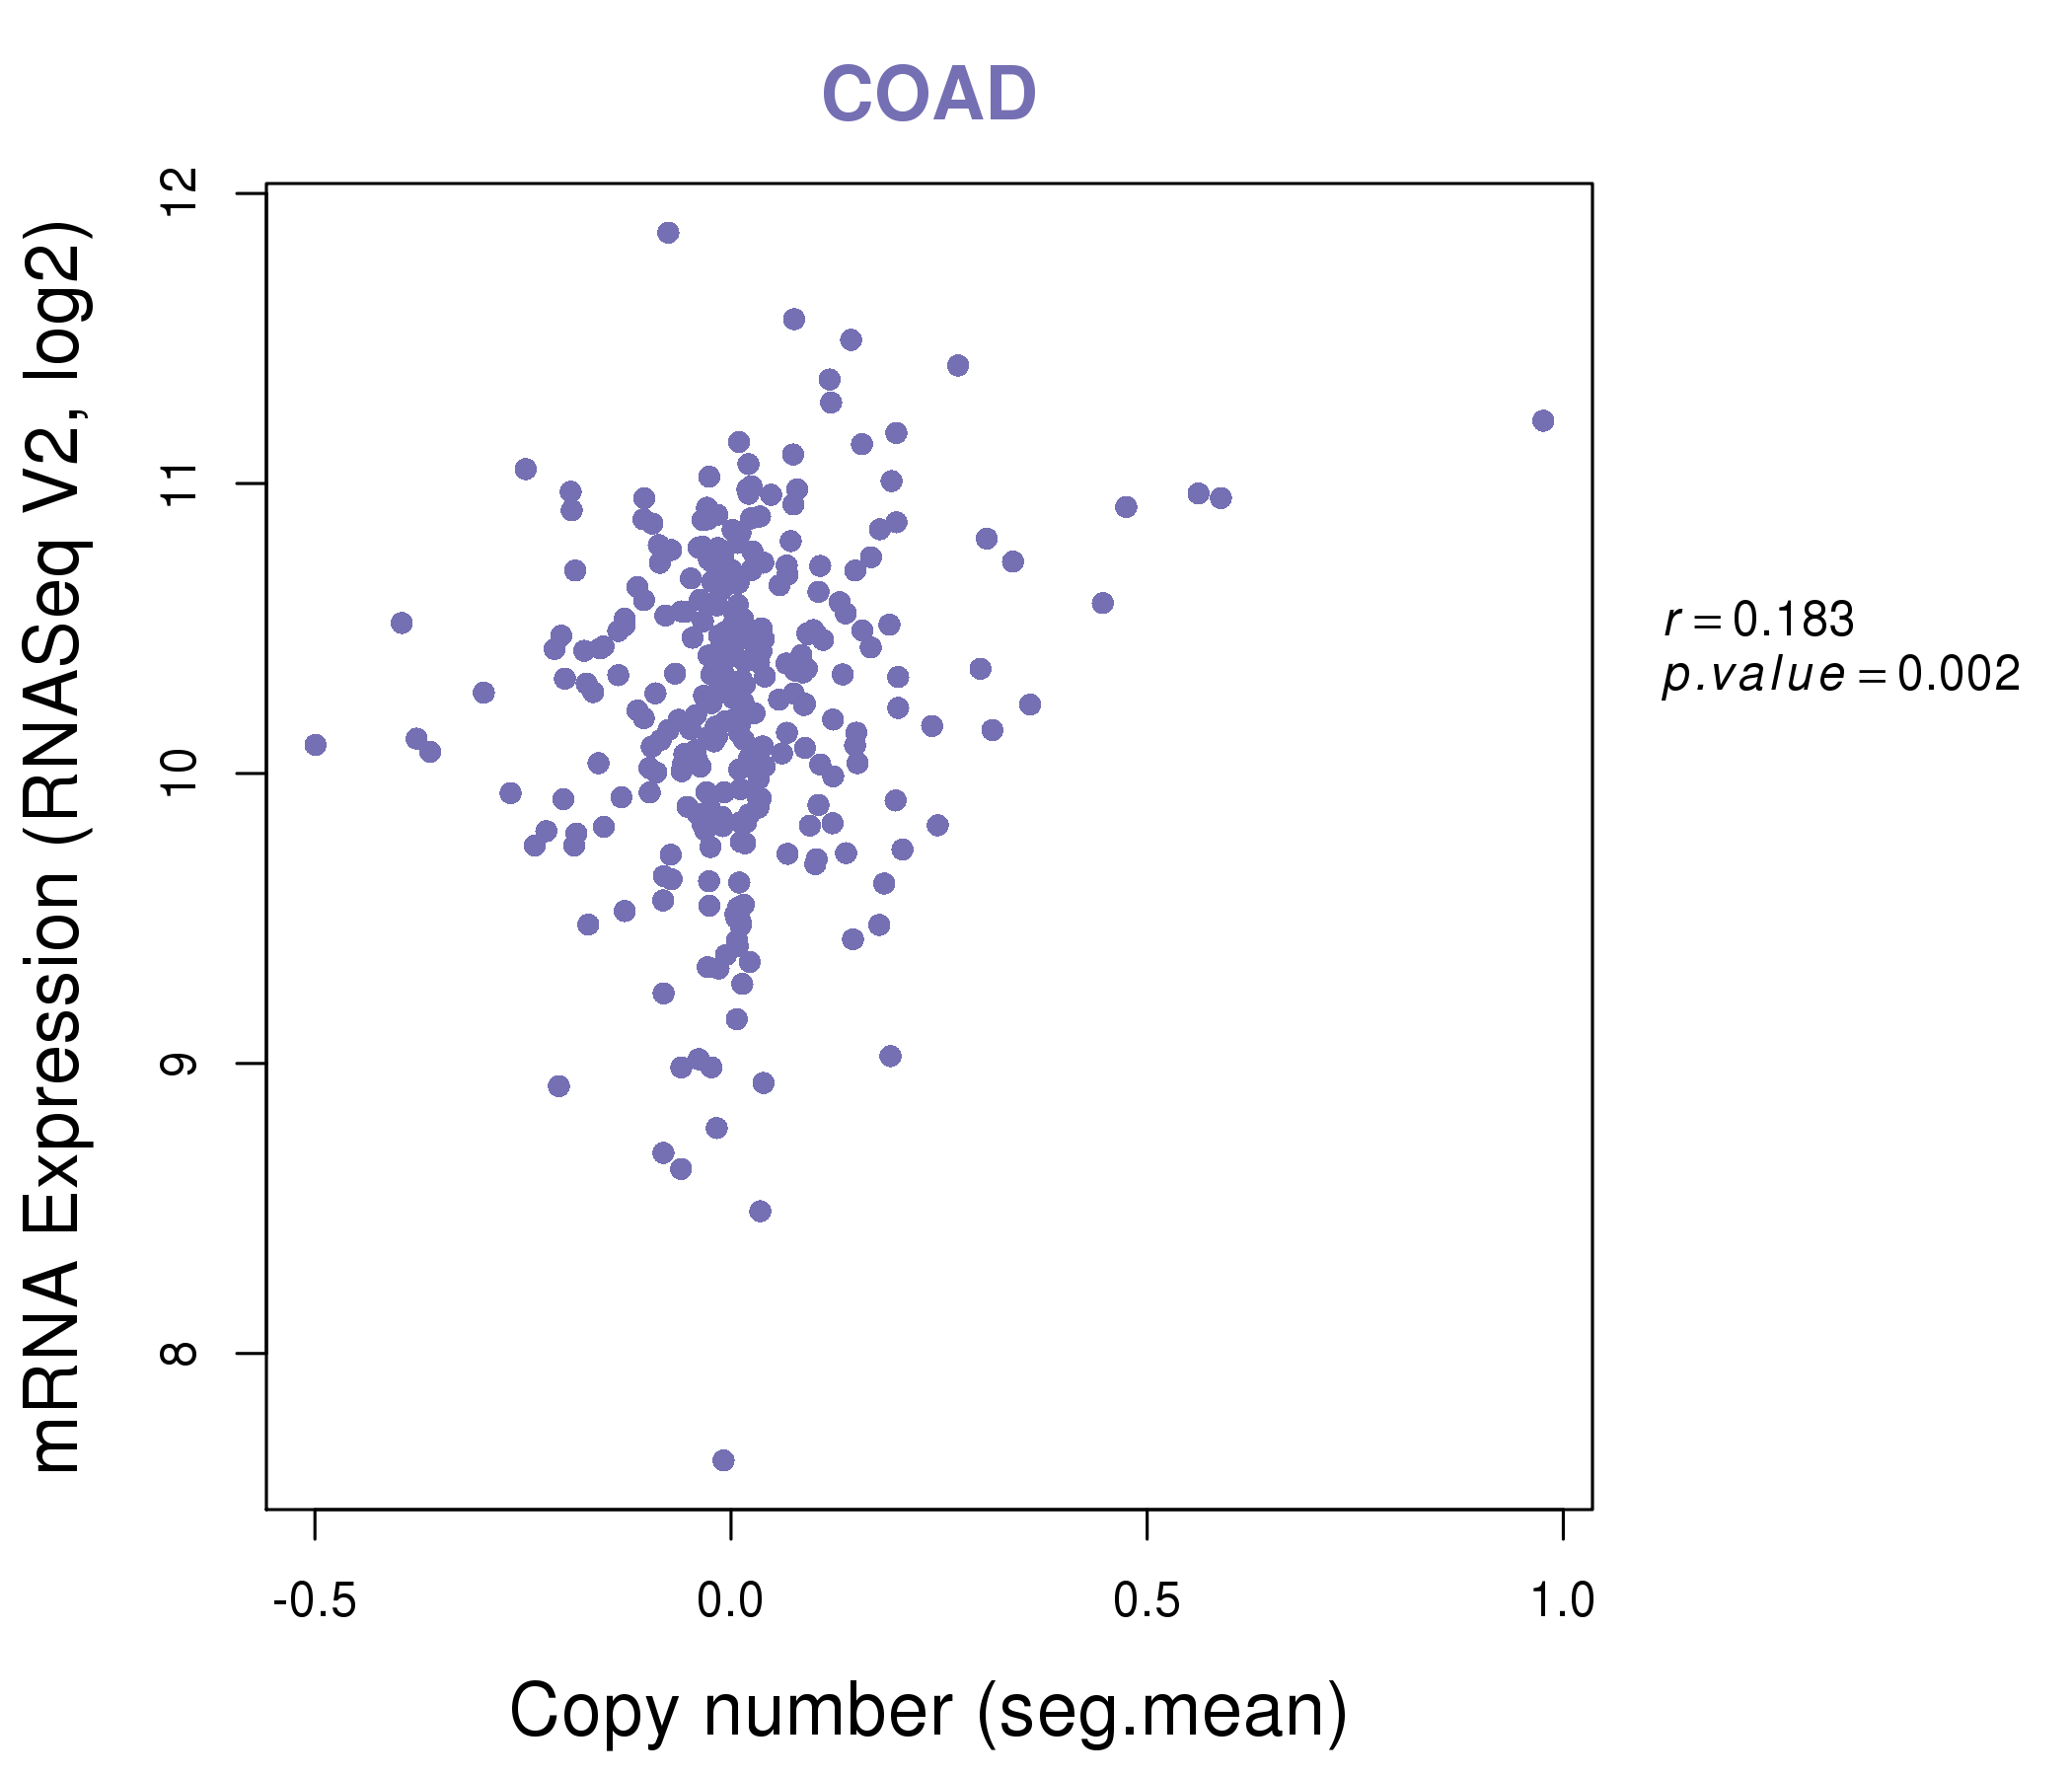
| * Copy number data were extracted from TCGA using R package TCGA-Assembler. The URLs of all public data files on TCGA DCC data server were gathered on Jan-05-2015. Function ProcessCNAData in TCGA-Assembler package was used to obtain gene-level copy number value which is calculated as the average copy number of the genomic region of a gene. |
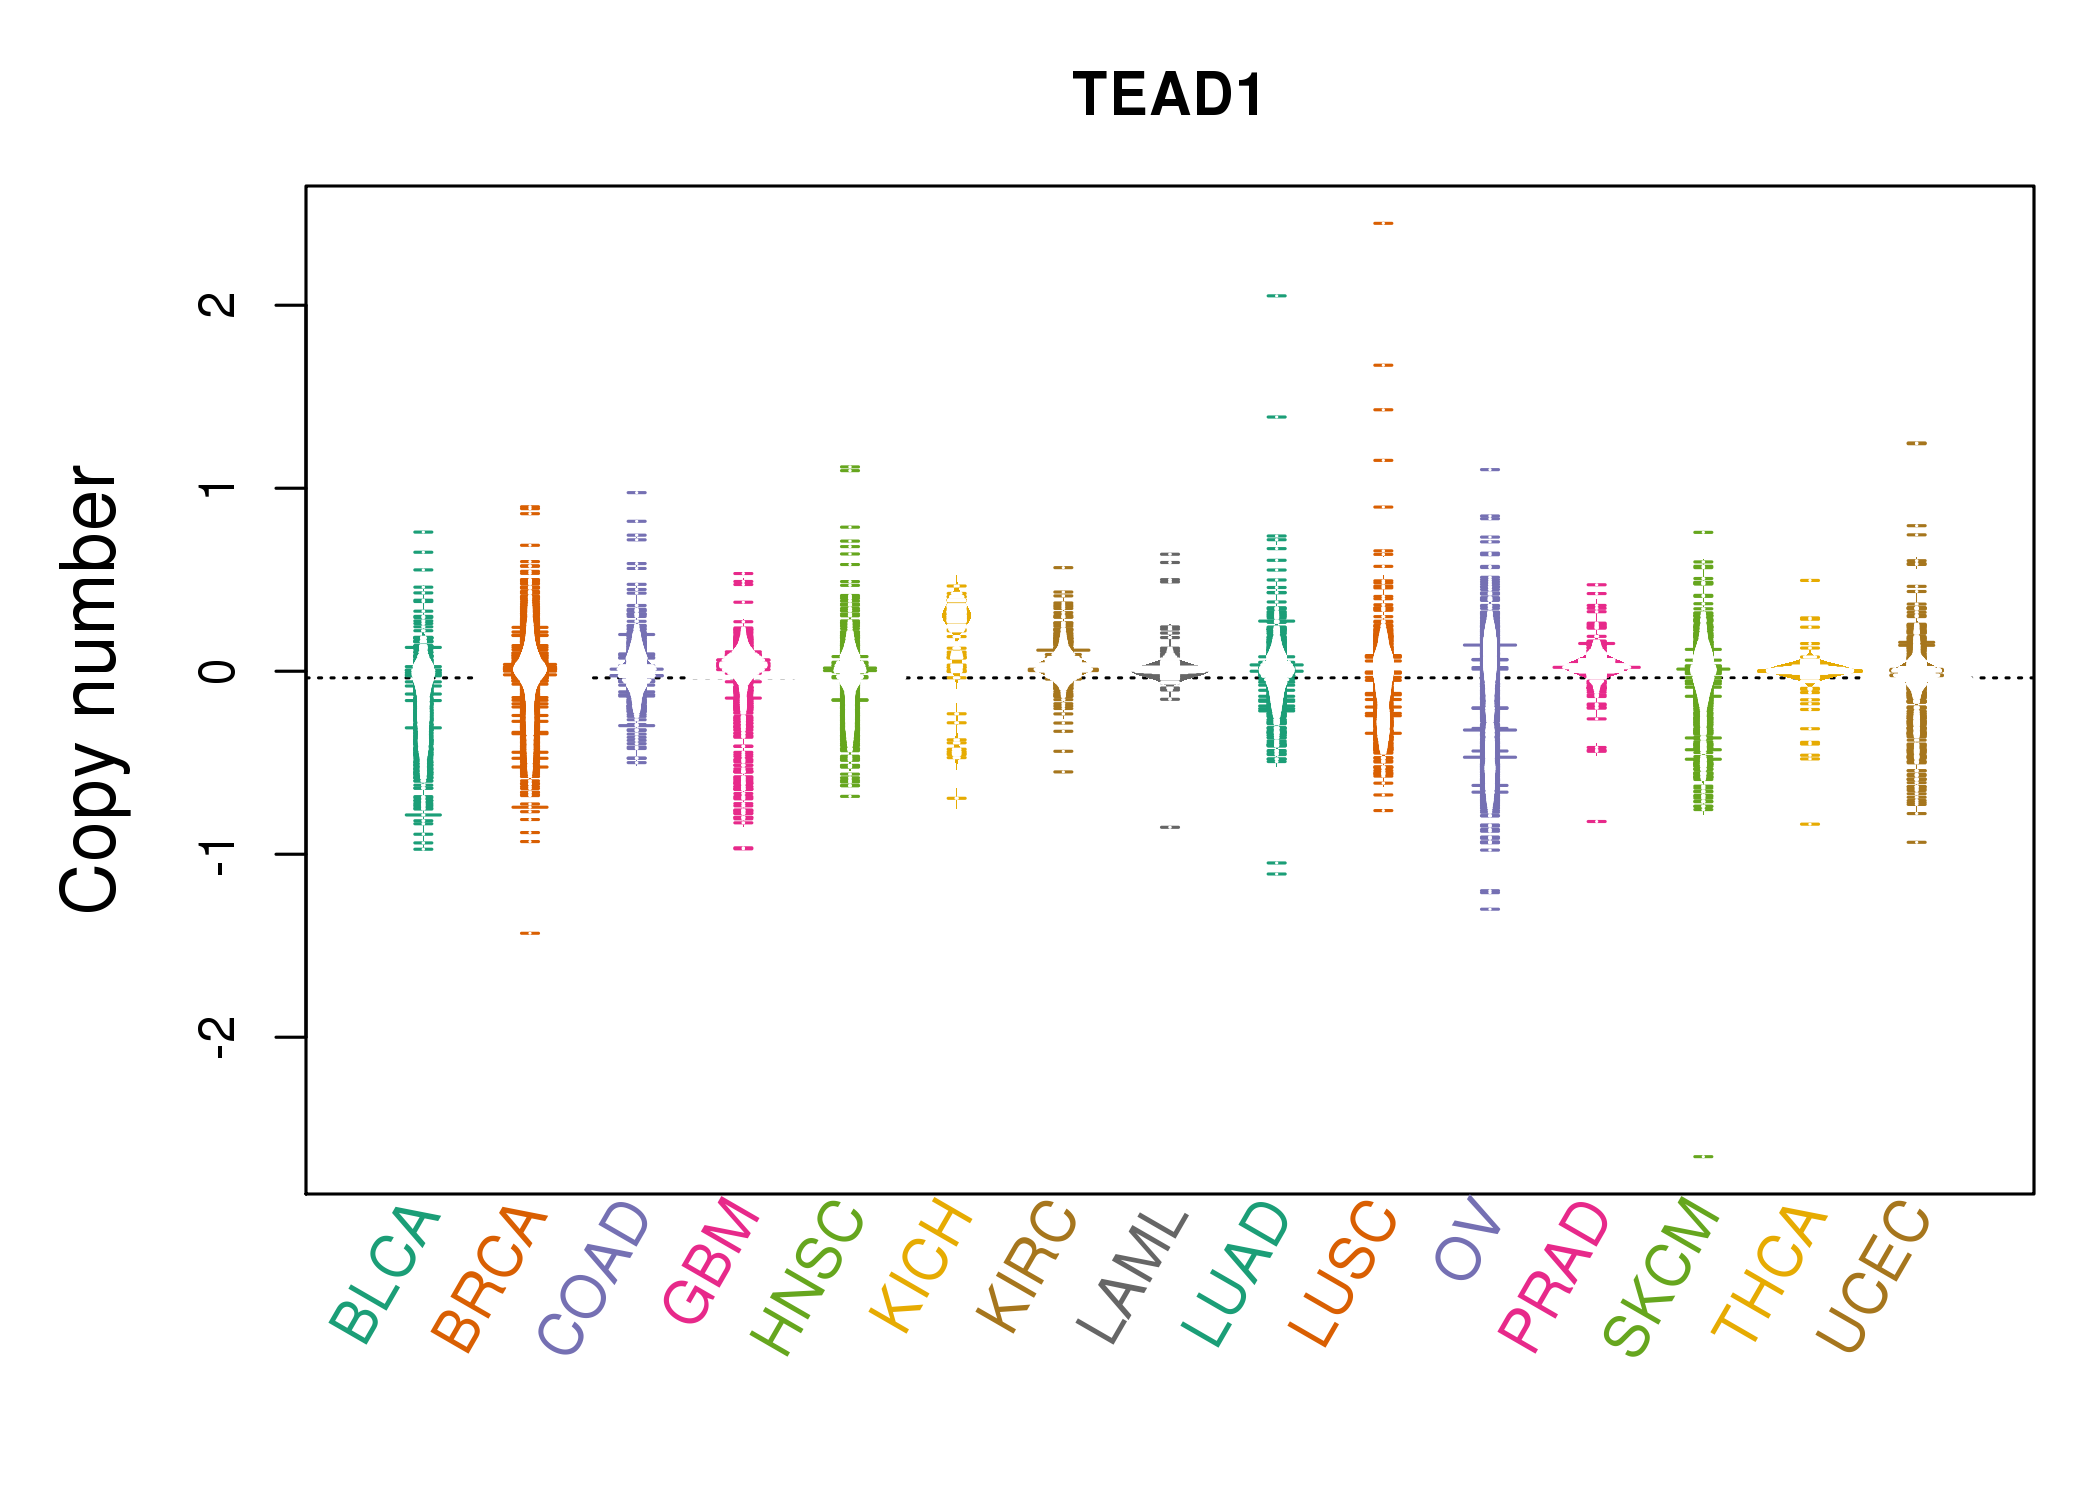 |
| cf) Tissue ID[Tissue type]: BLCA[Bladder Urothelial Carcinoma], BRCA[Breast invasive carcinoma], CESC[Cervical squamous cell carcinoma and endocervical adenocarcinoma], COAD[Colon adenocarcinoma], GBM[Glioblastoma multiforme], Glioma Low Grade, HNSC[Head and Neck squamous cell carcinoma], KICH[Kidney Chromophobe], KIRC[Kidney renal clear cell carcinoma], KIRP[Kidney renal papillary cell carcinoma], LAML[Acute Myeloid Leukemia], LUAD[Lung adenocarcinoma], LUSC[Lung squamous cell carcinoma], OV[Ovarian serous cystadenocarcinoma ], PAAD[Pancreatic adenocarcinoma], PRAD[Prostate adenocarcinoma], SKCM[Skin Cutaneous Melanoma], STAD[Stomach adenocarcinoma], THCA[Thyroid carcinoma], UCEC[Uterine Corpus Endometrial Carcinoma] |
| Top |
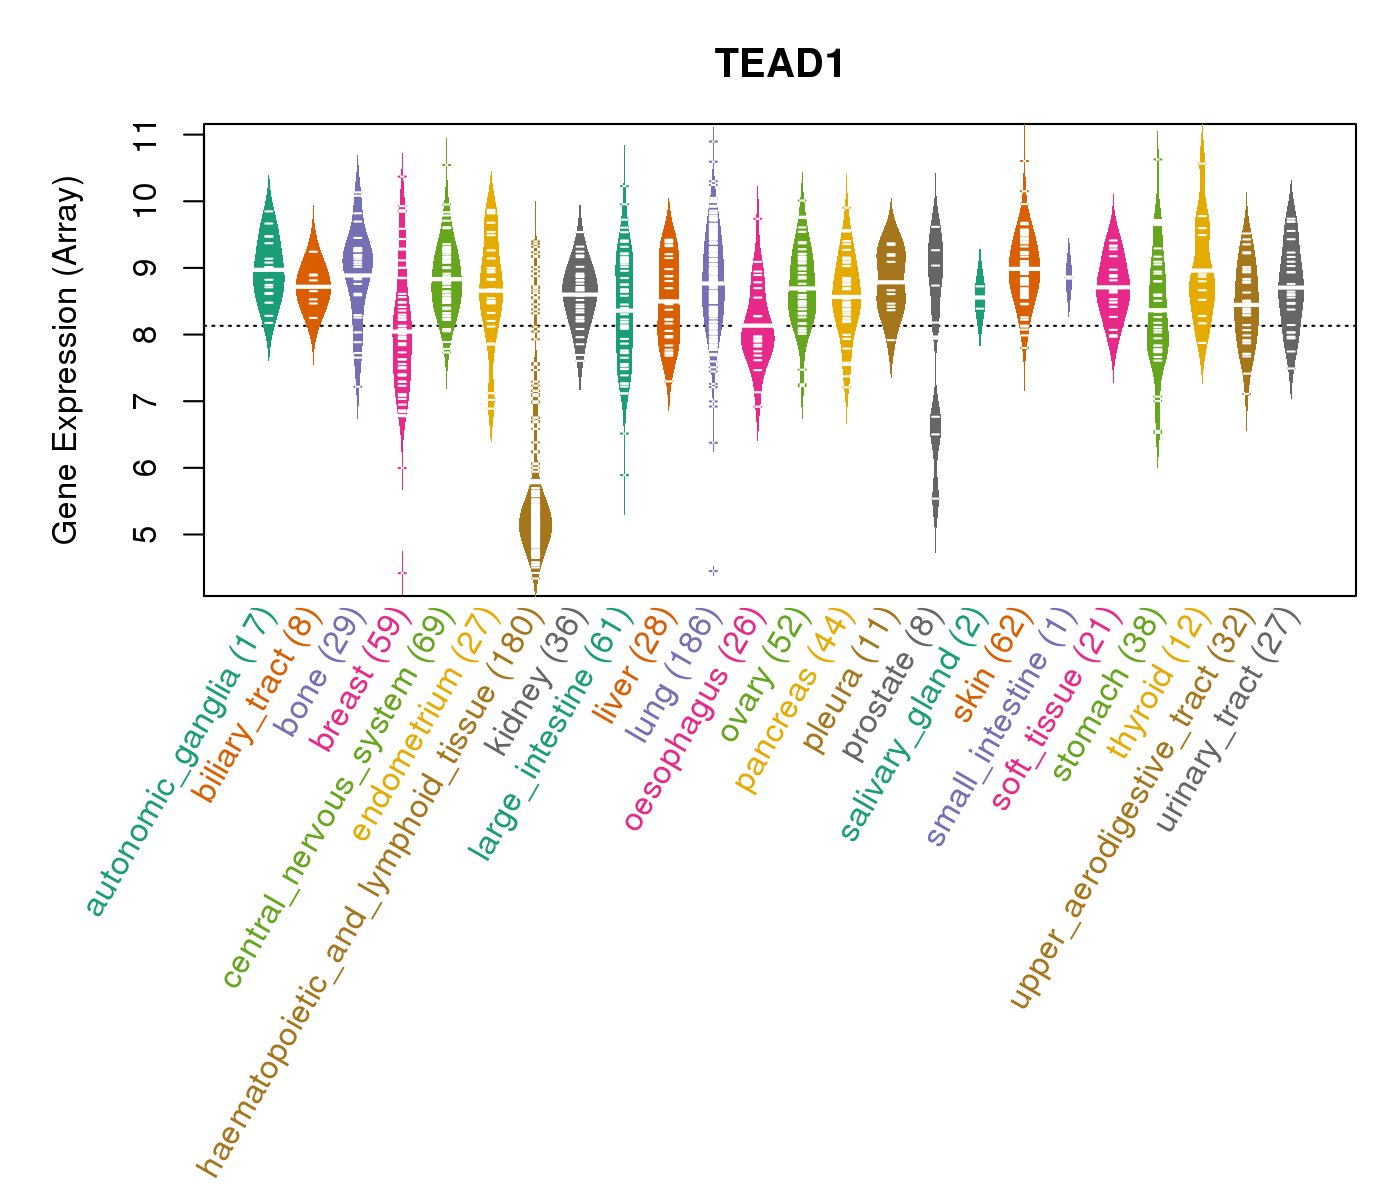
| Gene Expression for TEAD1 |
| * CCLE gene expression data were extracted from CCLE_Expression_Entrez_2012-10-18.res: Gene-centric RMA-normalized mRNA expression data. |
 |
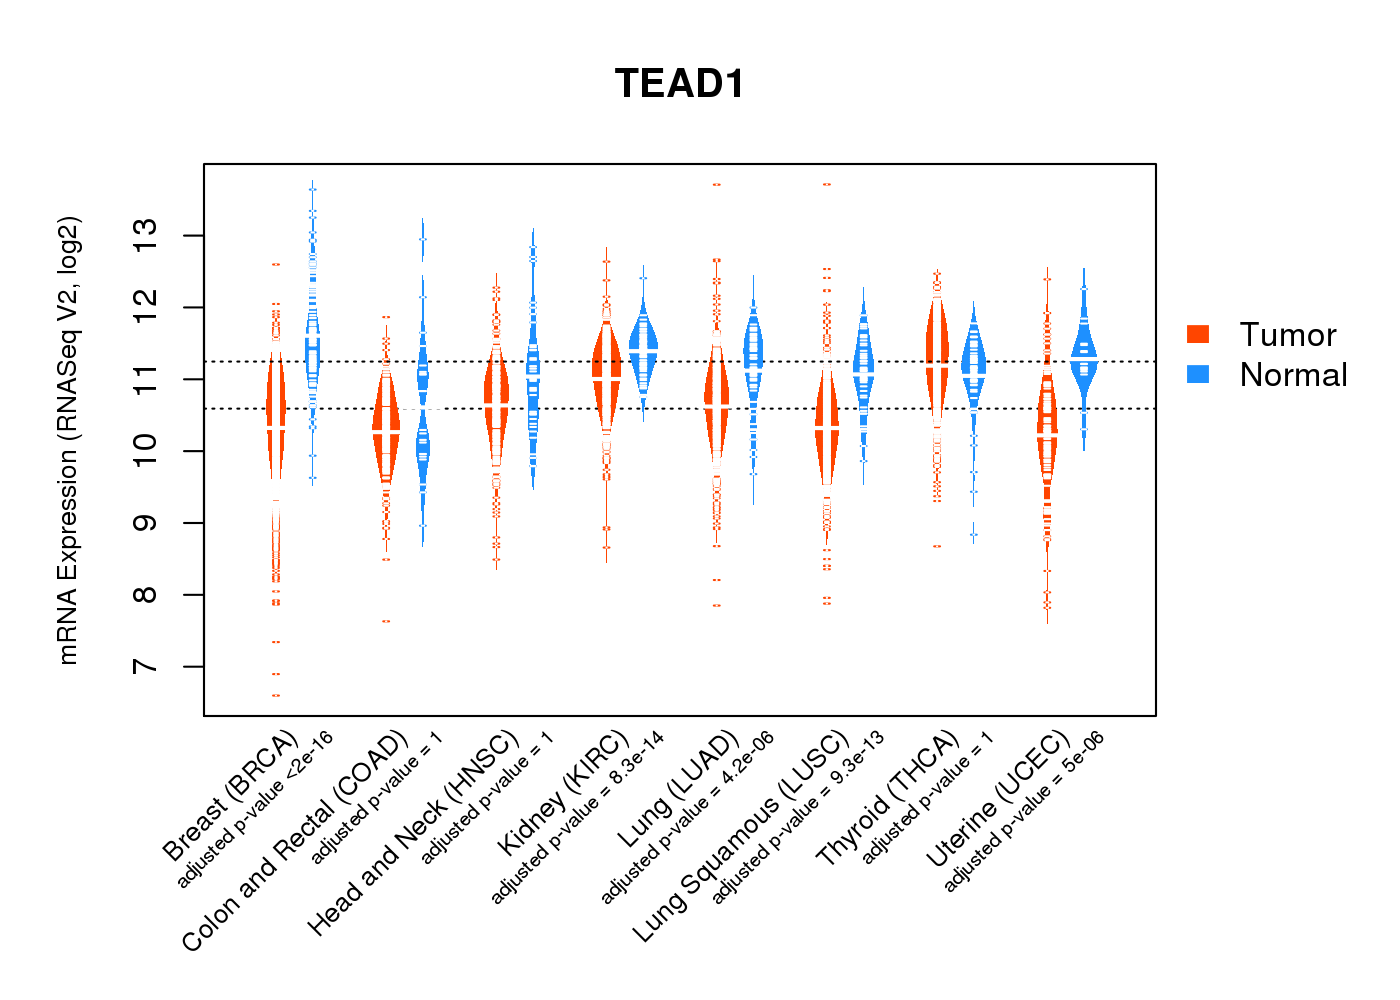
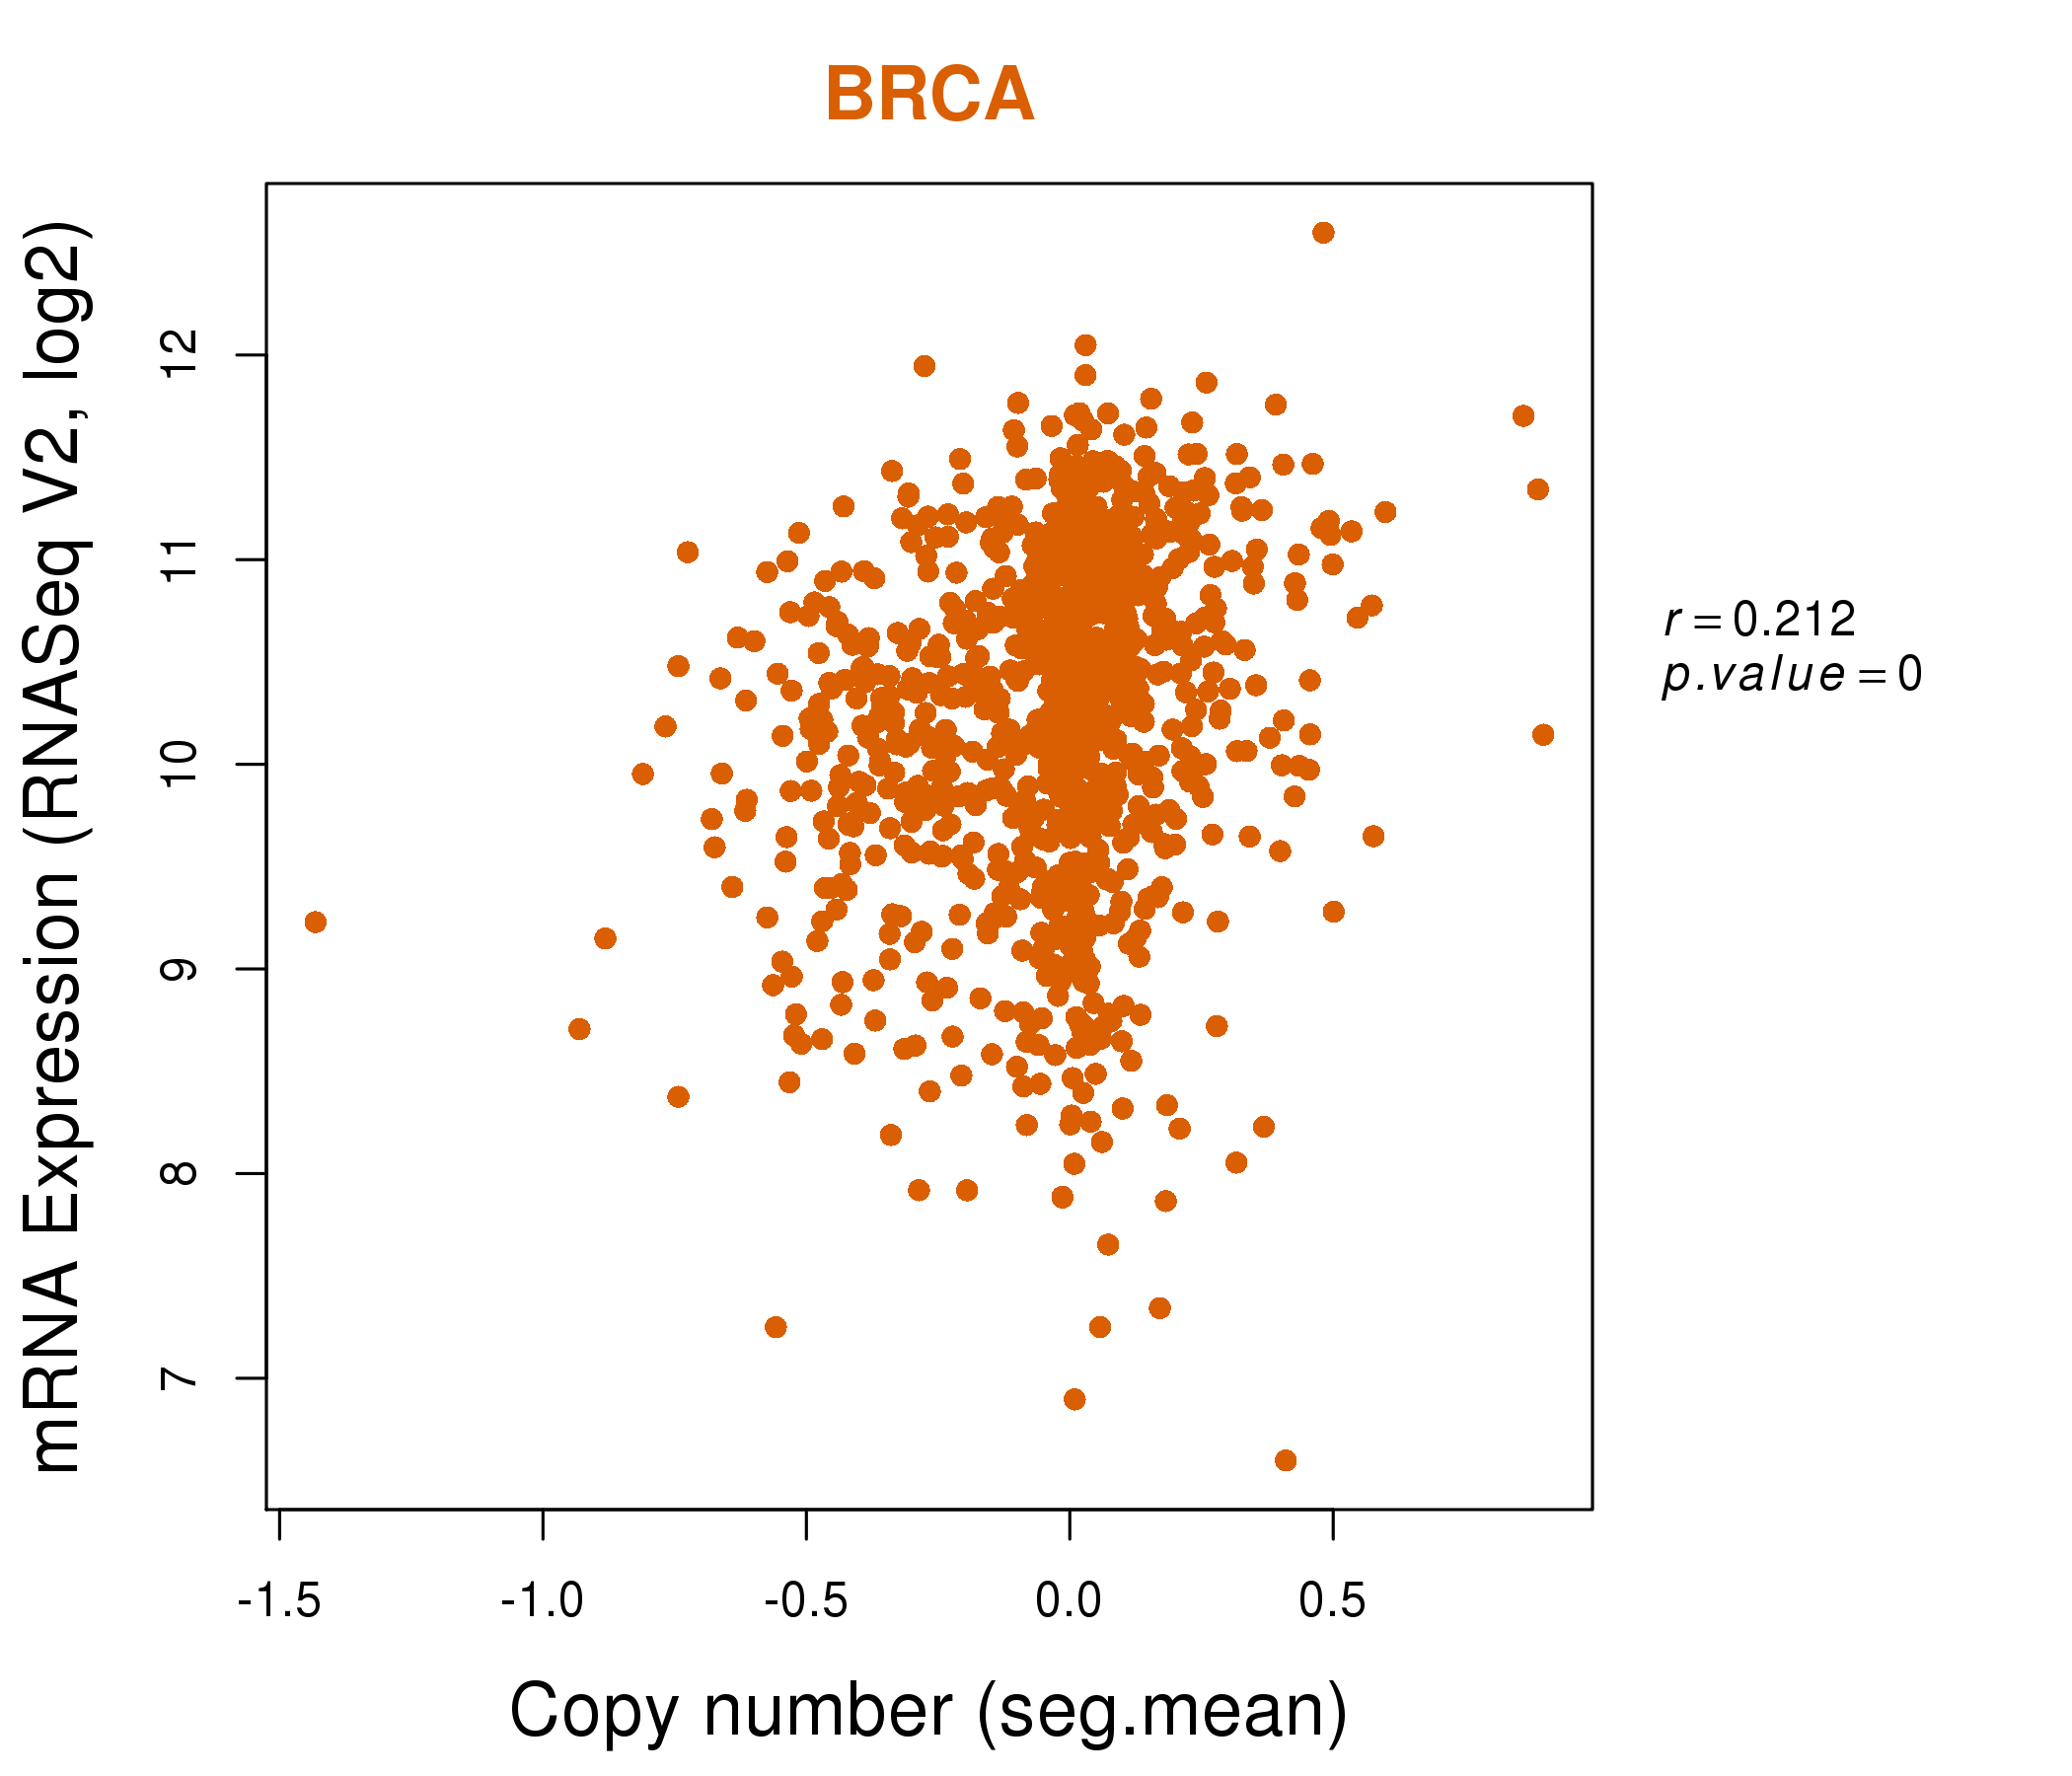
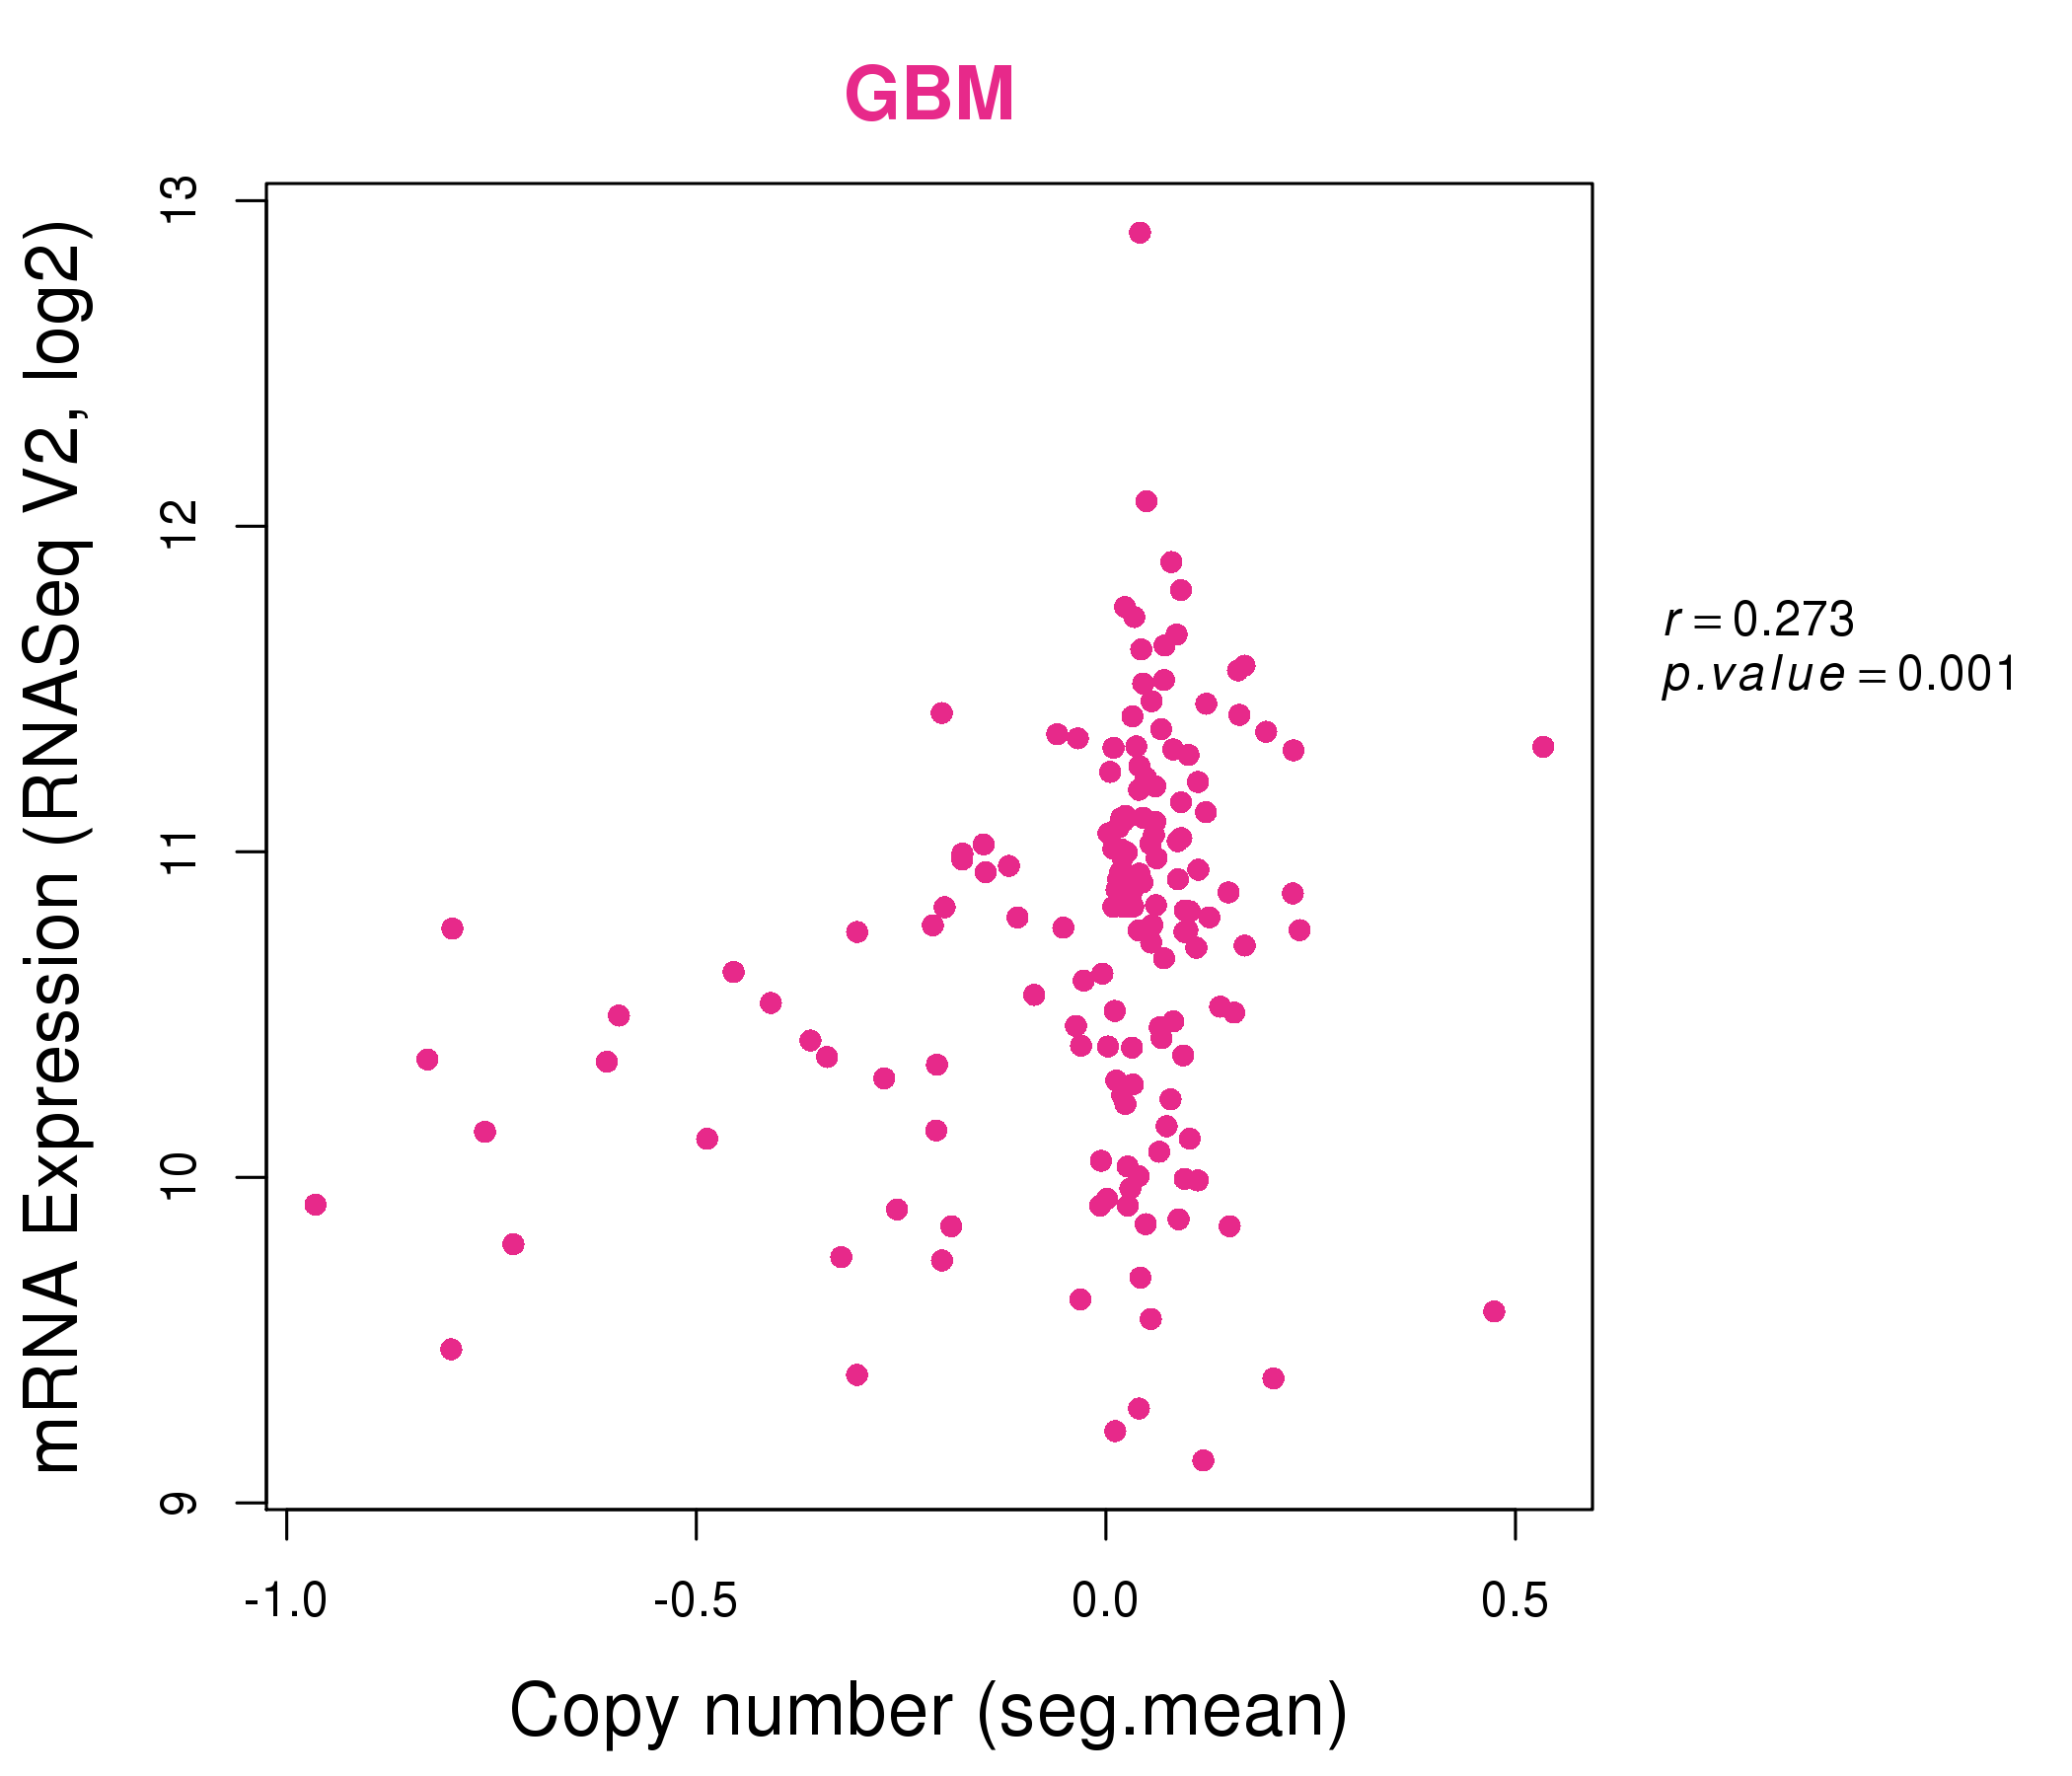
| * Normalized gene expression data of RNASeqV2 was extracted from TCGA using R package TCGA-Assembler. The URLs of all public data files on TCGA DCC data server were gathered at Jan-05-2015. Only eight cancer types have enough normal control samples for differential expression analysis. (t test, adjusted p<0.05 (using Benjamini-Hochberg FDR)) |
 |
| Top |
| * This plots show the correlation between CNV and gene expression. |
: Open all plots for all cancer types
 |
|
 |
|
| Top |
| Gene-Gene Network Information |
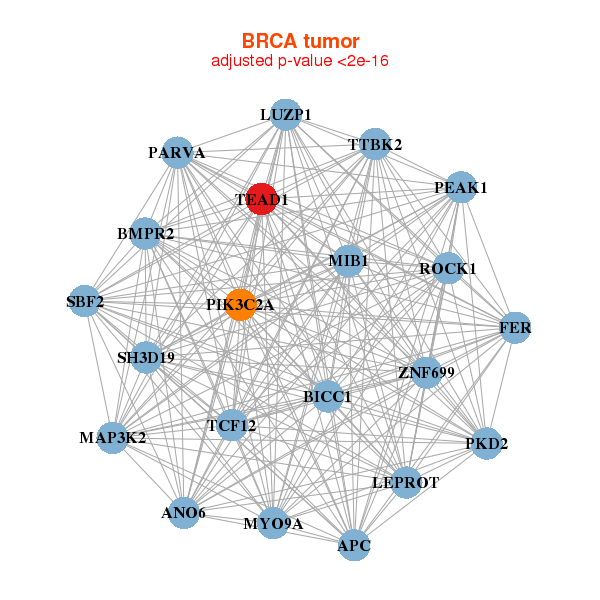
| * Co-Expression network figures were drawn using R package igraph. Only the top 20 genes with the highest correlations were shown. Red circle: input gene, orange circle: cell metabolism gene, sky circle: other gene |
: Open all plots for all cancer types
 |
|
| ANO6,APC,BICC1,BMPR2,FER,LEPROT,LUZP1, MAP3K2,MIB1,MYO9A,PARVA,PIK3C2A,PKD2,ROCK1, SBF2,PEAK1,SH3D19,TCF12,TEAD1,TTBK2,ZNF699 | ABCC9,ANKRD40,ANKRD46,GID4,DIAPH2,EIF4E3,FOXN3, HSDL2,KIAA1715,MTMR10,PCYOX1,QKI,RDX,SAMD8, SEC23A,SETD7,SGCB,SH3GLB1,TEAD1,YPEL2,YWHAG |
 |
|
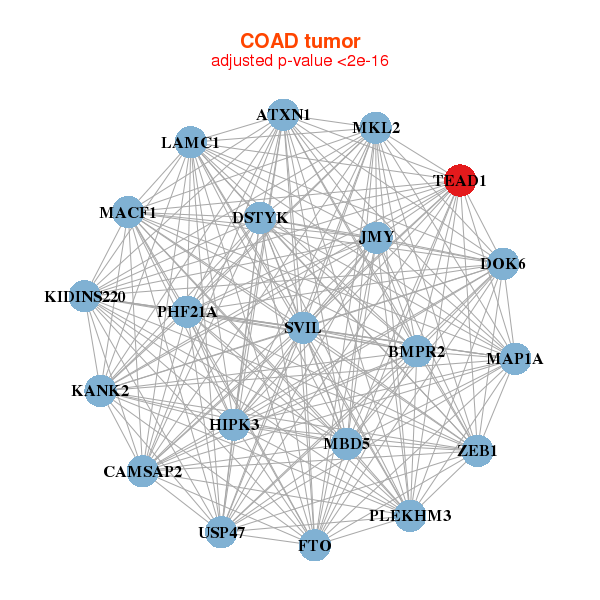
| ATXN1,BMPR2,CAMSAP2,DOK6,DSTYK,FTO,HIPK3, JMY,KANK2,KIDINS220,LAMC1,MACF1,MAP1A,MBD5, MKL2,PHF21A,PLEKHM3,SVIL,TEAD1,USP47,ZEB1 | AKT3,AMOTL1,ANKS1B,BNC2,DIP2C,DMD,DOCK3, FAM124A,FAM129A,GNAO1,NBEA,PCDH7,PPP1R12B,PRICKLE2, RNF150,ROR2,SORBS1,SVIL,TEAD1,TNS1,TSHZ3 |
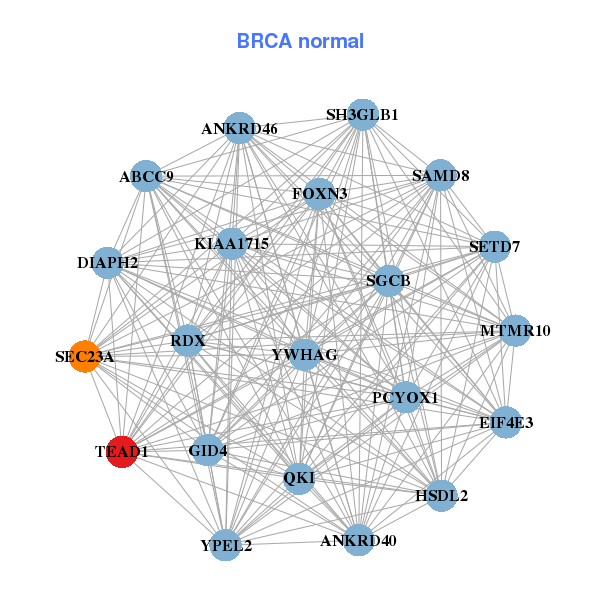
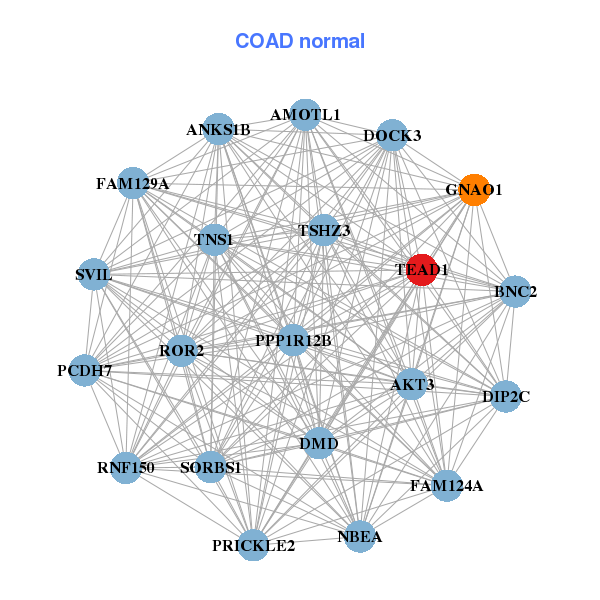
| * Co-Expression network figures were drawn using R package igraph. Only the top 20 genes with the highest correlations were shown. Red circle: input gene, orange circle: cell metabolism gene, sky circle: other gene |
: Open all plots for all cancer types
| Top |
: Open all interacting genes' information including KEGG pathway for all interacting genes from DAVID
| Top |
| Pharmacological Information for TEAD1 |
| There's no related Drug. |
| Top |
| Cross referenced IDs for TEAD1 |
| * We obtained these cross-references from Uniprot database. It covers 150 different DBs, 18 categories. http://www.uniprot.org/help/cross_references_section |
: Open all cross reference information
|
Copyright © 2016-Present - The Univsersity of Texas Health Science Center at Houston @ |