|
||||||||||||||||||||||||||||||||||||||||||||||||||||||||||||||||||||||||||||||||||||||||||||||||||||||||||||||||||||||||||||||||||||||||||||||||||||||||||||||||||||||||||||||||||||||||||||||||||||||||||||||||||||||||||||||||||||||||||||||||||||||||||||||||||||||||||||||||||||||||||||||||||||||||||||||||||||||||||
| |
| Phenotypic Information (metabolism pathway, cancer, disease, phenome) |
| |
| |
| Gene-Gene Network Information: Co-Expression Network, Interacting Genes & KEGG |
| |
|


| Gene Summary for TKT |
| Basic gene info. | Gene symbol | TKT |
| Gene name | transketolase | |
| Synonyms | HEL107|TK|TKT1 | |
| Cytomap | UCSC genome browser: 3p14.3 | |
| Genomic location | chr3 :53259652-53290130 | |
| Type of gene | protein-coding | |
| RefGenes | NM_001064.3, NM_001135055.2,NM_001258028.1,NR_047580.1,NM_001135056.1, NR_047579.1, | |
| Ensembl id | ENSG00000163931 | |
| Description | epididymis luminal protein 107 | |
| Modification date | 20141211 | |
| dbXrefs | MIM : 606781 | |
| HGNC : HGNC | ||
| Ensembl : ENSG00000163931 | ||
| HPRD : 06001 | ||
| Vega : OTTHUMG00000158192 | ||
| Protein | UniProt: go to UniProt's Cross Reference DB Table | |
| Expression | CleanEX: HS_TKT | |
| BioGPS: 7086 | ||
| Gene Expression Atlas: ENSG00000163931 | ||
| The Human Protein Atlas: ENSG00000163931 | ||
| Pathway | NCI Pathway Interaction Database: TKT | |
| KEGG: TKT | ||
| REACTOME: TKT | ||
| ConsensusPathDB | ||
| Pathway Commons: TKT | ||
| Metabolism | MetaCyc: TKT | |
| HUMANCyc: TKT | ||
| Regulation | Ensembl's Regulation: ENSG00000163931 | |
| miRBase: chr3 :53,259,652-53,290,130 | ||
| TargetScan: NM_001064 | ||
| cisRED: ENSG00000163931 | ||
| Context | iHOP: TKT | |
| cancer metabolism search in PubMed: TKT | ||
| UCL Cancer Institute: TKT | ||
| Assigned class in ccmGDB | C | |
| Top |
| Phenotypic Information for TKT(metabolism pathway, cancer, disease, phenome) |
| Cancer | CGAP: TKT |
| Familial Cancer Database: TKT | |
| * This gene is included in those cancer gene databases. |
|
|
|
|
|
|
| ||||||||||||||||||||||||||||||||||||||||||||||||||||||||||||||||||||||||||||||||||||||||||||||||||||||||||||||||||||||||||||||||||||||||||||||||||||||||||||||||||||||||||||||||||||||||||||||||||||||||||||||||||||||||||||||||||||||||||||||||||||||||||||||||||||||||||||||||||||||||||||||||||||||||||||||||||||
Oncogene 1 | Significant driver gene in | |||||||||||||||||||||||||||||||||||||||||||||||||||||||||||||||||||||||||||||||||||||||||||||||||||||||||||||||||||||||||||||||||||||||||||||||||||||||||||||||||||||||||||||||||||||||||||||||||||||||||||||||||||||||||||||||||||||||||||||||||||||||||||||||||||||||||||||||||||||||||||||||||||||||||||||||||||||||||
| cf) number; DB name 1 Oncogene; http://nar.oxfordjournals.org/content/35/suppl_1/D721.long, 2 Tumor Suppressor gene; https://bioinfo.uth.edu/TSGene/, 3 Cancer Gene Census; http://www.nature.com/nrc/journal/v4/n3/abs/nrc1299.html, 4 CancerGenes; http://nar.oxfordjournals.org/content/35/suppl_1/D721.long, 5 Network of Cancer Gene; http://ncg.kcl.ac.uk/index.php, 1Therapeutic Vulnerabilities in Cancer; http://cbio.mskcc.org/cancergenomics/statius/ |
| REACTOME_INTEGRATION_OF_ENERGY_METABOLISM REACTOME_METABOLISM_OF_CARBOHYDRATES | |
| OMIM | |
| Orphanet | |
| Disease | KEGG Disease: TKT |
| MedGen: TKT (Human Medical Genetics with Condition) | |
| ClinVar: TKT | |
| Phenotype | MGI: TKT (International Mouse Phenotyping Consortium) |
| PhenomicDB: TKT | |
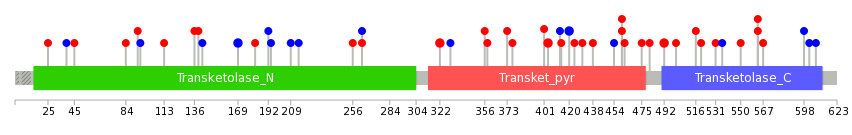
| Mutations for TKT |
| * Under tables are showing count per each tissue to give us broad intuition about tissue specific mutation patterns.You can go to the detailed page for each mutation database's web site. |
| There's no structural variation information in COSMIC data for this gene. |
| * From mRNA Sanger sequences, Chitars2.0 arranged chimeric transcripts. This table shows TKT related fusion information. |
| ID | Head Gene | Tail Gene | Accession | Gene_a | qStart_a | qEnd_a | Chromosome_a | tStart_a | tEnd_a | Gene_a | qStart_a | qEnd_a | Chromosome_a | tStart_a | tEnd_a |
| BF349570 | TKT | 2 | 143 | 3 | 53262079 | 53262347 | TKT | 141 | 267 | 3 | 53259918 | 53260868 | |
| BF002266 | CDC37 | 7 | 107 | 19 | 10501809 | 10501909 | TKT | 107 | 412 | 3 | 53269069 | 53275233 | |
| BF529930 | TKT | 34 | 98 | 3 | 53262090 | 53262154 | TKT | 98 | 534 | 3 | 53259670 | 53262106 | |
| BE741860 | TKT | 1 | 574 | 3 | 53260813 | 53264500 | YLPM1 | 575 | 658 | 14 | 75269354 | 75276140 | |
| CD388242 | RPL11 | 41 | 302 | 1 | 24019098 | 24020406 | TKT | 302 | 386 | 3 | 53259668 | 53259752 | |
| BE740522 | TKT | 1 | 577 | 3 | 53260812 | 53264500 | YLPM1 | 578 | 831 | 14 | 75269354 | 75276330 | |
| BG488822 | TKT | 15 | 69 | 3 | 53265408 | 53265462 | TKT | 63 | 870 | 3 | 53260779 | 53265422 | |
| BI094438 | TKT | 43 | 112 | 3 | 53259744 | 53259813 | TKT | 110 | 217 | 3 | 53259664 | 53259771 | |
| AW847418 | TKT | 6 | 63 | 3 | 53267145 | 53267203 | TKT | 63 | 159 | 3 | 53267400 | 53267497 | |
| AW880069 | TKT | 4 | 98 | 3 | 53259769 | 53259866 | CPXM2 | 90 | 111 | 10 | 125537690 | 125537711 | |
| Top |
| Mutation type/ Tissue ID | brca | cns | cerv | endome | haematopo | kidn | Lintest | liver | lung | ns | ovary | pancre | prost | skin | stoma | thyro | urina | |||
| Total # sample | 1 | 1 | ||||||||||||||||||
| GAIN (# sample) | 1 | |||||||||||||||||||
| LOSS (# sample) | 1 |
| cf) Tissue ID; Tissue type (1; Breast, 2; Central_nervous_system, 3; Cervix, 4; Endometrium, 5; Haematopoietic_and_lymphoid_tissue, 6; Kidney, 7; Large_intestine, 8; Liver, 9; Lung, 10; NS, 11; Ovary, 12; Pancreas, 13; Prostate, 14; Skin, 15; Stomach, 16; Thyroid, 17; Urinary_tract) |
| Top |
|
 |
| Top |
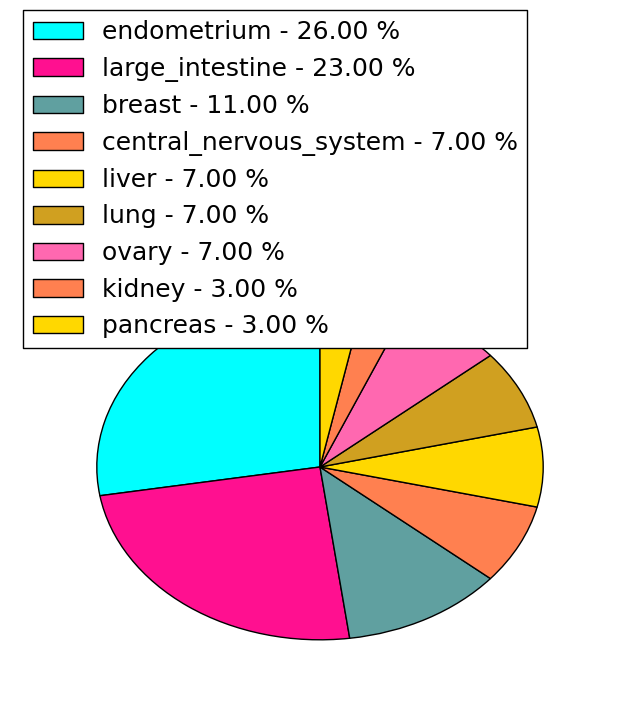
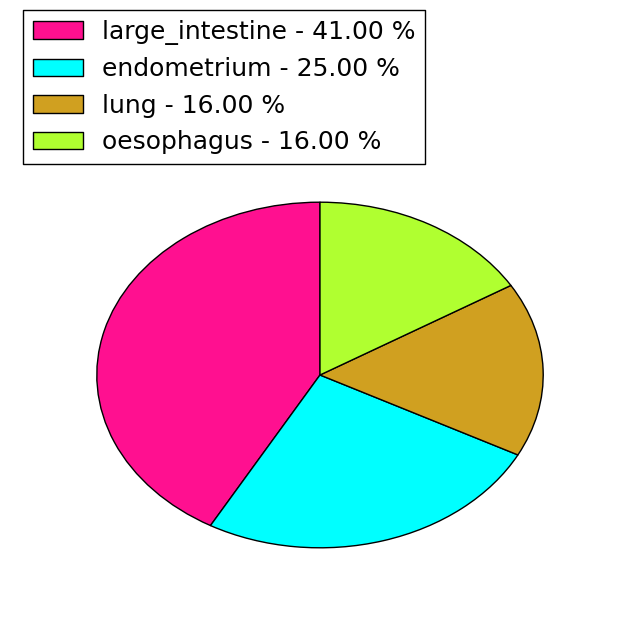
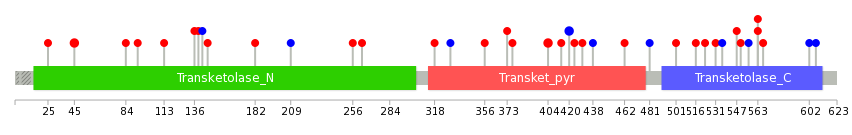
| Stat. for Non-Synonymous SNVs (# total SNVs=26) | (# total SNVs=12) |
 |  |
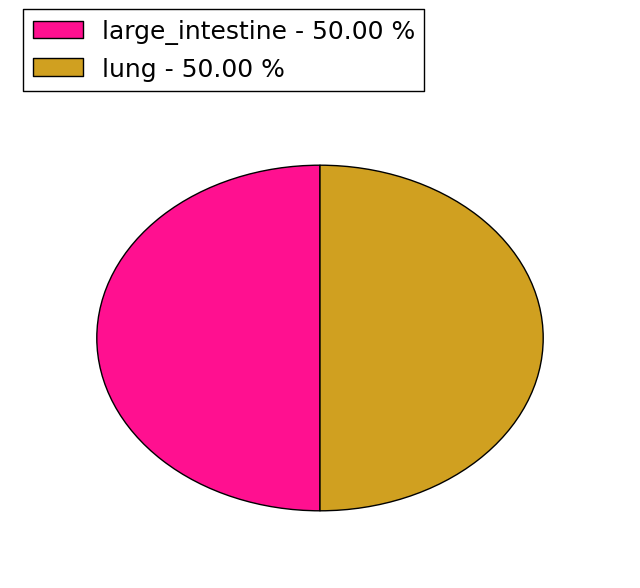
(# total SNVs=2) | (# total SNVs=0) |
 |
| Top |
| * When you move the cursor on each content, you can see more deailed mutation information on the Tooltip. Those are primary_site,primary_histology,mutation(aa),pubmedID. |
| GRCh37 position | Mutation(aa) | Unique sampleID count |
| chr3:53263350-53263350 | p.A404T | 2 |
| chr3:53260781-53260781 | p.Y563H | 2 |
| chr3:53262297-53262297 | p.A492S | 2 |
| chr3:53269121-53269121 | p.F169F | 2 |
| chr3:53263300-53263300 | p.S420S | 2 |
| chr3:53264616-53264616 | p.G322R | 2 |
| chr3:53263321-53263321 | p.C413C | 1 |
| chr3:53259944-53259944 | p.G567D | 1 |
| chr3:53265526-53265526 | p.P263P | 1 |
| chr3:53263034-53263034 | p.A462T | 1 |
| Top |
|
 |
| Point Mutation/ Tissue ID | 1 | 2 | 3 | 4 | 5 | 6 | 7 | 8 | 9 | 10 | 11 | 12 | 13 | 14 | 15 | 16 | 17 | 18 | 19 | 20 |
| # sample | 2 | 9 | 1 | 1 | 1 | 2 | 2 | 1 | 7 | 3 | 9 | |||||||||
| # mutation | 2 | 9 | 1 | 1 | 1 | 2 | 2 | 1 | 7 | 3 | 10 | |||||||||
| nonsynonymous SNV | 2 | 6 | 1 | 1 | 1 | 2 | 2 | 1 | 3 | 3 | 7 | |||||||||
| synonymous SNV | 3 | 4 | 3 |
| cf) Tissue ID; Tissue type (1; BLCA[Bladder Urothelial Carcinoma], 2; BRCA[Breast invasive carcinoma], 3; CESC[Cervical squamous cell carcinoma and endocervical adenocarcinoma], 4; COAD[Colon adenocarcinoma], 5; GBM[Glioblastoma multiforme], 6; Glioma Low Grade, 7; HNSC[Head and Neck squamous cell carcinoma], 8; KICH[Kidney Chromophobe], 9; KIRC[Kidney renal clear cell carcinoma], 10; KIRP[Kidney renal papillary cell carcinoma], 11; LAML[Acute Myeloid Leukemia], 12; LUAD[Lung adenocarcinoma], 13; LUSC[Lung squamous cell carcinoma], 14; OV[Ovarian serous cystadenocarcinoma ], 15; PAAD[Pancreatic adenocarcinoma], 16; PRAD[Prostate adenocarcinoma], 17; SKCM[Skin Cutaneous Melanoma], 18:STAD[Stomach adenocarcinoma], 19:THCA[Thyroid carcinoma], 20:UCEC[Uterine Corpus Endometrial Carcinoma]) |
| Top |
| * We represented just top 10 SNVs. When you move the cursor on each content, you can see more deailed mutation information on the Tooltip. Those are primary_site, primary_histology, mutation(aa), pubmedID. |
| Genomic Position | Mutation(aa) | Unique sampleID count |
| chr3:53260781 | p.Y563H,TKT | 2 |
| chr3:53276233 | p.A404T,TKT | 2 |
| chr3:53263300 | p.A45T,TKT | 2 |
| chr3:53263350 | p.S420S,TKT | 2 |
| chr3:53264627 | p.A84T,TKT | 1 |
| chr3:53275237 | p.I556I,TKT | 1 |
| chr3:53263106 | p.A377V,TKT | 1 |
| chr3:53265528 | p.R550C,TKT | 1 |
| chr3:53260800 | p.A373V,TKT | 1 |
| chr3:53263130 | p.S25R,TKT | 1 |
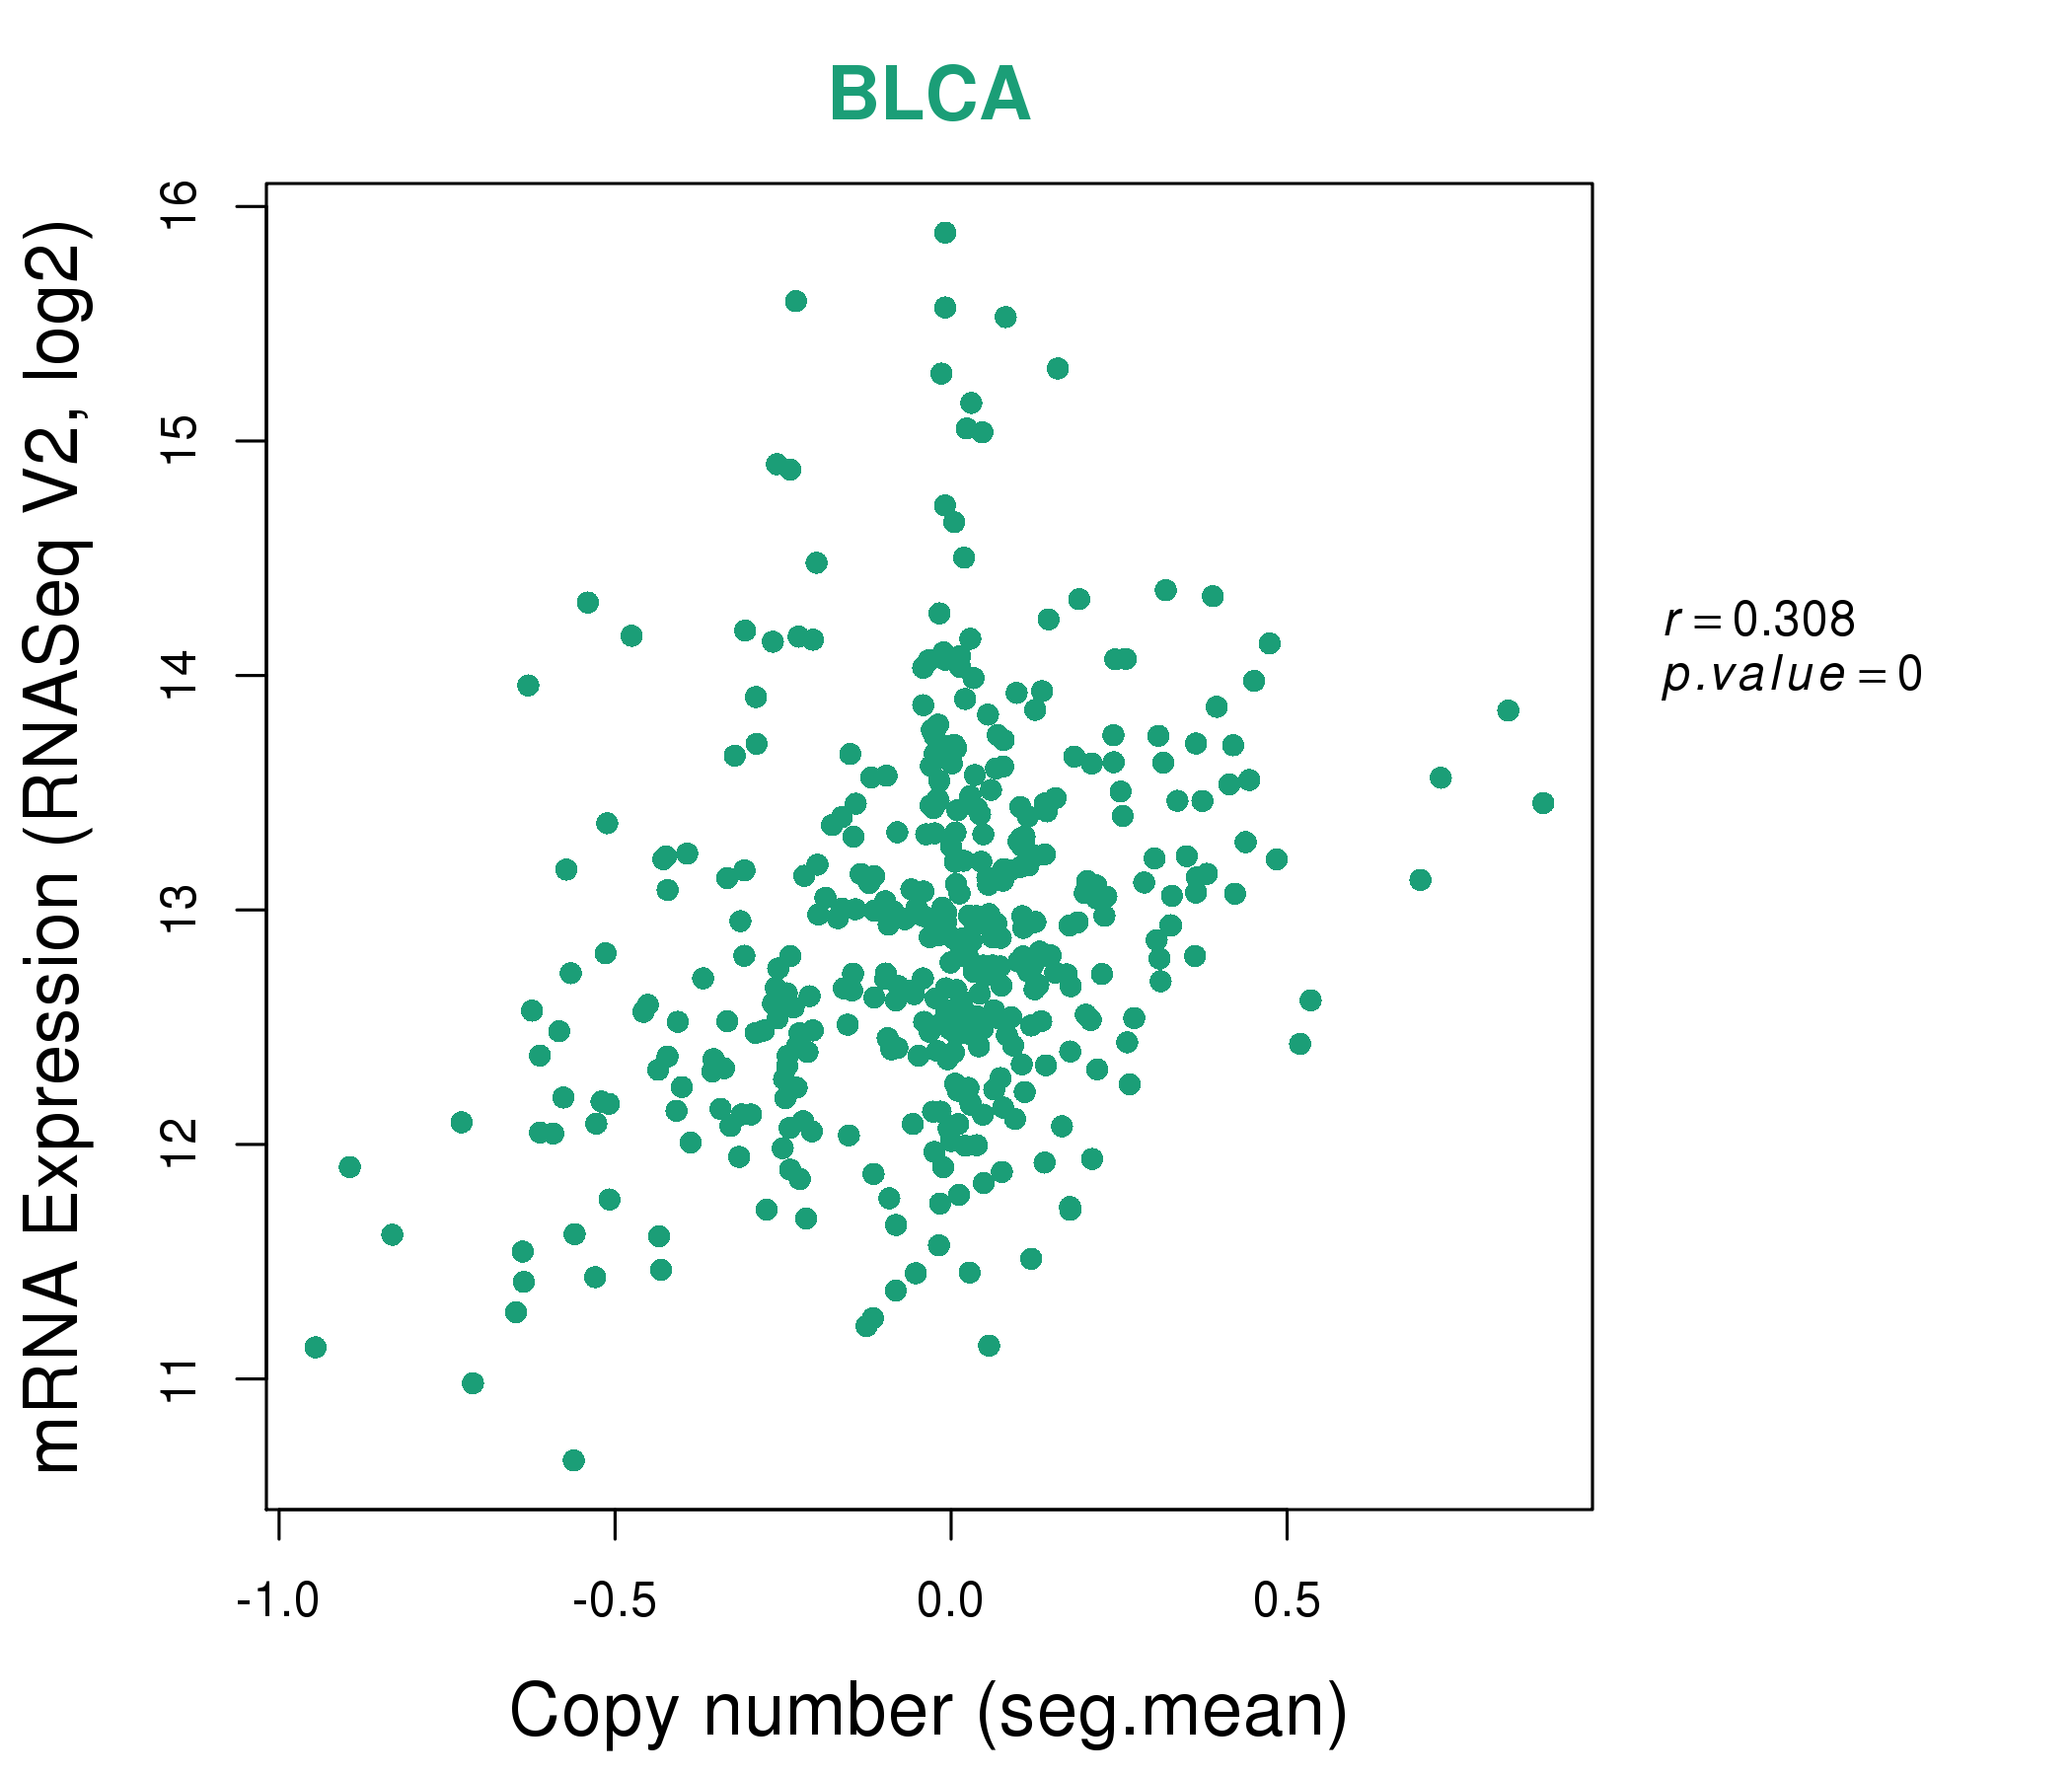
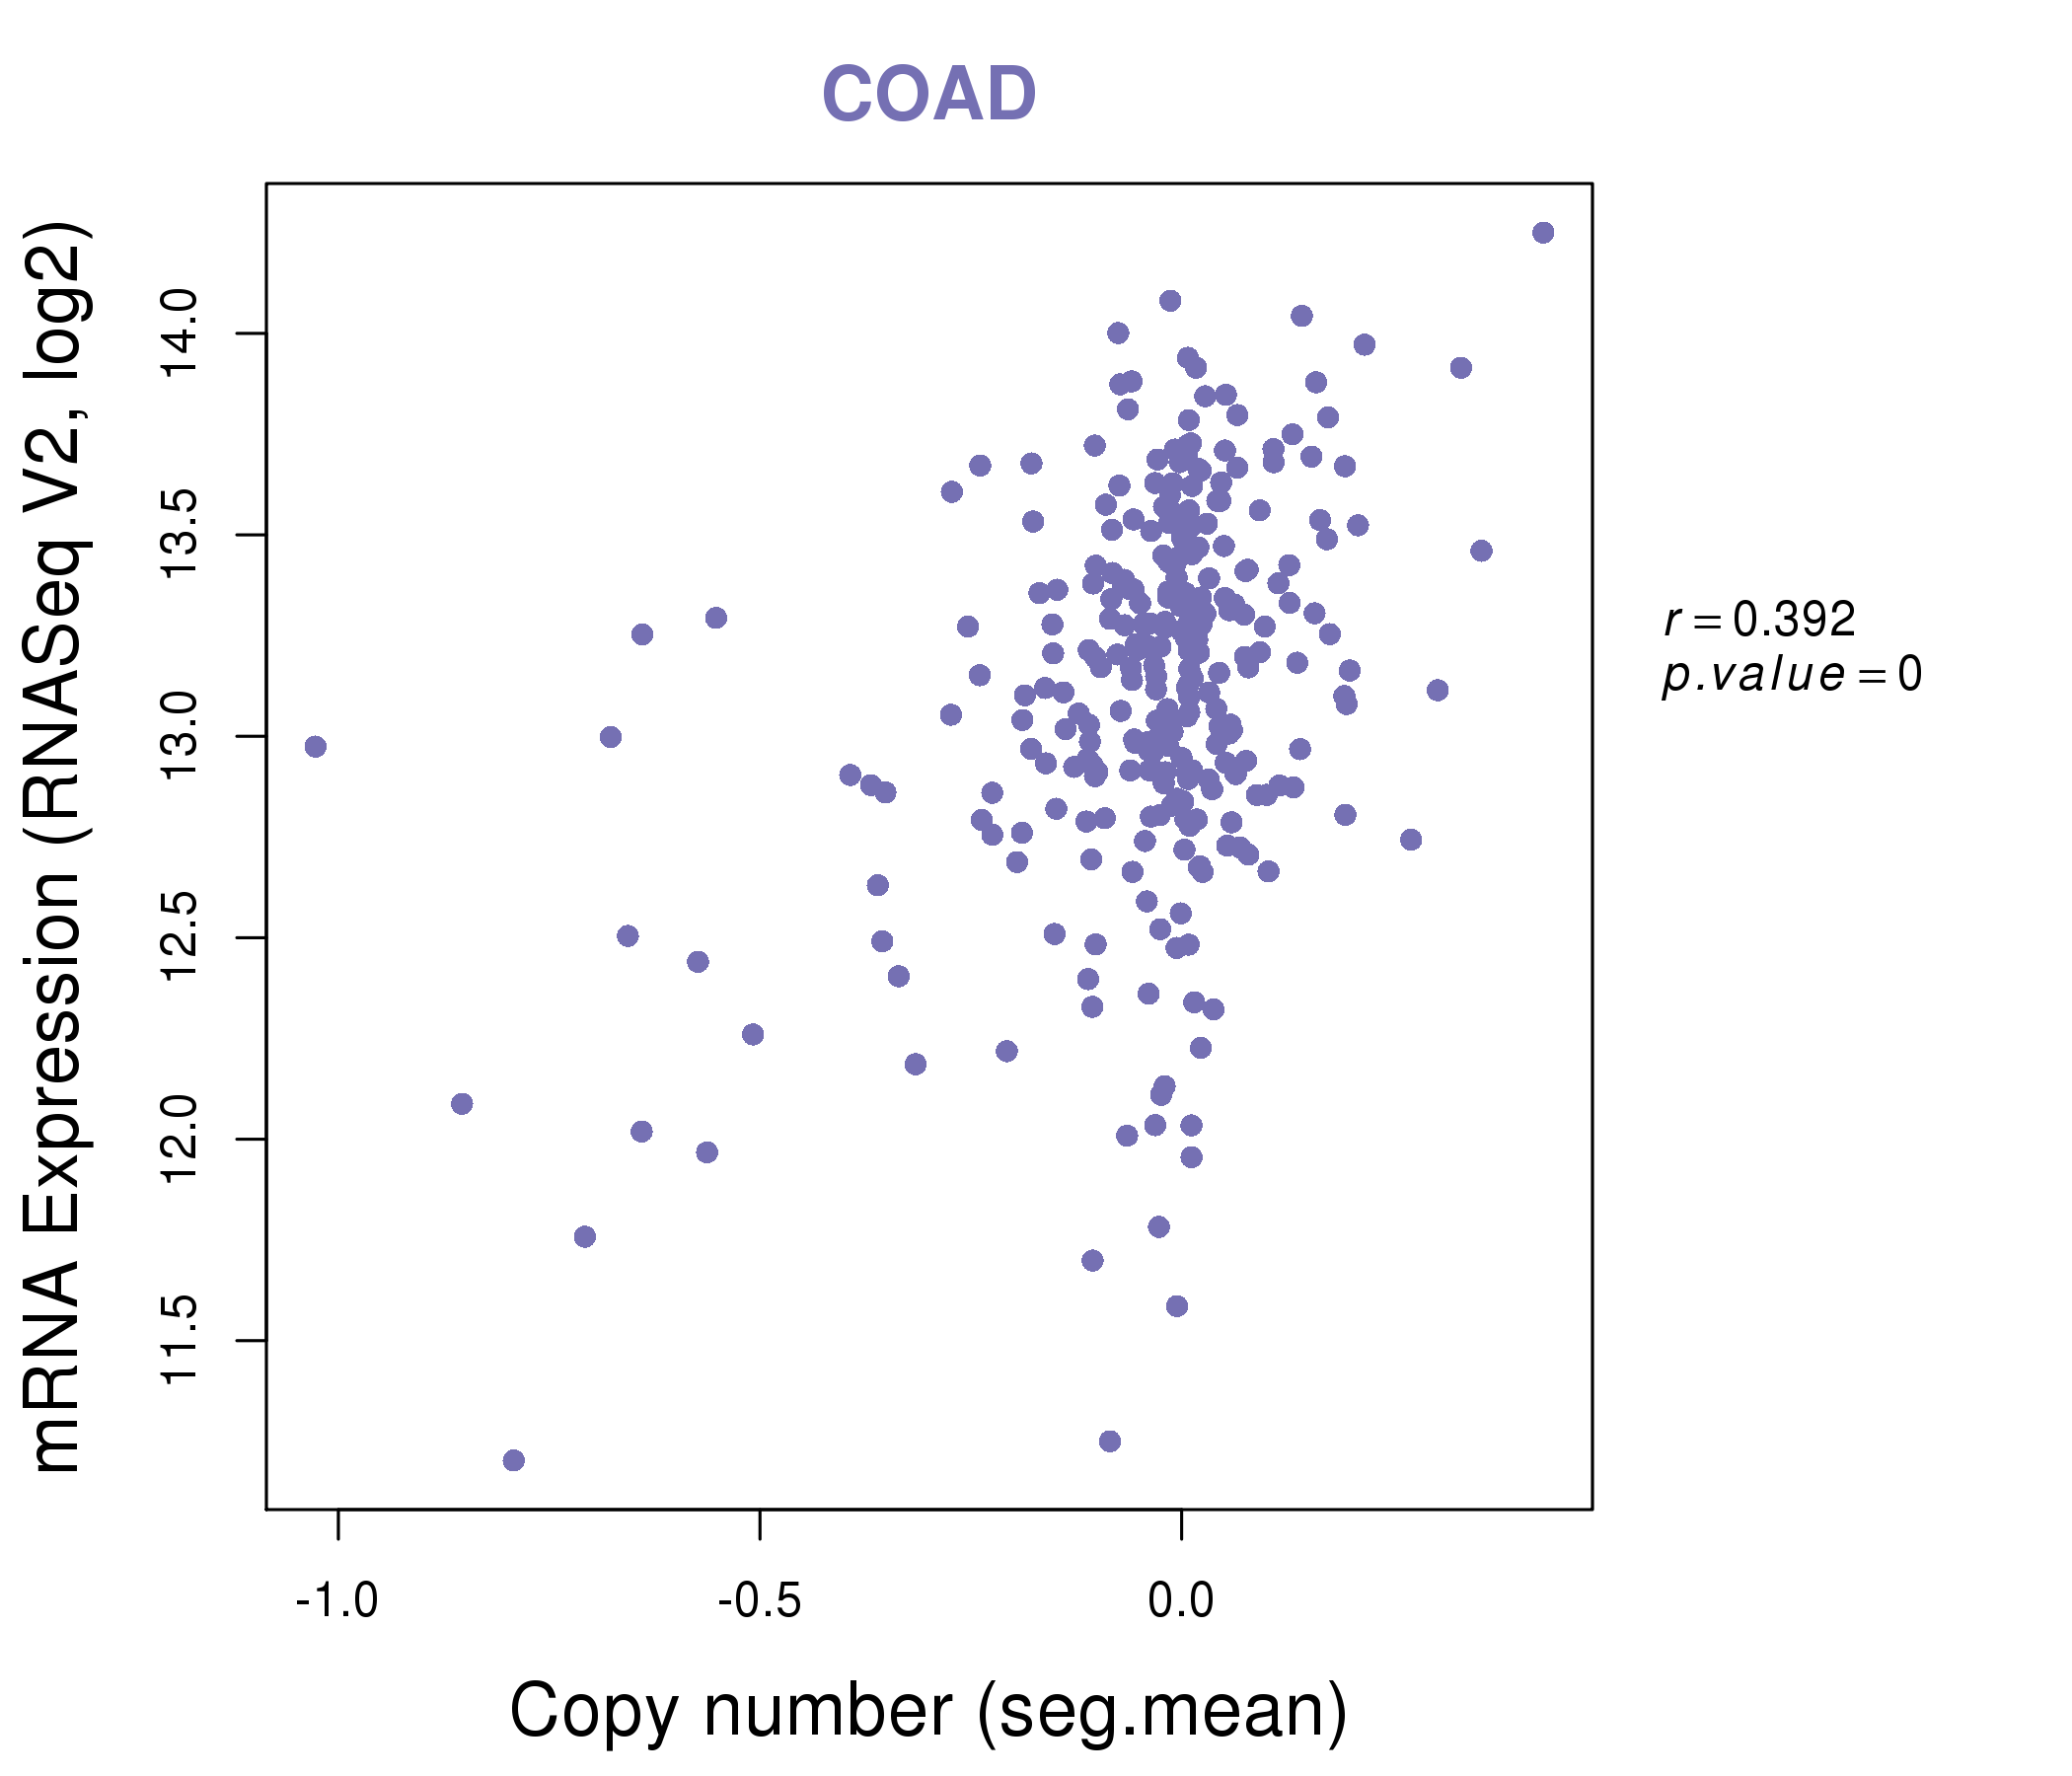
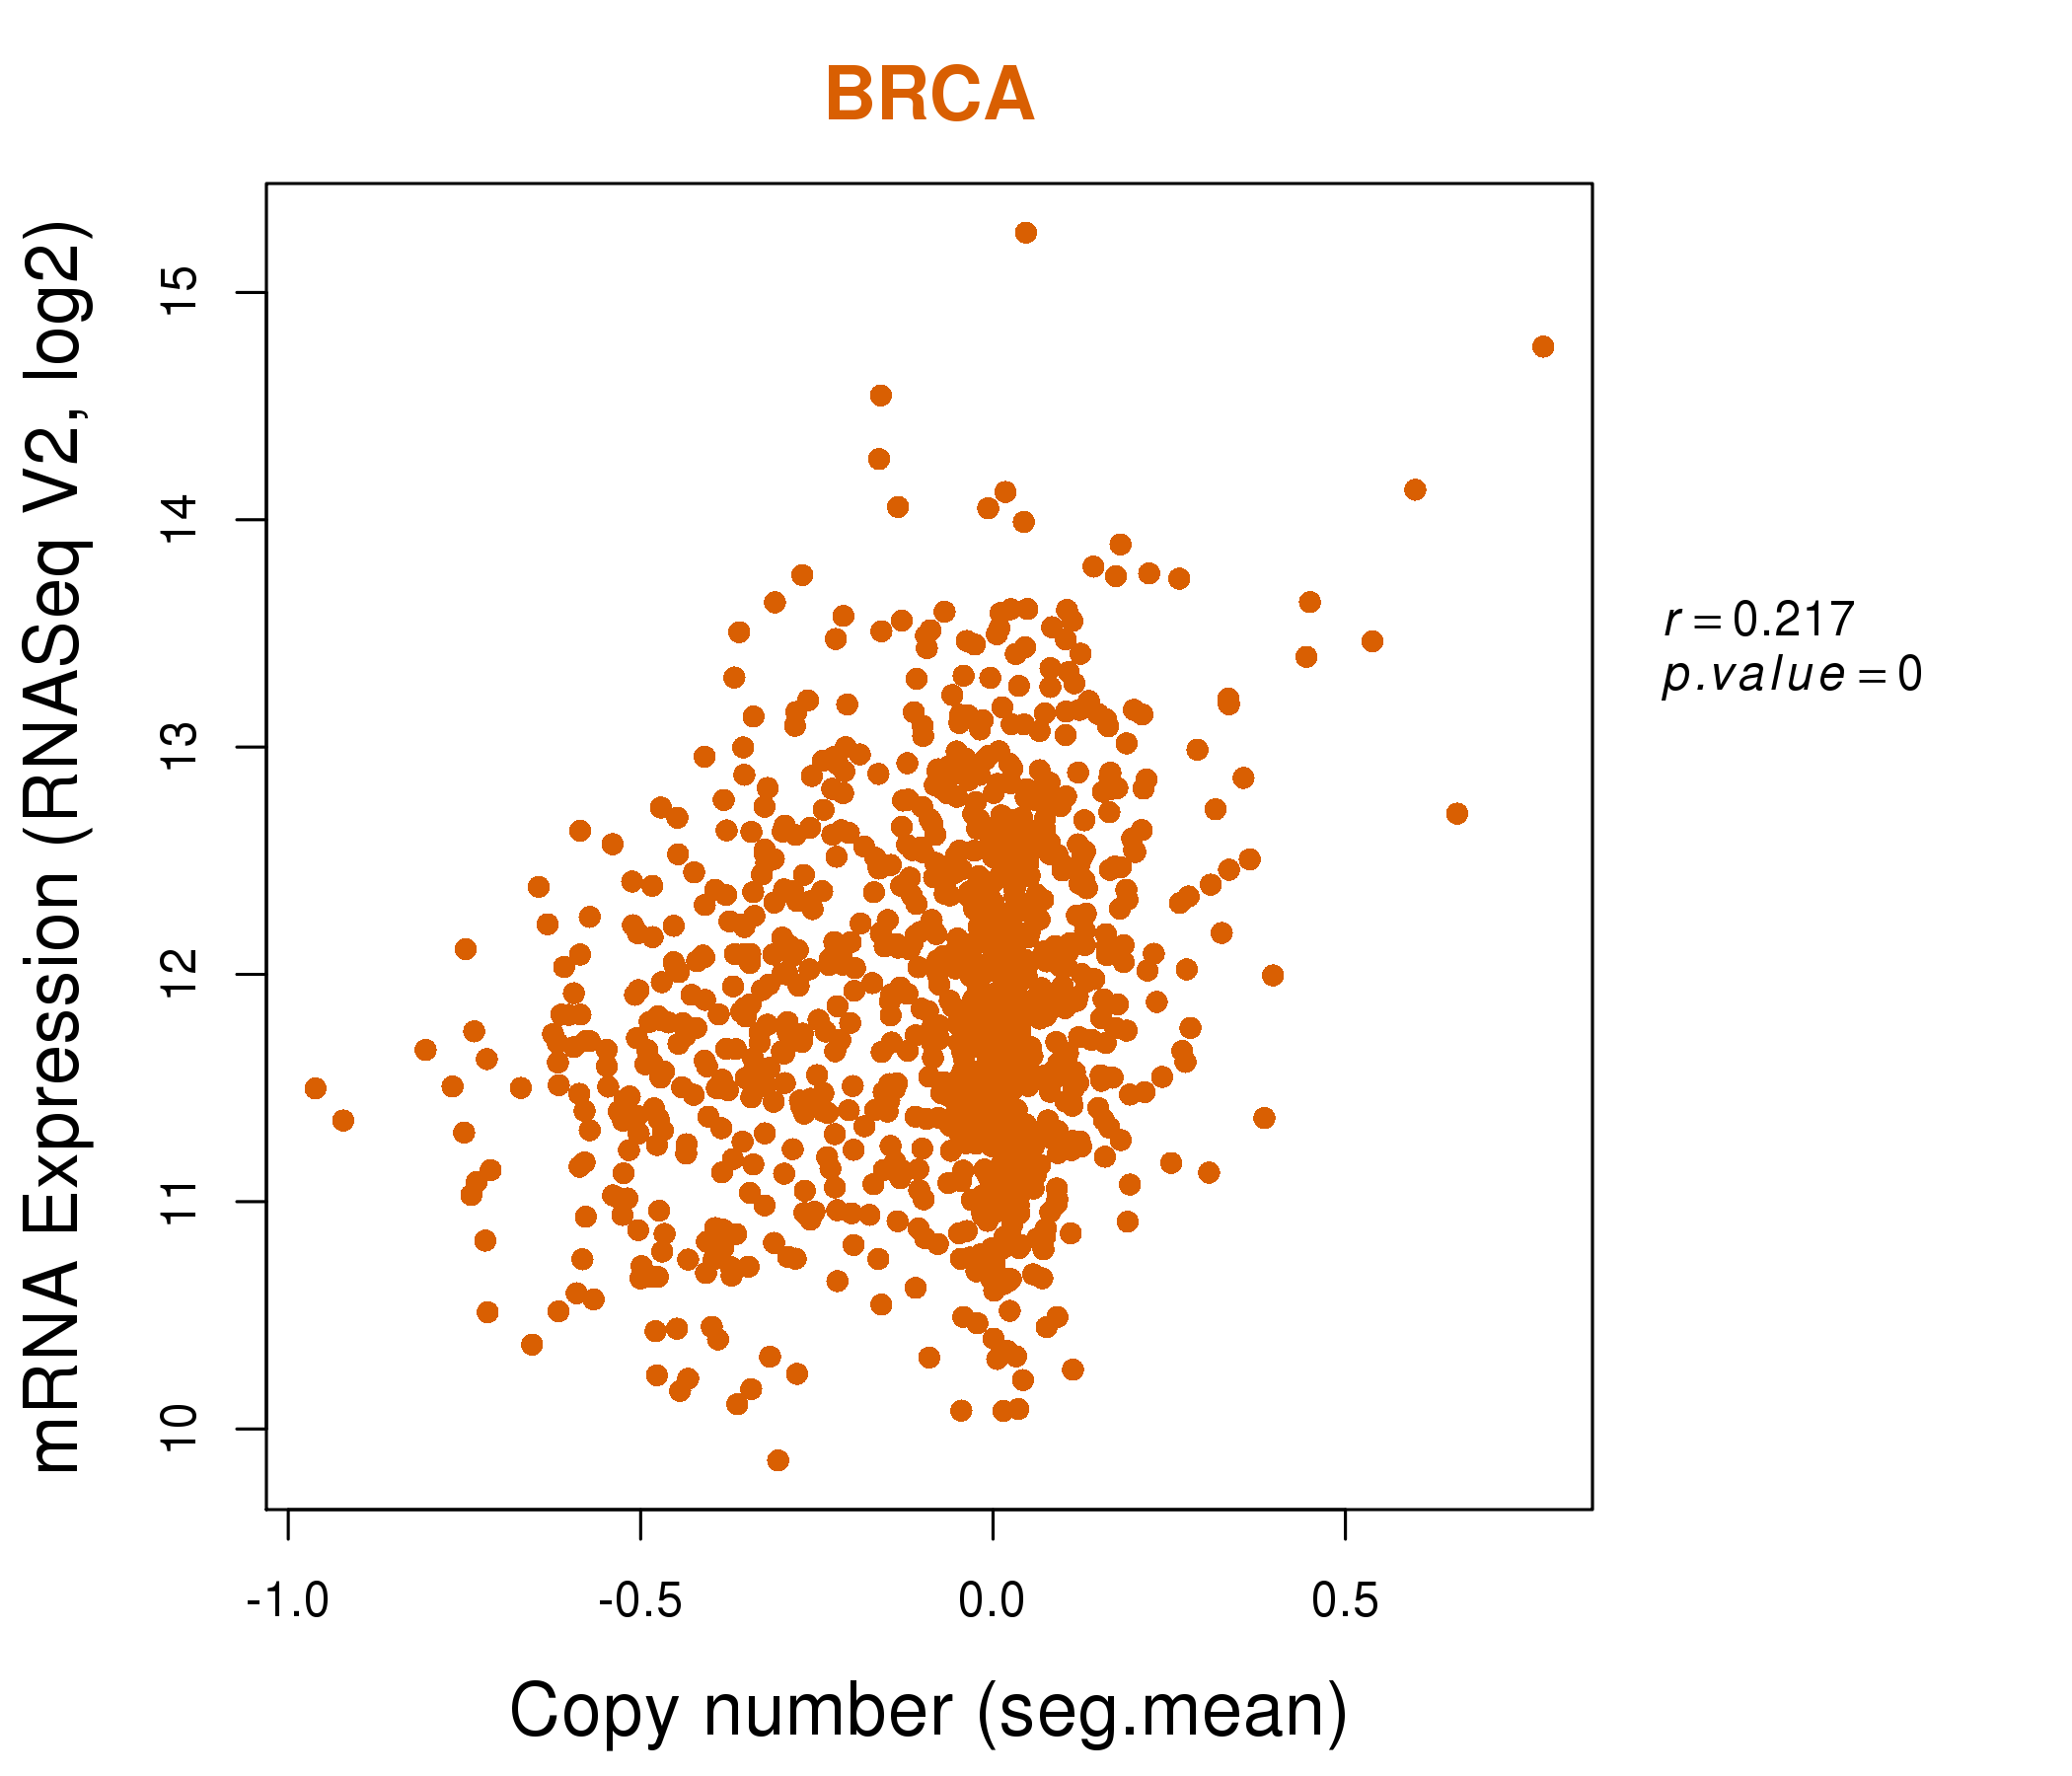
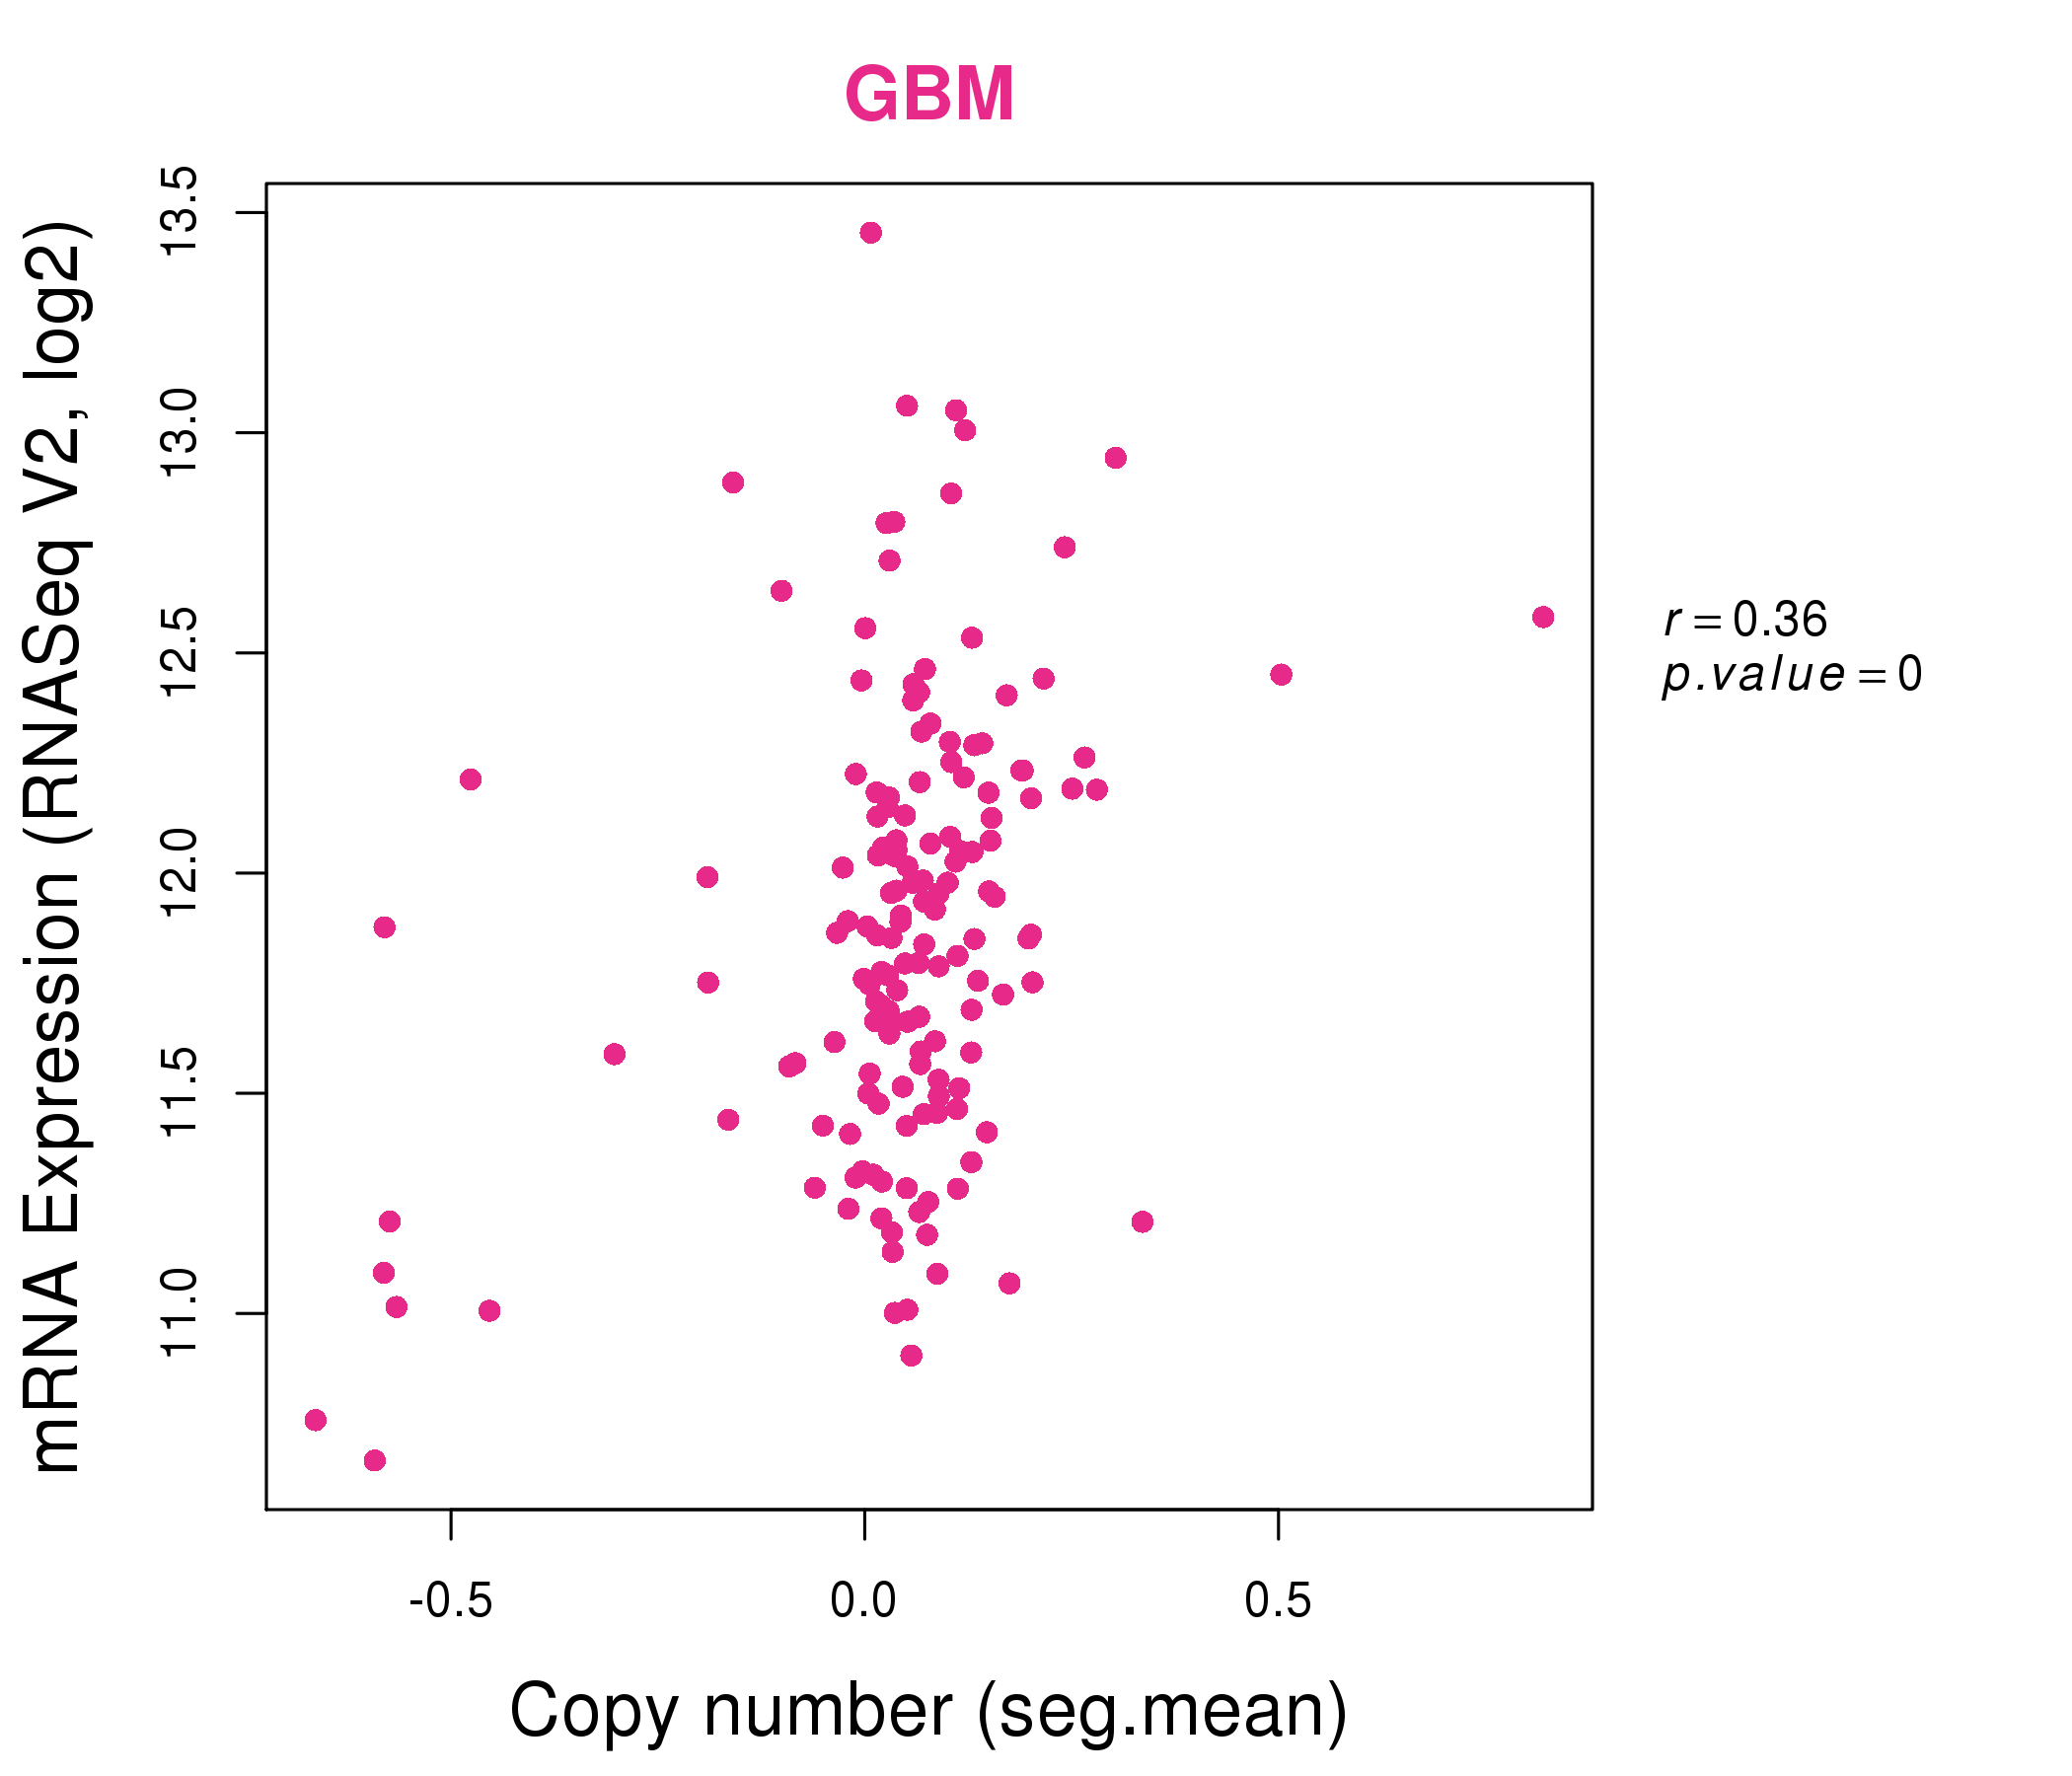
| * Copy number data were extracted from TCGA using R package TCGA-Assembler. The URLs of all public data files on TCGA DCC data server were gathered on Jan-05-2015. Function ProcessCNAData in TCGA-Assembler package was used to obtain gene-level copy number value which is calculated as the average copy number of the genomic region of a gene. |
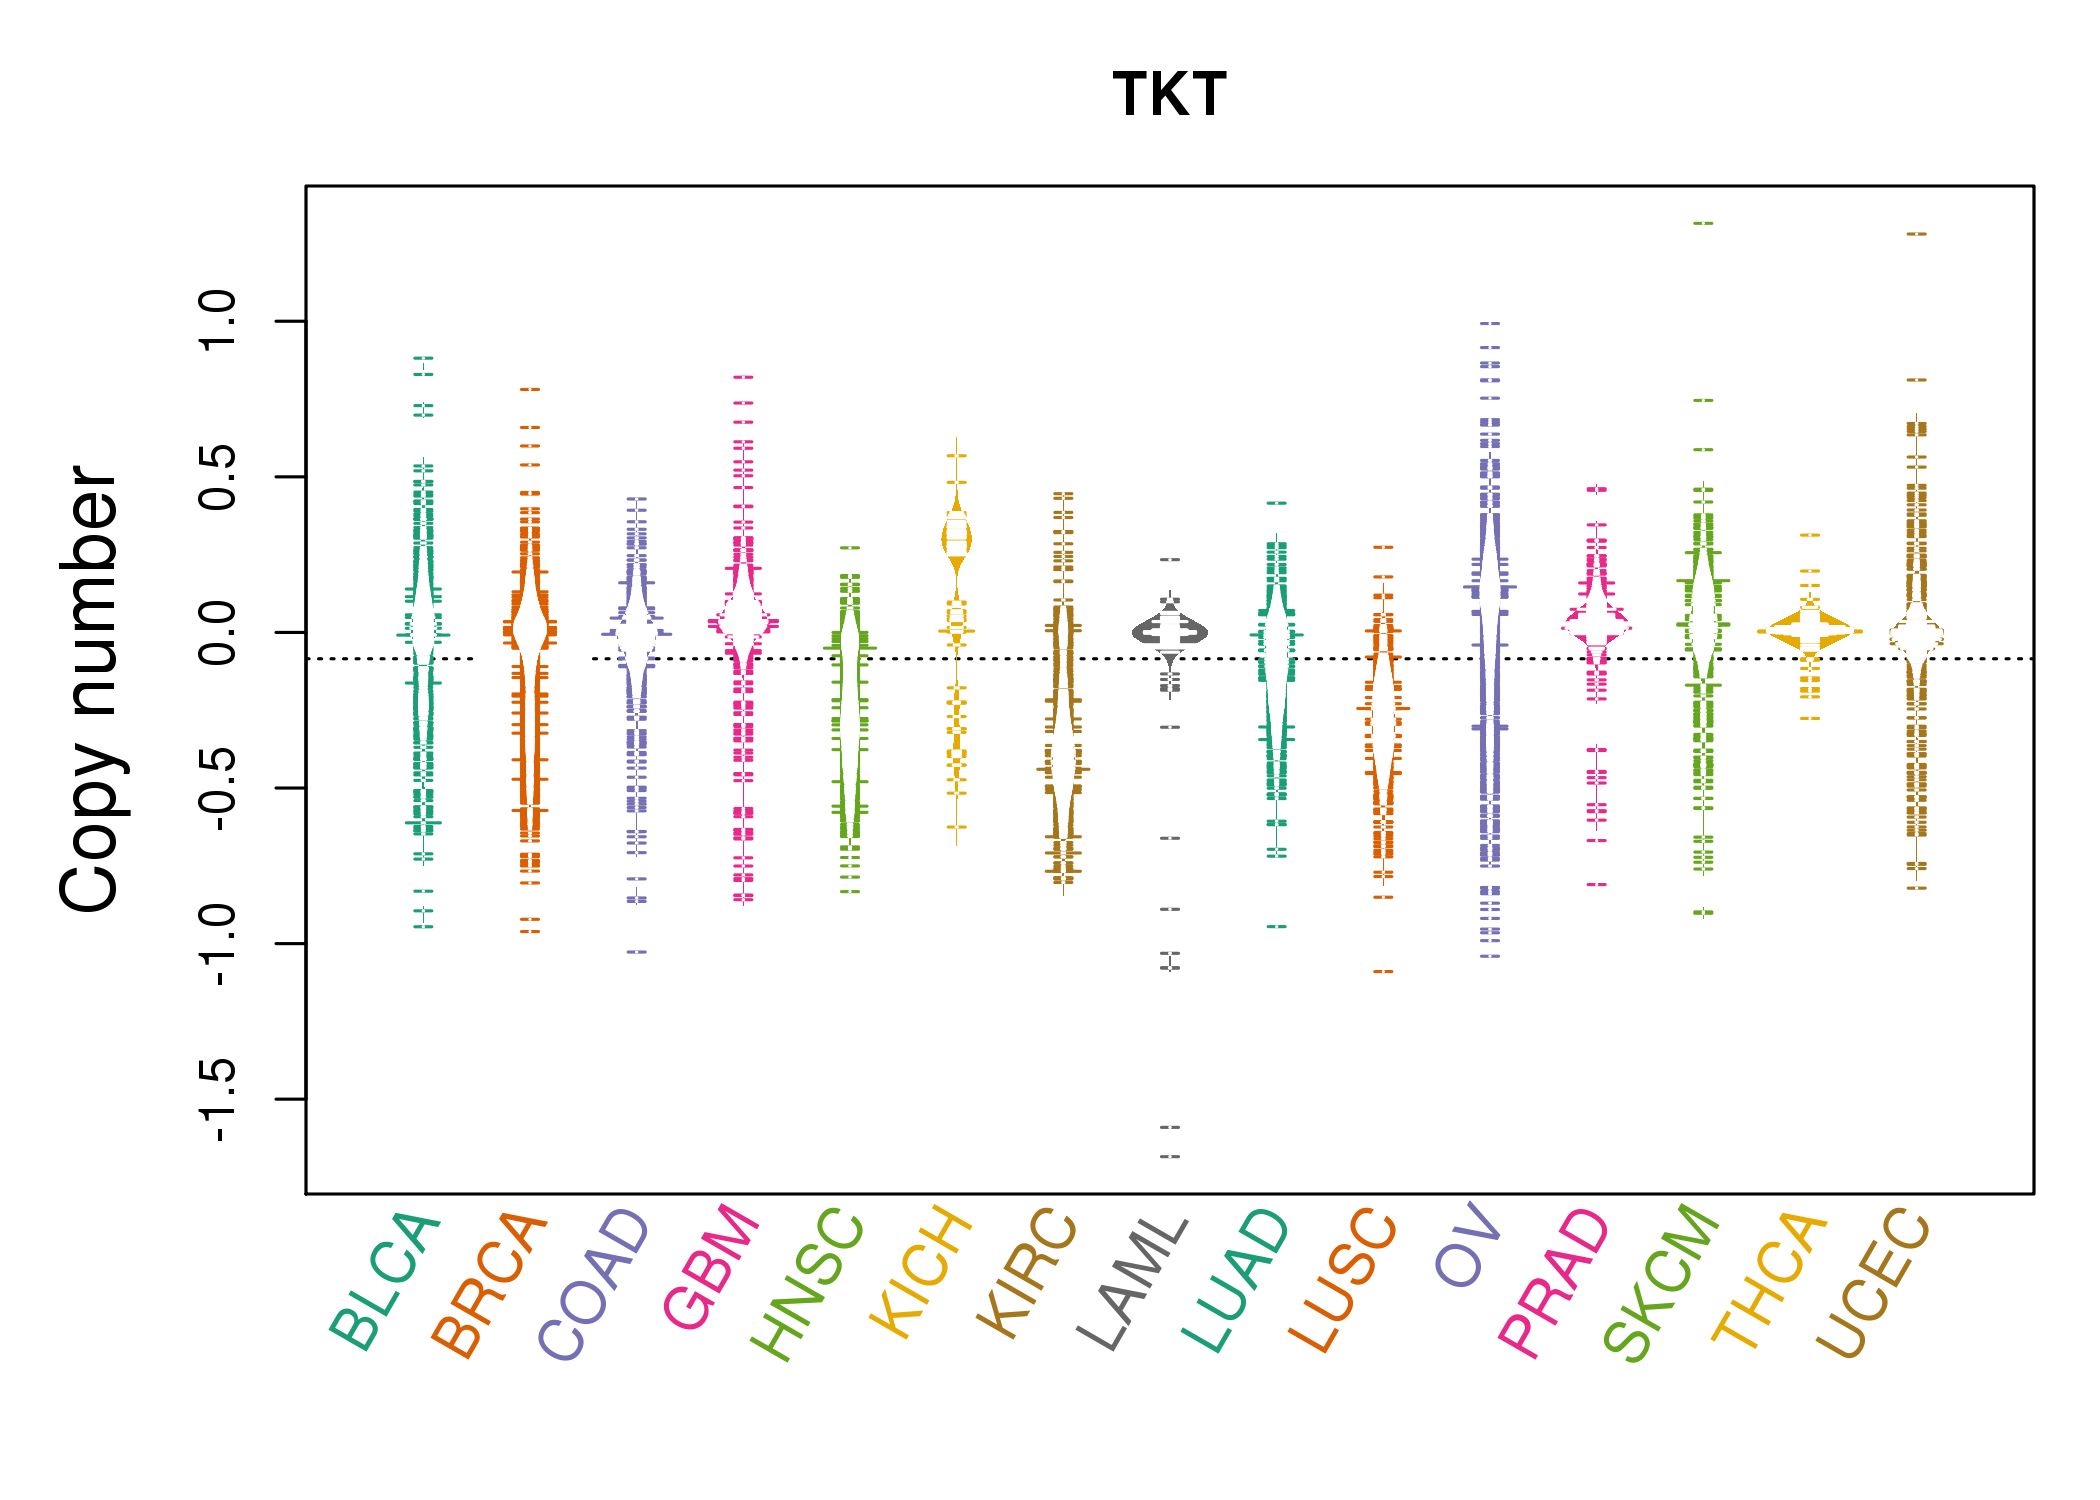 |
| cf) Tissue ID[Tissue type]: BLCA[Bladder Urothelial Carcinoma], BRCA[Breast invasive carcinoma], CESC[Cervical squamous cell carcinoma and endocervical adenocarcinoma], COAD[Colon adenocarcinoma], GBM[Glioblastoma multiforme], Glioma Low Grade, HNSC[Head and Neck squamous cell carcinoma], KICH[Kidney Chromophobe], KIRC[Kidney renal clear cell carcinoma], KIRP[Kidney renal papillary cell carcinoma], LAML[Acute Myeloid Leukemia], LUAD[Lung adenocarcinoma], LUSC[Lung squamous cell carcinoma], OV[Ovarian serous cystadenocarcinoma ], PAAD[Pancreatic adenocarcinoma], PRAD[Prostate adenocarcinoma], SKCM[Skin Cutaneous Melanoma], STAD[Stomach adenocarcinoma], THCA[Thyroid carcinoma], UCEC[Uterine Corpus Endometrial Carcinoma] |
| Top |
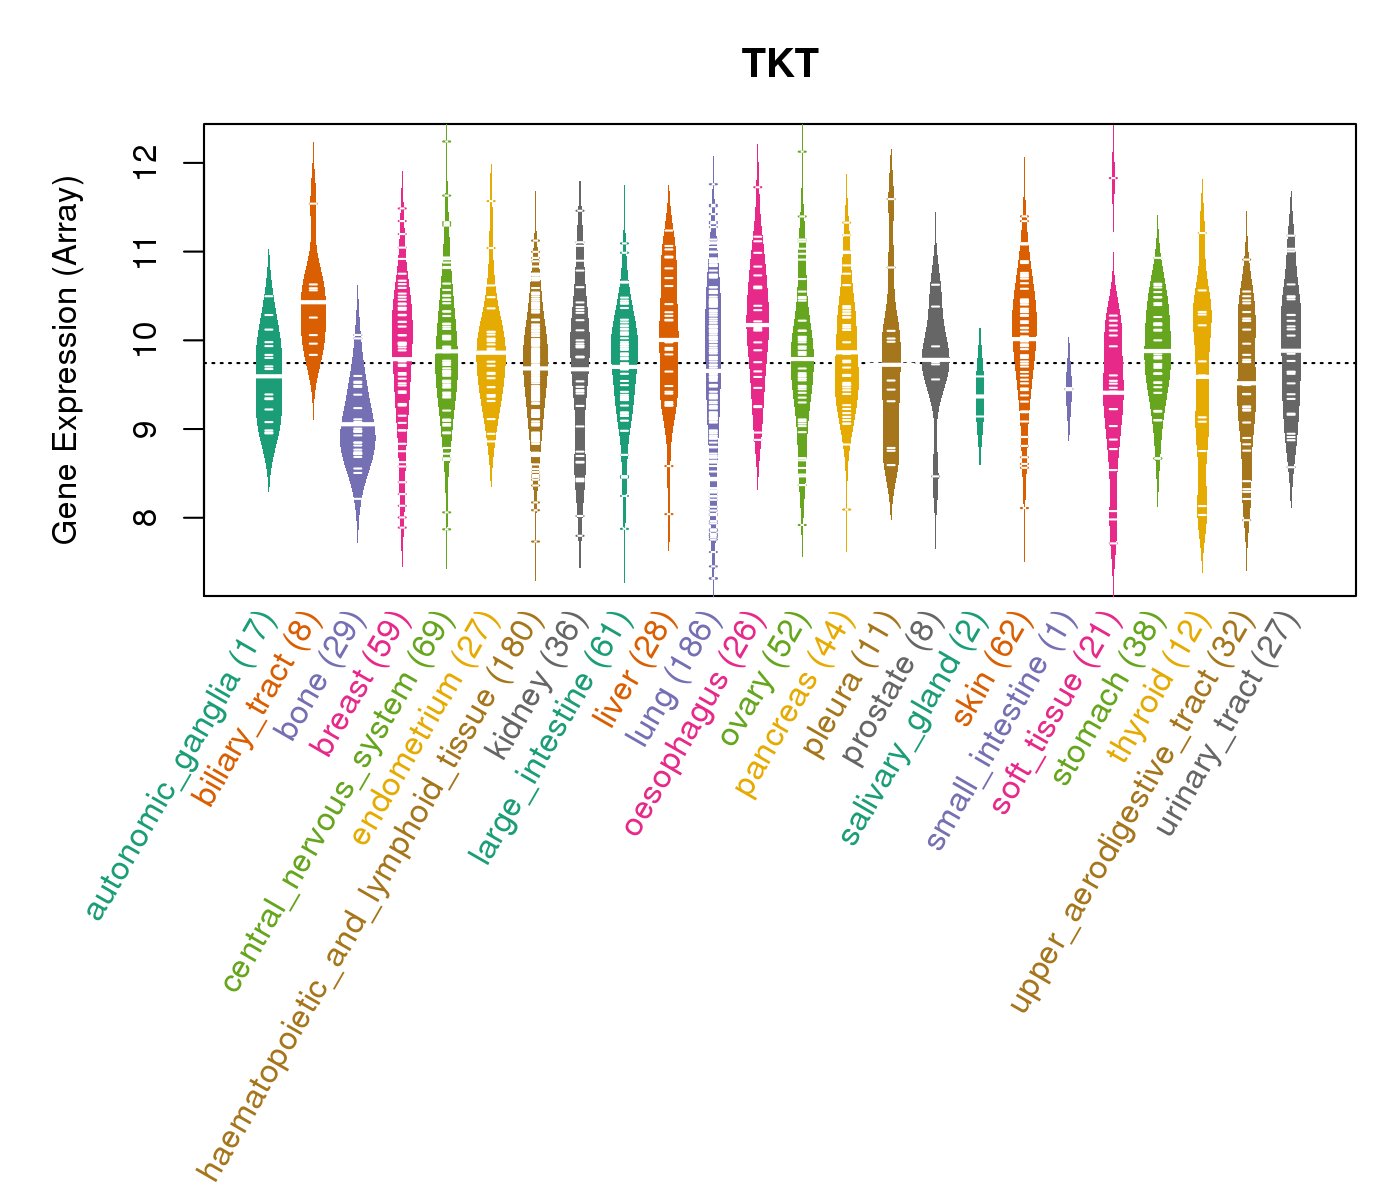
| Gene Expression for TKT |
| * CCLE gene expression data were extracted from CCLE_Expression_Entrez_2012-10-18.res: Gene-centric RMA-normalized mRNA expression data. |
 |
| * Normalized gene expression data of RNASeqV2 was extracted from TCGA using R package TCGA-Assembler. The URLs of all public data files on TCGA DCC data server were gathered at Jan-05-2015. Only eight cancer types have enough normal control samples for differential expression analysis. (t test, adjusted p<0.05 (using Benjamini-Hochberg FDR)) |
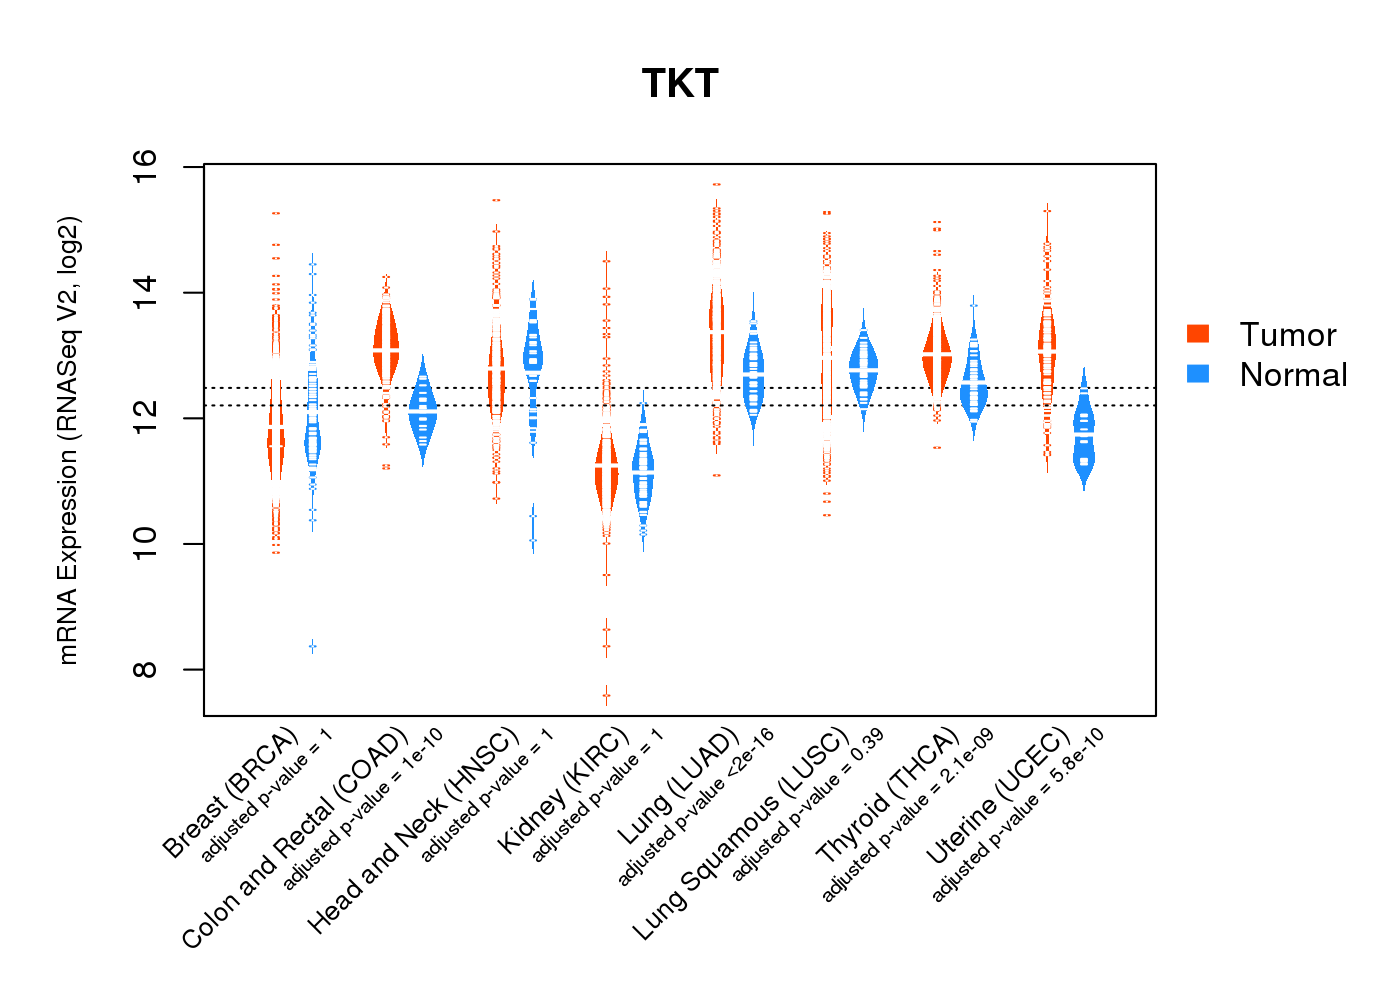 |
| Top |
| * This plots show the correlation between CNV and gene expression. |
: Open all plots for all cancer types
 |
|
 |
|
| Top |
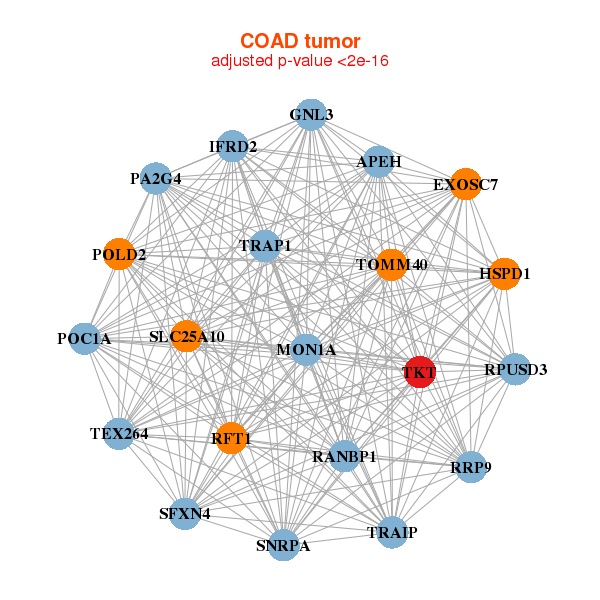
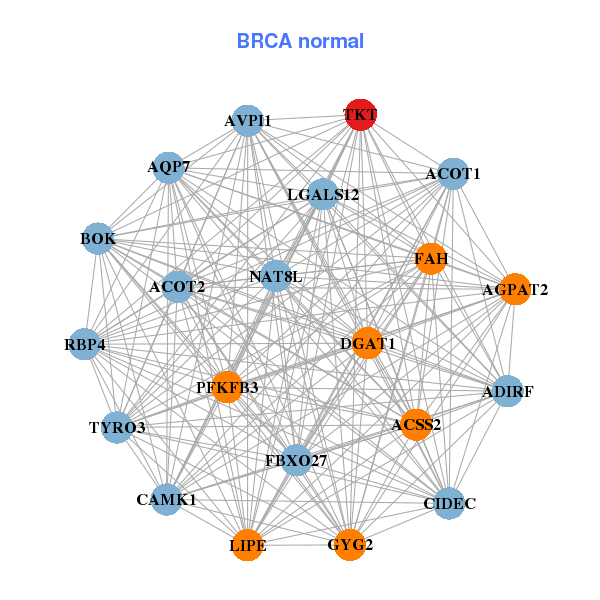
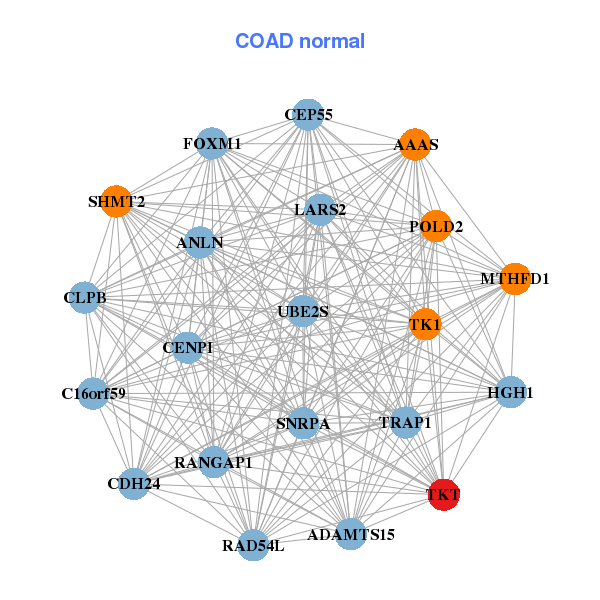
| Gene-Gene Network Information |
| * Co-Expression network figures were drawn using R package igraph. Only the top 20 genes with the highest correlations were shown. Red circle: input gene, orange circle: cell metabolism gene, sky circle: other gene |
: Open all plots for all cancer types
 |
|
| ALDH3A1,BCL2L10,C7orf33,CDHR2,GAGE12J,GAGE13,GAGE2B, GAGE8,GPX2,IQCF2,LOC285629,NKX2-4,PYY2,RBMXL2, TKTL1,TPH1,UGT1A5,UPK3B,VCX,VCX3A,VCY | ADAP2,AIF1,ARPC2,ATP1B3,CTSC,ECSCR,FKBP1A, FLI1,GLRX,GNG11,ITGAE,LMO2,LY96,NTAN1, PECAM1,PPAP2A,RALB,TKTL1,TPST2,UBE2A,VOPP1 |
 |
|
| C2orf82,CADM2,CDH22,CPLX2,CPNE9,DMRT3,FSD1, GLYATL3,HULC,INHBB,KCNK16,KIAA1257,LOC441454,MAGEA9B, NOTUM,NTS,PLA2G2E,TBX4,TDRD1,TKTL1,ZNF556 | APOL4,C3orf79,CCL2,CD274,CXCL10,FCGR1A,FCGR1B, FCGR1C,HAPLN3,IDO1,IL27,LHX8,LOC400696,LOC400759, MNDA,PAQR9,PER4,SCGB1D4,SEPT14,TKTL1,VAMP5 |
| * Co-Expression network figures were drawn using R package igraph. Only the top 20 genes with the highest correlations were shown. Red circle: input gene, orange circle: cell metabolism gene, sky circle: other gene |
: Open all plots for all cancer types
| Top |
: Open all interacting genes' information including KEGG pathway for all interacting genes from DAVID
| Top |
| Pharmacological Information for TKT |
| There's no related Drug. |
| Top |
| Cross referenced IDs for TKT |
| * We obtained these cross-references from Uniprot database. It covers 150 different DBs, 18 categories. http://www.uniprot.org/help/cross_references_section |
: Open all cross reference information
|
Copyright © 2016-Present - The Univsersity of Texas Health Science Center at Houston @ |