|
||||||||||||||||||||
| |
| Phenotypic Information (metabolism pathway, cancer, disease, phenome) |
| |
| |
| Gene-Gene Network Information: Co-Expression Network, Interacting Genes & KEGG |
| |
|


| Gene Summary for TP53 |
| Basic gene info. | Gene symbol | TP53 |
| Gene name | tumor protein p53 | |
| Synonyms | BCC7|LFS1|P53|TRP53 | |
| Cytomap | UCSC genome browser: 17p13.1 | |
| Genomic location | chr17 :7571719-7578811 | |
| Type of gene | protein-coding | |
| RefGenes | NM_000546.5, NM_001126112.2,NM_001126113.2,NM_001126114.2,NM_001126115.1, NM_001126116.1,NM_001126117.1,NM_001126118.1,NM_001276695.1, NM_001276696.1,NM_001276697.1,NM_001276698.1,NM_001276699.1, NM_001276760.1,NM_001276761.1, | |
| Ensembl id | ENSG00000141510 | |
| Description | antigen NY-CO-13cellular tumor antigen p53mutant tumor protein 53p53 tumor suppressorphosphoprotein p53transformation-related protein 53tumor protein 53 | |
| Modification date | 20141222 | |
| dbXrefs | MIM : 191170 | |
| HGNC : HGNC | ||
| Ensembl : ENSG00000141510 | ||
| HPRD : 01859 | ||
| Vega : OTTHUMG00000162125 | ||
| Protein | UniProt: P04637 go to UniProt's Cross Reference DB Table | |
| Expression | CleanEX: HS_TP53 | |
| BioGPS: 7157 | ||
| Gene Expression Atlas: ENSG00000141510 | ||
| The Human Protein Atlas: ENSG00000141510 | ||
| Pathway | NCI Pathway Interaction Database: TP53 | |
| KEGG: TP53 | ||
| REACTOME: TP53 | ||
| ConsensusPathDB | ||
| Pathway Commons: TP53 | ||
| Metabolism | MetaCyc: TP53 | |
| HUMANCyc: TP53 | ||
| Regulation | Ensembl's Regulation: ENSG00000141510 | |
| miRBase: chr17 :7,571,719-7,578,811 | ||
| TargetScan: NM_000546 | ||
| cisRED: ENSG00000141510 | ||
| Context | iHOP: TP53 | |
| cancer metabolism search in PubMed: TP53 | ||
| UCL Cancer Institute: TP53 | ||
| Assigned class in ccmGDB | A - This gene has a literature evidence and it belongs to cancer gene. | |
| References showing role of TP53 in cancer cell metabolism | 1. Wong EYL, Wong SCC, Chan CML, Lam EKY, Ho LY, et al. (2015) TP53-induced glycolysis and apoptosis regulator promotes proliferation and invasiveness of nasopharyngeal carcinoma cells. Oncology letters 9: 569-574. go to article 2. Shen L, O’Shea JM, Kaadige MR, Cunha S, Wilde BR, et al. (2015) Metabolic reprogramming in triple-negative breast cancer through Myc suppression of TXNIP. Proceedings of the National Academy of Sciences 112: 5425-5430. go to article 3. Mishra P, Ambs S (2015) Metabolic signatures of human breast cancer. Molecular & cellular oncology 2: e992217. go to article | |
| Top |
| Phenotypic Information for TP53(metabolism pathway, cancer, disease, phenome) |
| Cancer | CGAP: TP53 |
| Familial Cancer Database: TP53 | |
| * This gene is included in those cancer gene databases. |
|
|
|
|
|
| . | ||||||||||||||
Oncogene 1 | Significant driver gene in BLCA 6, BRCA 7, CLL 8, COAD 9, CRC 10, DLBCL 11, ESO 12, GBM 13, HNSC 14, KIRC 15, LAML 16, LUAD 17, LUSC 18, MEL 19, MM 20, OV 21, PRAD 22, UCEC 23, STAD 24, STAD 25, SKCM 26, THCA 27, GBM 28, HNSC 29, SCLC 30, PAAD 31, | |||||||||||||||||||
| cf) number; DB name 1 Oncogene; http://nar.oxfordjournals.org/content/35/suppl_1/D721.long, 2 Tumor Suppressor gene; https://bioinfo.uth.edu/TSGene/, 3 Cancer Gene Census; http://www.nature.com/nrc/journal/v4/n3/abs/nrc1299.html, 4 CancerGenes; http://nar.oxfordjournals.org/content/35/suppl_1/D721.long, 5 Network of Cancer Gene; http://ncg.kcl.ac.uk/index.php, 6 http://www.nature.com/nature/journal/vaop/ncurrent/full/nature12965.html, 7 http://www.nature.com/nature/journal/v490/n7418/full/nature11412.html, 8 http://www.nature.com/nature/journal/v505/n7484/full/nature12912.html, 9 http://www.nature.com/nature/journal/v487/n7407/full/nature11252.html, 10 http://www.nature.com/nature/journal/v505/n7484/full/nature12912.html, 11 http://www.nature.com/nature/journal/v505/n7484/full/nature12912.html, 12 http://www.nature.com/nature/journal/v505/n7484/full/nature12912.html, 13 http://www.sciencedirect.com/science/article/pii/S0092867413012087, 14 https://www.sciencemag.org/content/333/6046/1157, 15 http://www.nature.com/nature/journal/v499/n7456/full/nature12222.html, 16 http://www.nejm.org/doi/full/10.1056/NEJMoa1301689, 17 http://www.sciencedirect.com/science/article/pii/S0092867412010227, 18 http://www.nature.com/nature/journal/v489/n7417/full/nature11404.html, 19 http://www.nature.com/nature/journal/v505/n7484/full/nature12912.html, 20 http://www.nature.com/nature/journal/v505/n7484/full/nature12912.html, 21 http://www.nature.com/nature/journal/v474/n7353/full/nature10166.html, 22 http://www.nature.com/nature/journal/v505/n7484/full/nature12912.html, 23 http://www.nature.com/nature/journal/v497/n7447/full/nature12113.html, 24 http://www.nature.com/ng/journal/v46/n6/full/ng.2983.html, 25 http://www.nature.com/nature/journal/v513/n7517/full/nature13480.html, 26 http://www.sciencedirect.com/science/article/pii/S0092867415006340, 27 http://www.sciencedirect.com/science/article/pii/S0092867414012380, 28 http://www.nejm.org/doi/full/10.1056/NEJMoa1402121, 29 http://www.nature.com/nature/journal/v517/n7536/full/nature14129.html, 30 http://www.nature.com/nature/journal/v524/n7563/full/nature14664.html, 31 http://www.nature.com/nature/journal/v518/n7540/full/nature14169.html, 32Therapeutic Vulnerabilities in Cancer; http://cbio.mskcc.org/cancergenomics/statius/ |
| Nat Rev Drug Discovery, 2013, 12: 829, doi: 10.1038/nrd4145 | |
| OMIM | 133239; phenotype. 133239; phenotype. 151623; phenotype. 151623; phenotype. 191170; gene+phenotype. 191170; gene+phenotype. 202300; phenotype. 202300; phenotype. 211980; phenotype. 211980; phenotype. 260500; phenotype. 260500; phenotype. 275355; phenotype. 275355; phenotype. 614740; phenotype. 614740; phenotype. |
| Orphanet | 1333; Familial pancreatic carcinoma. 1333; Familial pancreatic carcinoma. 1501; Adrenocortical carcinoma. 1501; Adrenocortical carcinoma. 251576; Gliosarcoma. 251576; Gliosarcoma. 251579; Giant cell glioblastoma. 251579; Giant cell glioblastoma. 2807; Papilloma of choroid plexus. 2807; Papilloma of choroid plexus. 3318; Essential thrombocythemia. 3318; Essential thrombocythemia. 524; Li-Fraumeni syndrome. 524; Li-Fraumeni syndrome. 67038; B-cell chronic lymphocytic leukemia. 67038; B-cell chronic lymphocytic leukemia. 99860; Precursor B-cell acute lymphoblastic leukemia. 99860; Precursor B-cell acute lymphoblastic leukemia. |
| Disease | KEGG Disease: TP53 |
| MedGen: TP53 (Human Medical Genetics with Condition) | |
| ClinVar: TP53 | |
| Phenotype | MGI: TP53 (International Mouse Phenotyping Consortium) |
| PhenomicDB: TP53 | |
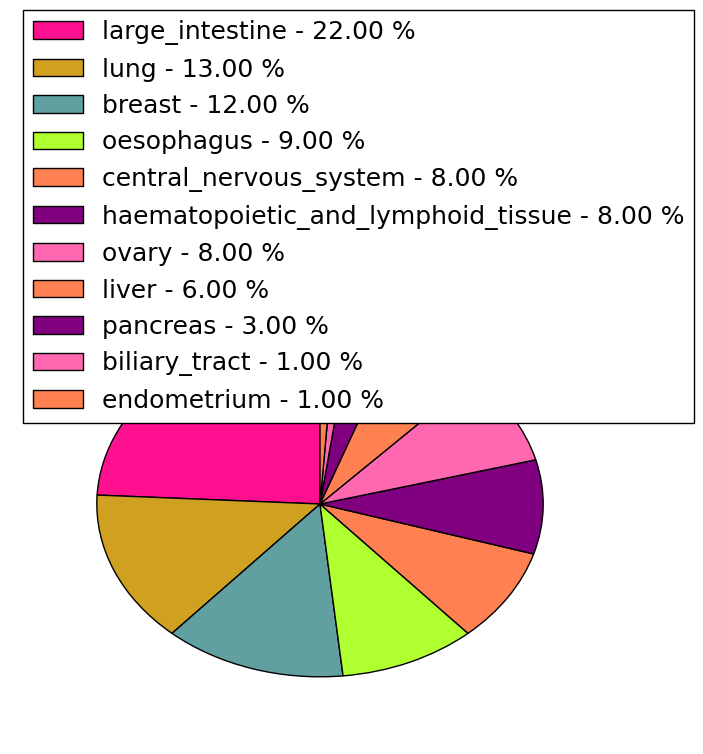
| Mutations for TP53 |
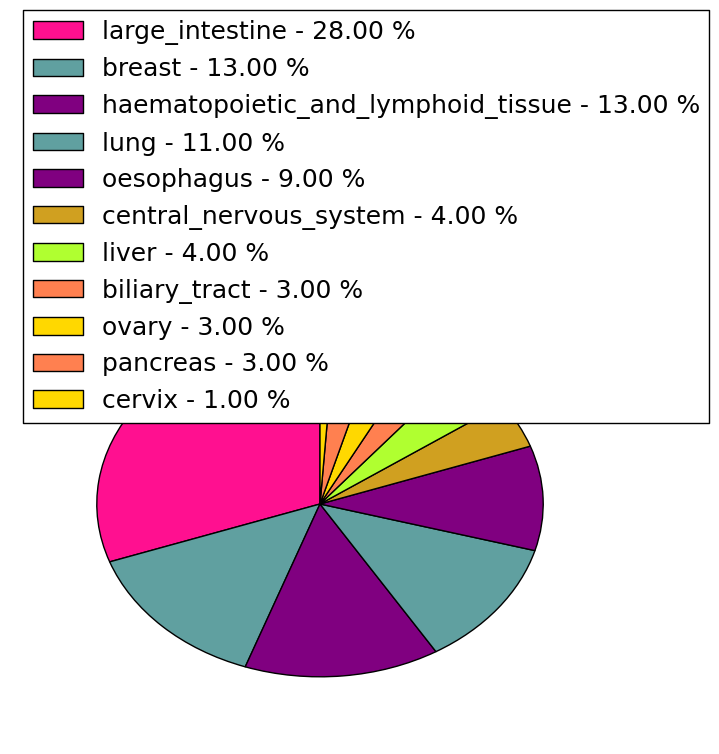
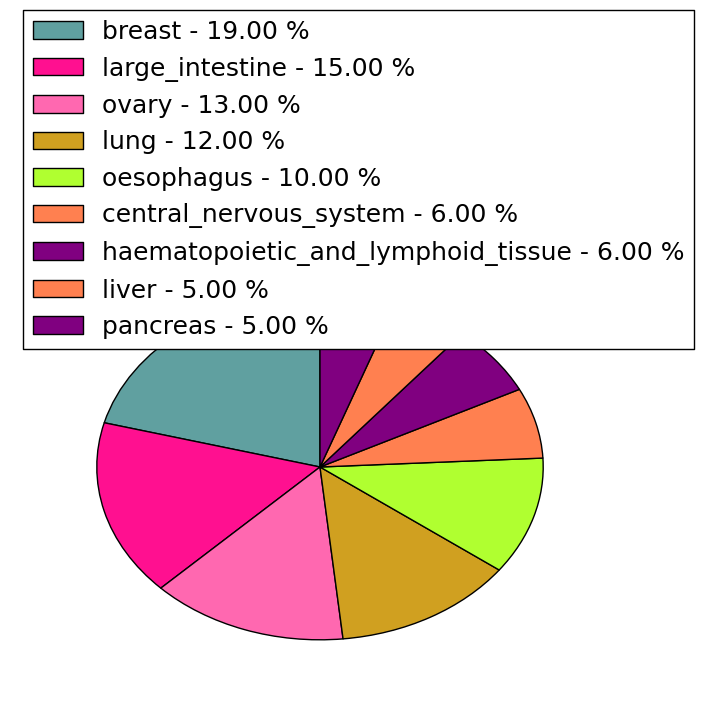
| * Under tables are showing count per each tissue to give us broad intuition about tissue specific mutation patterns.You can go to the detailed page for each mutation database's web site. |
| - Statistics for Tissue and Mutation type | Top |
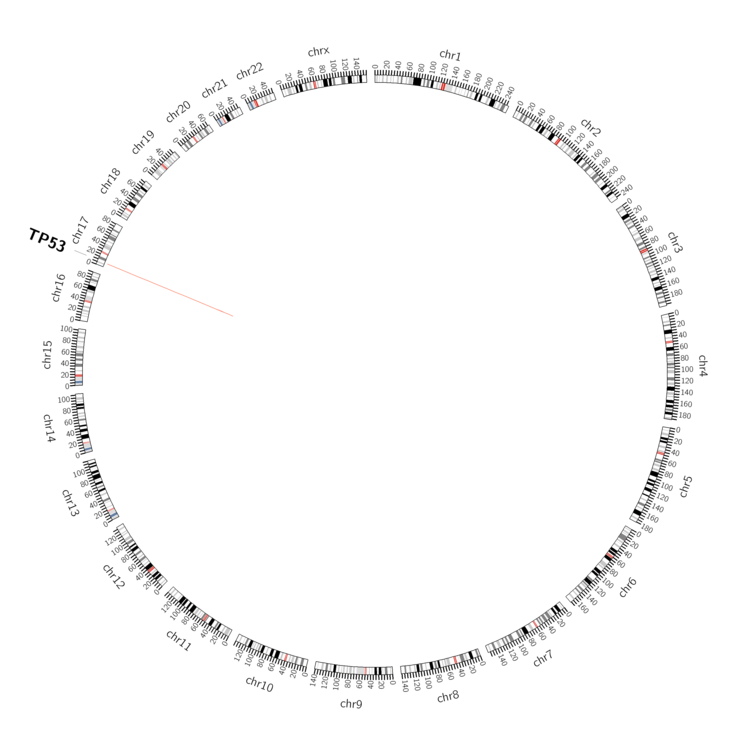 |
| - For Inter-chromosomal Variations |
| There's no inter-chromosomal structural variation. |
| - For Intra-chromosomal Variations |
| * Intra-chromosomal variantions includes 'intrachromosomal amplicon to amplicon', 'intrachromosomal amplicon to non-amplified dna', 'intrachromosomal deletion', 'intrachromosomal fold-back inversion', 'intrachromosomal inversion', 'intrachromosomal tandem duplication', 'Intrachromosomal unknown type', 'intrachromosomal with inverted orientation', 'intrachromosomal with non-inverted orientation'. |
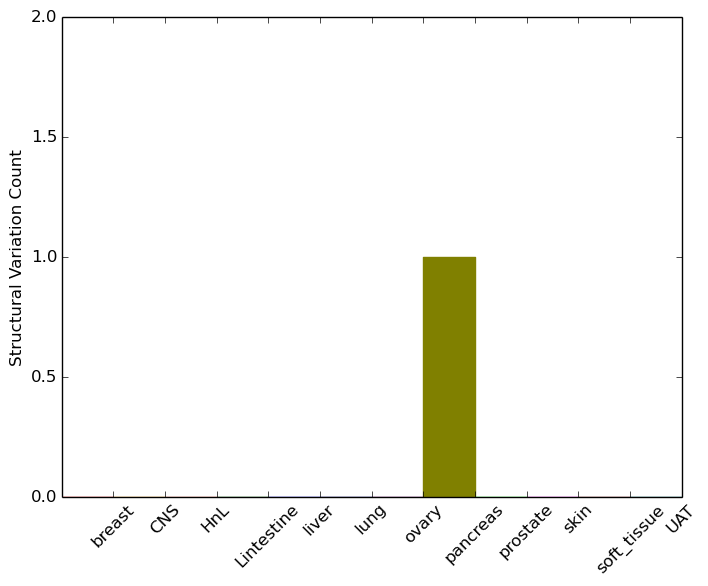 |
| Sample | Symbol_a | Chr_a | Start_a | End_a | Symbol_b | Chr_b | Start_b | End_b |
| pancreas | TP53 | chr17 | 7576890 | 7576910 | TP53 | chr17 | 7576823 | 7576843 |
| cf) Tissue number; Tissue name (1;Breast, 2;Central_nervous_system, 3;Haematopoietic_and_lymphoid_tissue, 4;Large_intestine, 5;Liver, 6;Lung, 7;Ovary, 8;Pancreas, 9;Prostate, 10;Skin, 11;Soft_tissue, 12;Upper_aerodigestive_tract) |
| * From mRNA Sanger sequences, Chitars2.0 arranged chimeric transcripts. This table shows TP53 related fusion information. |
| ID | Head Gene | Tail Gene | Accession | Gene_a | qStart_a | qEnd_a | Chromosome_a | tStart_a | tEnd_a | Gene_a | qStart_a | qEnd_a | Chromosome_a | tStart_a | tEnd_a |
| CB048242 | TP53 | 27 | 239 | 17 | 7571739 | 7571951 | ARHGAP26 | 236 | 307 | 5 | 142297940 | 142298011 | |
| BM991038 | MLF2 | 13 | 305 | 12 | 6857164 | 6857456 | TP53 | 297 | 614 | 17 | 7572411 | 7572728 | |
| AA947588 | TP53 | 2 | 325 | 17 | 7572945 | 7573268 | OSBPL10 | 320 | 521 | 3 | 31964262 | 31964463 | |
| Top |
| There's no copy number variation information in COSMIC data for this gene. |
| Top |
|
 |
| Top |
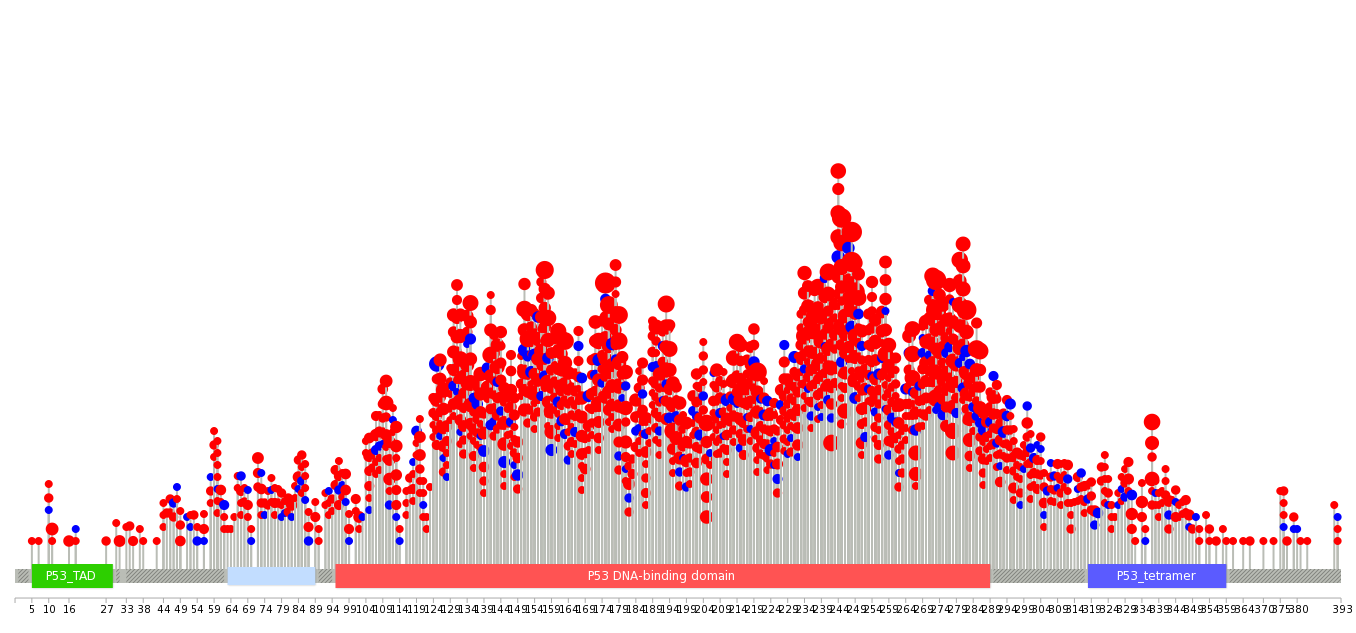
| Stat. for Non-Synonymous SNVs (# total SNVs=13383) | (# total SNVs=428) |
 |  |
(# total SNVs=1122) | (# total SNVs=390) |
 |  |
| Top |
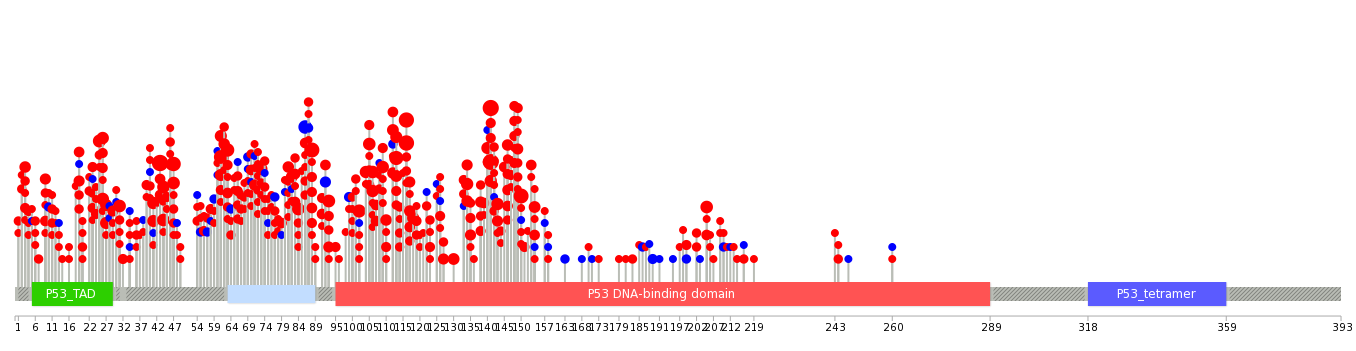
| * When you move the cursor on each content, you can see more deailed mutation information on the Tooltip. Those are primary_site,primary_histology,mutation(aa),pubmedID. |
| GRCh37 position | Mutation(aa) | Unique sampleID count |
| chr17:7578406-7578406 | p.R175H | 951 |
| chr17:7577538-7577538 | p.R248Q | 723 |
| chr17:7577120-7577120 | p.R273H | 713 |
| chr17:7577121-7577121 | p.R273fs*72 | 598 |
| chr17:7577539-7577539 | p.R248W | 553 |
| chr17:7577094-7577094 | p.R282G | 483 |
| chr17:7577548-7577548 | p.G245C | 404 |
| chr17:7577534-7577534 | p.R249S | 342 |
| chr17:7578190-7578190 | p.Y220S | 277 |
| chr17:7578212-7578212 | p.R213* | 273 |
| Top |
|
 |
| Point Mutation/ Tissue ID | 1 | 2 | 3 | 4 | 5 | 6 | 7 | 8 | 9 | 10 | 11 | 12 | 13 | 14 | 15 | 16 | 17 | 18 | 19 | 20 |
| # sample | 25 | 161 | 1 | 210 | 75 | 136 | 9 | 11 | 1 | 12 | 105 | 101 | 218 | 4 | 7 | 23 | 68 | 57 | ||
| # mutation | 25 | 80 | 1 | 204 | 51 | 80 | 9 | 12 | 1 | 12 | 78 | 65 | 94 | 4 | 7 | 20 | 45 | 38 | ||
| nonsynonymous SNV | 23 | 78 | 1 | 151 | 48 | 79 | 9 | 11 | 1 | 11 | 77 | 62 | 91 | 4 | 7 | 19 | 43 | 36 | ||
| synonymous SNV | 2 | 2 | 55 | 3 | 3 | 1 | 1 | 1 | 4 | 3 | 1 | 2 | 2 |
| cf) Tissue ID; Tissue type (1; BLCA[Bladder Urothelial Carcinoma], 2; BRCA[Breast invasive carcinoma], 3; CESC[Cervical squamous cell carcinoma and endocervical adenocarcinoma], 4; COAD[Colon adenocarcinoma], 5; GBM[Glioblastoma multiforme], 6; Glioma Low Grade, 7; HNSC[Head and Neck squamous cell carcinoma], 8; KICH[Kidney Chromophobe], 9; KIRC[Kidney renal clear cell carcinoma], 10; KIRP[Kidney renal papillary cell carcinoma], 11; LAML[Acute Myeloid Leukemia], 12; LUAD[Lung adenocarcinoma], 13; LUSC[Lung squamous cell carcinoma], 14; OV[Ovarian serous cystadenocarcinoma ], 15; PAAD[Pancreatic adenocarcinoma], 16; PRAD[Prostate adenocarcinoma], 17; SKCM[Skin Cutaneous Melanoma], 18:STAD[Stomach adenocarcinoma], 19:THCA[Thyroid carcinoma], 20:UCEC[Uterine Corpus Endometrial Carcinoma]) |
| Top |
| * We represented just top 10 SNVs. When you move the cursor on each content, you can see more deailed mutation information on the Tooltip. Those are primary_site, primary_histology, mutation(aa), pubmedID. |
| Genomic Position | Mutation(aa) | Unique sampleID count |
| chr17:7578406 | p.R43H,TP53 | 64 |
| chr17:7577120 | p.R141P,TP53 | 63 |
| chr17:7577121 | p.R141C,TP53 | 61 |
| chr17:7577538 | p.R116Q,TP53 | 43 |
| chr17:7577539 | p.R116W,TP53 | 37 |
| chr17:7578190 | p.Y88C,TP53 | 34 |
| chr17:7577094 | p.R150W,TP53 | 32 |
| chr17:7578271 | p.H61R,TP53 | 29 |
| chr17:7578394 | p.H47R,TP53 | 27 |
| chr17:7577548 | p.G113S,TP53 | 26 |
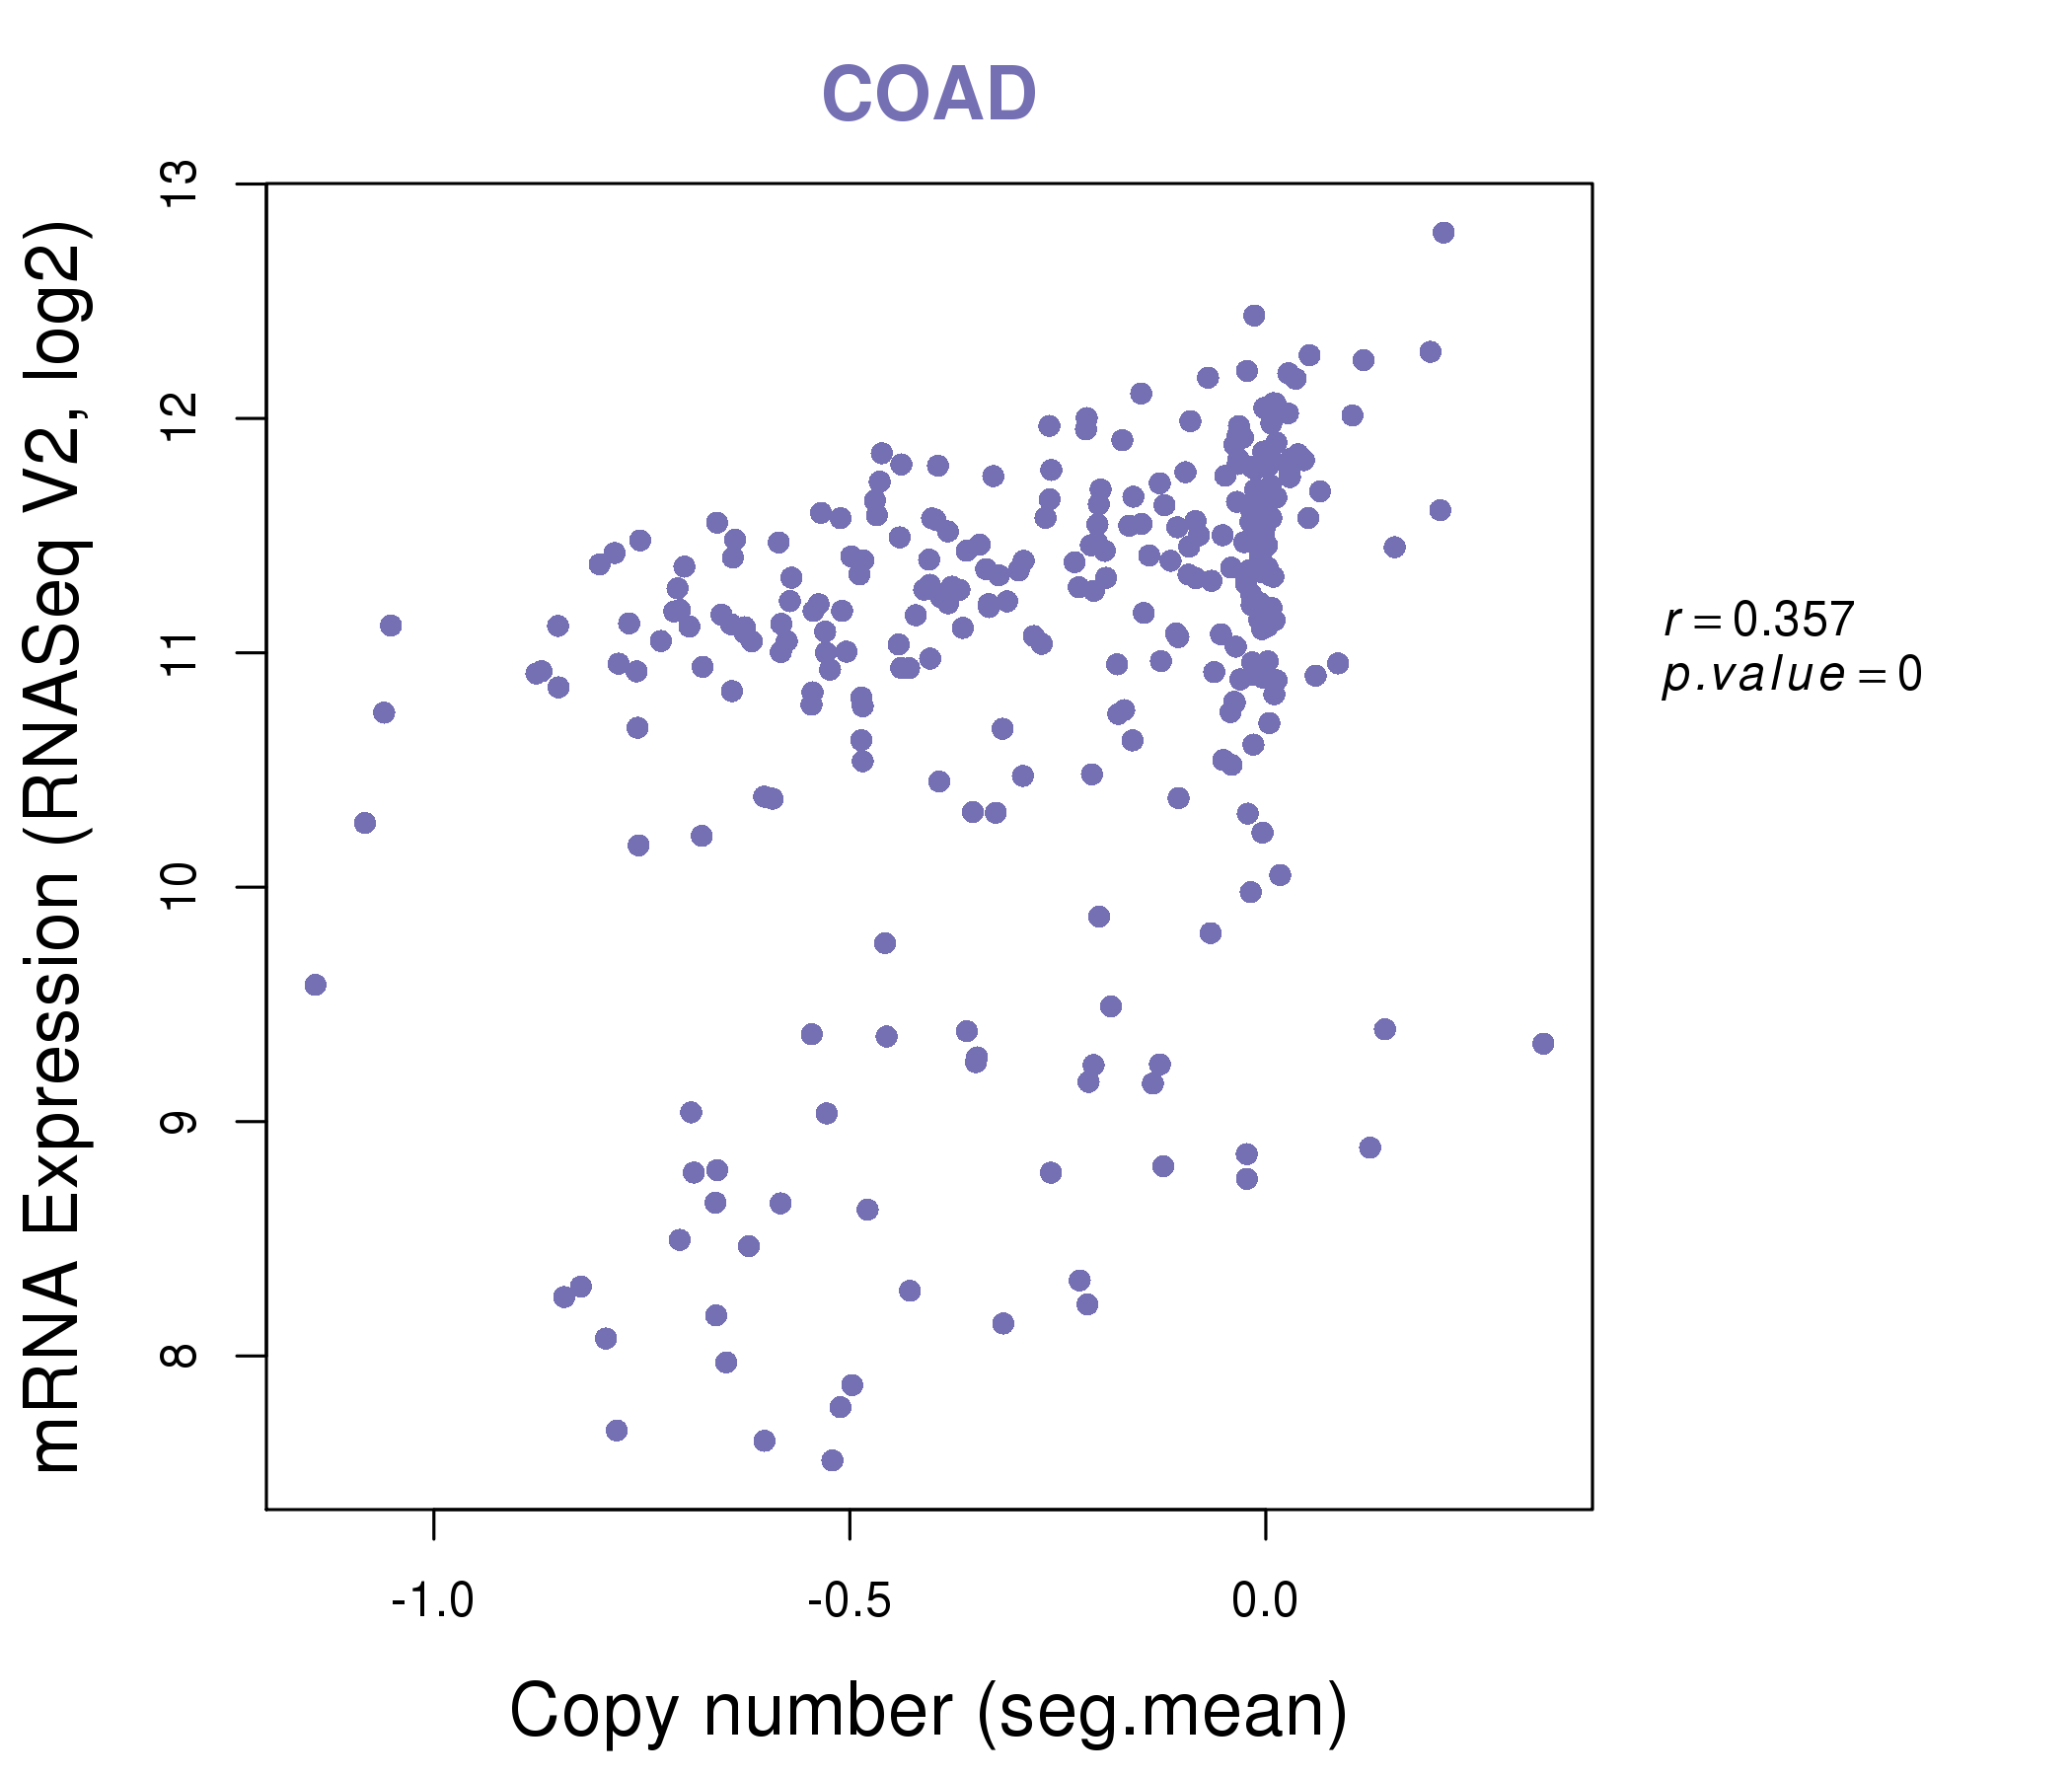
| * Copy number data were extracted from TCGA using R package TCGA-Assembler. The URLs of all public data files on TCGA DCC data server were gathered on Jan-05-2015. Function ProcessCNAData in TCGA-Assembler package was used to obtain gene-level copy number value which is calculated as the average copy number of the genomic region of a gene. |
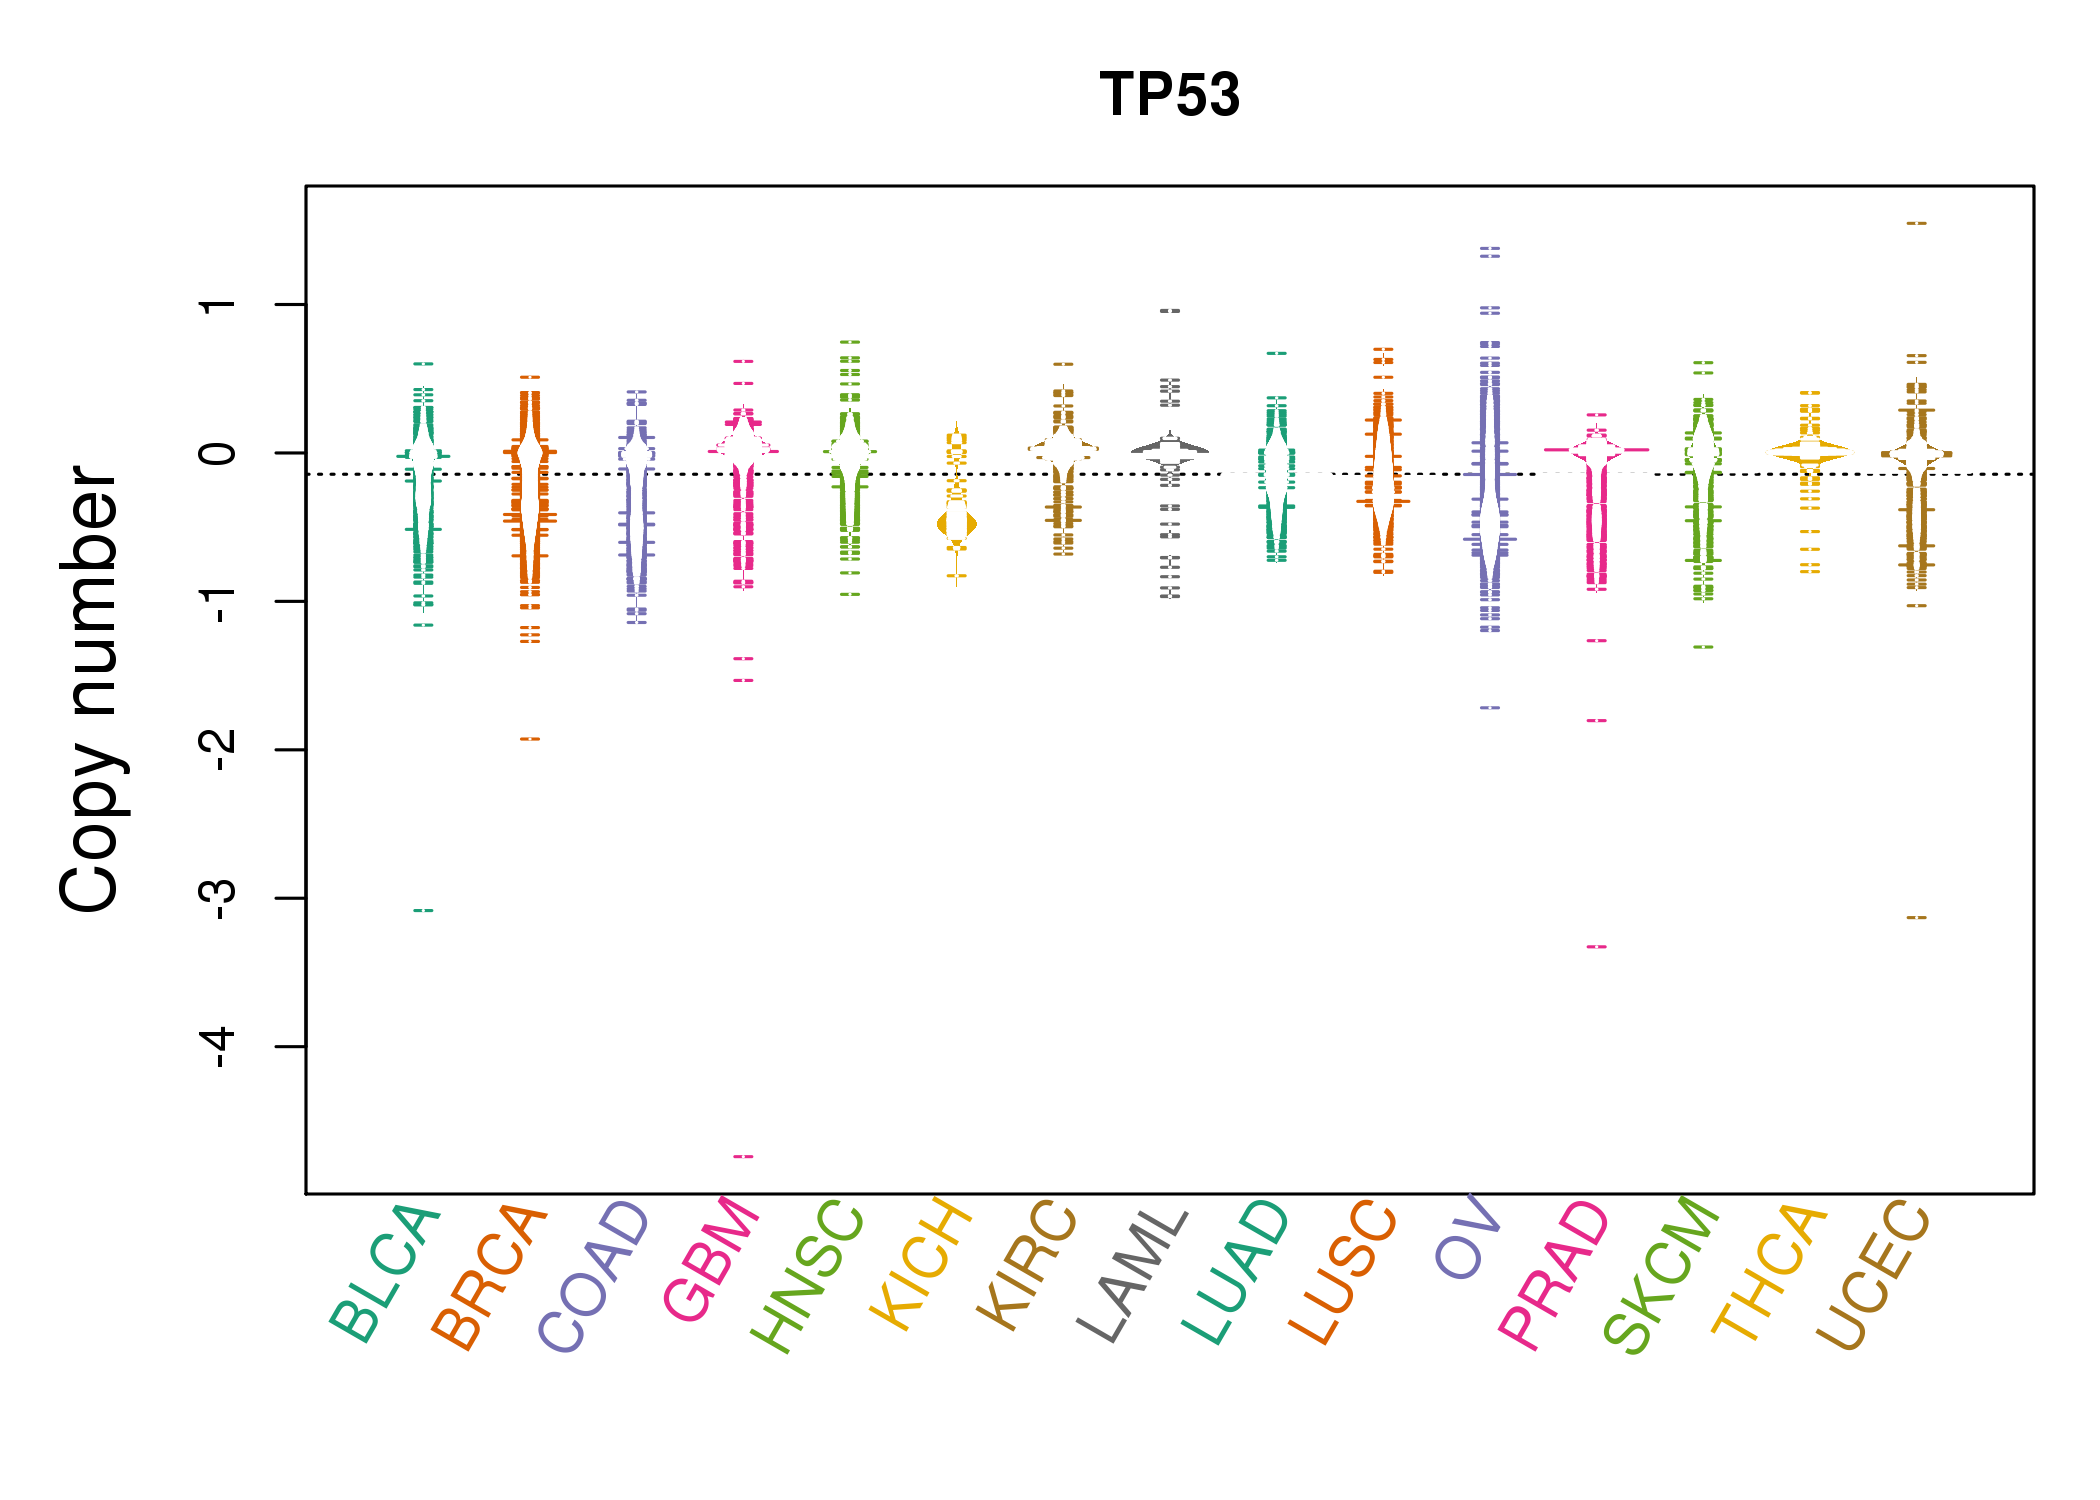 |
| cf) Tissue ID[Tissue type]: BLCA[Bladder Urothelial Carcinoma], BRCA[Breast invasive carcinoma], CESC[Cervical squamous cell carcinoma and endocervical adenocarcinoma], COAD[Colon adenocarcinoma], GBM[Glioblastoma multiforme], Glioma Low Grade, HNSC[Head and Neck squamous cell carcinoma], KICH[Kidney Chromophobe], KIRC[Kidney renal clear cell carcinoma], KIRP[Kidney renal papillary cell carcinoma], LAML[Acute Myeloid Leukemia], LUAD[Lung adenocarcinoma], LUSC[Lung squamous cell carcinoma], OV[Ovarian serous cystadenocarcinoma ], PAAD[Pancreatic adenocarcinoma], PRAD[Prostate adenocarcinoma], SKCM[Skin Cutaneous Melanoma], STAD[Stomach adenocarcinoma], THCA[Thyroid carcinoma], UCEC[Uterine Corpus Endometrial Carcinoma] |
| Top |
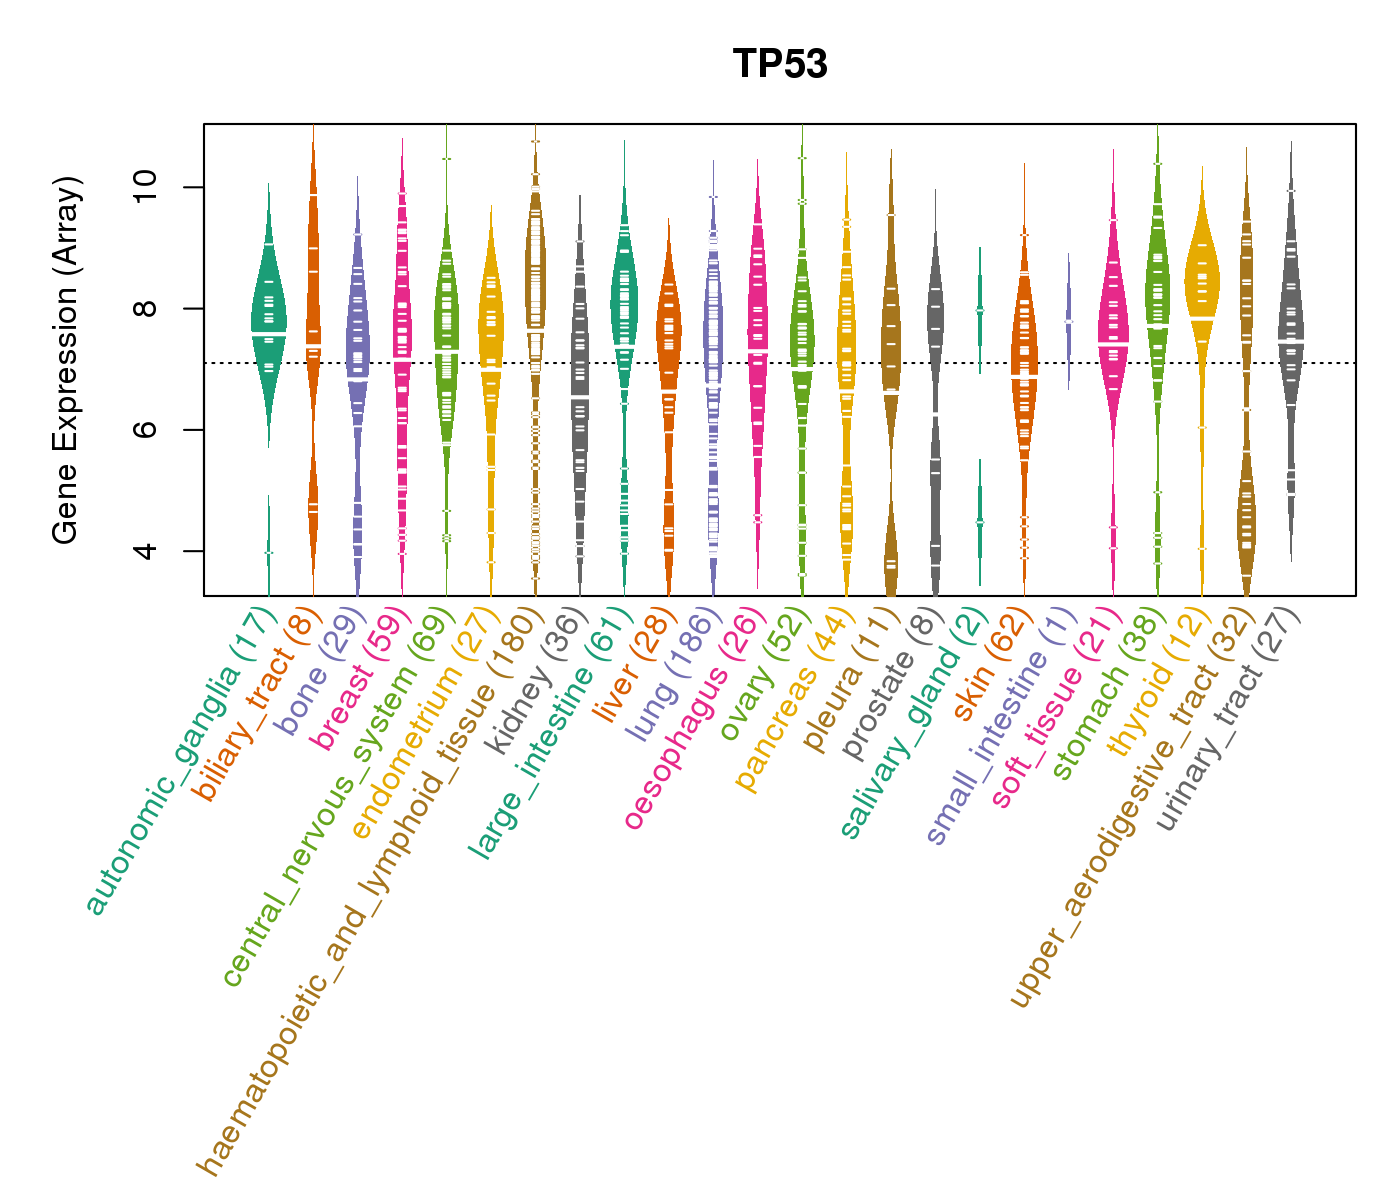
| Gene Expression for TP53 |
| * CCLE gene expression data were extracted from CCLE_Expression_Entrez_2012-10-18.res: Gene-centric RMA-normalized mRNA expression data. |
 |
| Top |
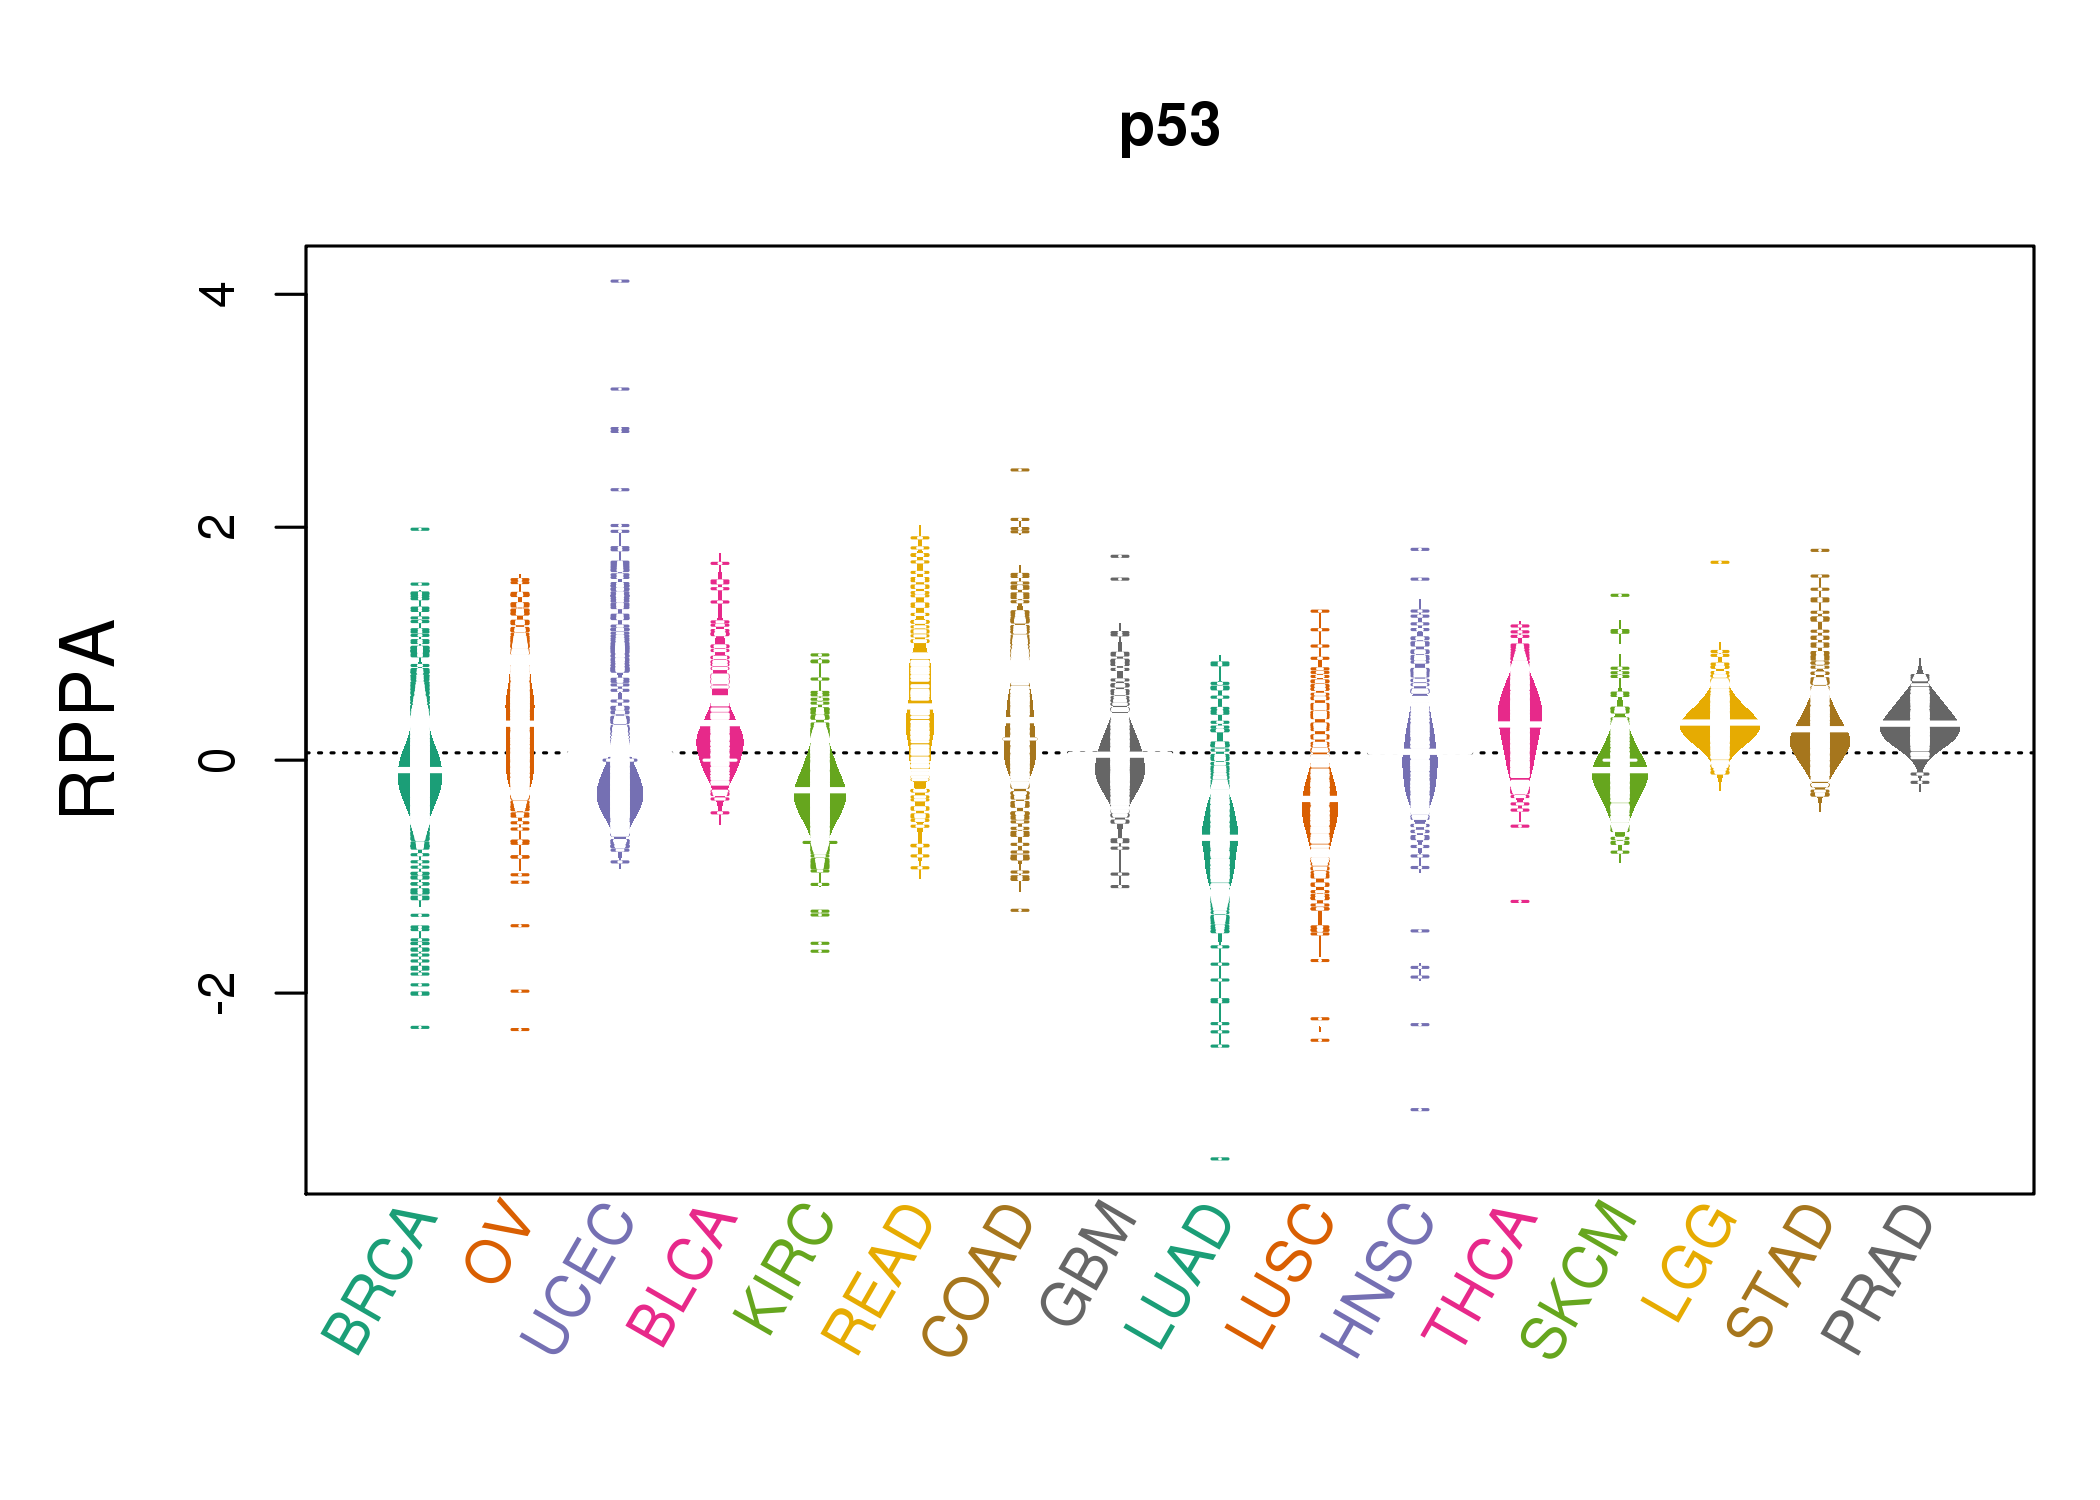
| *RPPA protein expression data were extracted from TCPA (The Cancer Proteome Atlas). Normalized data based on replicated based normalization (RBN) was used to draw following figures. |
 |
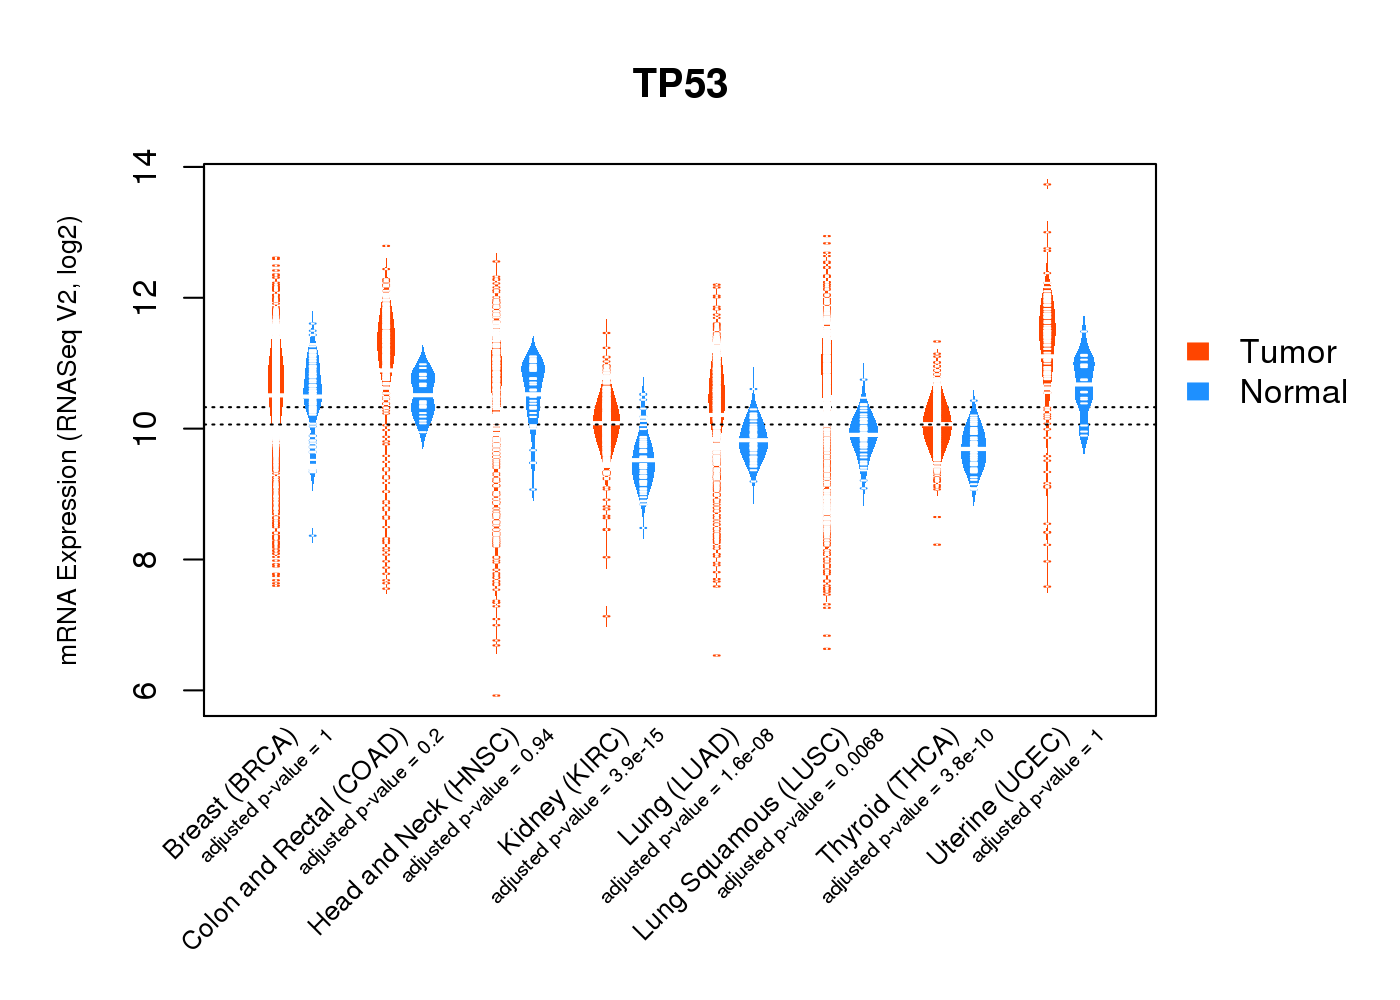
| * Normalized gene expression data of RNASeqV2 was extracted from TCGA using R package TCGA-Assembler. The URLs of all public data files on TCGA DCC data server were gathered at Jan-05-2015. Only eight cancer types have enough normal control samples for differential expression analysis. (t test, adjusted p<0.05 (using Benjamini-Hochberg FDR)) |
 |
| Top |
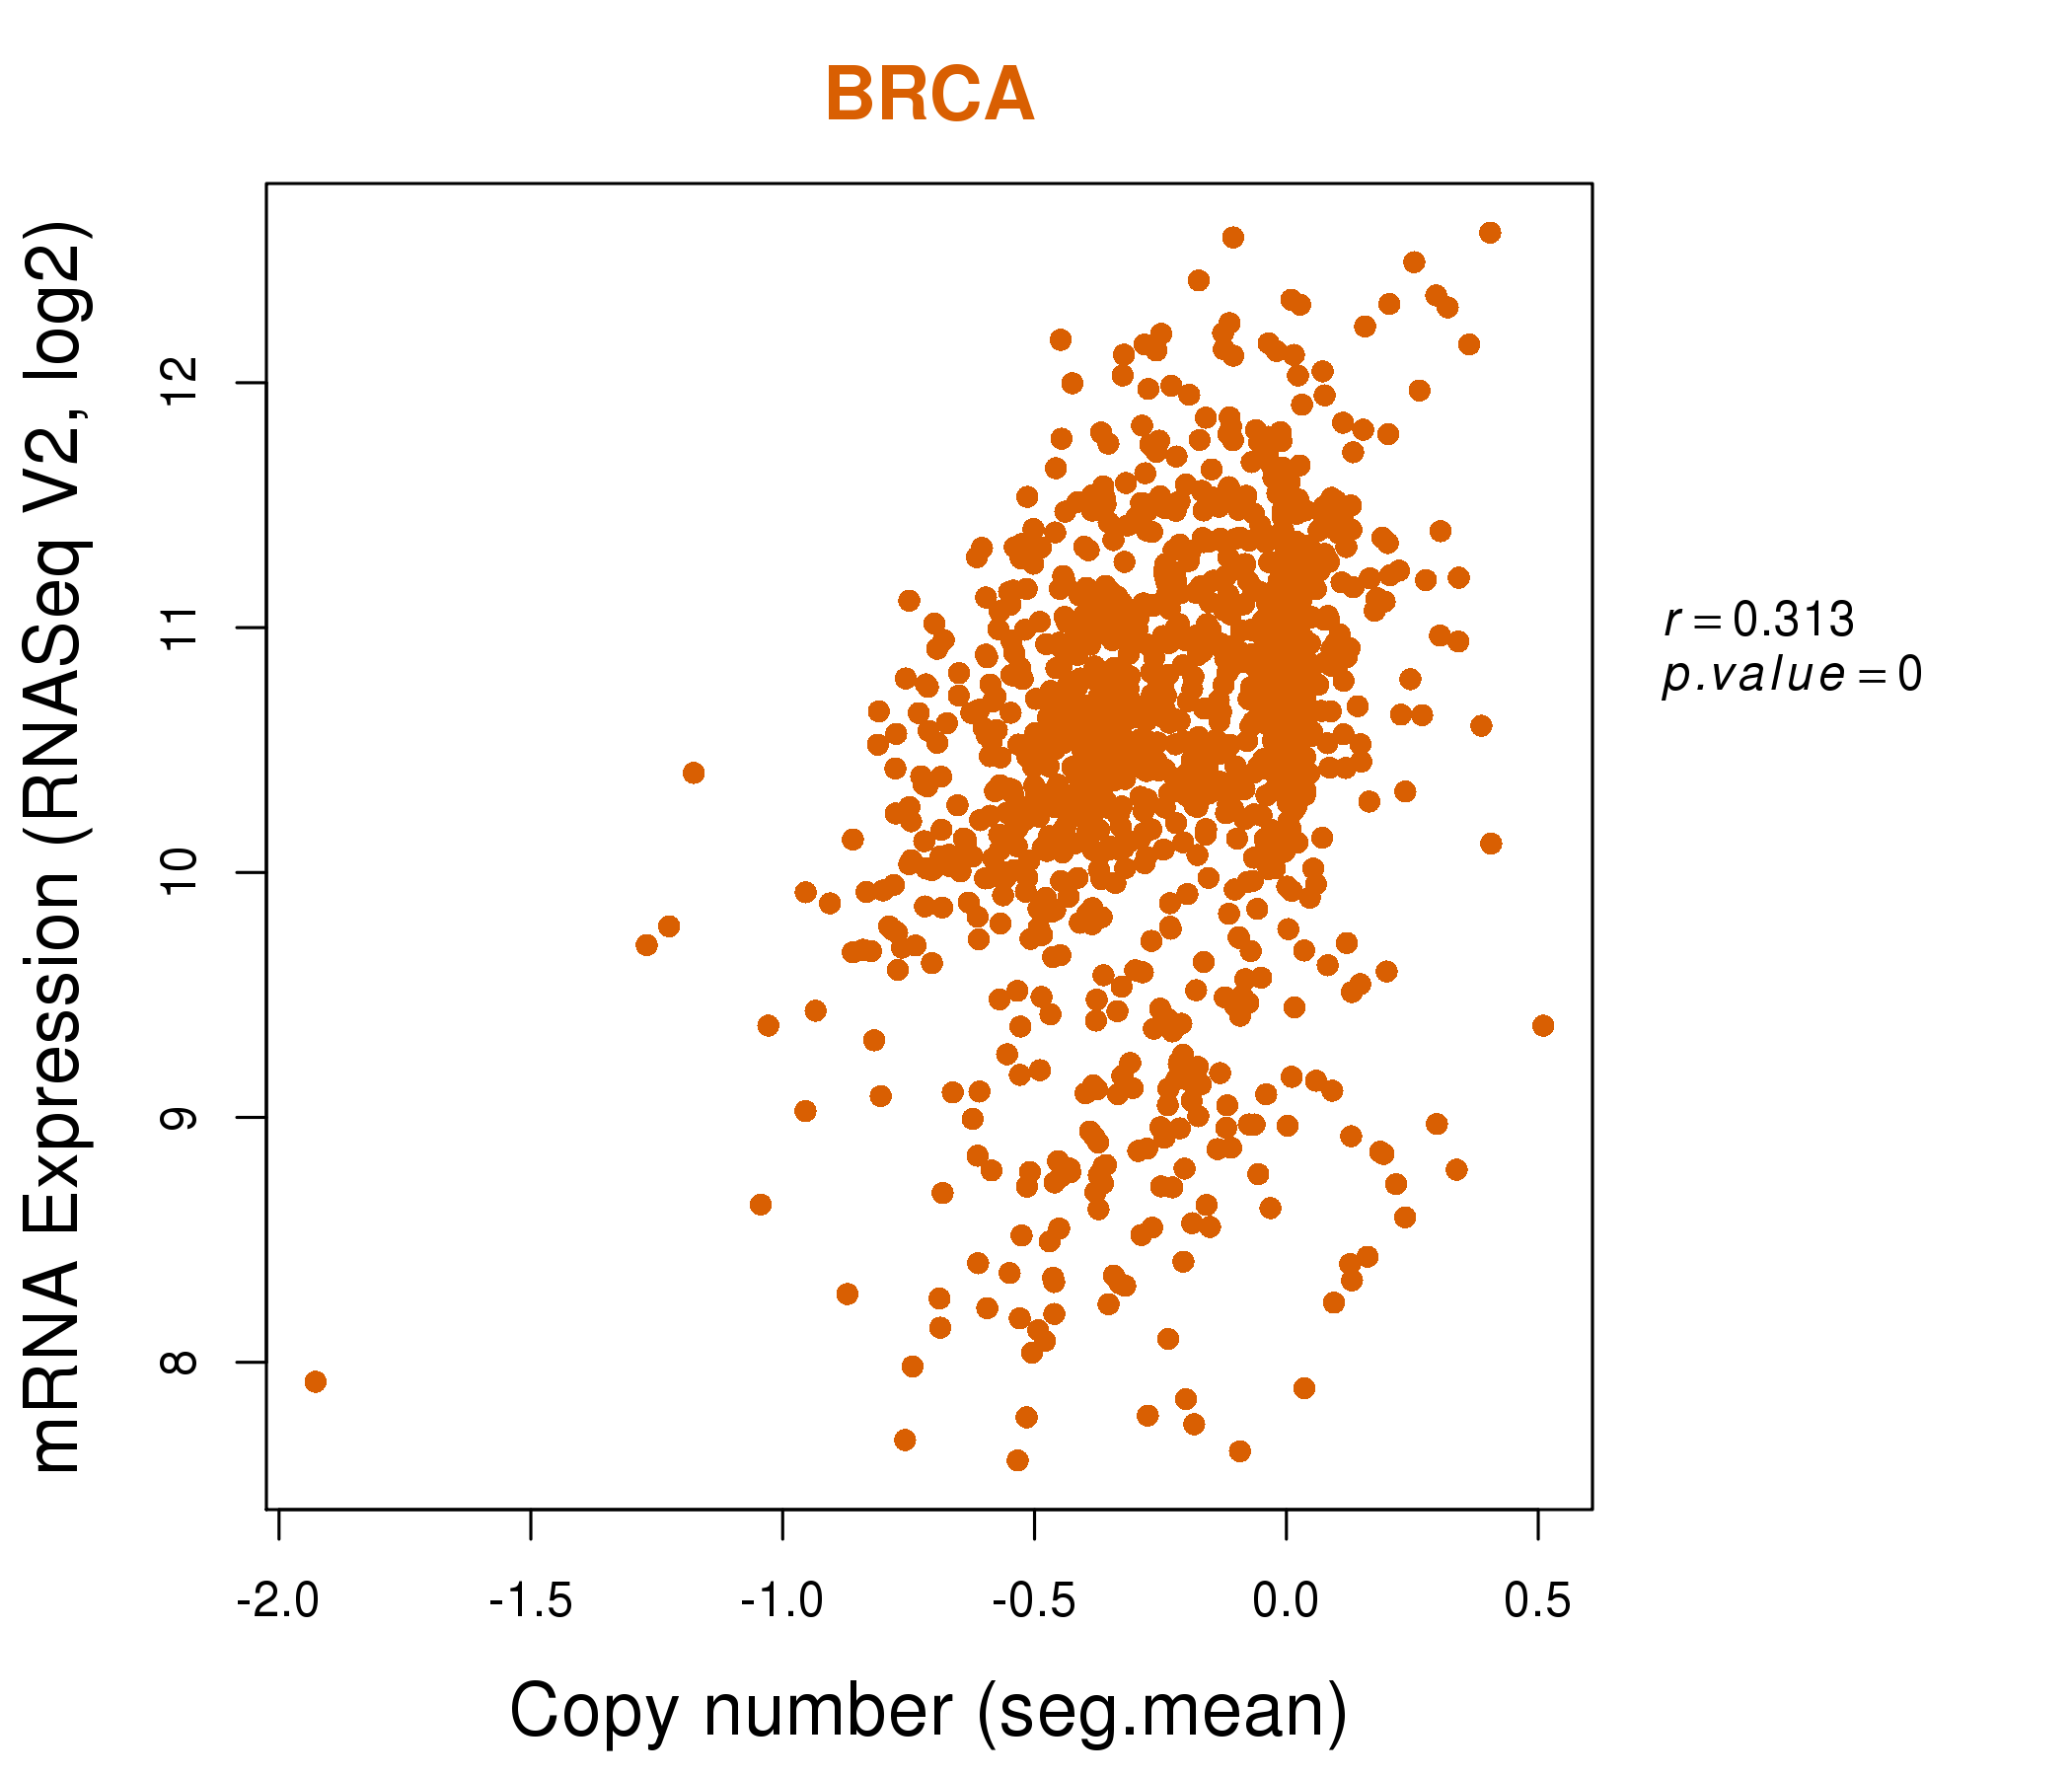
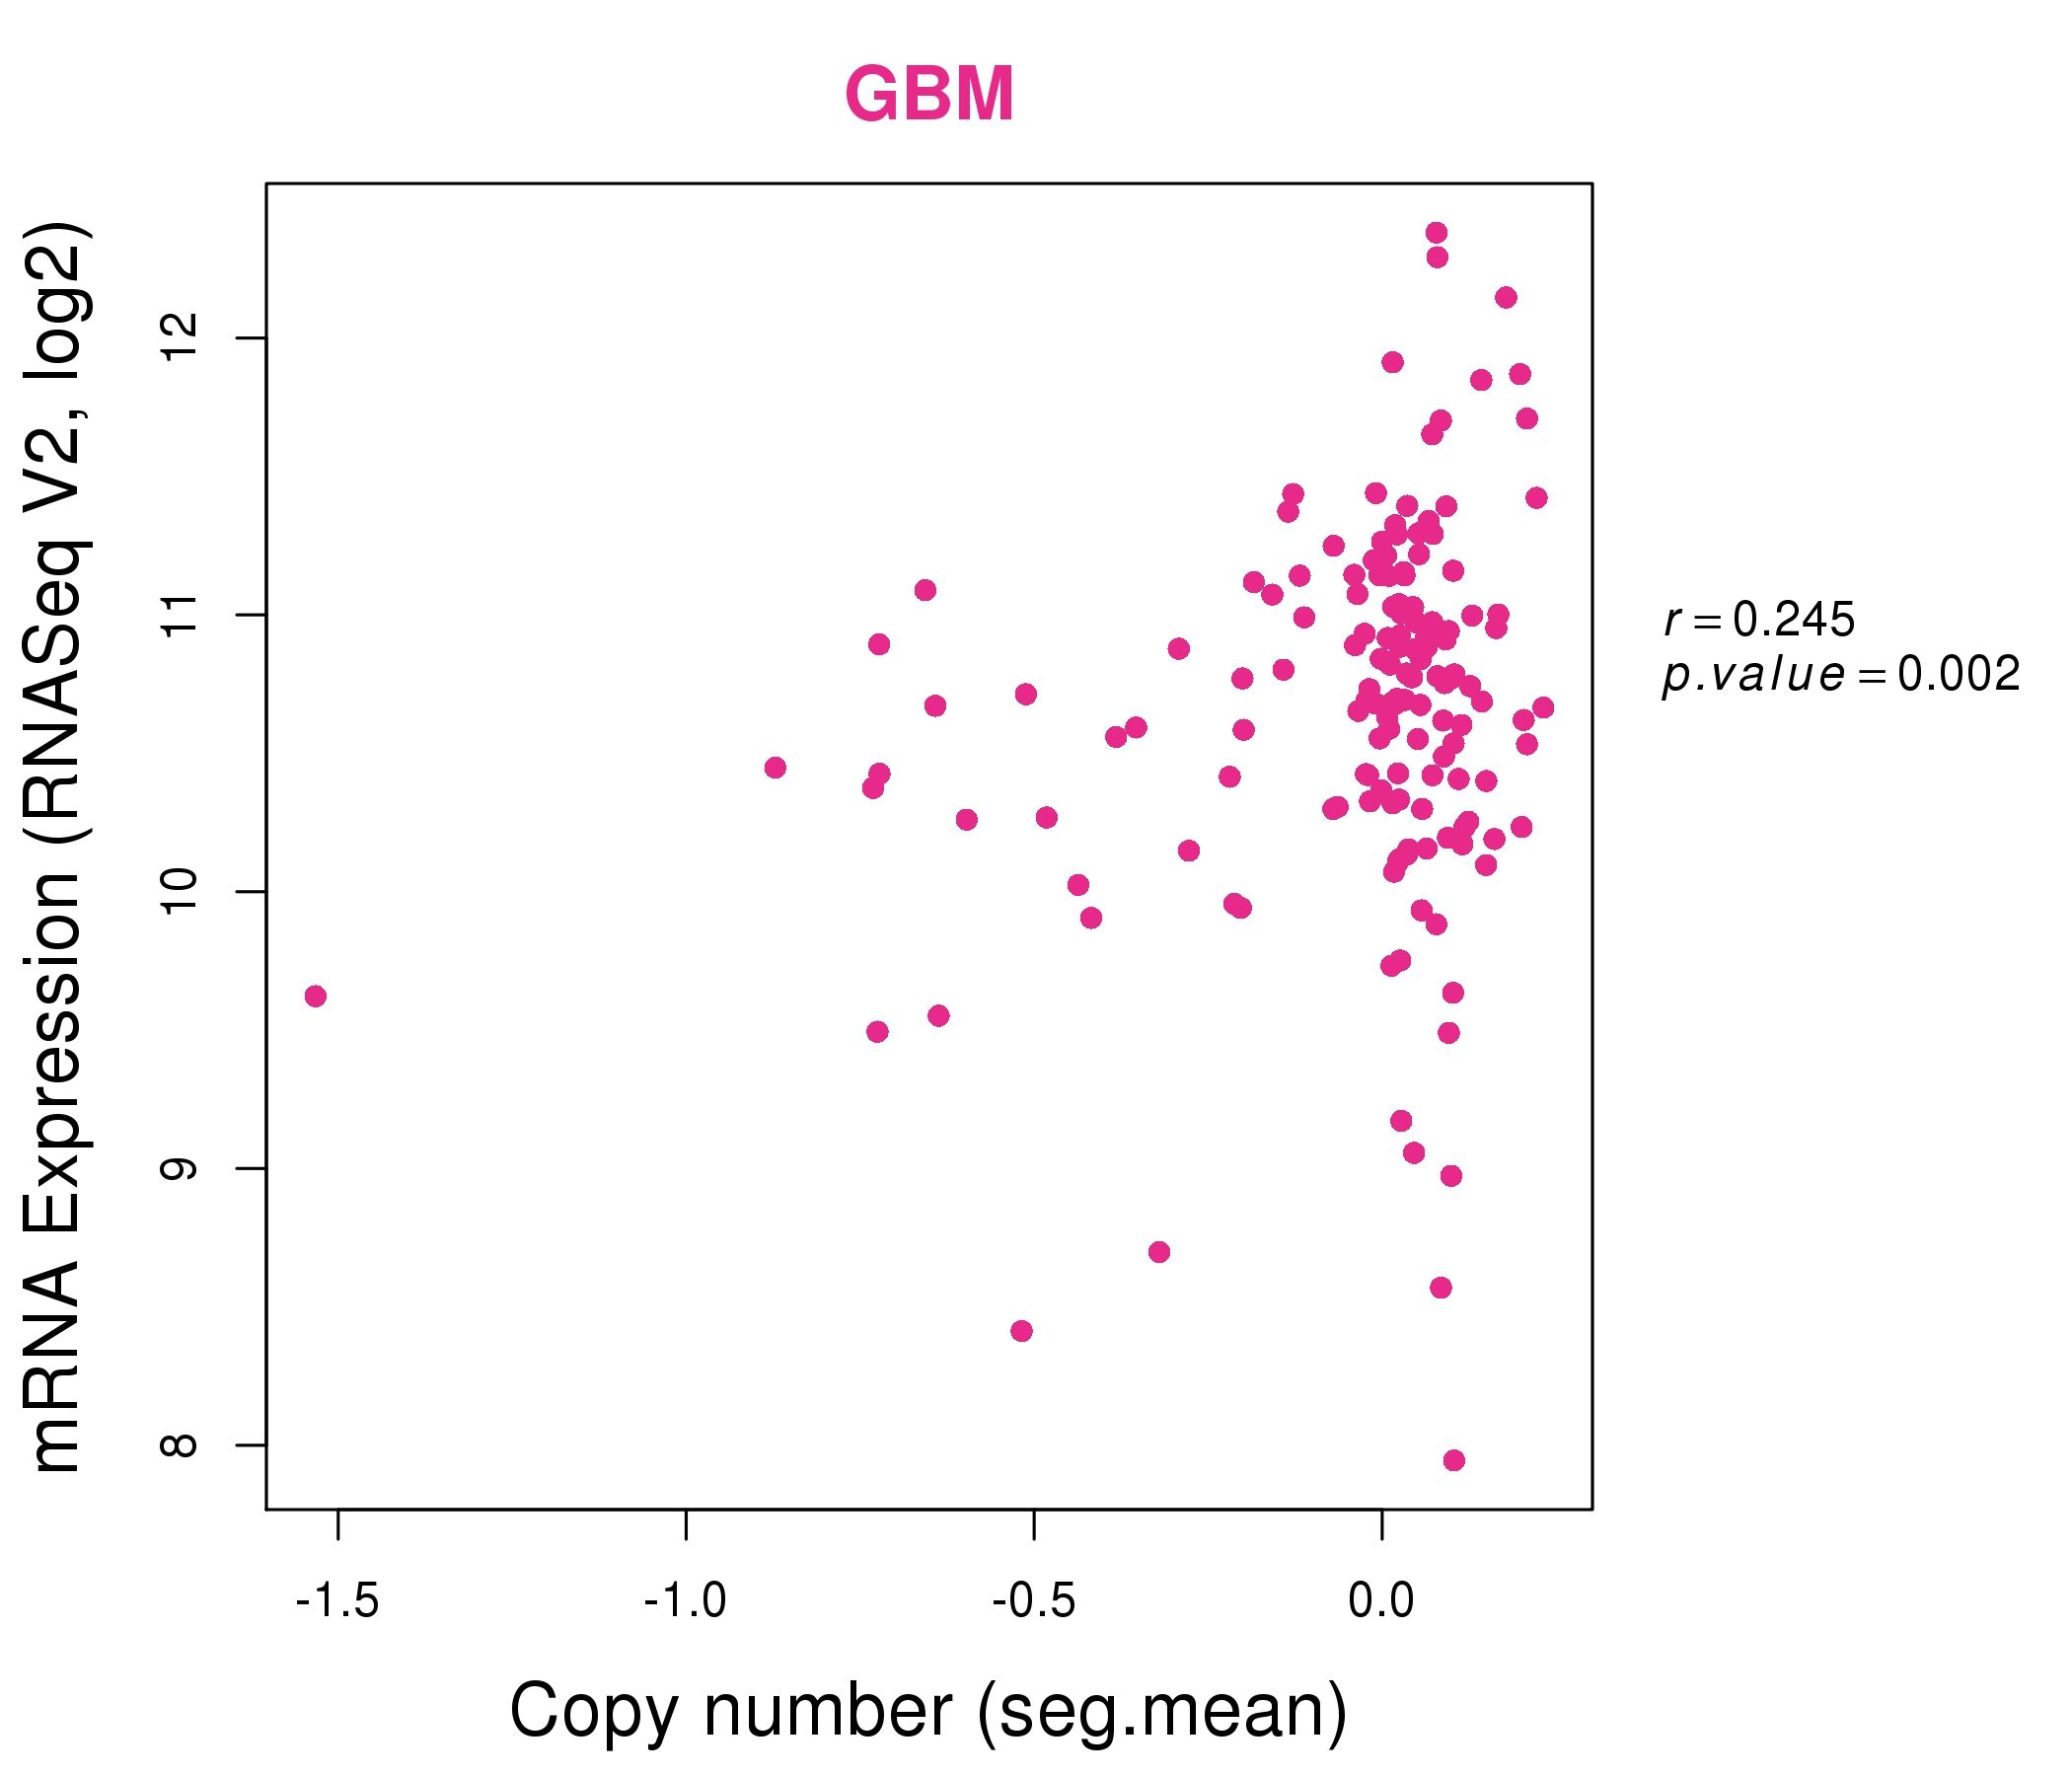
| * This plots show the correlation between CNV and gene expression. |
: Open all plots for all cancer types
 |
|
 |
|
| Top |
| Gene-Gene Network Information |
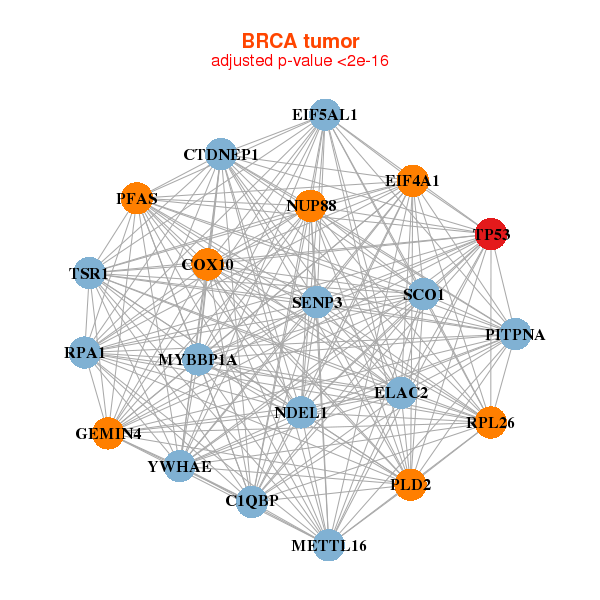
| * Co-Expression network figures were drawn using R package igraph. Only the top 20 genes with the highest correlations were shown. Red circle: input gene, orange circle: cell metabolism gene, sky circle: other gene |
: Open all plots for all cancer types
 |
| ||||
| C1QBP,COX10,CTDNEP1,EIF4A1,EIF5AL1,ELAC2,GEMIN4, METTL16,MYBBP1A,NDEL1,NUP88,PFAS,PITPNA,PLD2, RPA1,RPL26,SCO1,SENP3,TP53,TSR1,YWHAE | BCL11A,DIRAS1,DKC1,DTNB,ETV6,GYLTL1B,H2AFY2, IPO4,KCTD14,LAD1,LRRC8D,NONO,POLR1C,PTK7, RCC2,SOX10,TGIF2,TP53,TRIM27,TTLL4,UCK2 | ||||
 |
| ||||
| COX10,DPH1,DRG2,CTDNEP1,EIF4A1,ELAC2,FXR2, GEMIN4,GLOD4,CLUH,MED9,MYBBP1A,PELP1,RNMTL1, SENP3,SHMT1,TMEM102,TP53,TRAPPC1,TTC19,YWHAE | ARHGEF10L,BEND3,CASP2,CDT1,EPHB2,EPHB3,FAM171A1, GPR56,HUNK,INTS5,MAZ,MEN1,METTL13,MLEC, MTL5,PROM2,PVRL1,RCC2,TARS2,TP53,NELFA |
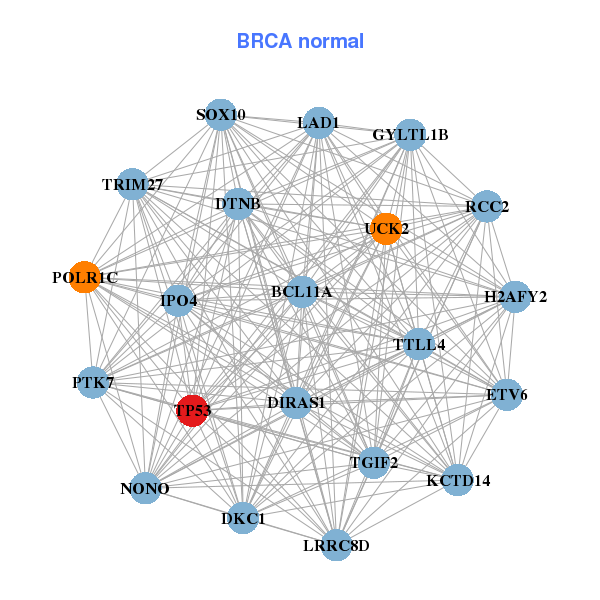
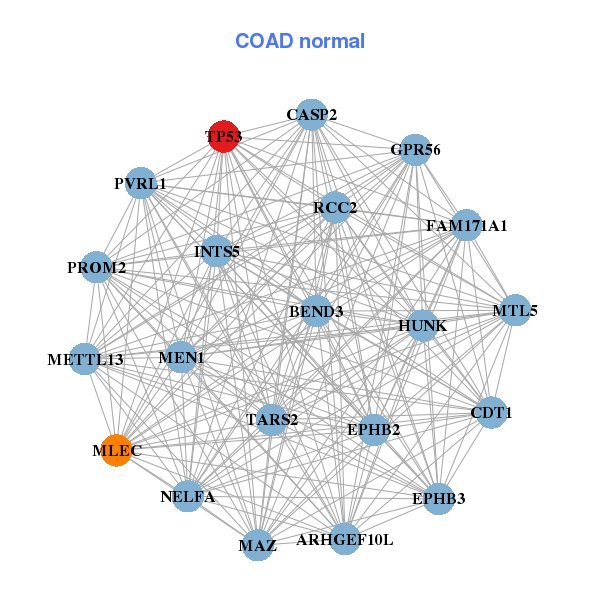
| * Co-Expression network figures were drawn using R package igraph. Only the top 20 genes with the highest correlations were shown. Red circle: input gene, orange circle: cell metabolism gene, sky circle: other gene |
: Open all plots for all cancer types
| Top |
: Open all interacting genes' information including KEGG pathway for all interacting genes from DAVID
| Top |
| Pharmacological Information for TP53 |
| DB Category | DB Name | DB's ID and Url link |
| Chemistry | BindingDB | P04637; -. |
| Chemistry | ChEMBL | CHEMBL2221344; -. |
| Chemistry | BindingDB | P04637; -. |
| Chemistry | ChEMBL | CHEMBL2221344; -. |
| Organism-specific databases | PharmGKB | PA36679; -. |
| Organism-specific databases | PharmGKB | PA36679; -. |
| Organism-specific databases | CTD | 7157; -. |
| Organism-specific databases | CTD | 7157; -. |
| * Gene Centered Interaction Network. |
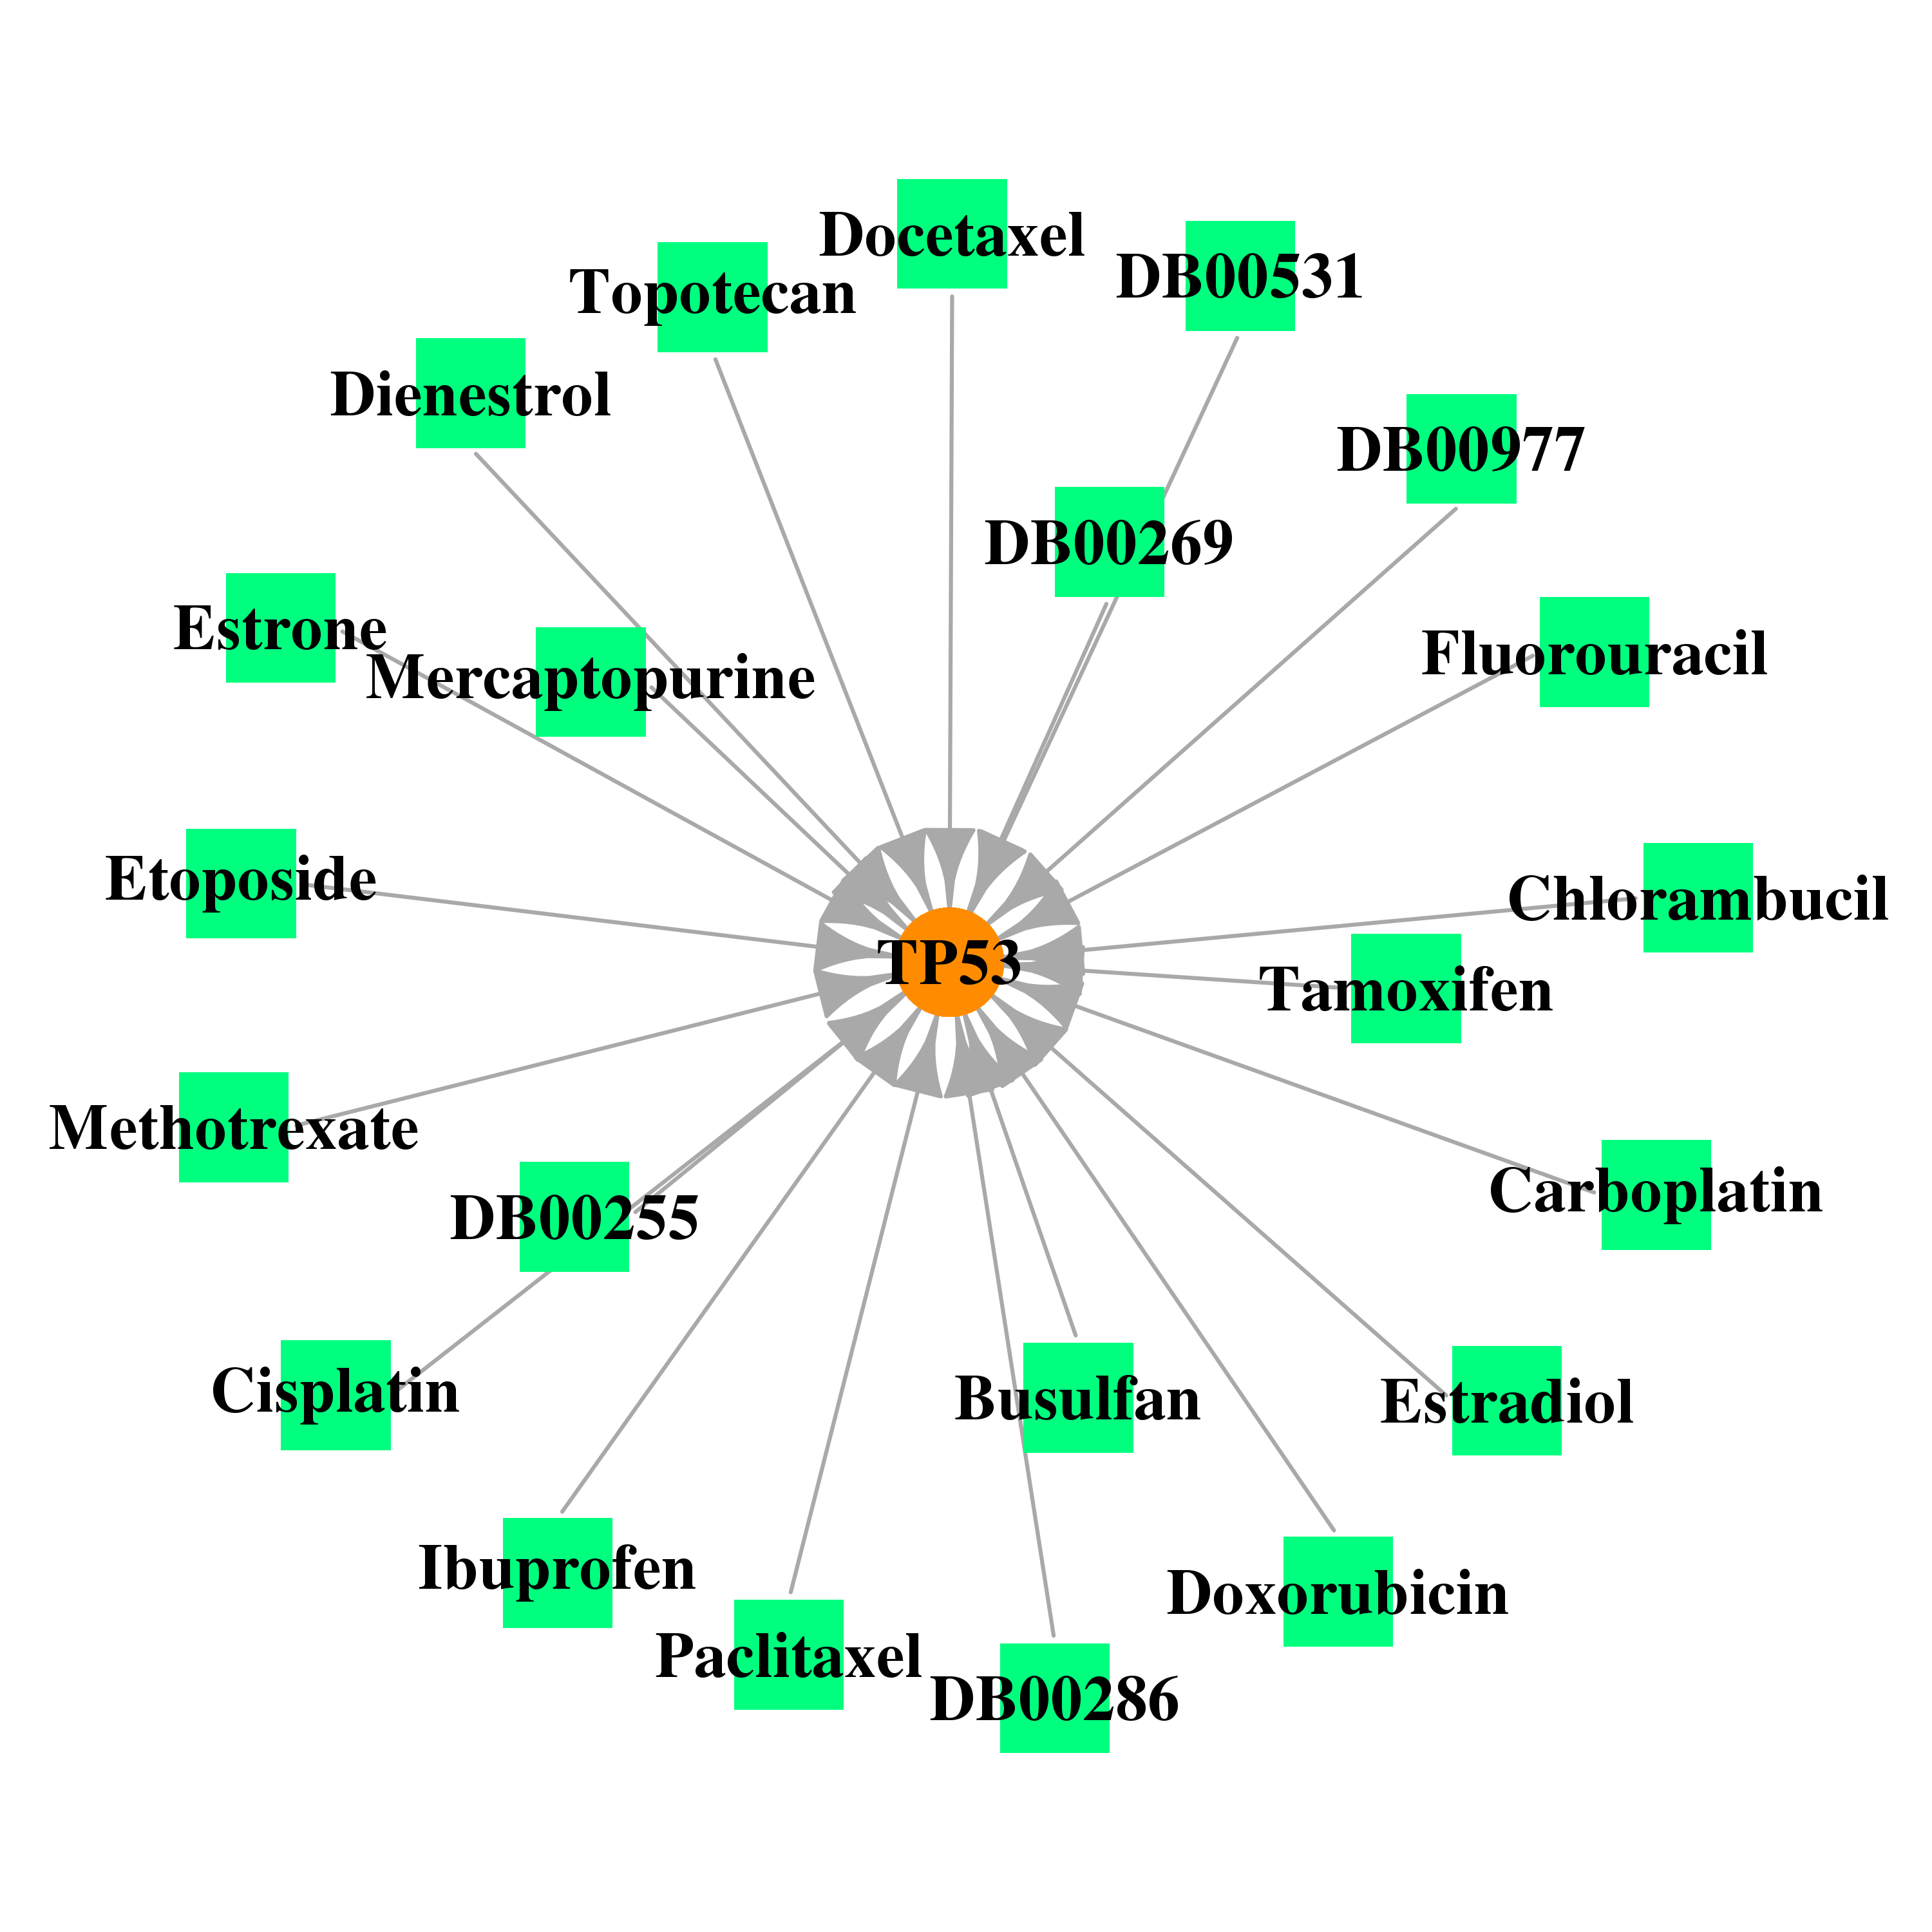 |
| * Drug Centered Interaction Network. |
| DrugBank ID | Target Name | Drug Groups | Generic Name | Drug Centered Network | Drug Structure |
| DB01008 | tumor protein p53 | approved; investigational | Busulfan |  |  |
| DB00675 | tumor protein p53 | approved | Tamoxifen |  |  |
| DB00269 | tumor protein p53 | approved | Chlorotrianisene | 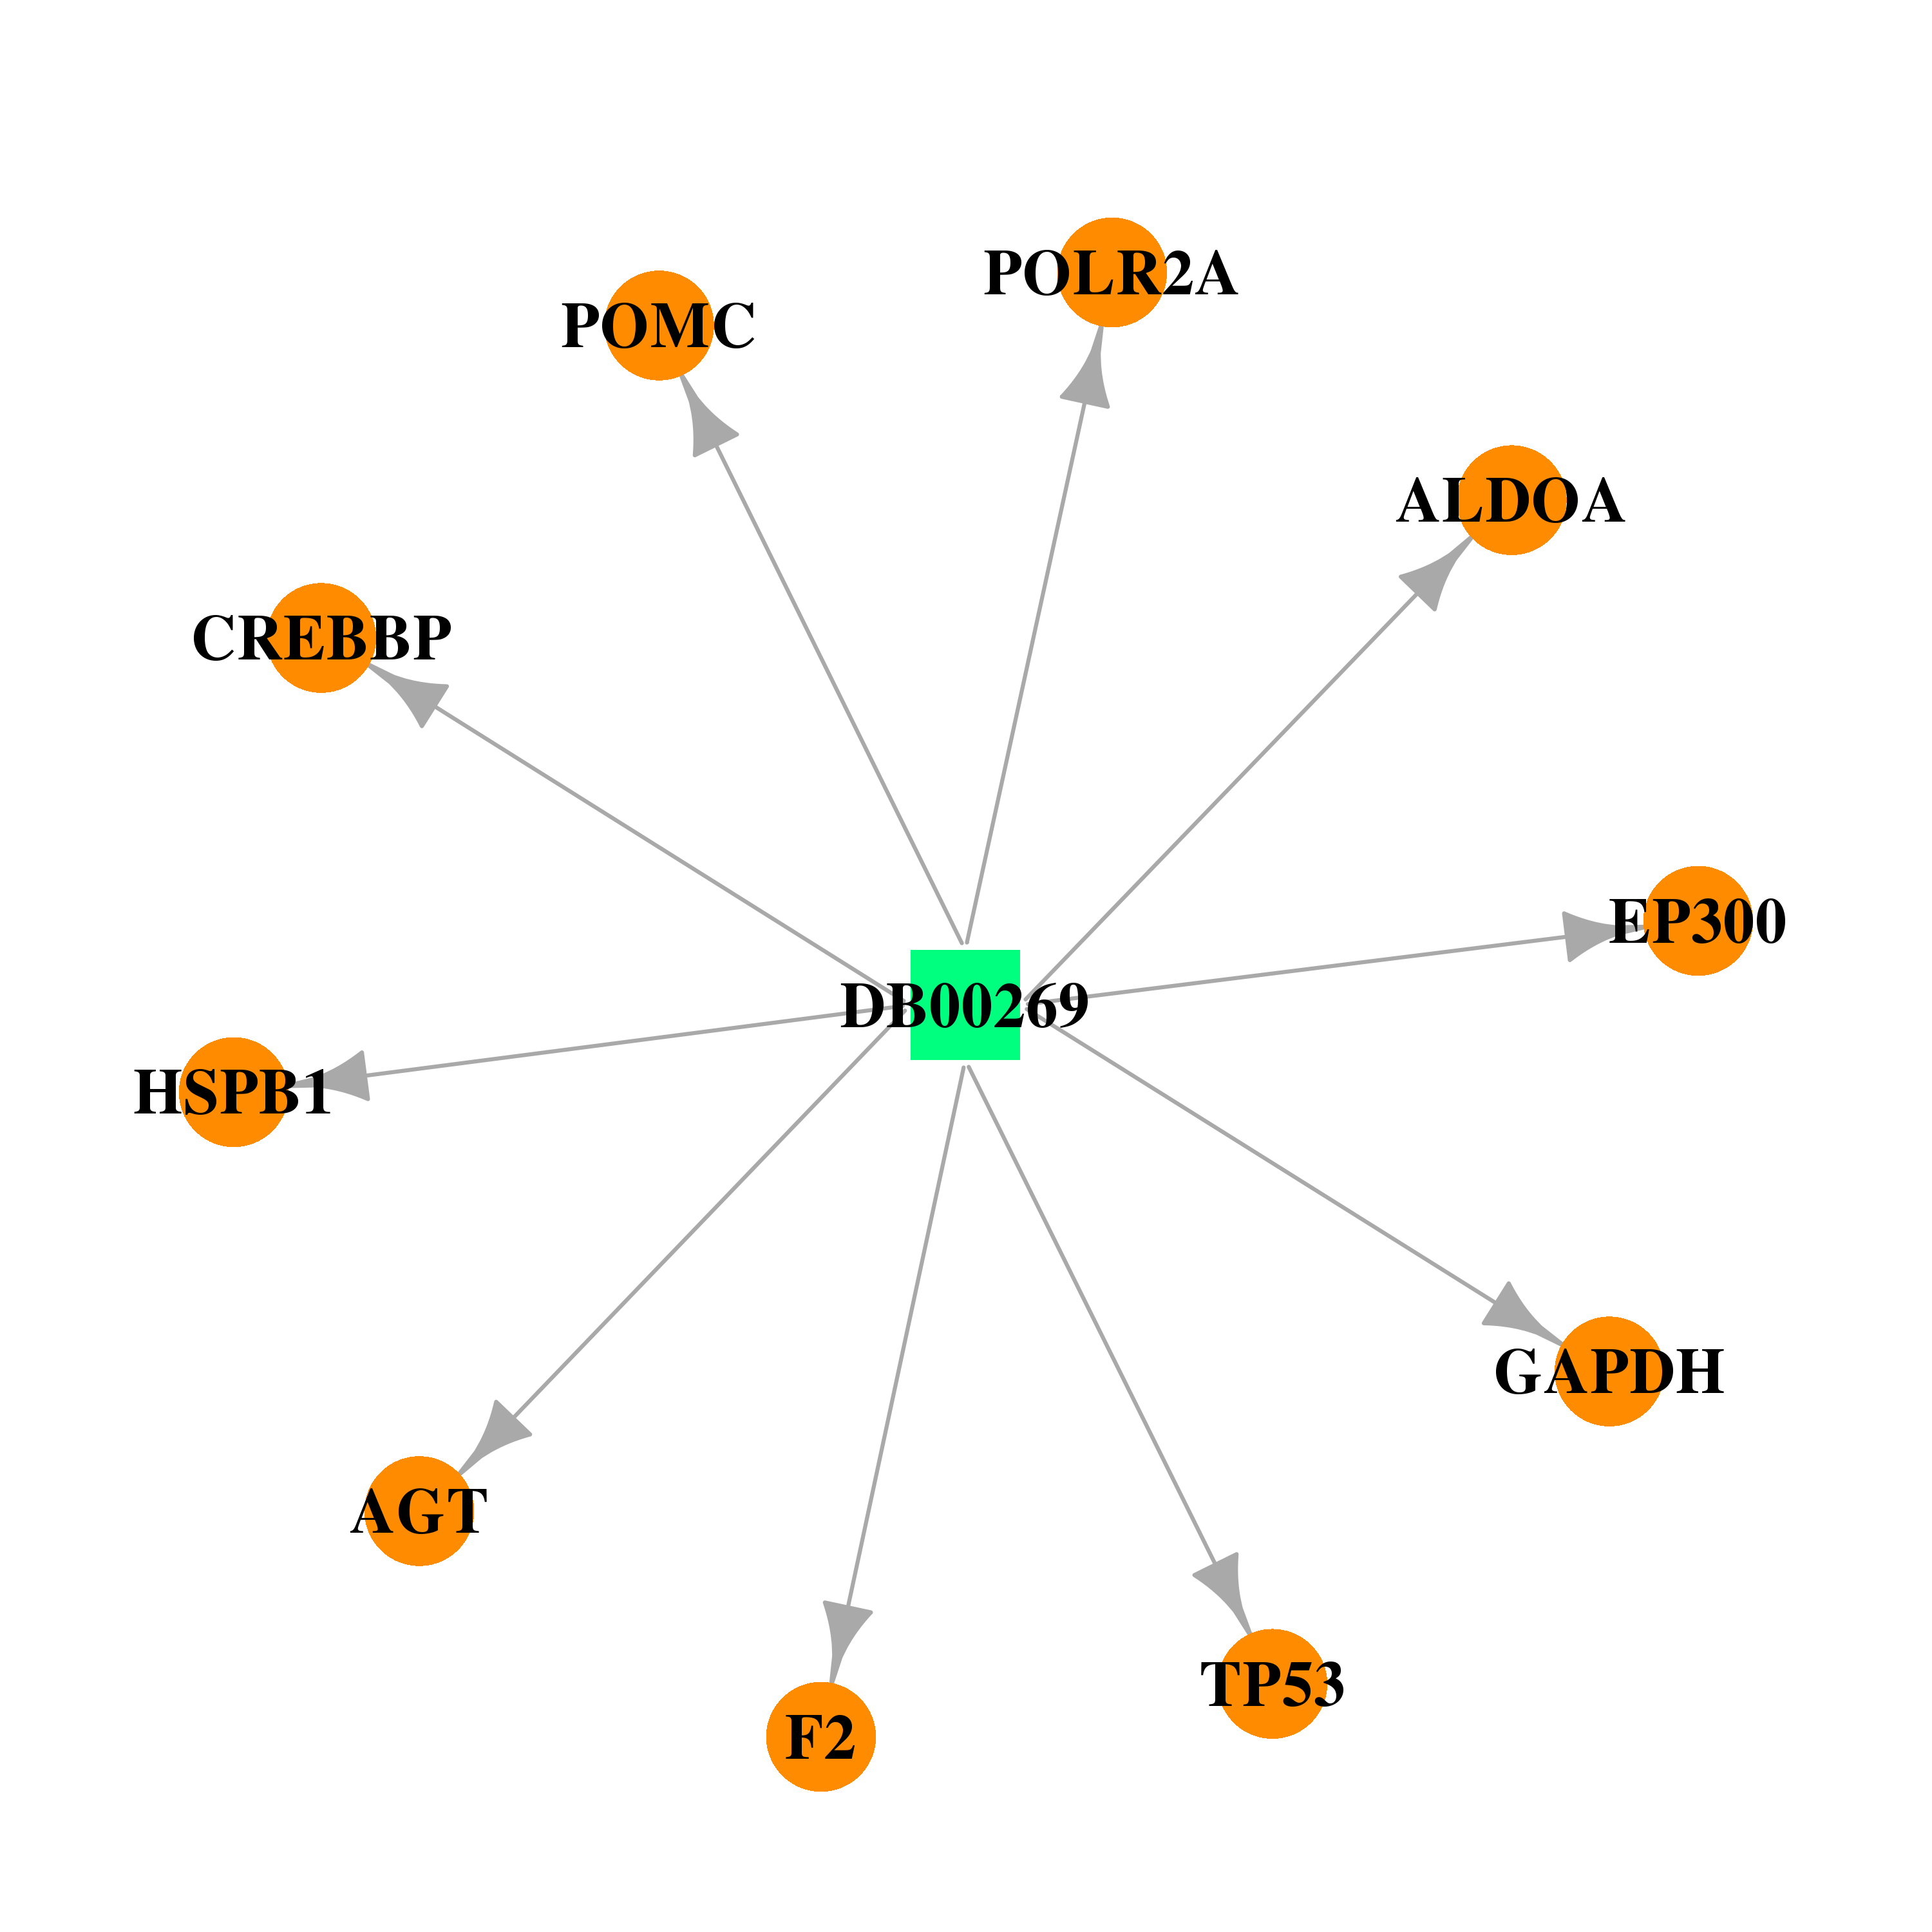 |  |
| DB00286 | tumor protein p53 | approved | Conjugated Estrogens | 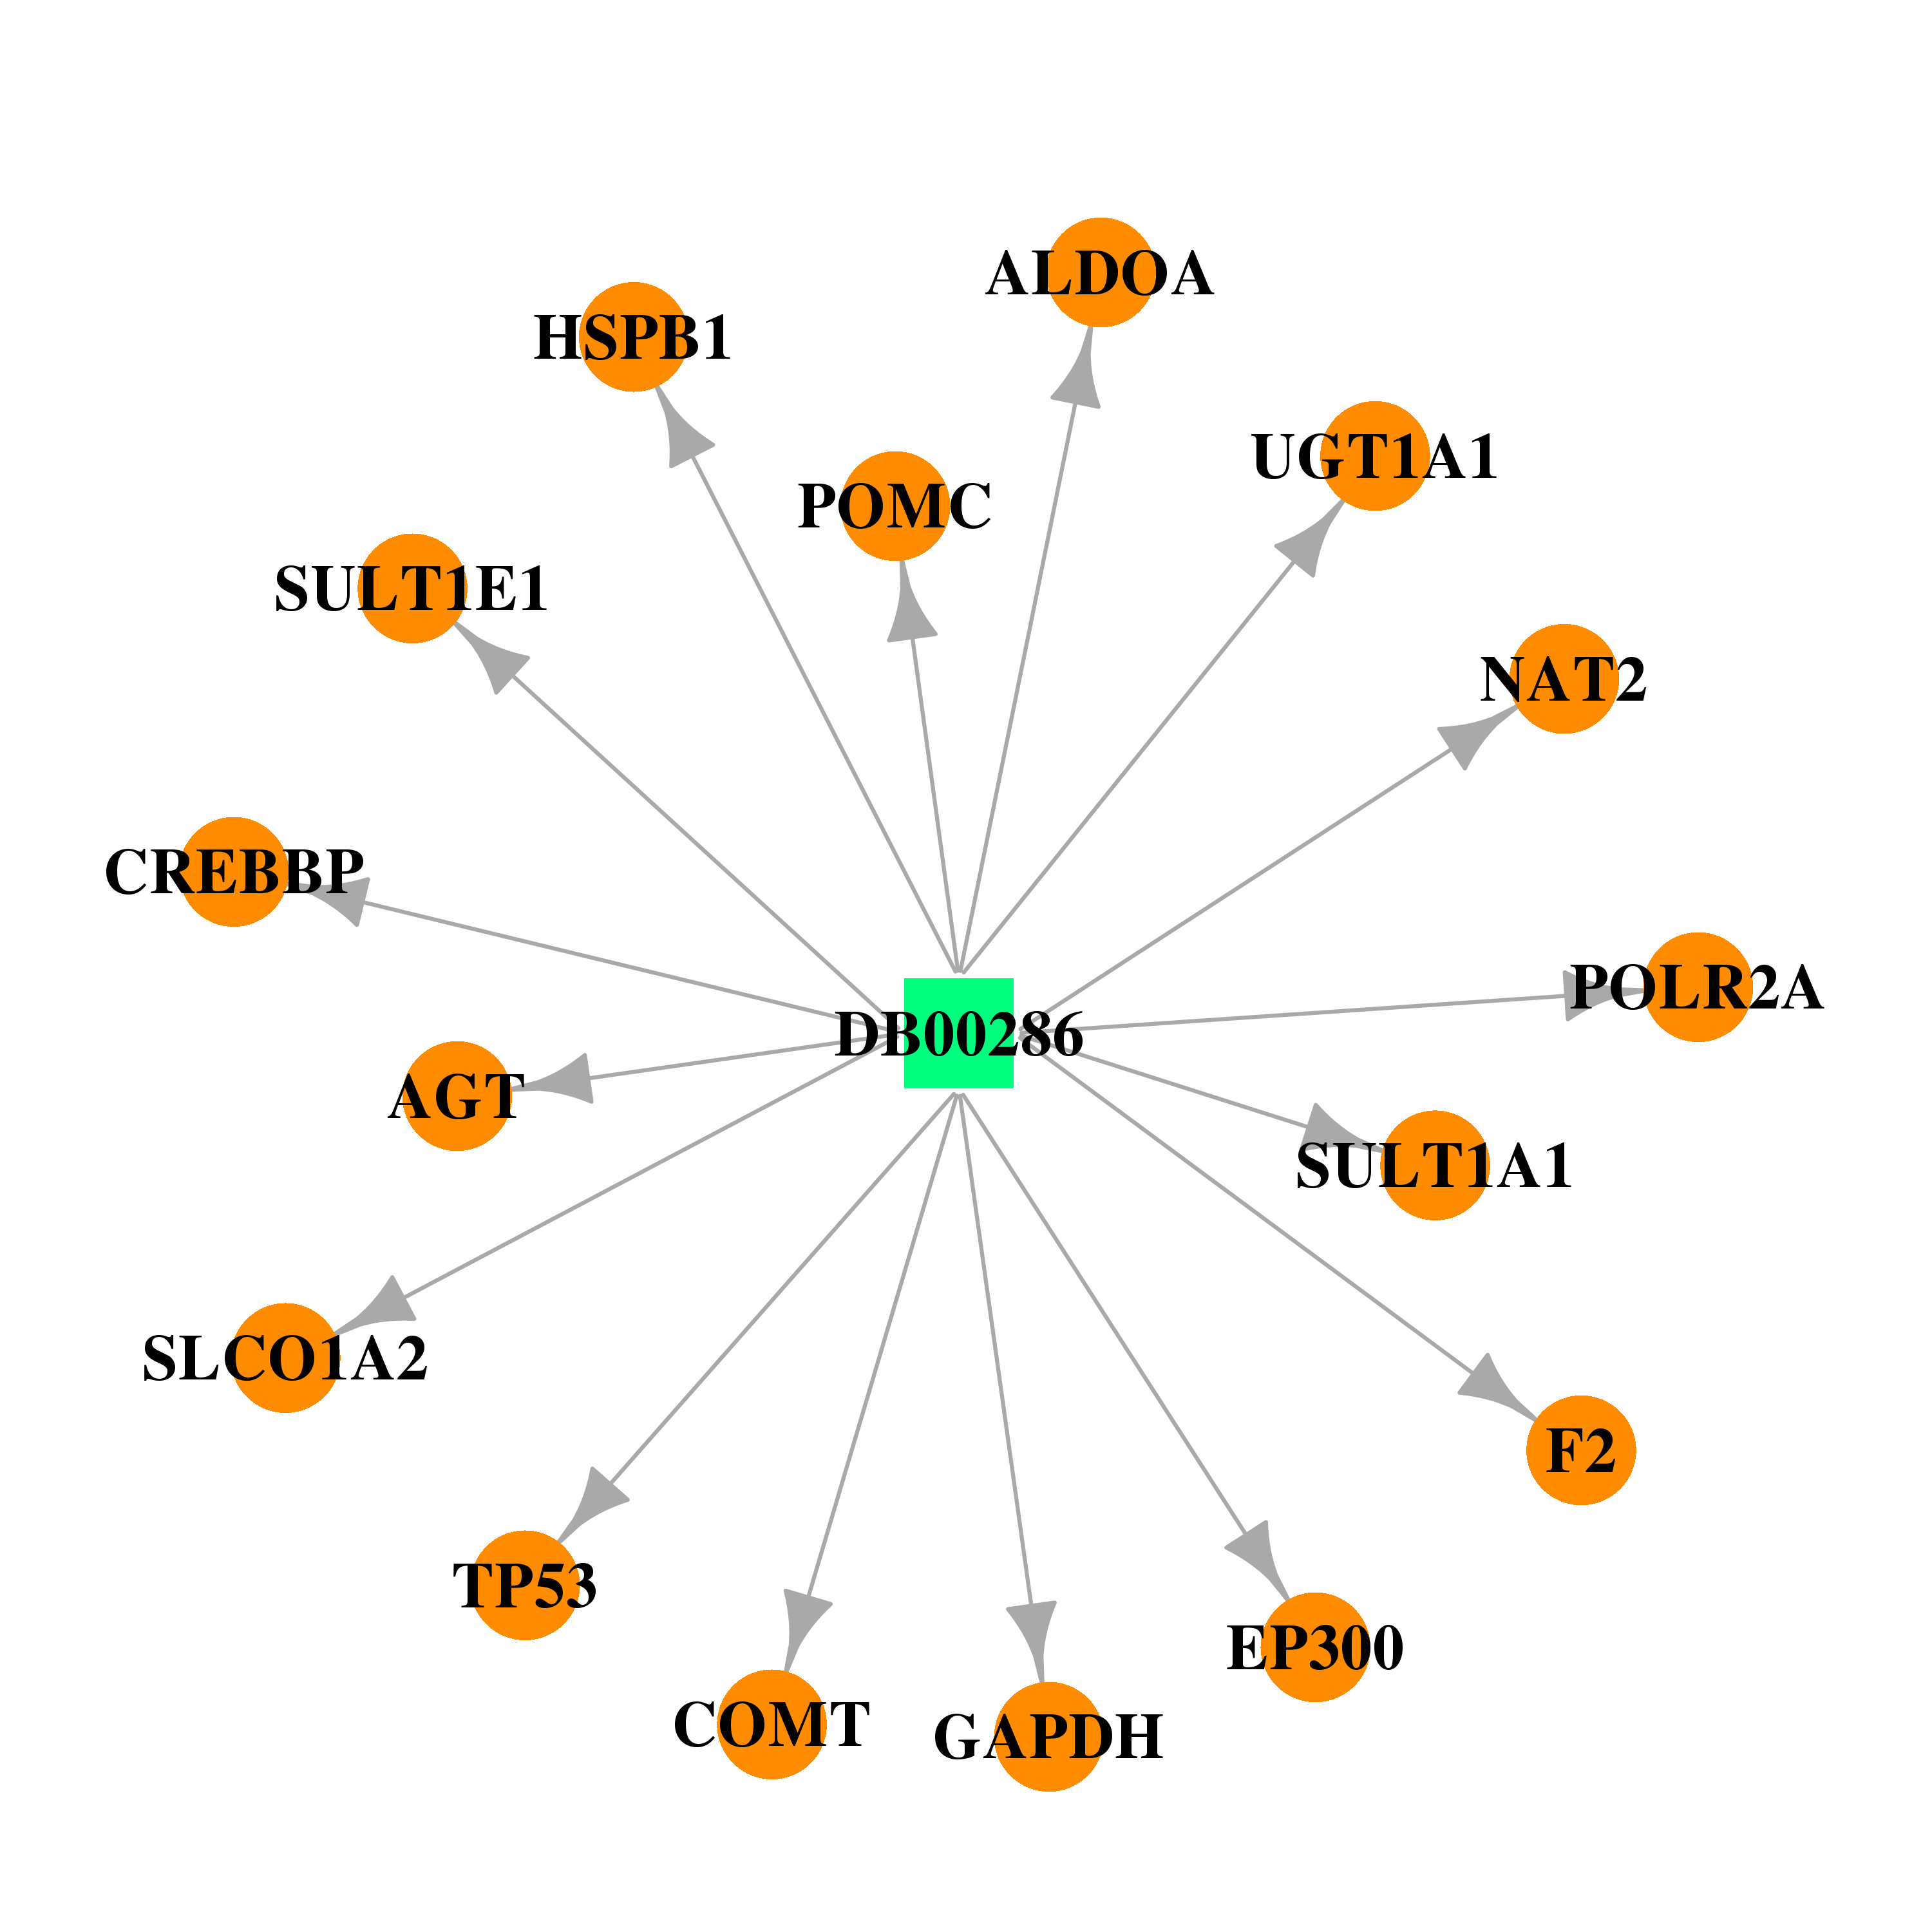 |  |
| DB00890 | tumor protein p53 | approved | Dienestrol | 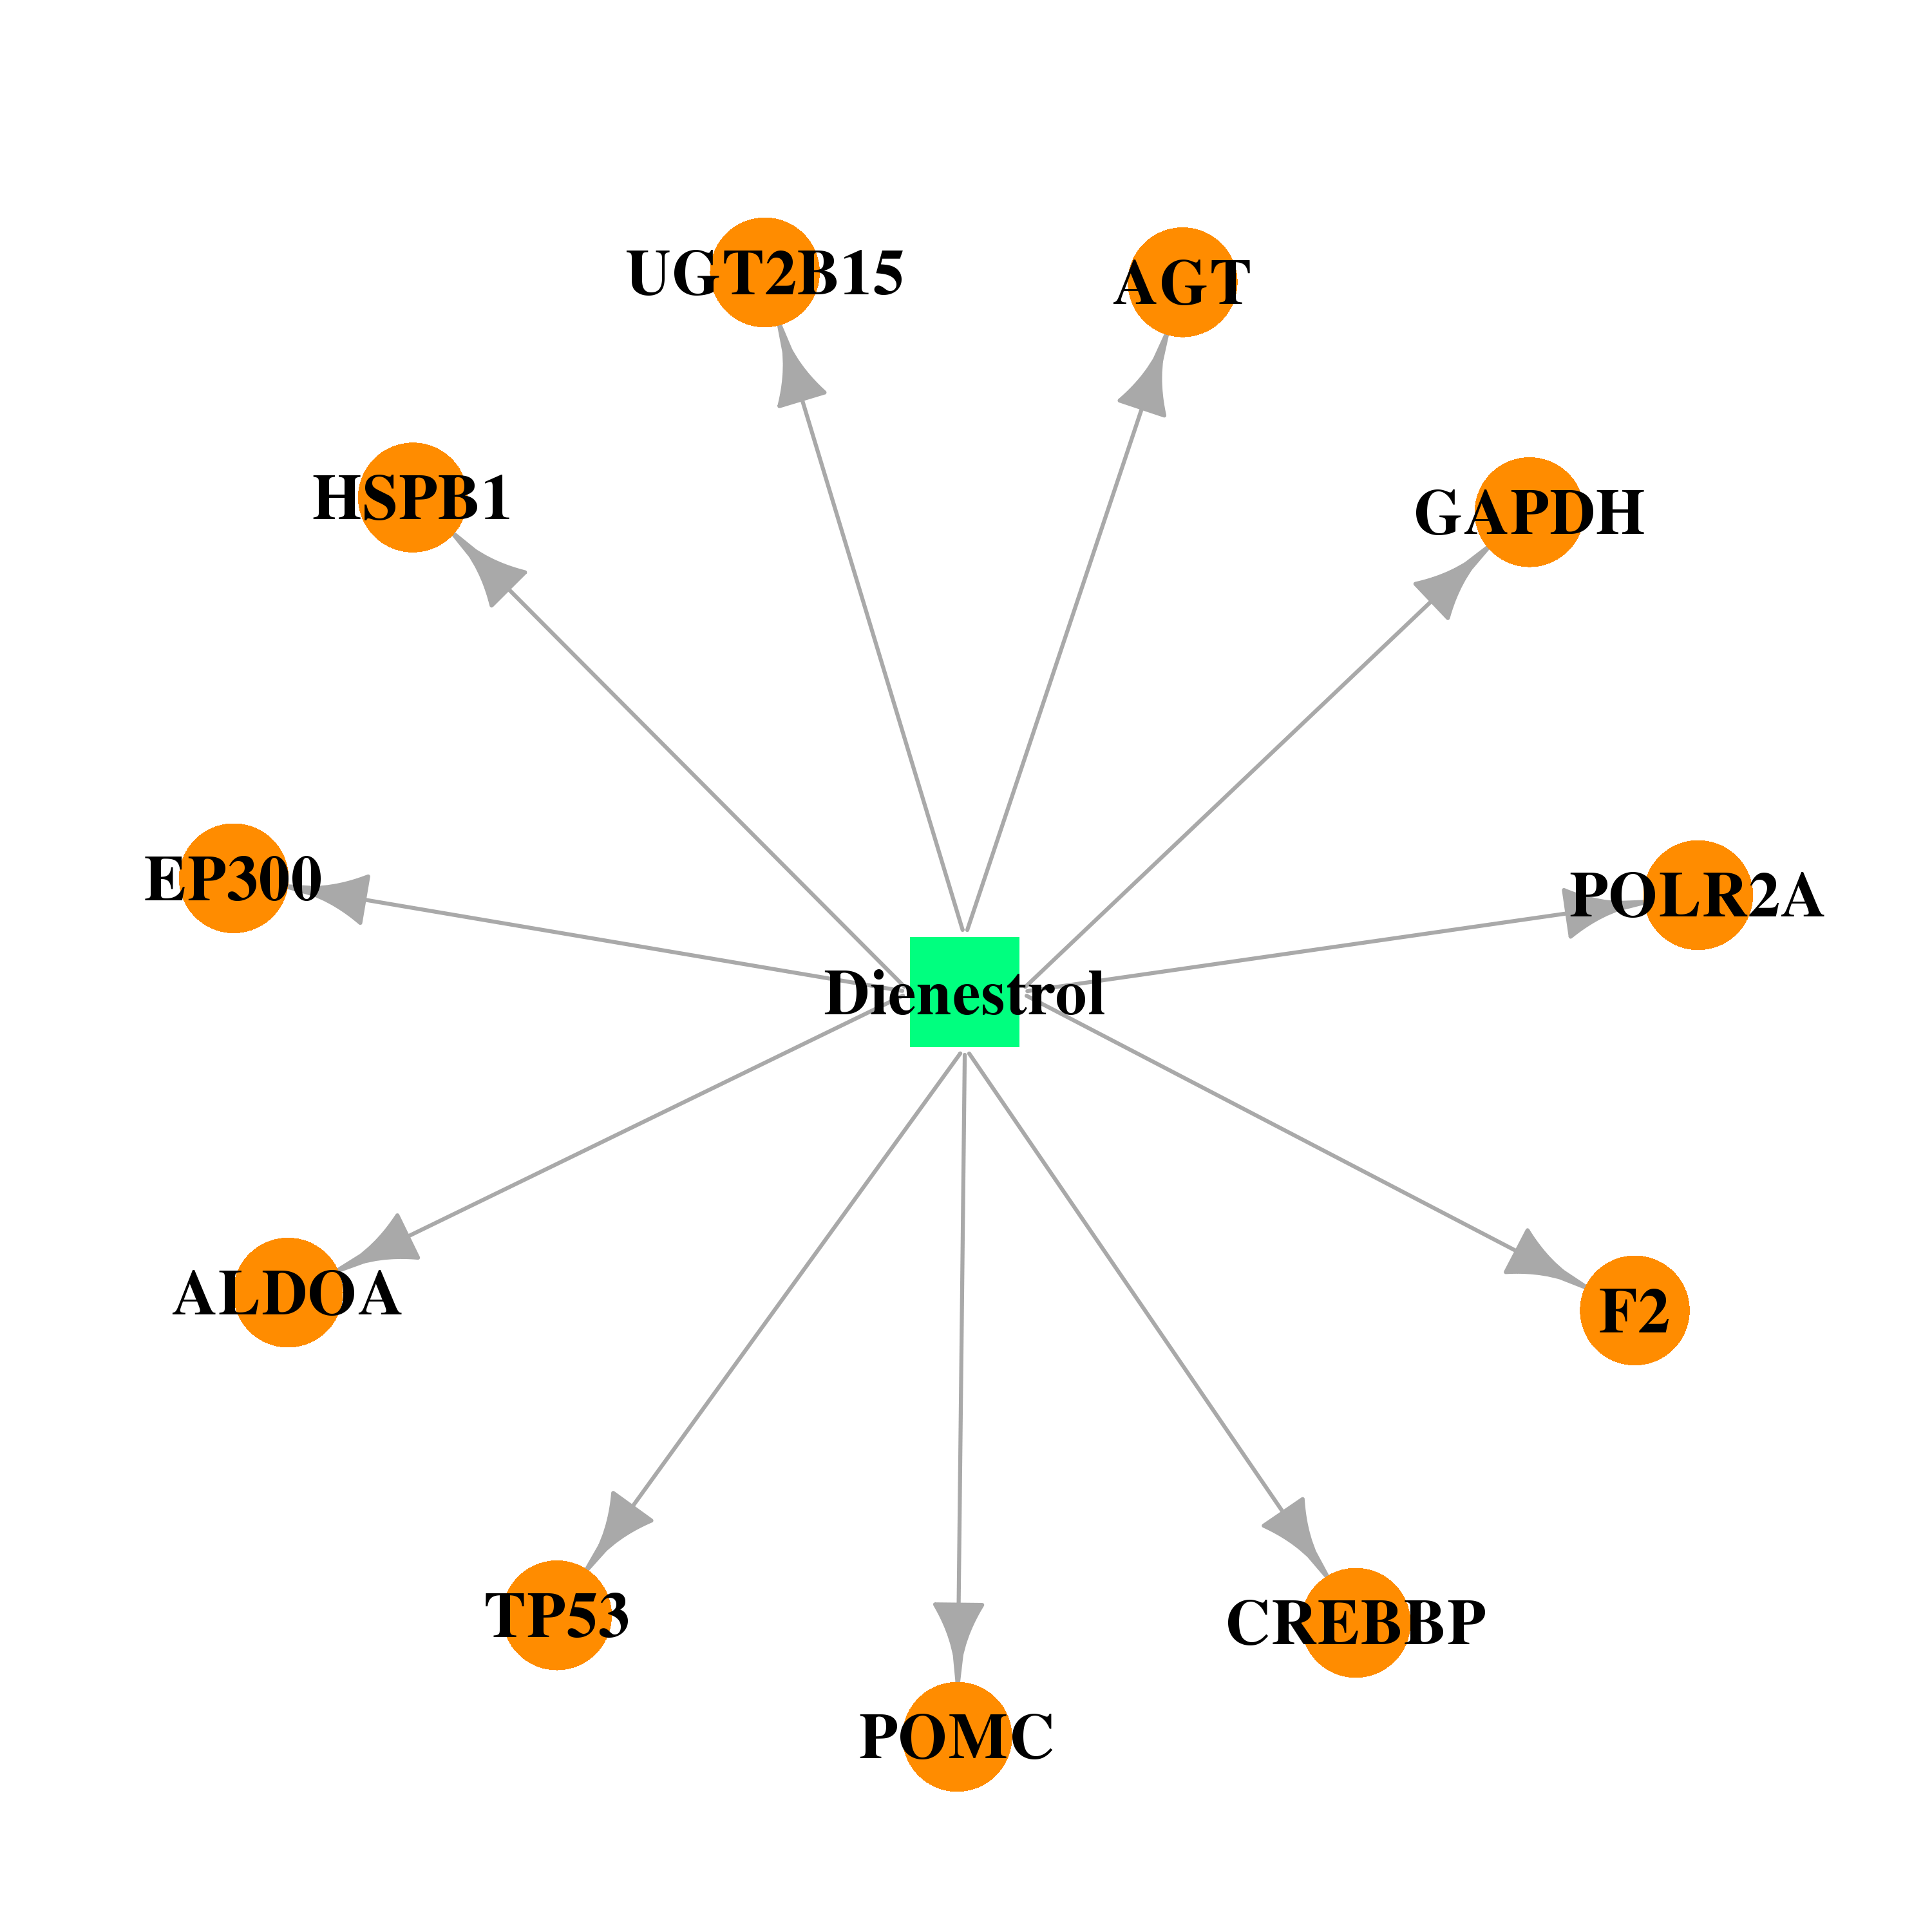 | 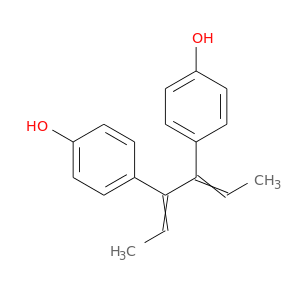 |
| DB00255 | tumor protein p53 | approved | Diethylstilbestrol |  |  |
| DB00783 | tumor protein p53 | approved; investigational | Estradiol | 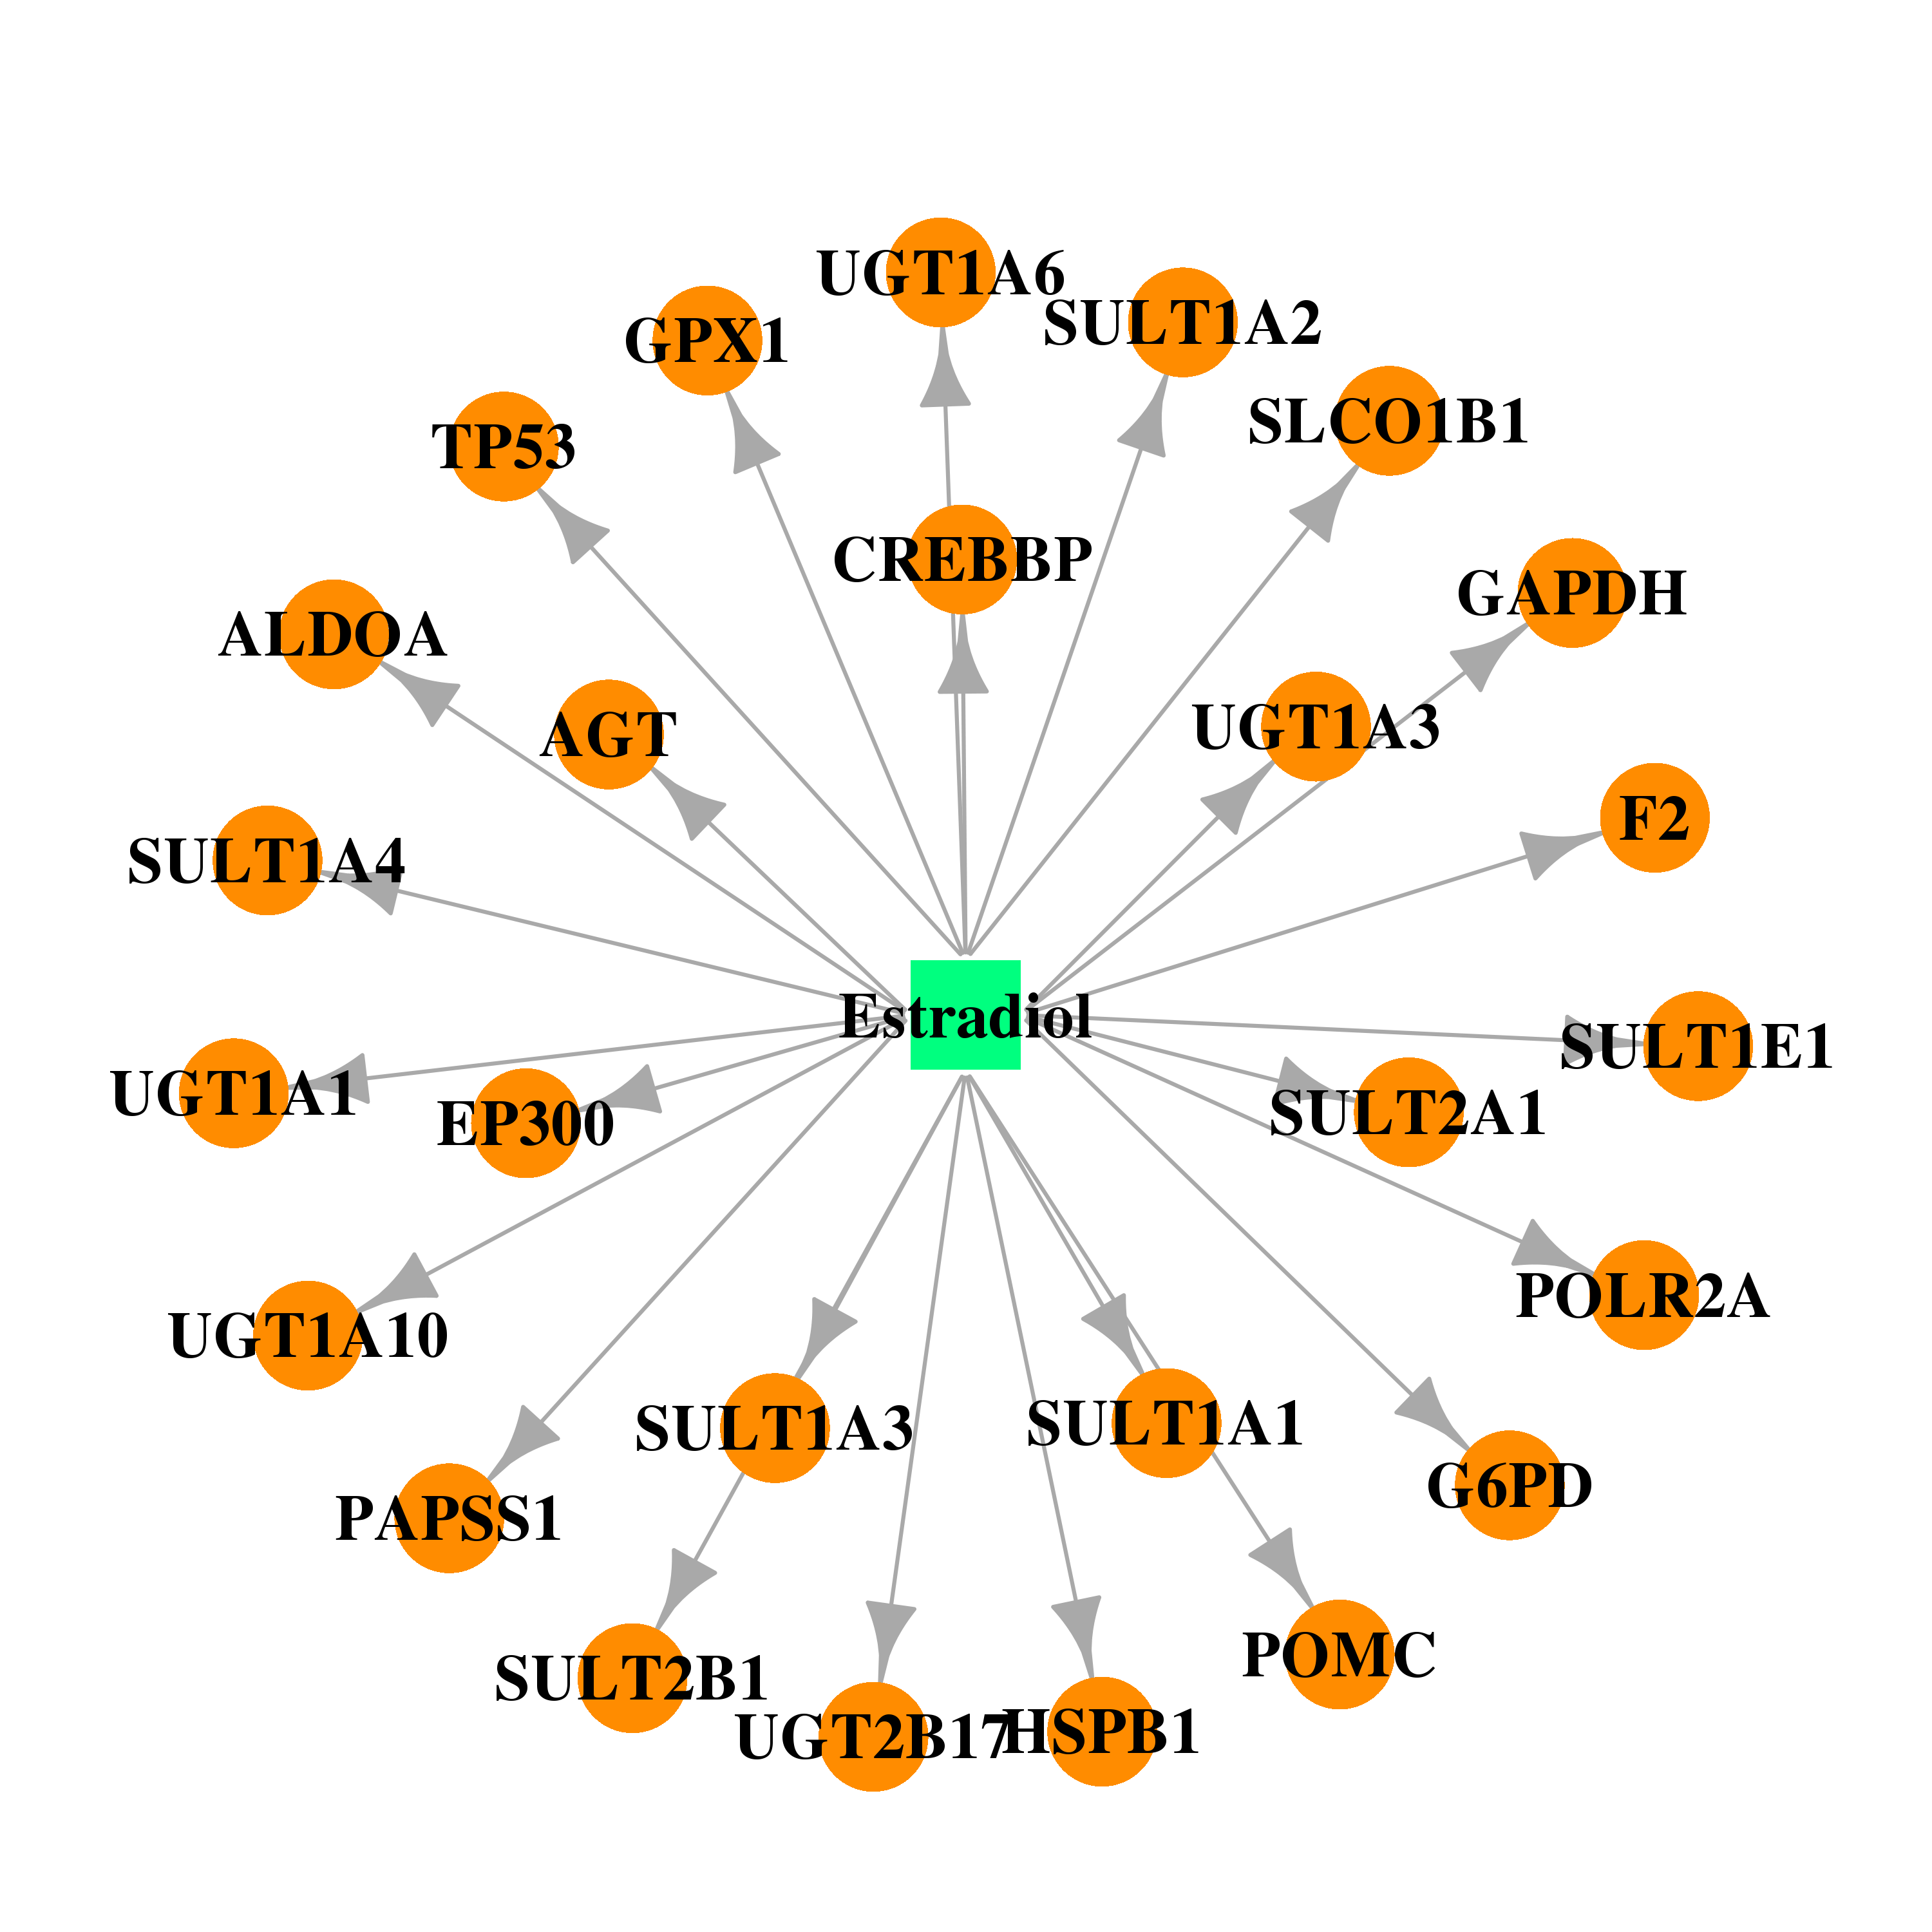 | 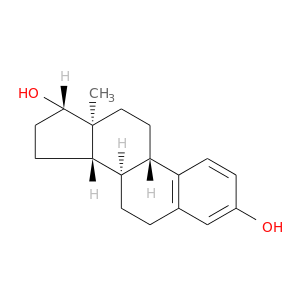 |
| DB00655 | tumor protein p53 | approved | Estrone | 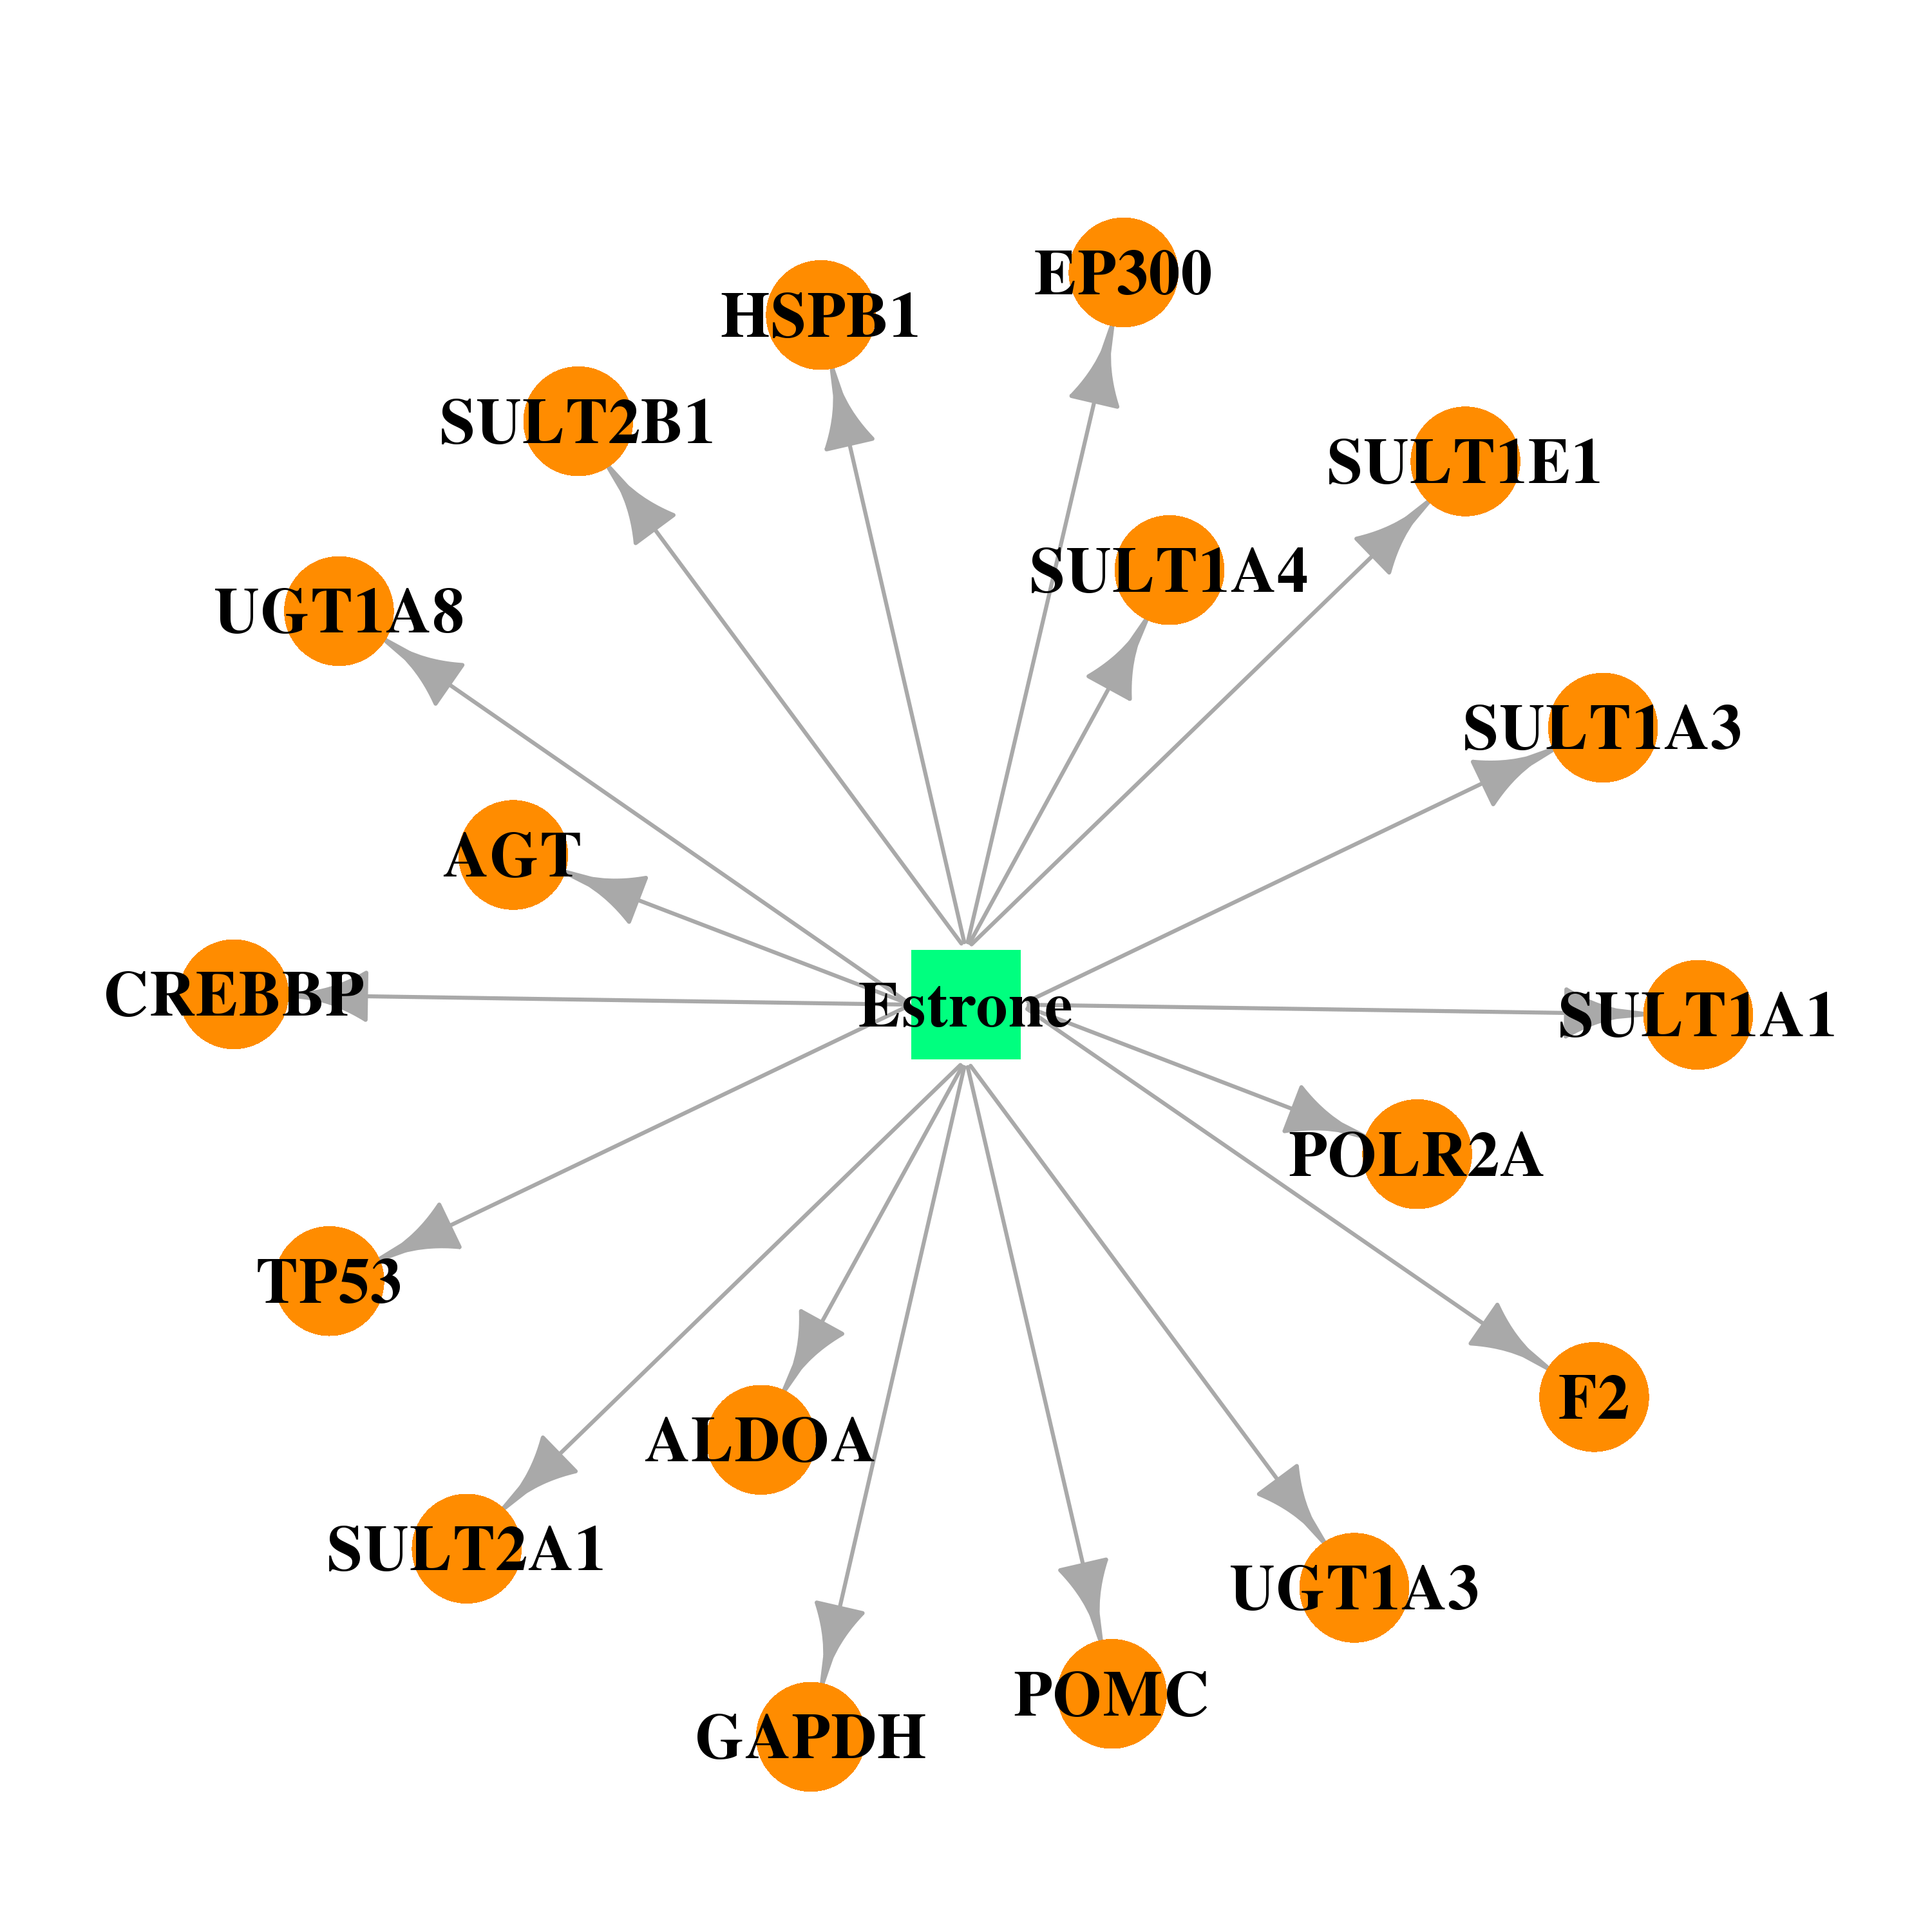 | 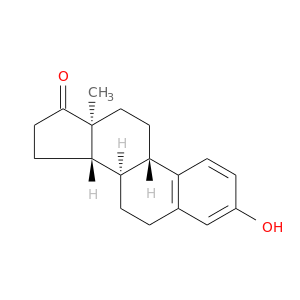 |
| DB00977 | tumor protein p53 | approved | Ethinyl Estradiol | 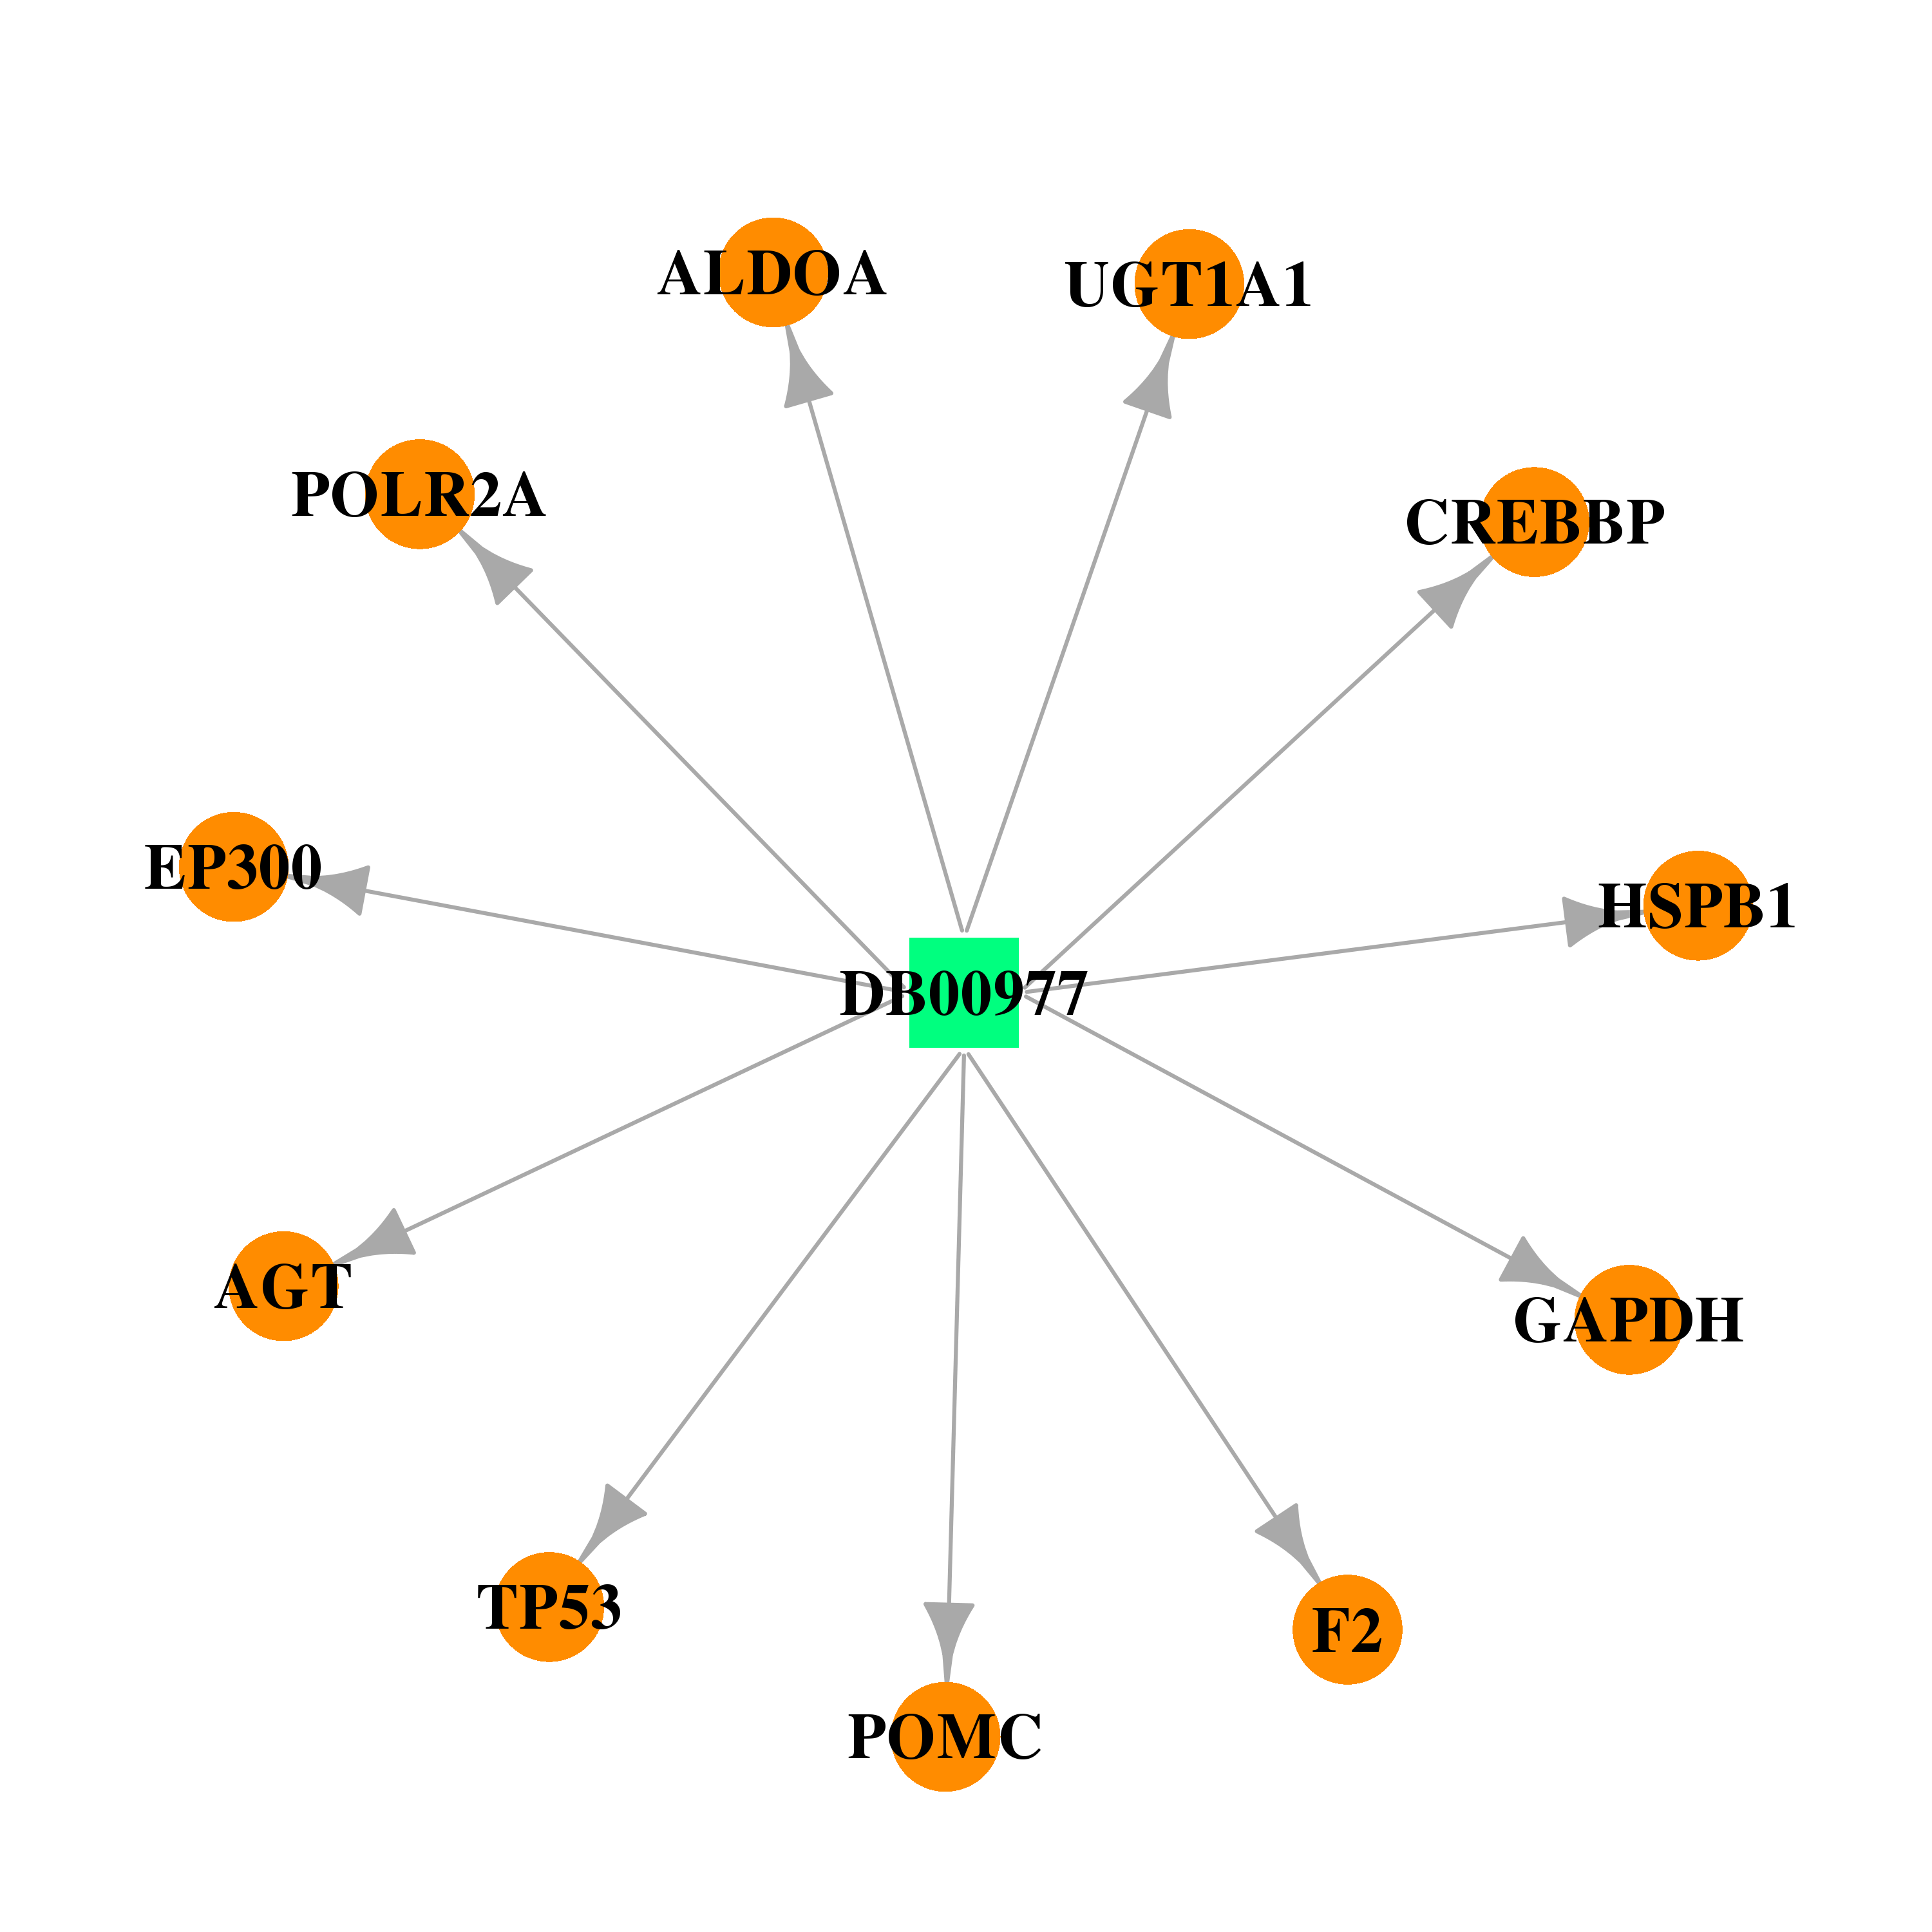 |  |
| DB00958 | tumor protein p53 | approved | Carboplatin | 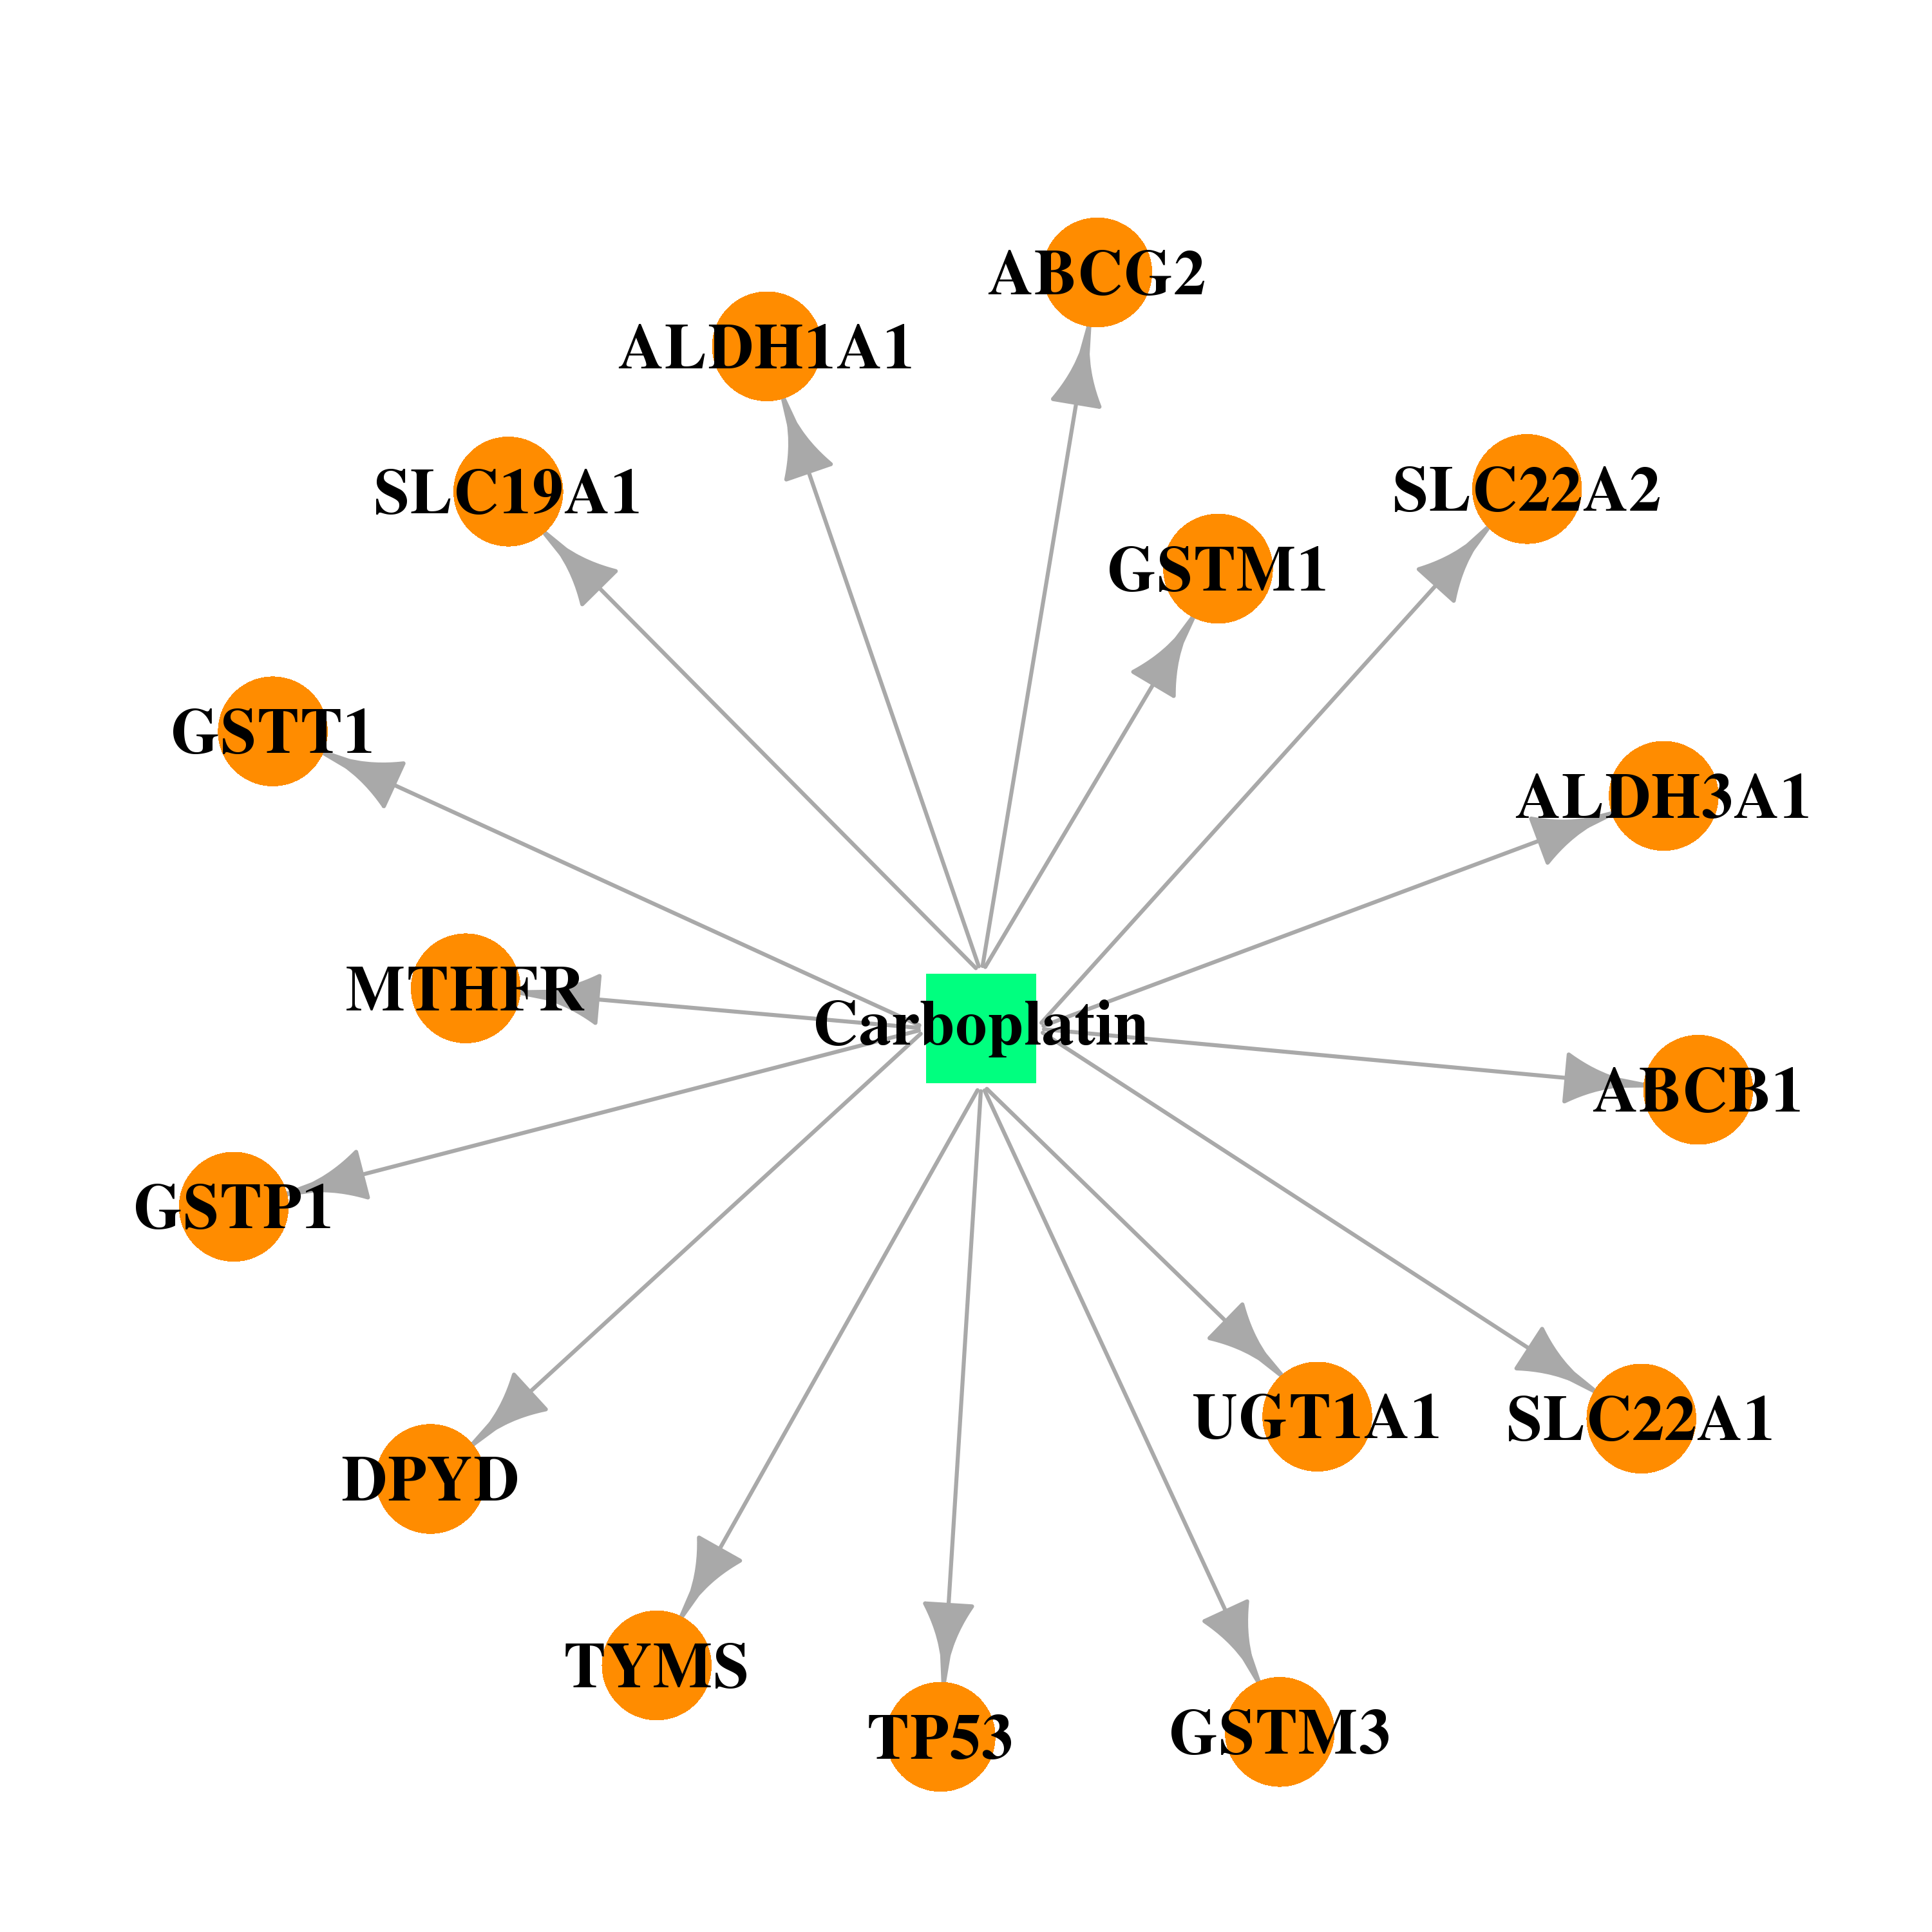 |  |
| DB00531 | tumor protein p53 | approved; investigational | Cyclophosphamide | 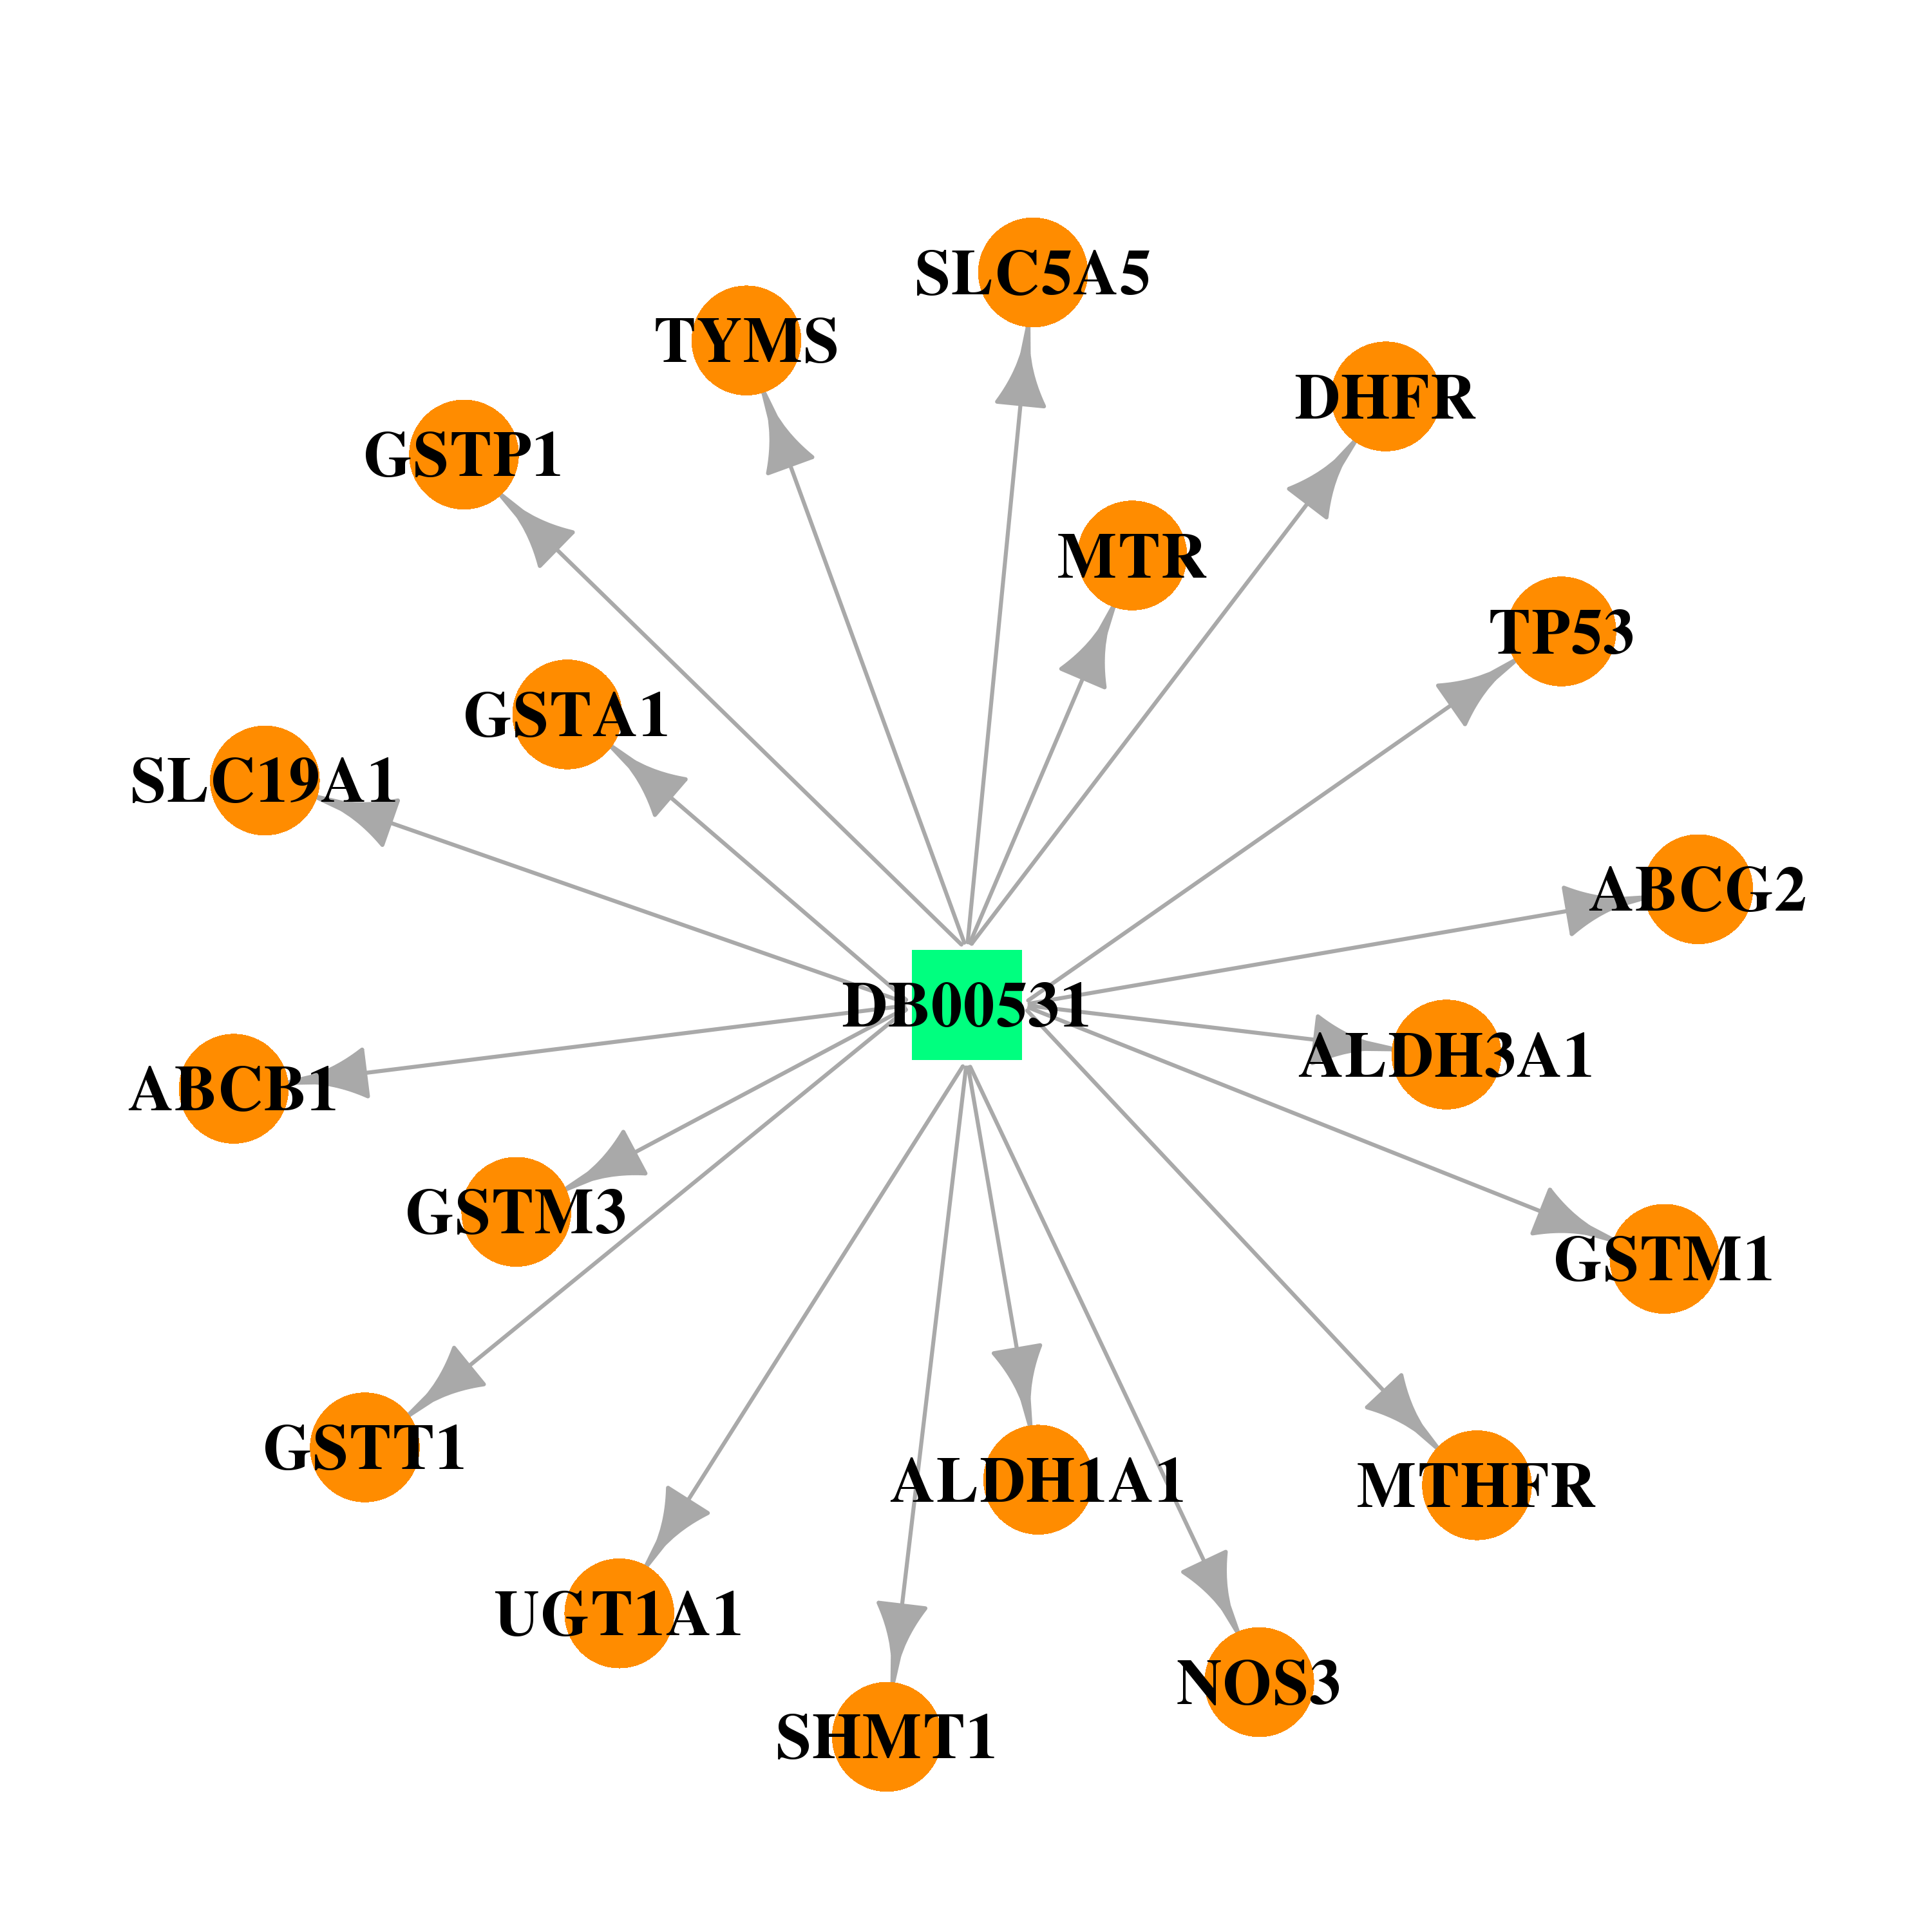 |  |
| DB01248 | tumor protein p53 | approved; investigational | Docetaxel | 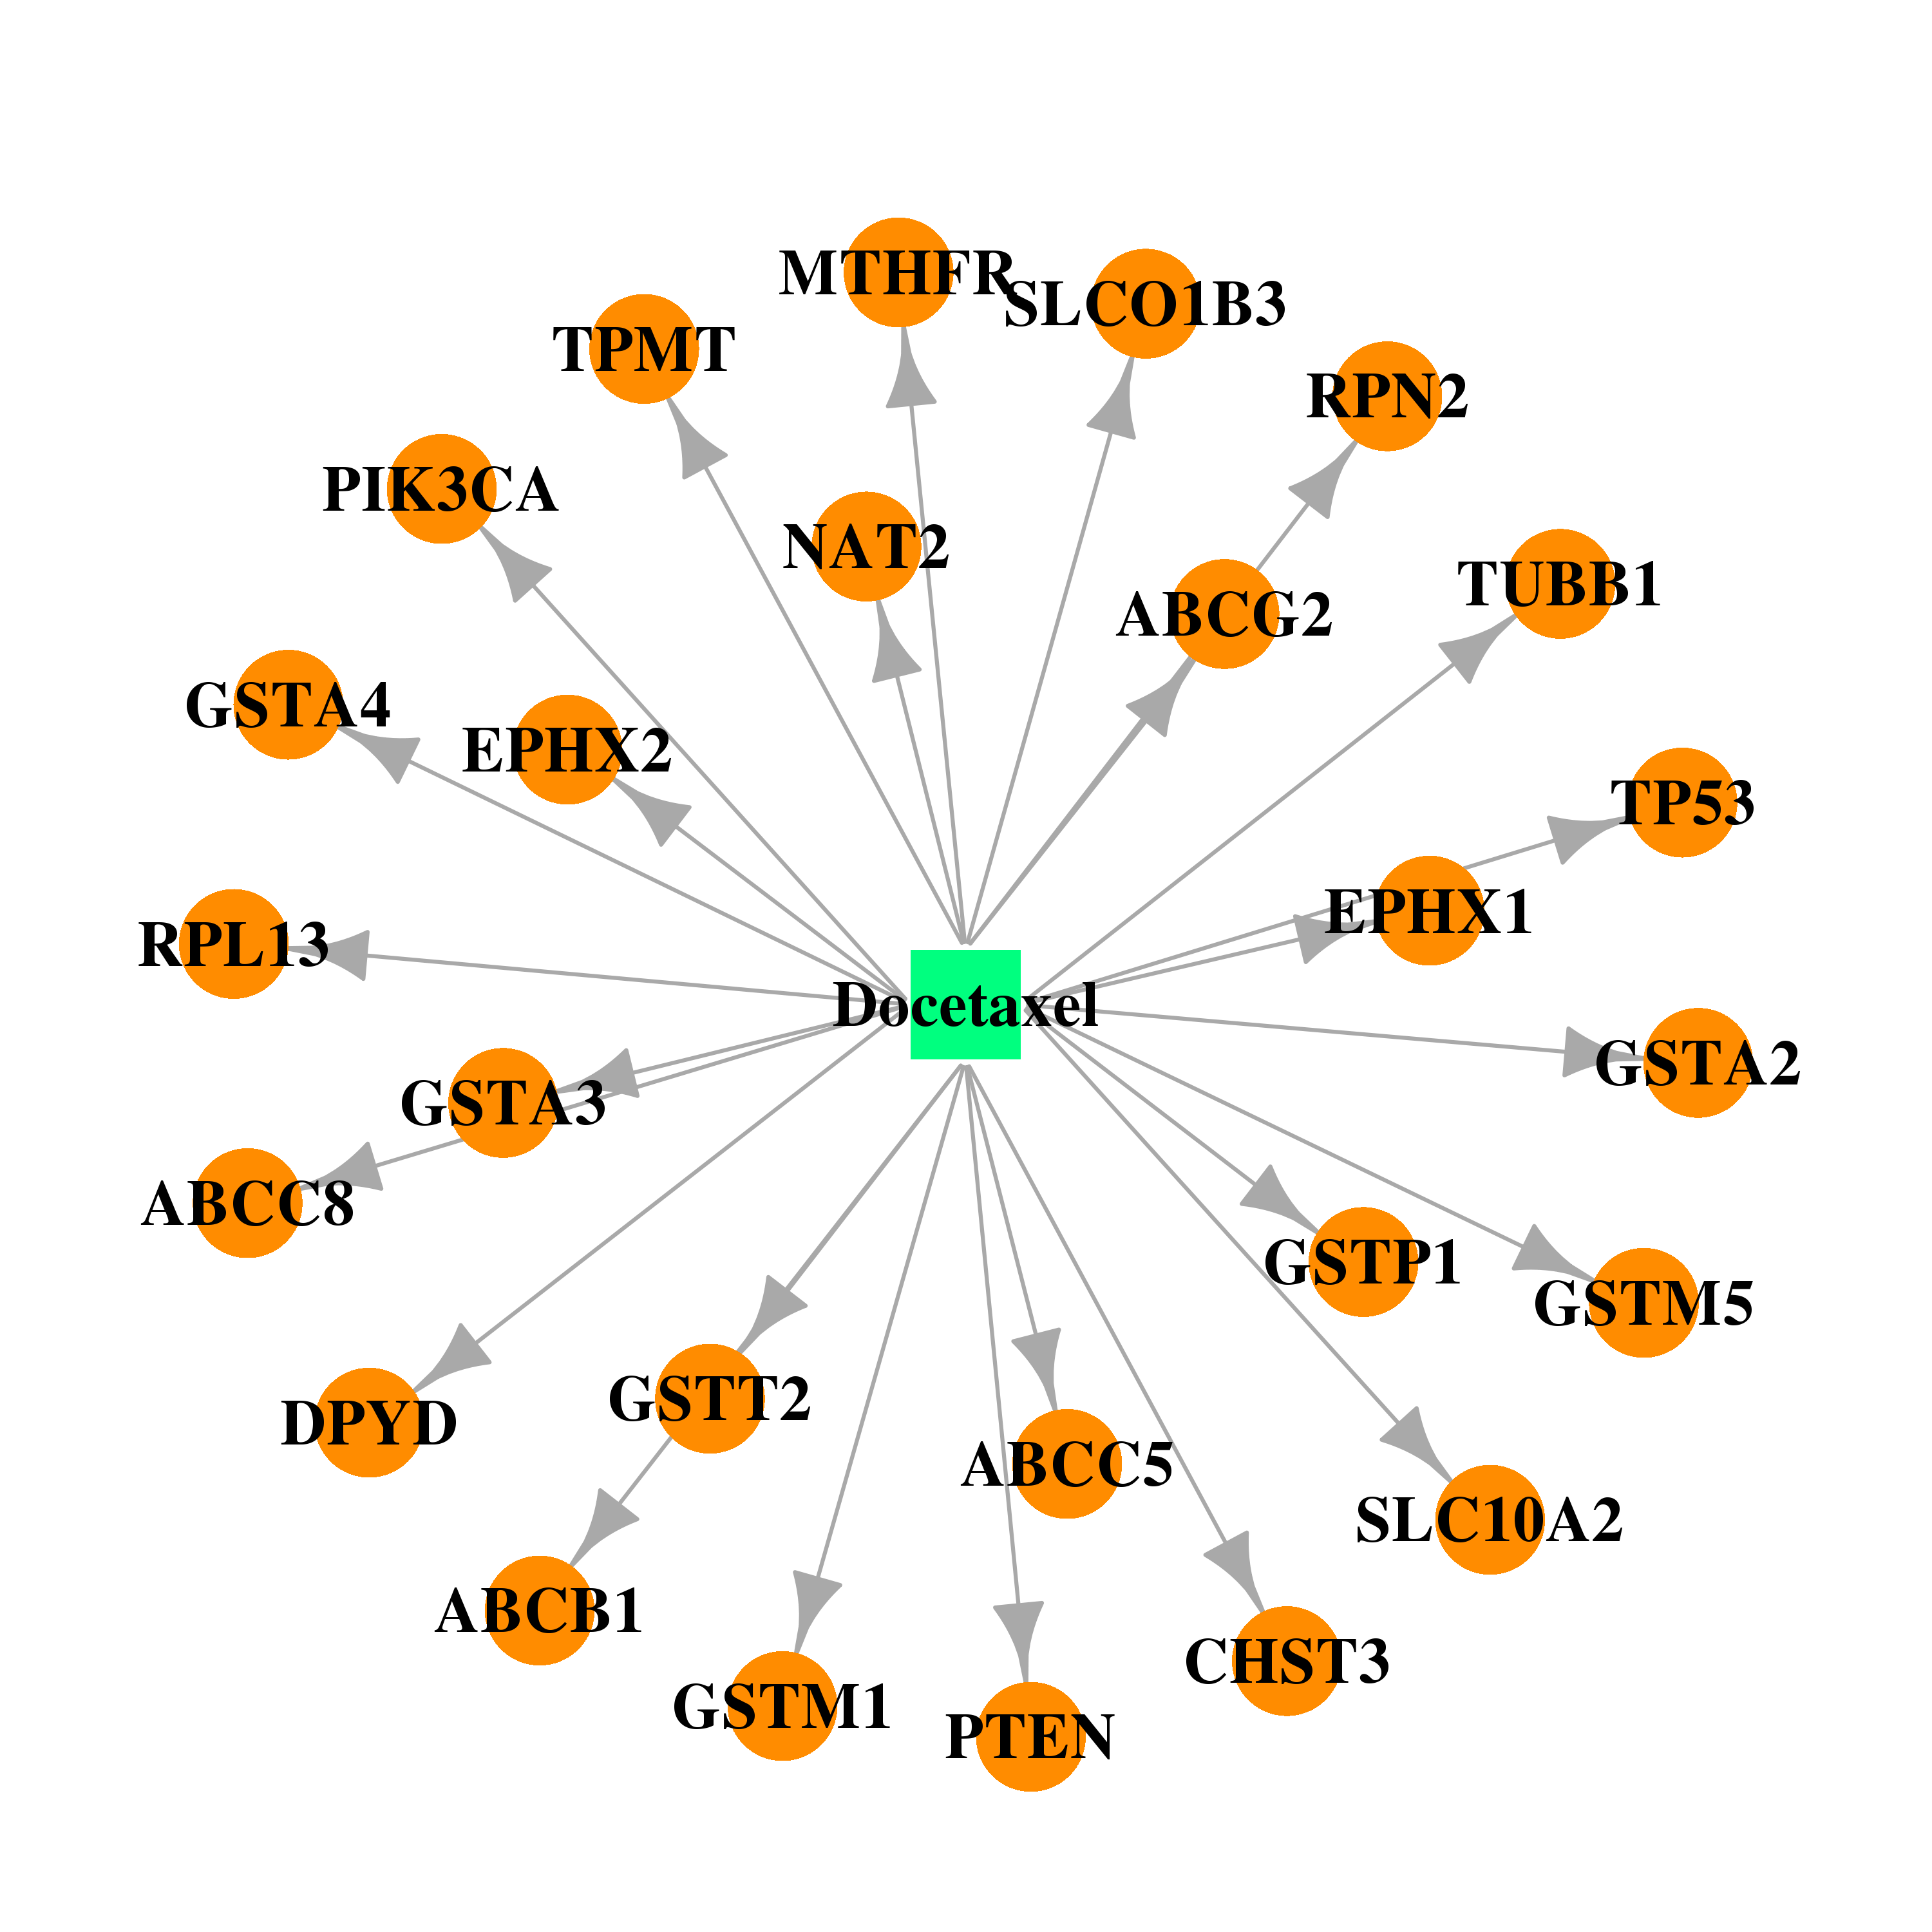 |  |
| DB00997 | tumor protein p53 | approved; investigational | Doxorubicin |  |  |
| DB00773 | tumor protein p53 | approved | Etoposide |  |  |
| DB00544 | tumor protein p53 | approved | Fluorouracil |  |  |
| DB01229 | tumor protein p53 | approved | Paclitaxel | 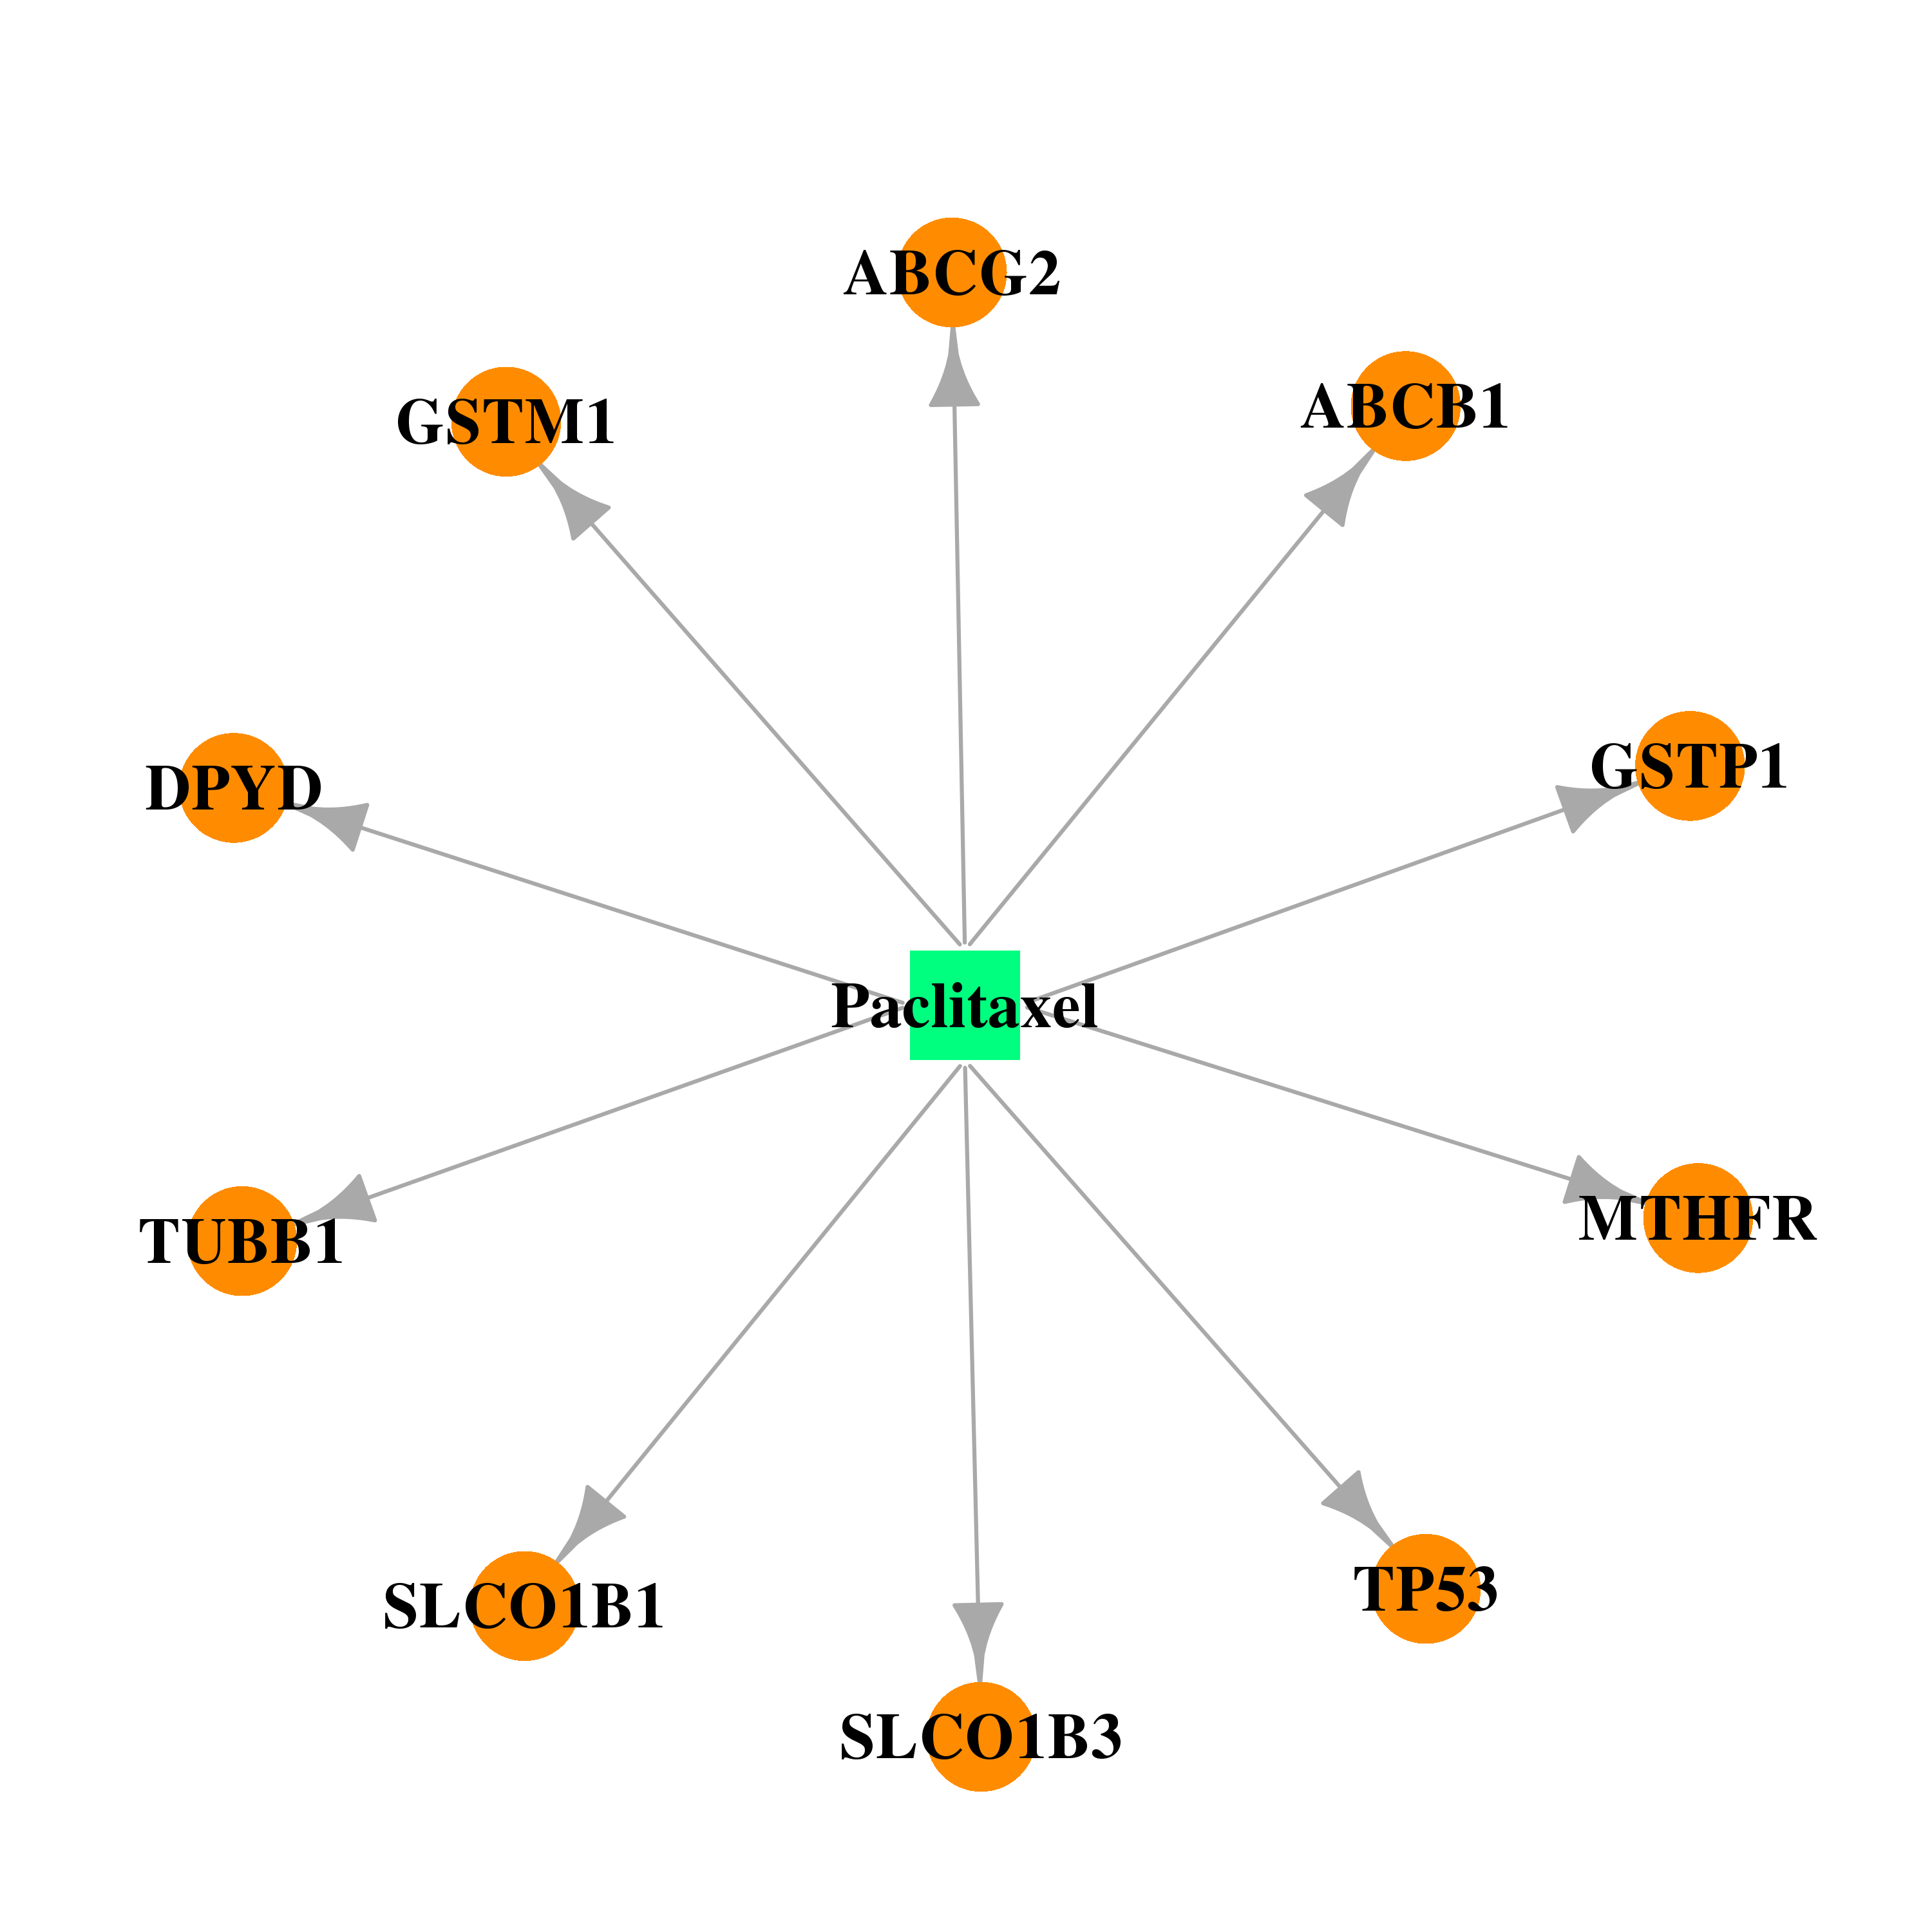 | 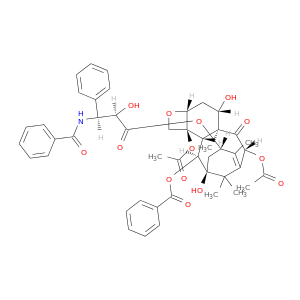 |
| DB01030 | tumor protein p53 | approved; investigational | Topotecan |  | 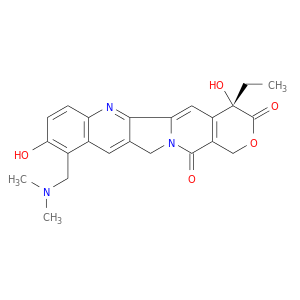 |
| DB00515 | tumor protein p53 | approved | Cisplatin |  |  |
| DB01033 | tumor protein p53 | approved | Mercaptopurine | 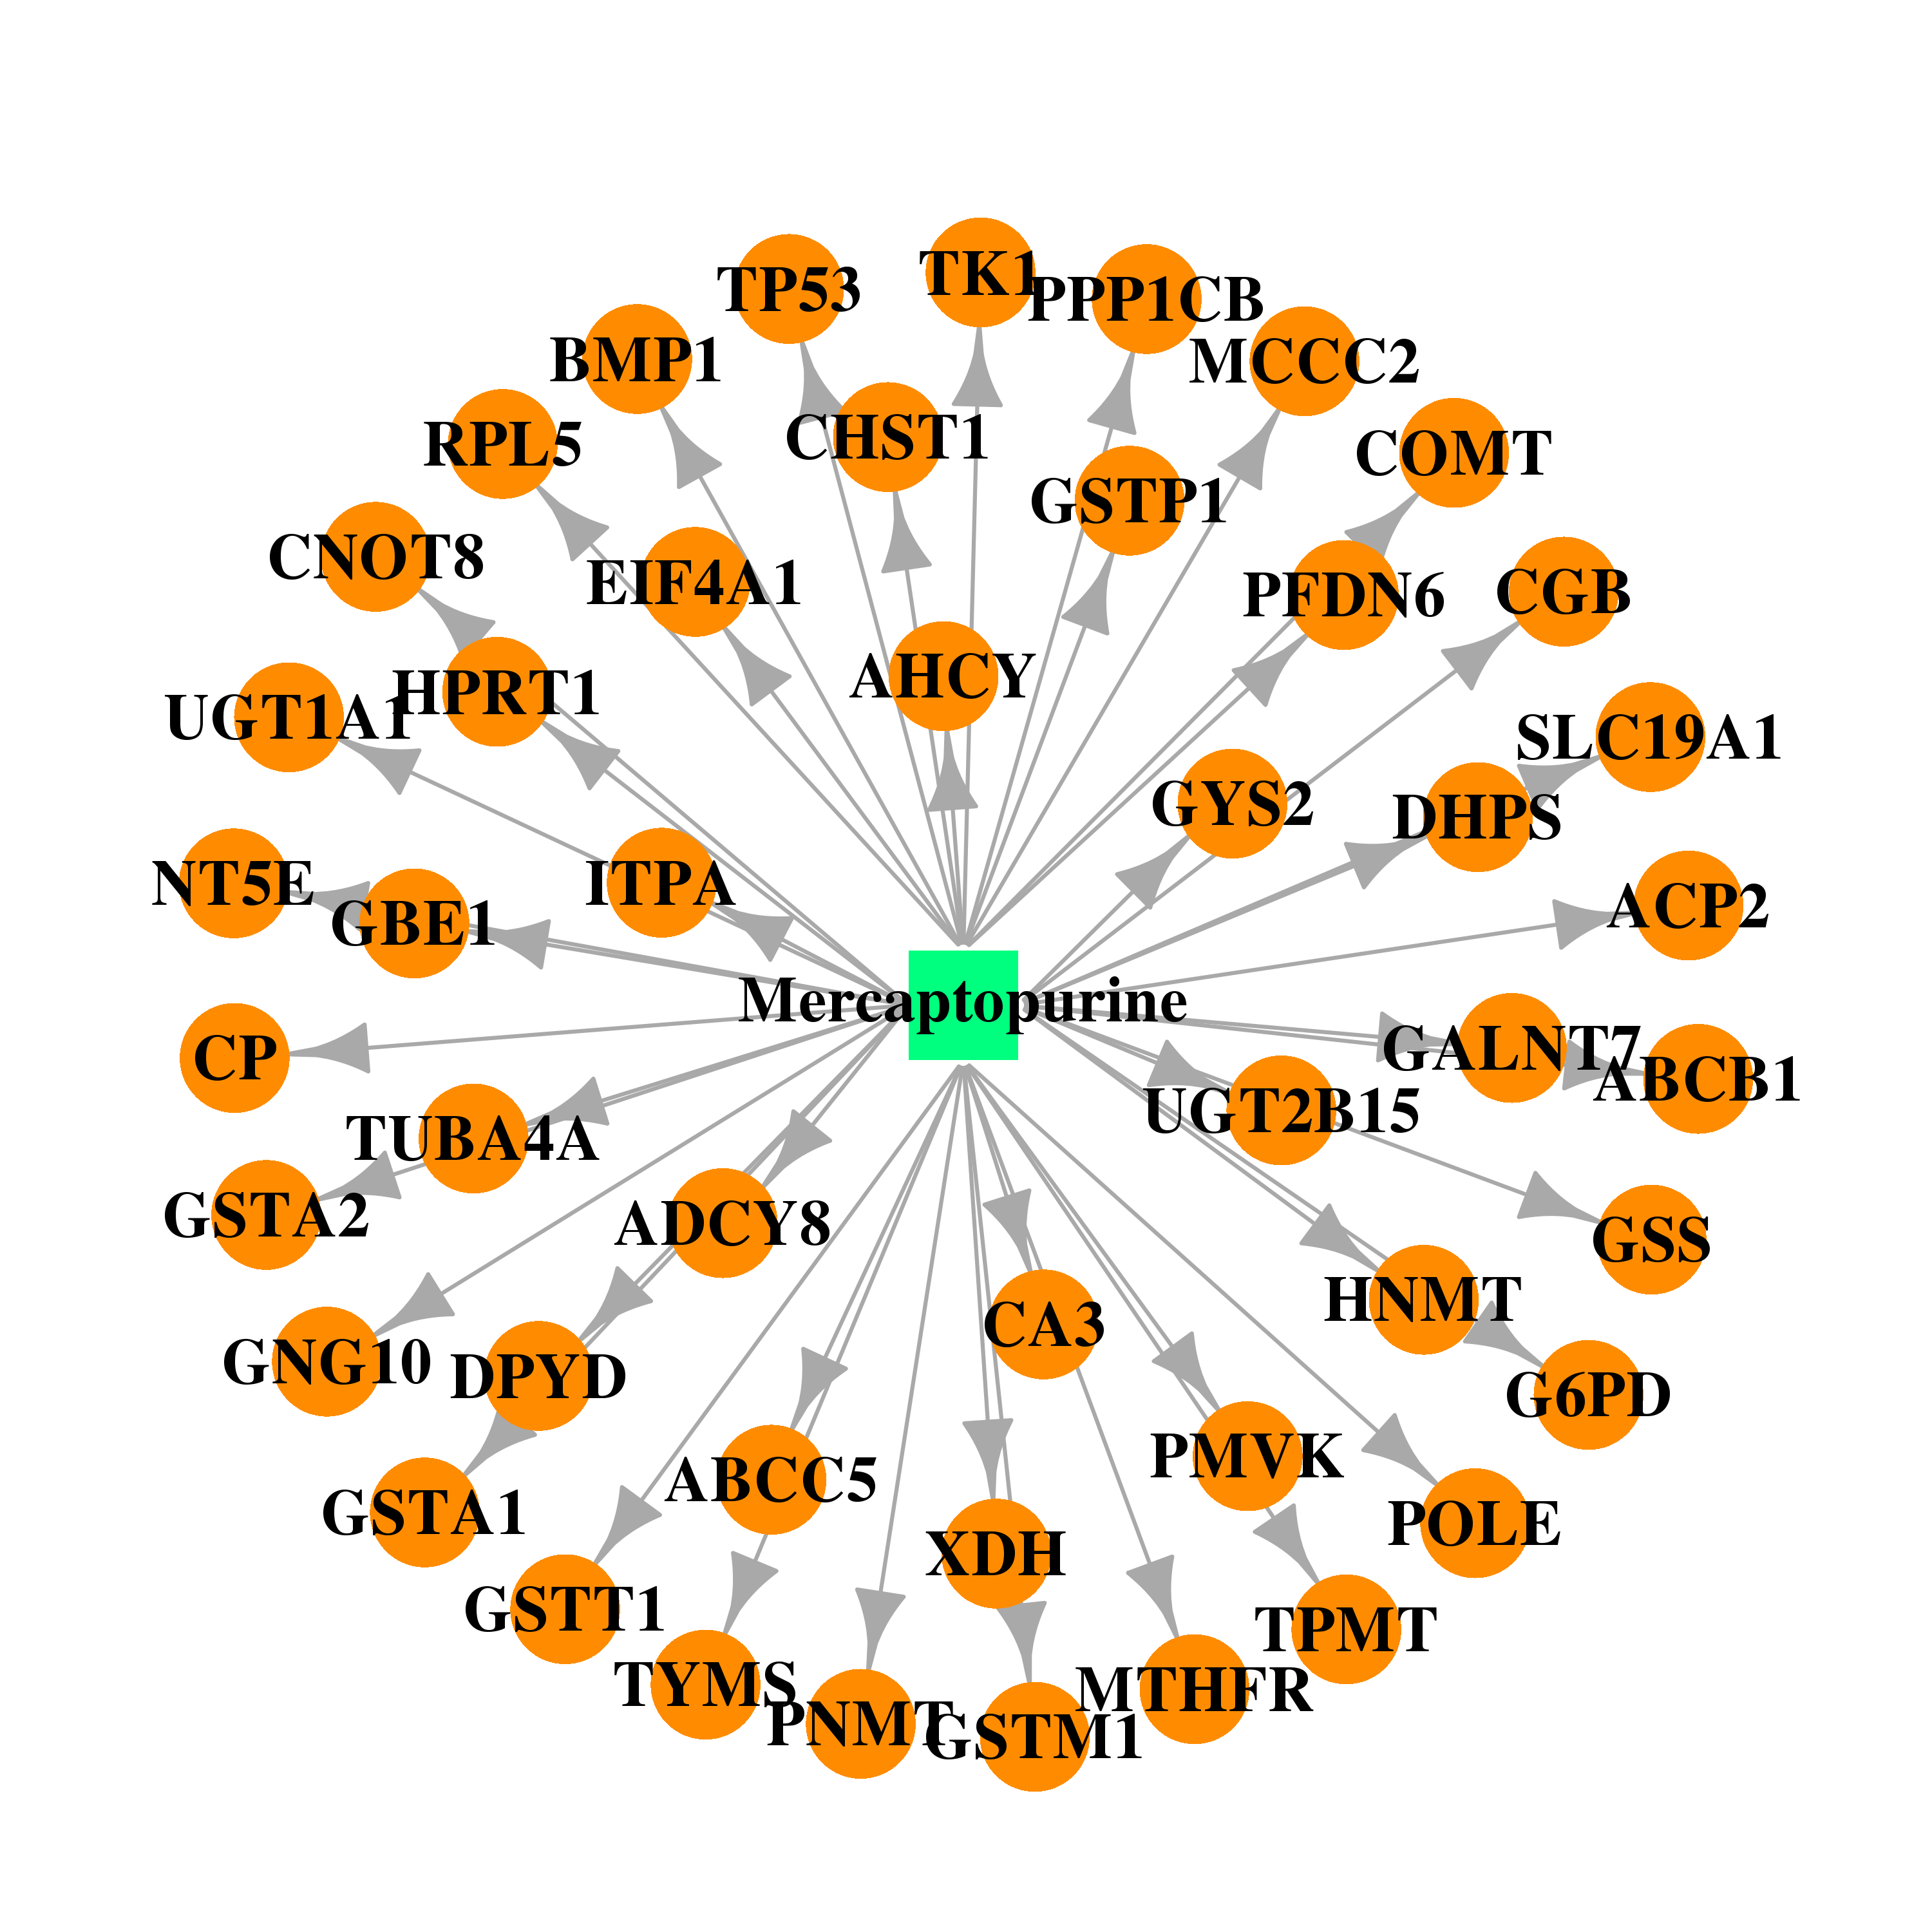 |  |
| DB00563 | tumor protein p53 | approved | Methotrexate |  |  |
| DB01050 | tumor protein p53 | approved | Ibuprofen | 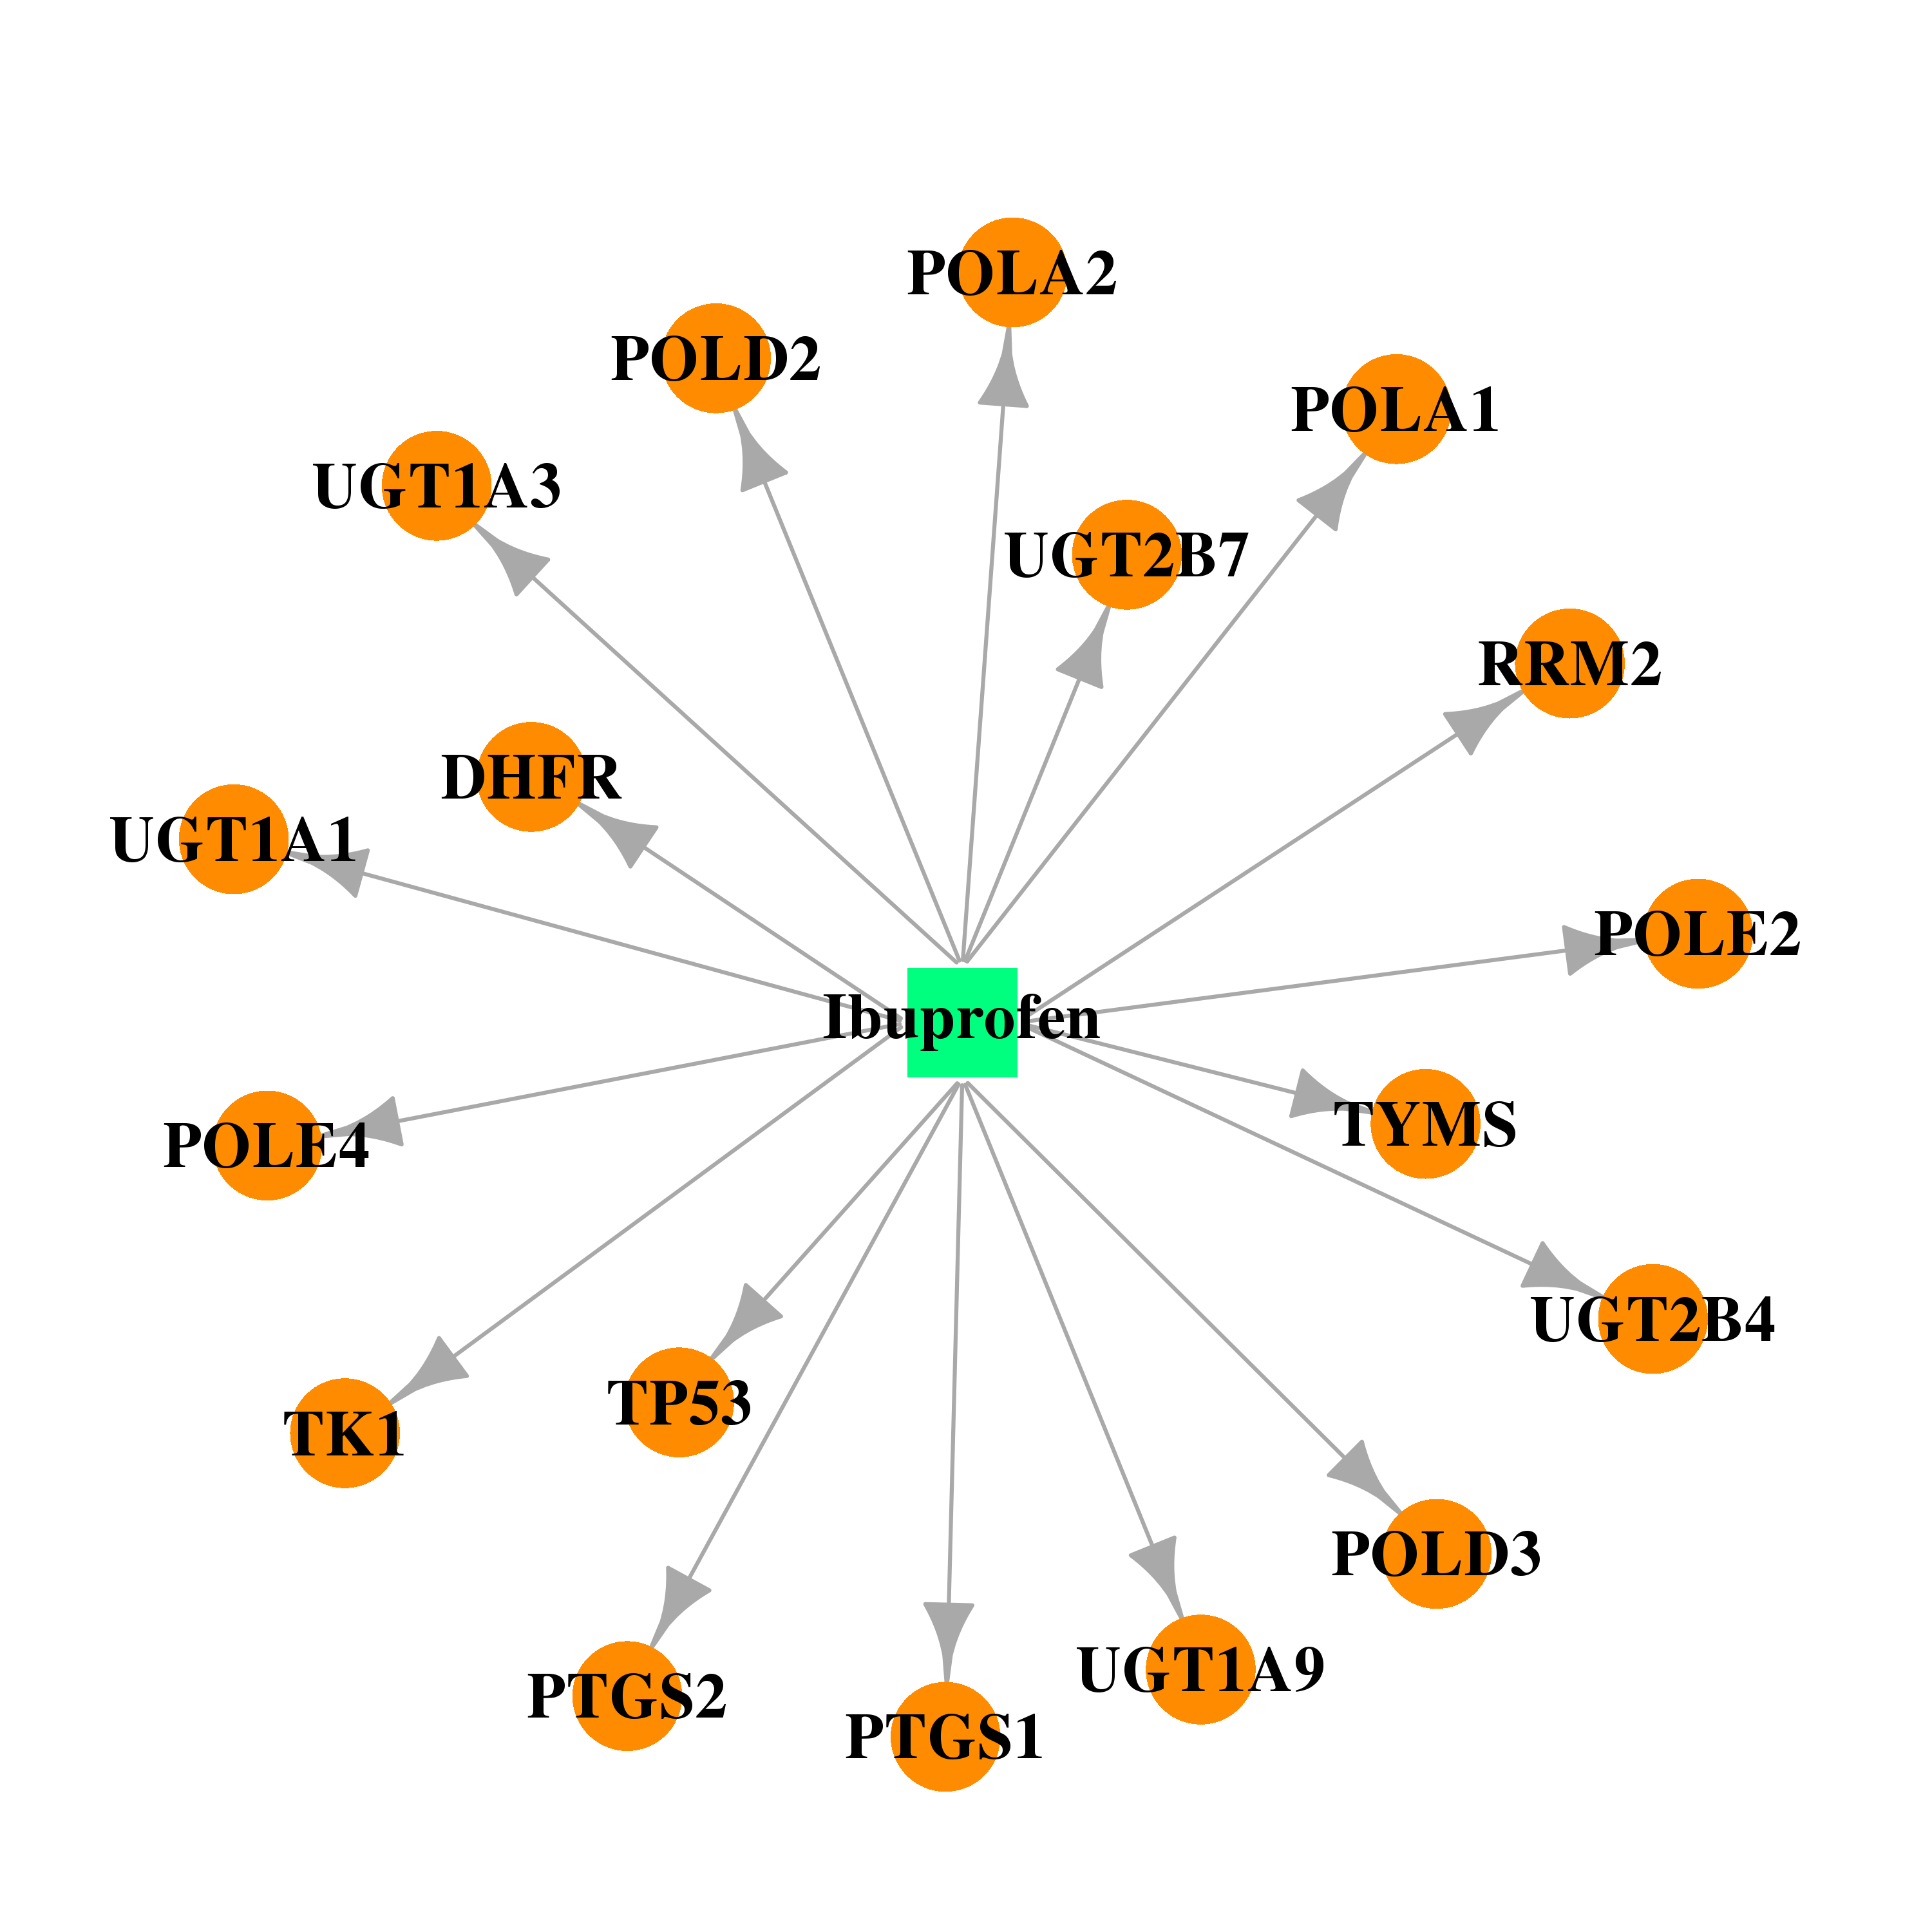 |  |
| DB00291 | tumor protein p53 | approved | Chlorambucil | 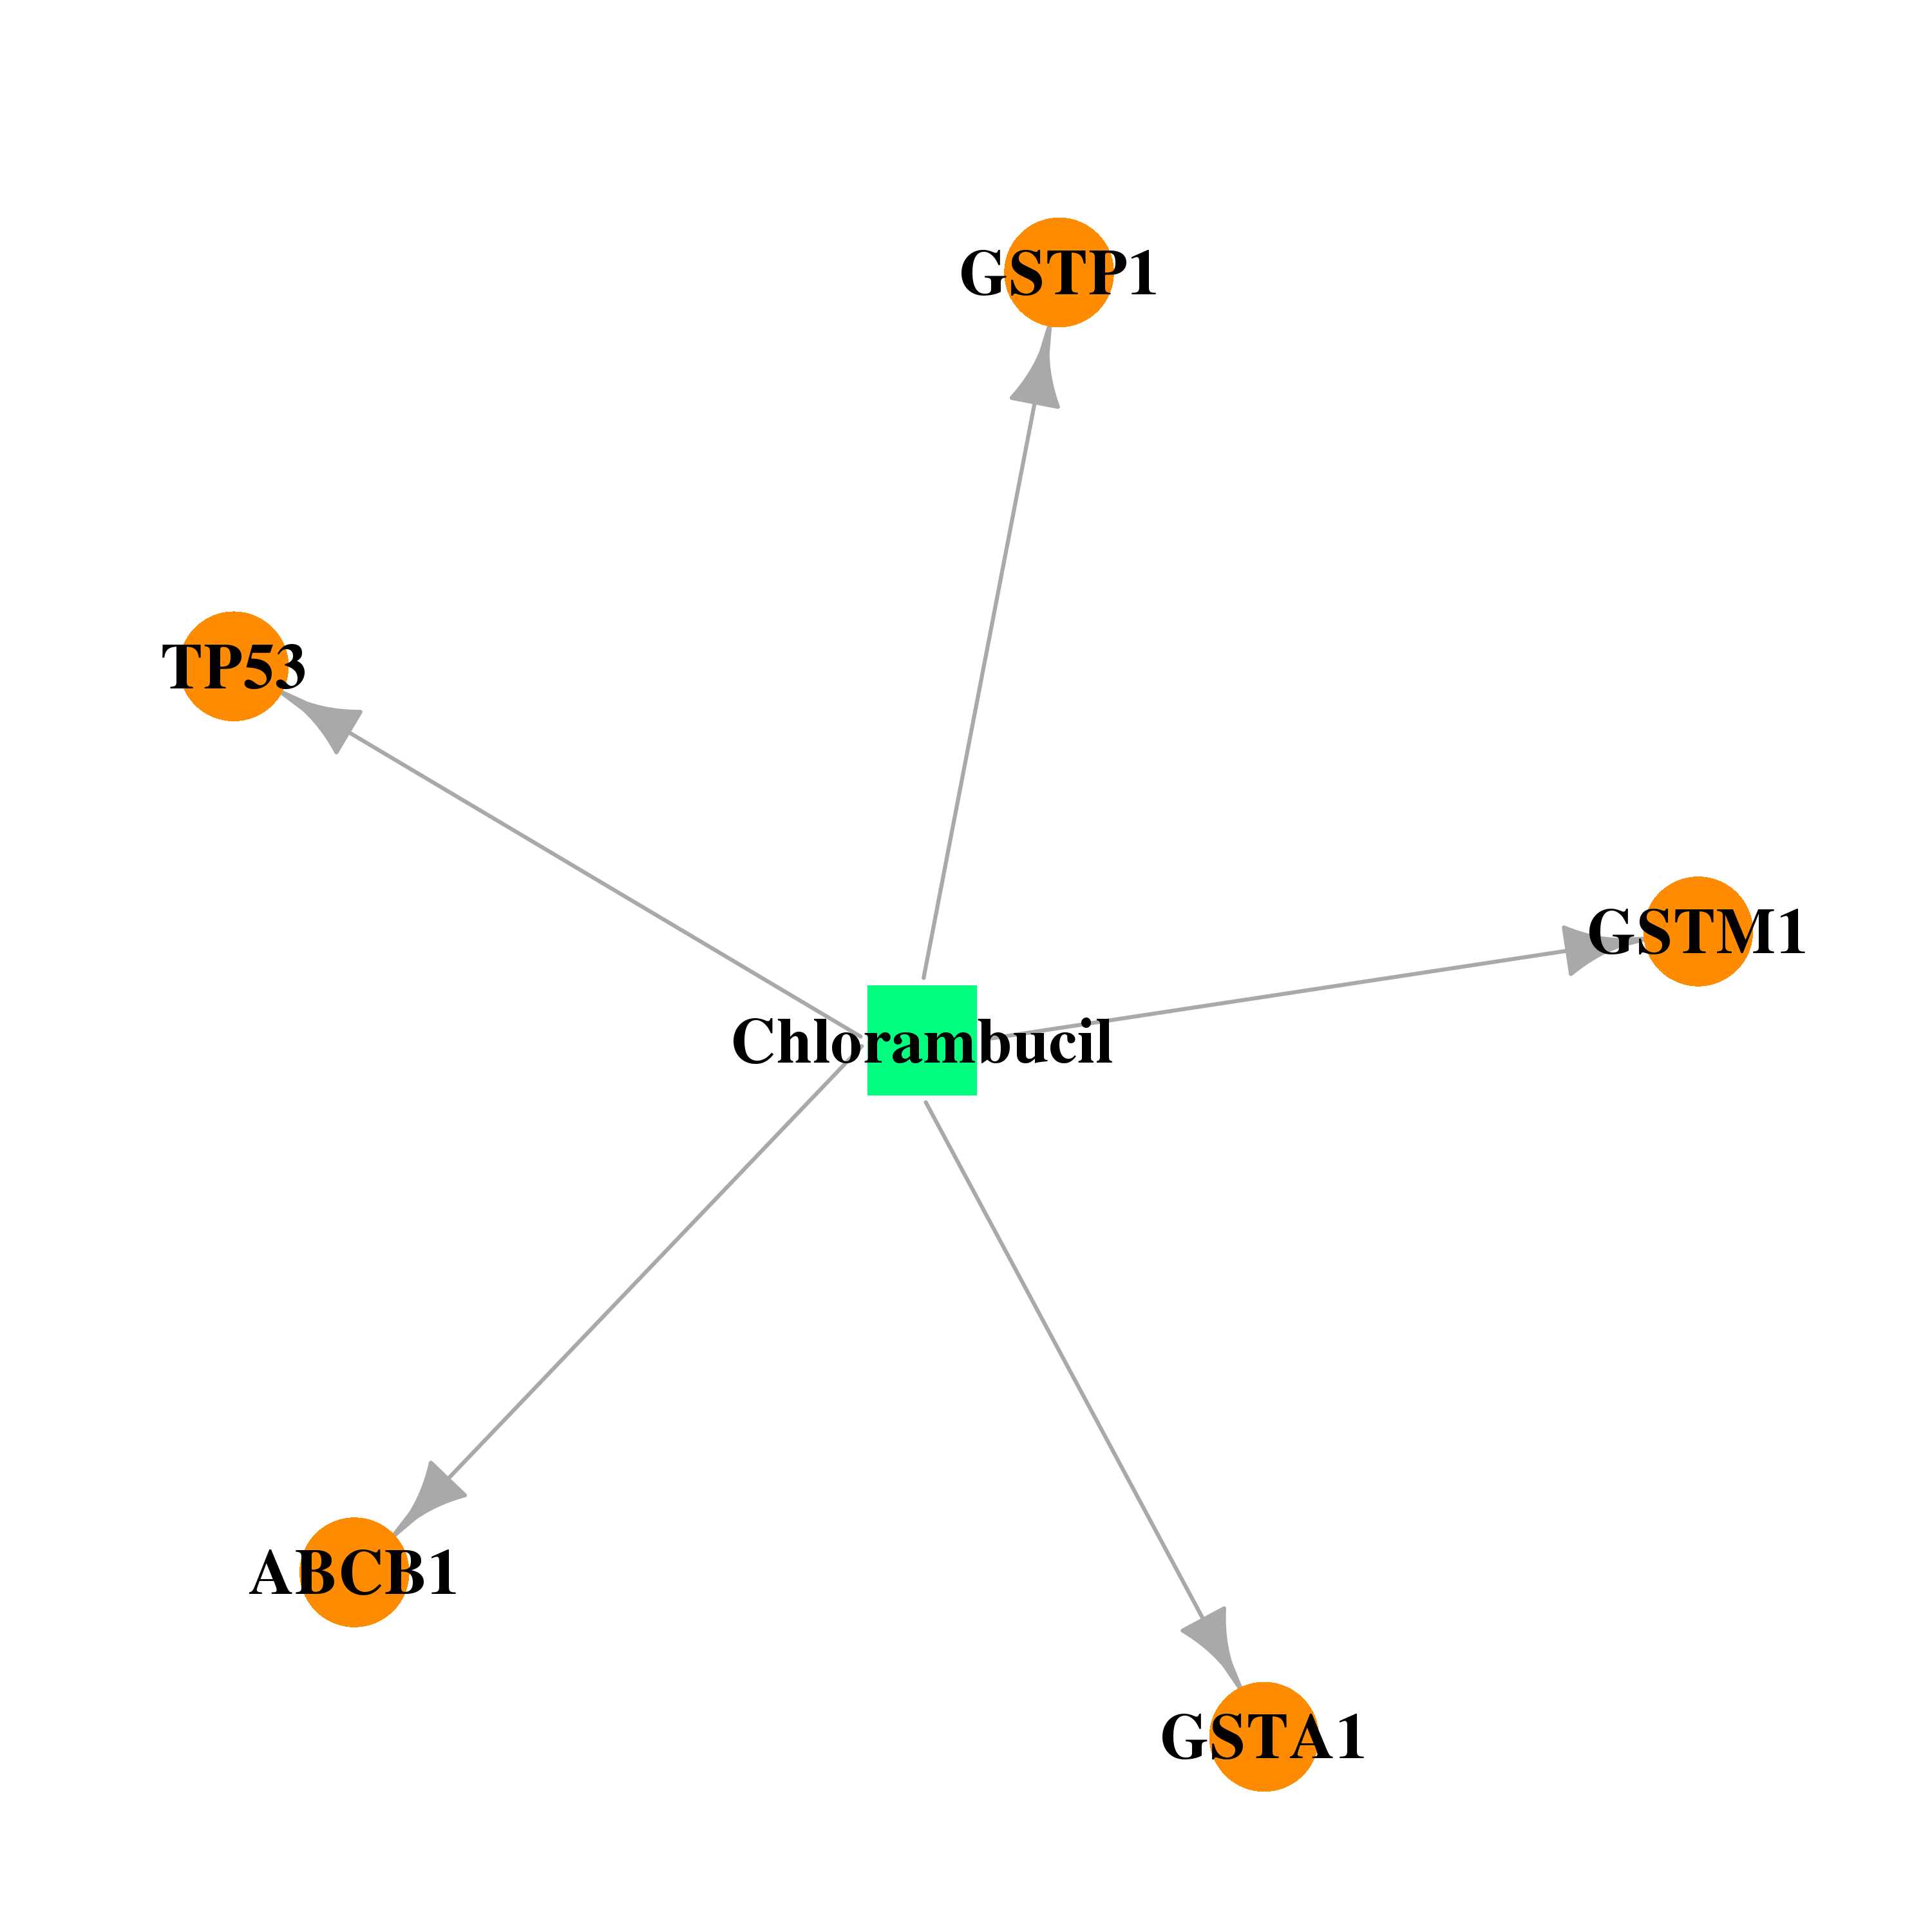 |  |
| Top |
| Cross referenced IDs for TP53 |
| * We obtained these cross-references from Uniprot database. It covers 150 different DBs, 18 categories. http://www.uniprot.org/help/cross_references_section |
: Open all cross reference information
|
Copyright © 2016-Present - The Univsersity of Texas Health Science Center at Houston @ |