|
||||||||||||||||||||
| |
| Phenotypic Information (metabolism pathway, cancer, disease, phenome) |
| |
| |
| Gene-Gene Network Information: Co-Expression Network, Interacting Genes & KEGG |
| |
|


| Gene Summary for TPH1 |
| Basic gene info. | Gene symbol | TPH1 |
| Gene name | tryptophan hydroxylase 1 | |
| Synonyms | TPRH|TRPH | |
| Cytomap | UCSC genome browser: 11p15.3-p14 | |
| Genomic location | chr11 :18042083-18062335 | |
| Type of gene | protein-coding | |
| RefGenes | NM_004179.2, | |
| Ensembl id | ENSG00000129167 | |
| Description | L-tryptophan hydroxylaseindoleacetic acid-5-hydroxylasetryptophan 5-hydroxylase 1tryptophan 5-monooxygenase 1tryptophan hydroxylase (tryptophan 5-monooxygenase) | |
| Modification date | 20141207 | |
| dbXrefs | MIM : 191060 | |
| HGNC : HGNC | ||
| HPRD : 01846 | ||
| Protein | UniProt: P17752 go to UniProt's Cross Reference DB Table | |
| Expression | CleanEX: HS_TPH1 | |
| BioGPS: 7166 | ||
| Gene Expression Atlas: ENSG00000129167 | ||
| The Human Protein Atlas: ENSG00000129167 | ||
| Pathway | NCI Pathway Interaction Database: TPH1 | |
| KEGG: TPH1 | ||
| REACTOME: TPH1 | ||
| ConsensusPathDB | ||
| Pathway Commons: TPH1 | ||
| Metabolism | MetaCyc: TPH1 | |
| HUMANCyc: TPH1 | ||
| Regulation | Ensembl's Regulation: ENSG00000129167 | |
| miRBase: chr11 :18,042,083-18,062,335 | ||
| TargetScan: NM_004179 | ||
| cisRED: ENSG00000129167 | ||
| Context | iHOP: TPH1 | |
| cancer metabolism search in PubMed: TPH1 | ||
| UCL Cancer Institute: TPH1 | ||
| Assigned class in ccmGDB | A - This gene has a literature evidence and it belongs to cancer gene. | |
| References showing role of TPH1 in cancer cell metabolism | 1. Juhász C, Nahleh Z, Zitron I, Chugani DC, Janabi MZ, et al. (2012) Tryptophan metabolism in breast cancers: molecular imaging and immunohistochemistry studies. Nuclear medicine and biology 39: 926-932. go to article | |
| Top |
| Phenotypic Information for TPH1(metabolism pathway, cancer, disease, phenome) |
| Cancer | CGAP: TPH1 |
| Familial Cancer Database: TPH1 | |
| * This gene is included in those cancer gene databases. |
|
|
|
|
|
|
| ||||||||||||||
Oncogene 1 | Significant driver gene in | |||||||||||||||||||
| cf) number; DB name 1 Oncogene; http://nar.oxfordjournals.org/content/35/suppl_1/D721.long, 2 Tumor Suppressor gene; https://bioinfo.uth.edu/TSGene/, 3 Cancer Gene Census; http://www.nature.com/nrc/journal/v4/n3/abs/nrc1299.html, 4 CancerGenes; http://nar.oxfordjournals.org/content/35/suppl_1/D721.long, 5 Network of Cancer Gene; http://ncg.kcl.ac.uk/index.php, 1Therapeutic Vulnerabilities in Cancer; http://cbio.mskcc.org/cancergenomics/statius/ |
| KEGG_TRYPTOPHAN_METABOLISM REACTOME_METABOLISM_OF_AMINO_ACIDS_AND_DERIVATIVES | |
| OMIM | 191060; gene. |
| Orphanet | |
| Disease | KEGG Disease: TPH1 |
| MedGen: TPH1 (Human Medical Genetics with Condition) | |
| ClinVar: TPH1 | |
| Phenotype | MGI: TPH1 (International Mouse Phenotyping Consortium) |
| PhenomicDB: TPH1 | |
| Mutations for TPH1 |
| * Under tables are showing count per each tissue to give us broad intuition about tissue specific mutation patterns.You can go to the detailed page for each mutation database's web site. |
| - Statistics for Tissue and Mutation type | Top |
 |
| - For Inter-chromosomal Variations |
| There's no inter-chromosomal structural variation. |
| - For Intra-chromosomal Variations |
| There's no intra-chromosomal structural variation. |
| Sample | Symbol_a | Chr_a | Start_a | End_a | Symbol_b | Chr_b | Start_b | End_b |
| cf) Tissue number; Tissue name (1;Breast, 2;Central_nervous_system, 3;Haematopoietic_and_lymphoid_tissue, 4;Large_intestine, 5;Liver, 6;Lung, 7;Ovary, 8;Pancreas, 9;Prostate, 10;Skin, 11;Soft_tissue, 12;Upper_aerodigestive_tract) |
| * From mRNA Sanger sequences, Chitars2.0 arranged chimeric transcripts. This table shows TPH1 related fusion information. |
| ID | Head Gene | Tail Gene | Accession | Gene_a | qStart_a | qEnd_a | Chromosome_a | tStart_a | tEnd_a | Gene_a | qStart_a | qEnd_a | Chromosome_a | tStart_a | tEnd_a |
| Top |
| There's no copy number variation information in COSMIC data for this gene. |
| Top |
|
 |
| Top |
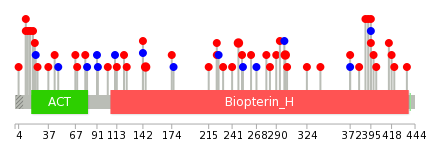
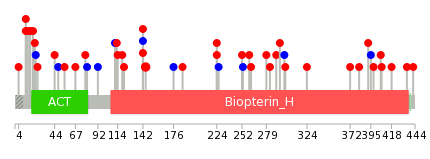
| Stat. for Non-Synonymous SNVs (# total SNVs=35) | (# total SNVs=10) |
 |  |
(# total SNVs=0) | (# total SNVs=0) |
| Top |
| * When you move the cursor on each content, you can see more deailed mutation information on the Tooltip. Those are primary_site,primary_histology,mutation(aa),pubmedID. |
| GRCh37 position | Mutation(aa) | Unique sampleID count |
| chr11:18054916-18054916 | p.E103* | 2 |
| chr11:18047154-18047154 | p.A300T | 2 |
| chr11:18048097-18048097 | p.R248Q | 2 |
| chr11:18051095-18051095 | p.R145Q | 2 |
| chr11:18042711-18042711 | p.E388* | 2 |
| chr11:18057677-18057677 | p.N44D | 1 |
| chr11:18047216-18047216 | p.P279L | 1 |
| chr11:18062300-18062300 | p.D4Y | 1 |
| chr11:18042628-18042628 | p.K415N | 1 |
| chr11:18048170-18048170 | p.R224C | 1 |
| Top |
|
 |
| Point Mutation/ Tissue ID | 1 | 2 | 3 | 4 | 5 | 6 | 7 | 8 | 9 | 10 | 11 | 12 | 13 | 14 | 15 | 16 | 17 | 18 | 19 | 20 |
| # sample | 2 | 5 | 2 | 2 | 4 | 10 | 2 | 1 | 7 | 3 | 7 | |||||||||
| # mutation | 2 | 5 | 2 | 2 | 4 | 12 | 2 | 1 | 9 | 4 | 8 | |||||||||
| nonsynonymous SNV | 4 | 2 | 2 | 3 | 9 | 2 | 1 | 8 | 3 | 6 | ||||||||||
| synonymous SNV | 2 | 1 | 1 | 3 | 1 | 1 | 2 |
| cf) Tissue ID; Tissue type (1; BLCA[Bladder Urothelial Carcinoma], 2; BRCA[Breast invasive carcinoma], 3; CESC[Cervical squamous cell carcinoma and endocervical adenocarcinoma], 4; COAD[Colon adenocarcinoma], 5; GBM[Glioblastoma multiforme], 6; Glioma Low Grade, 7; HNSC[Head and Neck squamous cell carcinoma], 8; KICH[Kidney Chromophobe], 9; KIRC[Kidney renal clear cell carcinoma], 10; KIRP[Kidney renal papillary cell carcinoma], 11; LAML[Acute Myeloid Leukemia], 12; LUAD[Lung adenocarcinoma], 13; LUSC[Lung squamous cell carcinoma], 14; OV[Ovarian serous cystadenocarcinoma ], 15; PAAD[Pancreatic adenocarcinoma], 16; PRAD[Prostate adenocarcinoma], 17; SKCM[Skin Cutaneous Melanoma], 18:STAD[Stomach adenocarcinoma], 19:THCA[Thyroid carcinoma], 20:UCEC[Uterine Corpus Endometrial Carcinoma]) |
| Top |
| * We represented just top 10 SNVs. When you move the cursor on each content, you can see more deailed mutation information on the Tooltip. Those are primary_site, primary_histology, mutation(aa), pubmedID. |
| Genomic Position | Mutation(aa) | Unique sampleID count |
| chr11:18051095 | p.R145Q | 2 |
| chr11:18050822 | p.H78D | 1 |
| chr11:18042653 | p.G398R | 1 |
| chr11:18057531 | p.G226G | 1 |
| chr11:18047183 | p.D67G | 1 |
| chr11:18062260 | p.R395R | 1 |
| chr11:18050851 | p.R224H | 1 |
| chr11:18042656 | p.R55G | 1 |
| chr11:18057567 | p.T392A | 1 |
| chr11:18047205 | p.R224C | 1 |
| * Copy number data were extracted from TCGA using R package TCGA-Assembler. The URLs of all public data files on TCGA DCC data server were gathered on Jan-05-2015. Function ProcessCNAData in TCGA-Assembler package was used to obtain gene-level copy number value which is calculated as the average copy number of the genomic region of a gene. |
 |
| cf) Tissue ID[Tissue type]: BLCA[Bladder Urothelial Carcinoma], BRCA[Breast invasive carcinoma], CESC[Cervical squamous cell carcinoma and endocervical adenocarcinoma], COAD[Colon adenocarcinoma], GBM[Glioblastoma multiforme], Glioma Low Grade, HNSC[Head and Neck squamous cell carcinoma], KICH[Kidney Chromophobe], KIRC[Kidney renal clear cell carcinoma], KIRP[Kidney renal papillary cell carcinoma], LAML[Acute Myeloid Leukemia], LUAD[Lung adenocarcinoma], LUSC[Lung squamous cell carcinoma], OV[Ovarian serous cystadenocarcinoma ], PAAD[Pancreatic adenocarcinoma], PRAD[Prostate adenocarcinoma], SKCM[Skin Cutaneous Melanoma], STAD[Stomach adenocarcinoma], THCA[Thyroid carcinoma], UCEC[Uterine Corpus Endometrial Carcinoma] |
| Top |
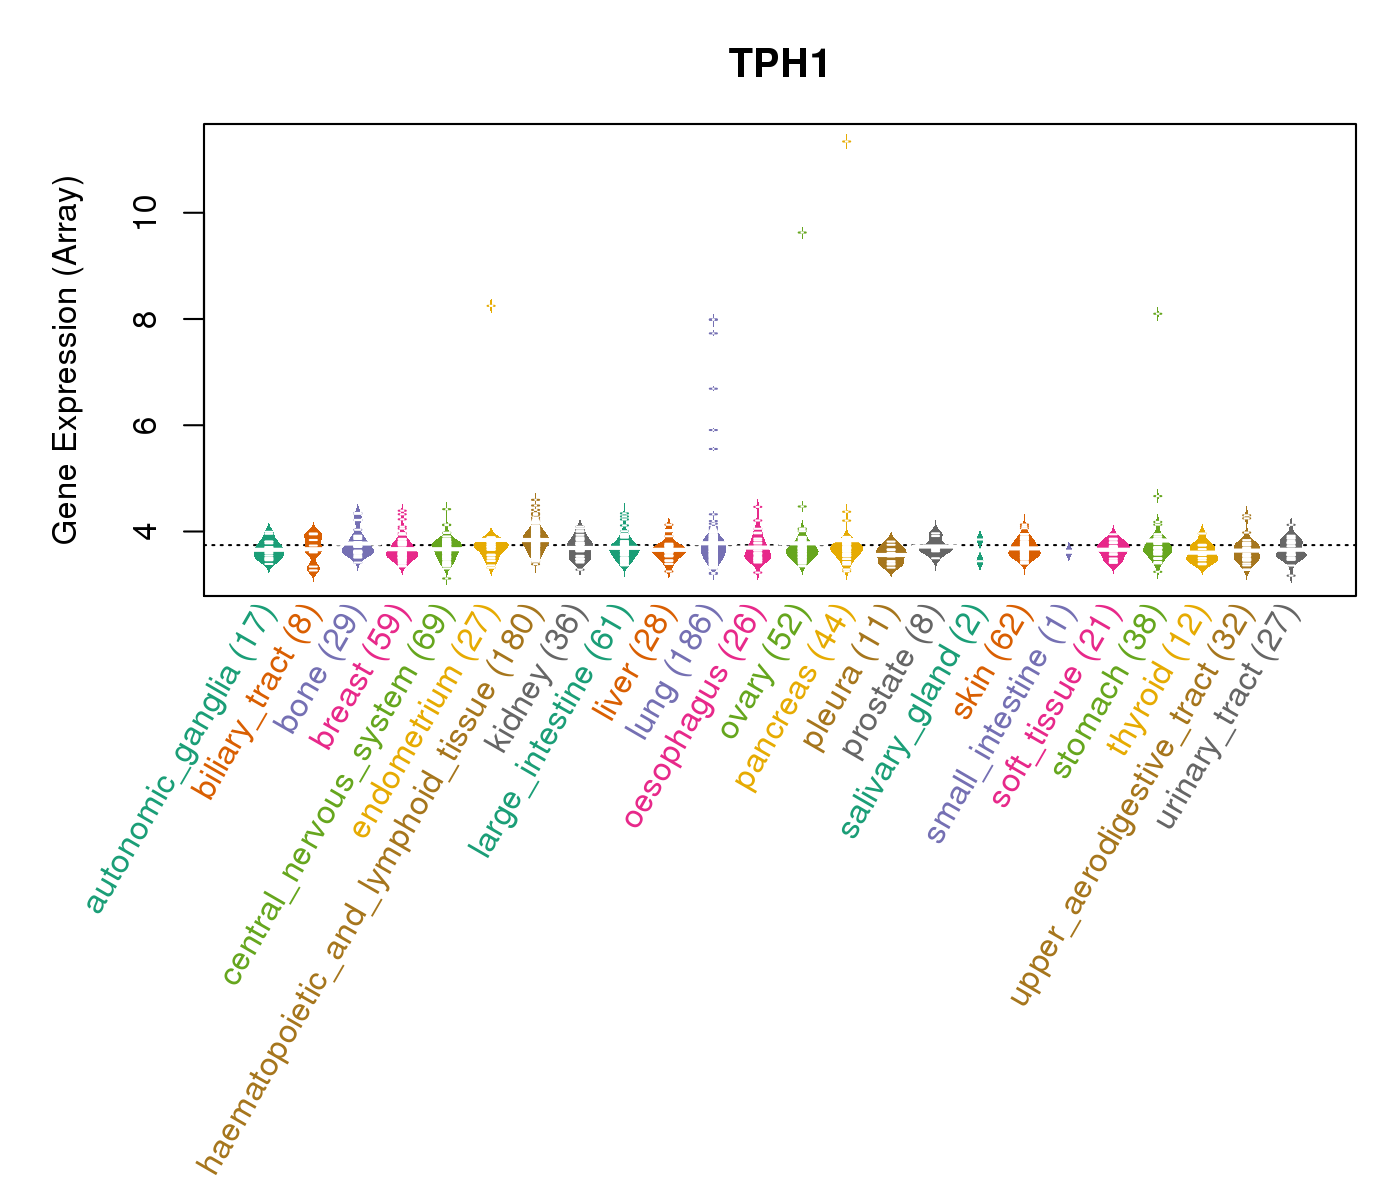
| Gene Expression for TPH1 |
| * CCLE gene expression data were extracted from CCLE_Expression_Entrez_2012-10-18.res: Gene-centric RMA-normalized mRNA expression data. |
 |
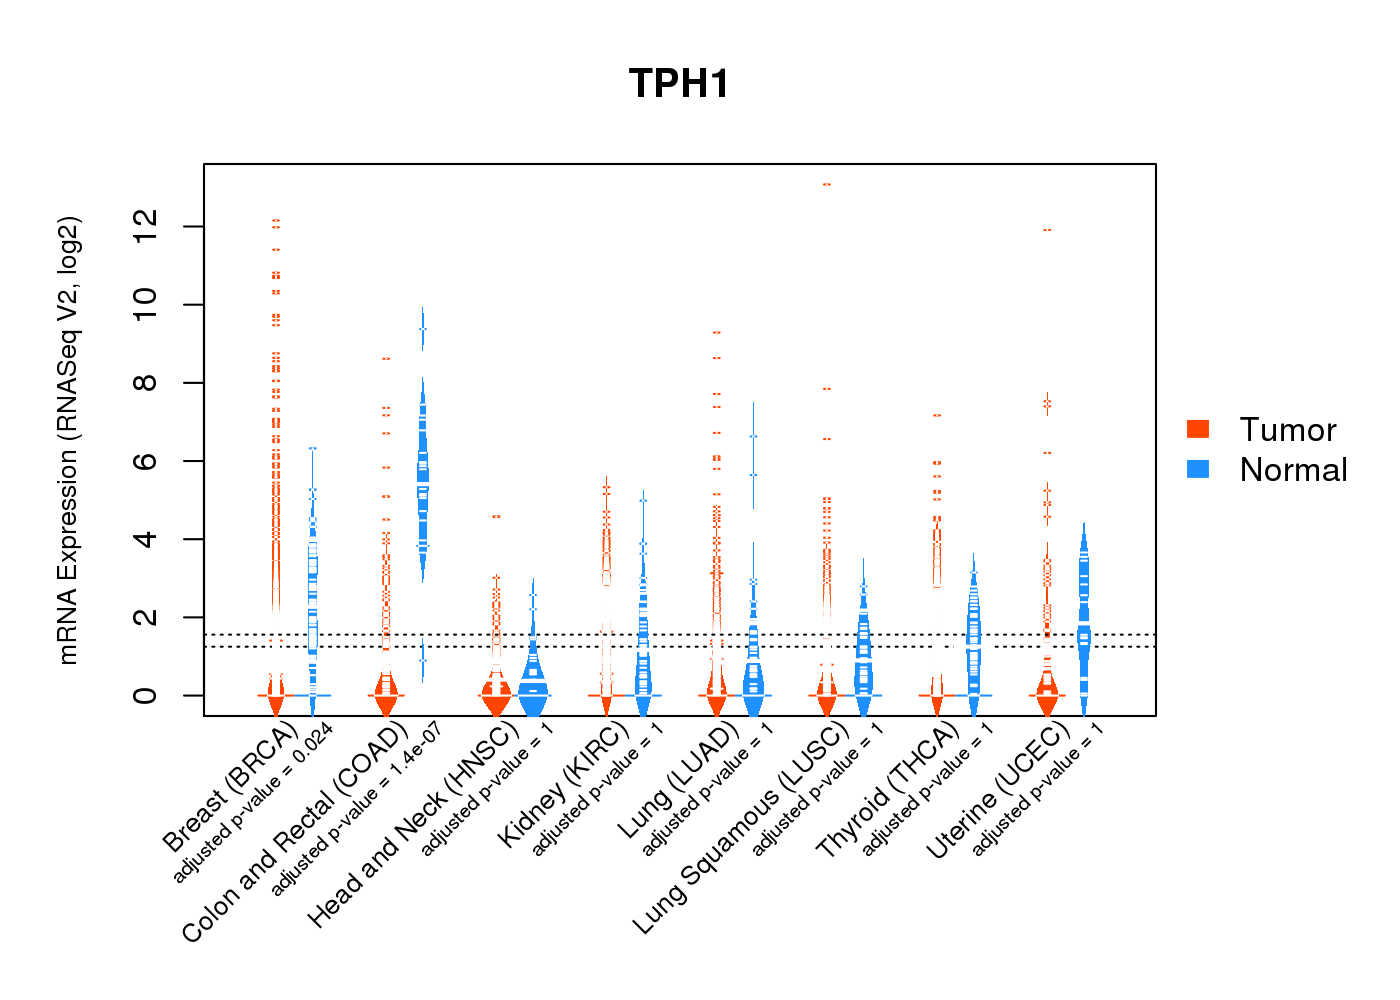
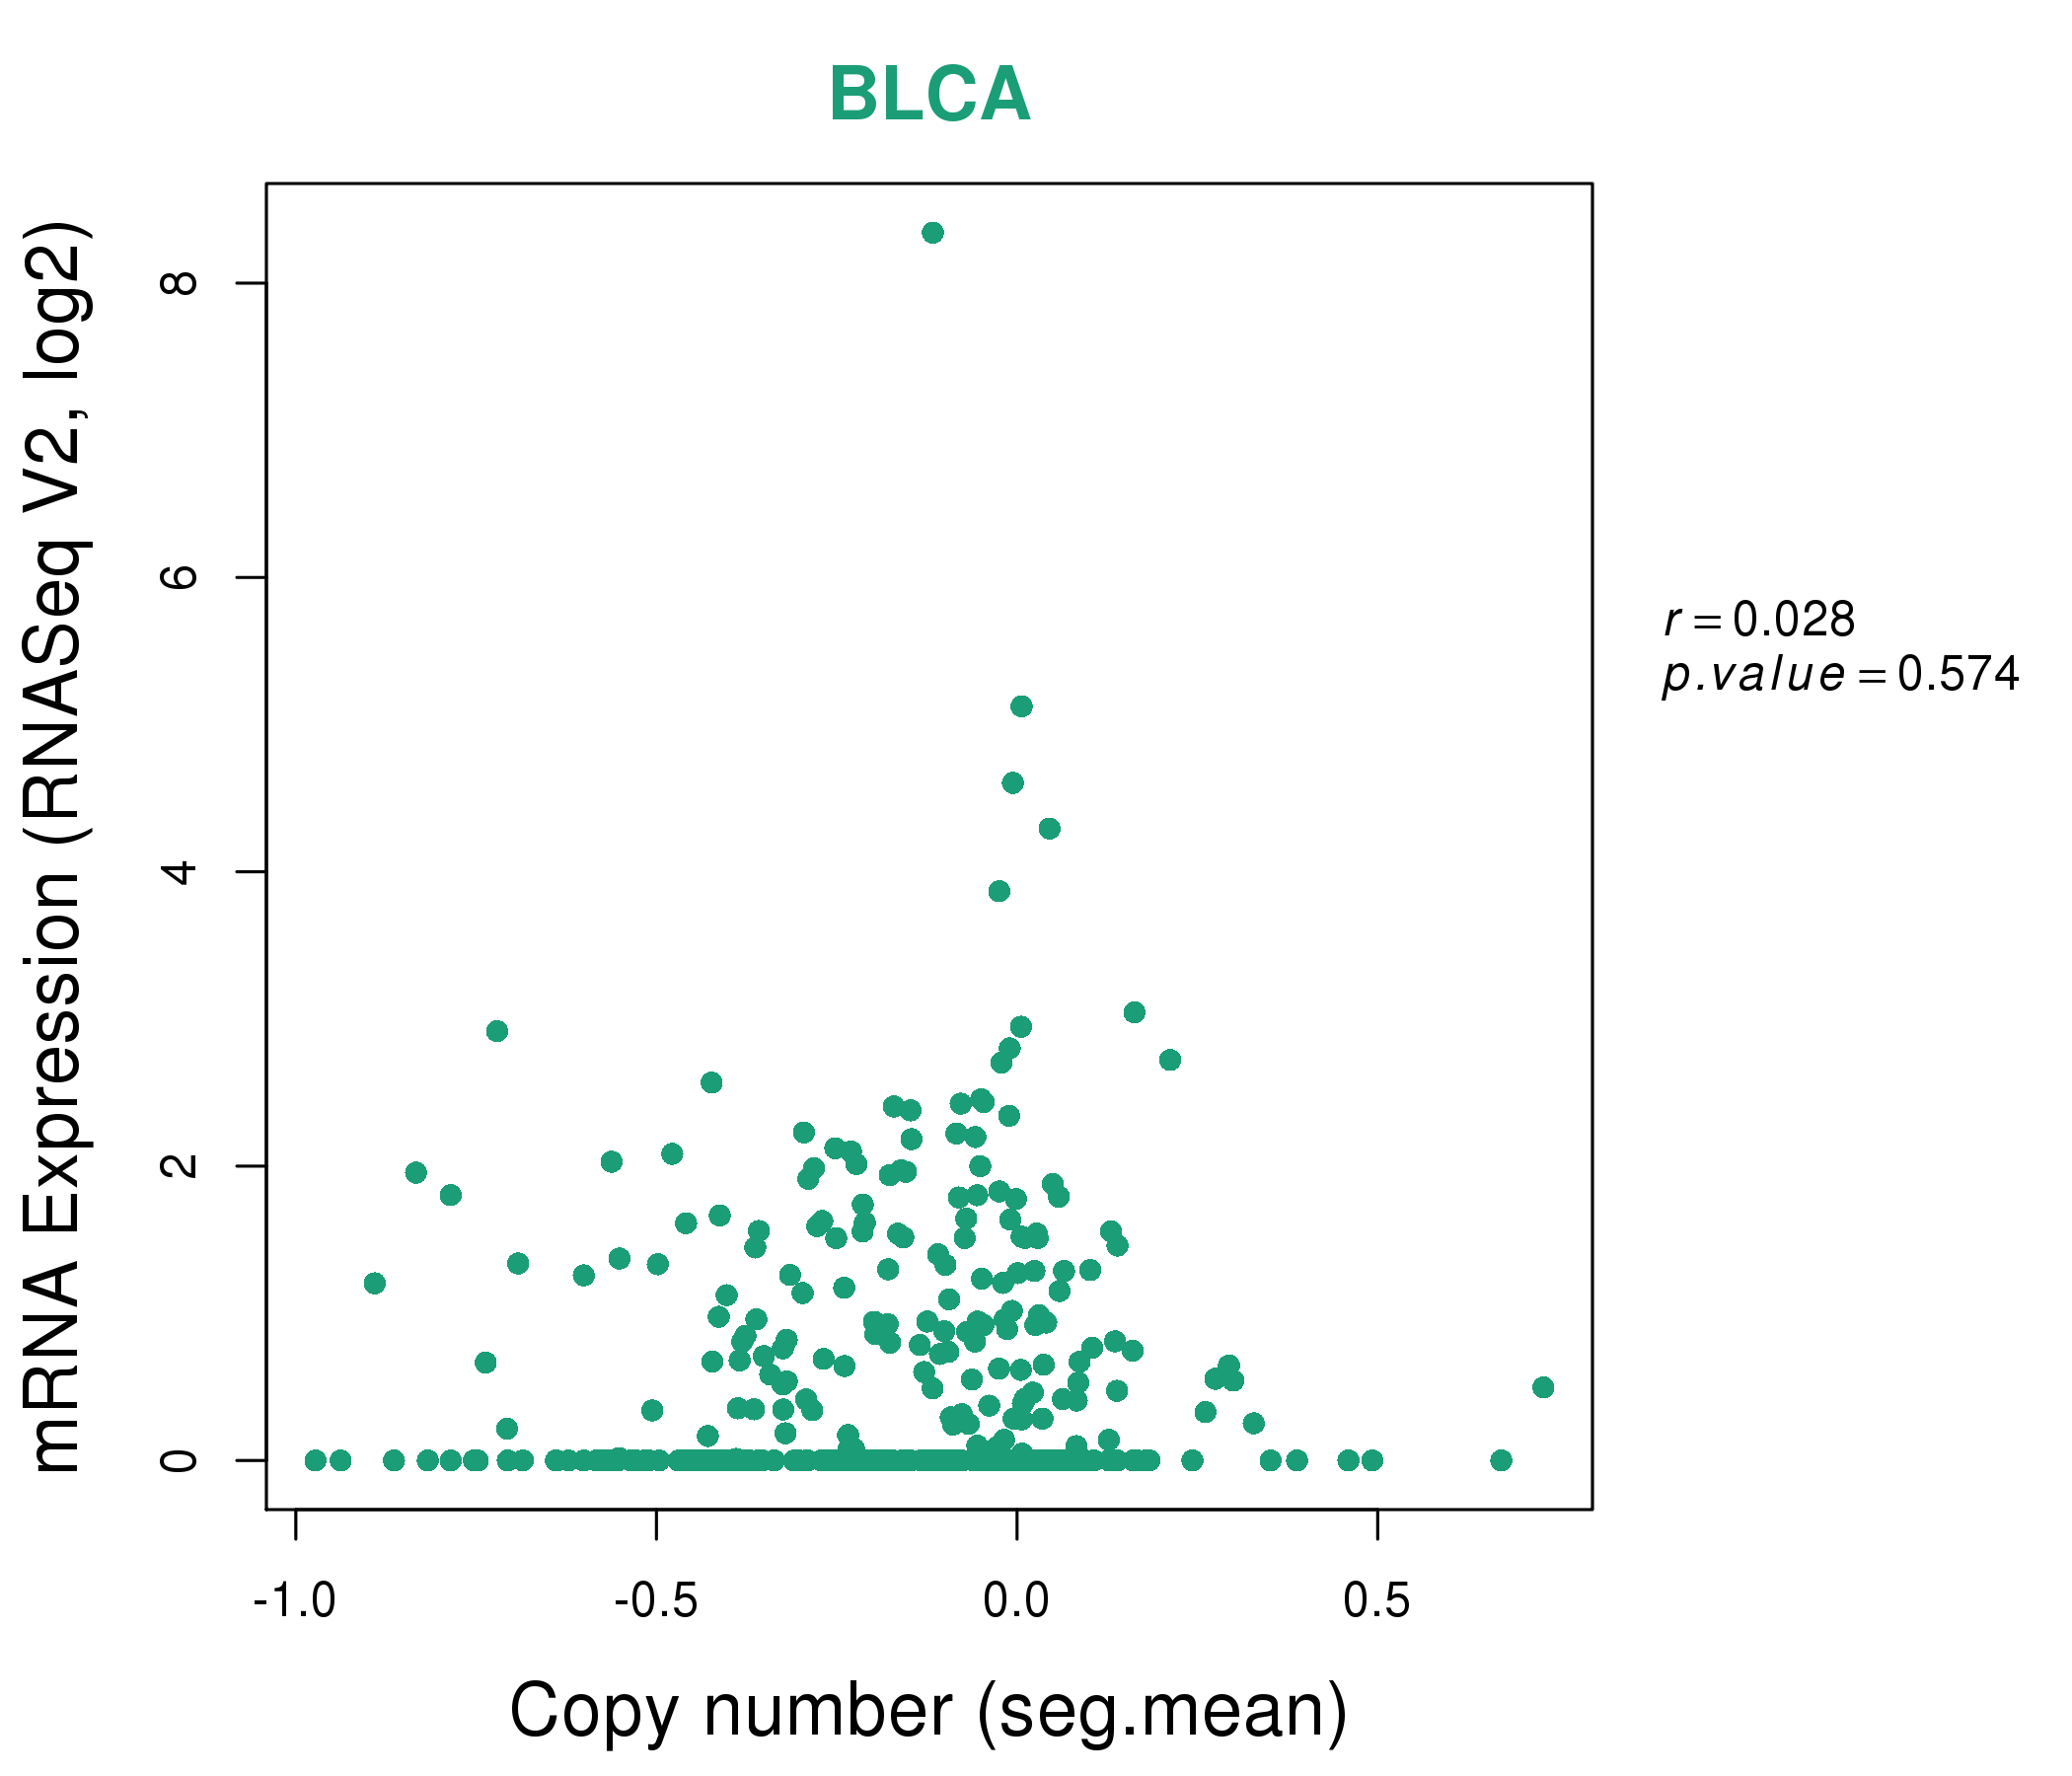
| * Normalized gene expression data of RNASeqV2 was extracted from TCGA using R package TCGA-Assembler. The URLs of all public data files on TCGA DCC data server were gathered at Jan-05-2015. Only eight cancer types have enough normal control samples for differential expression analysis. (t test, adjusted p<0.05 (using Benjamini-Hochberg FDR)) |
 |
| Top |
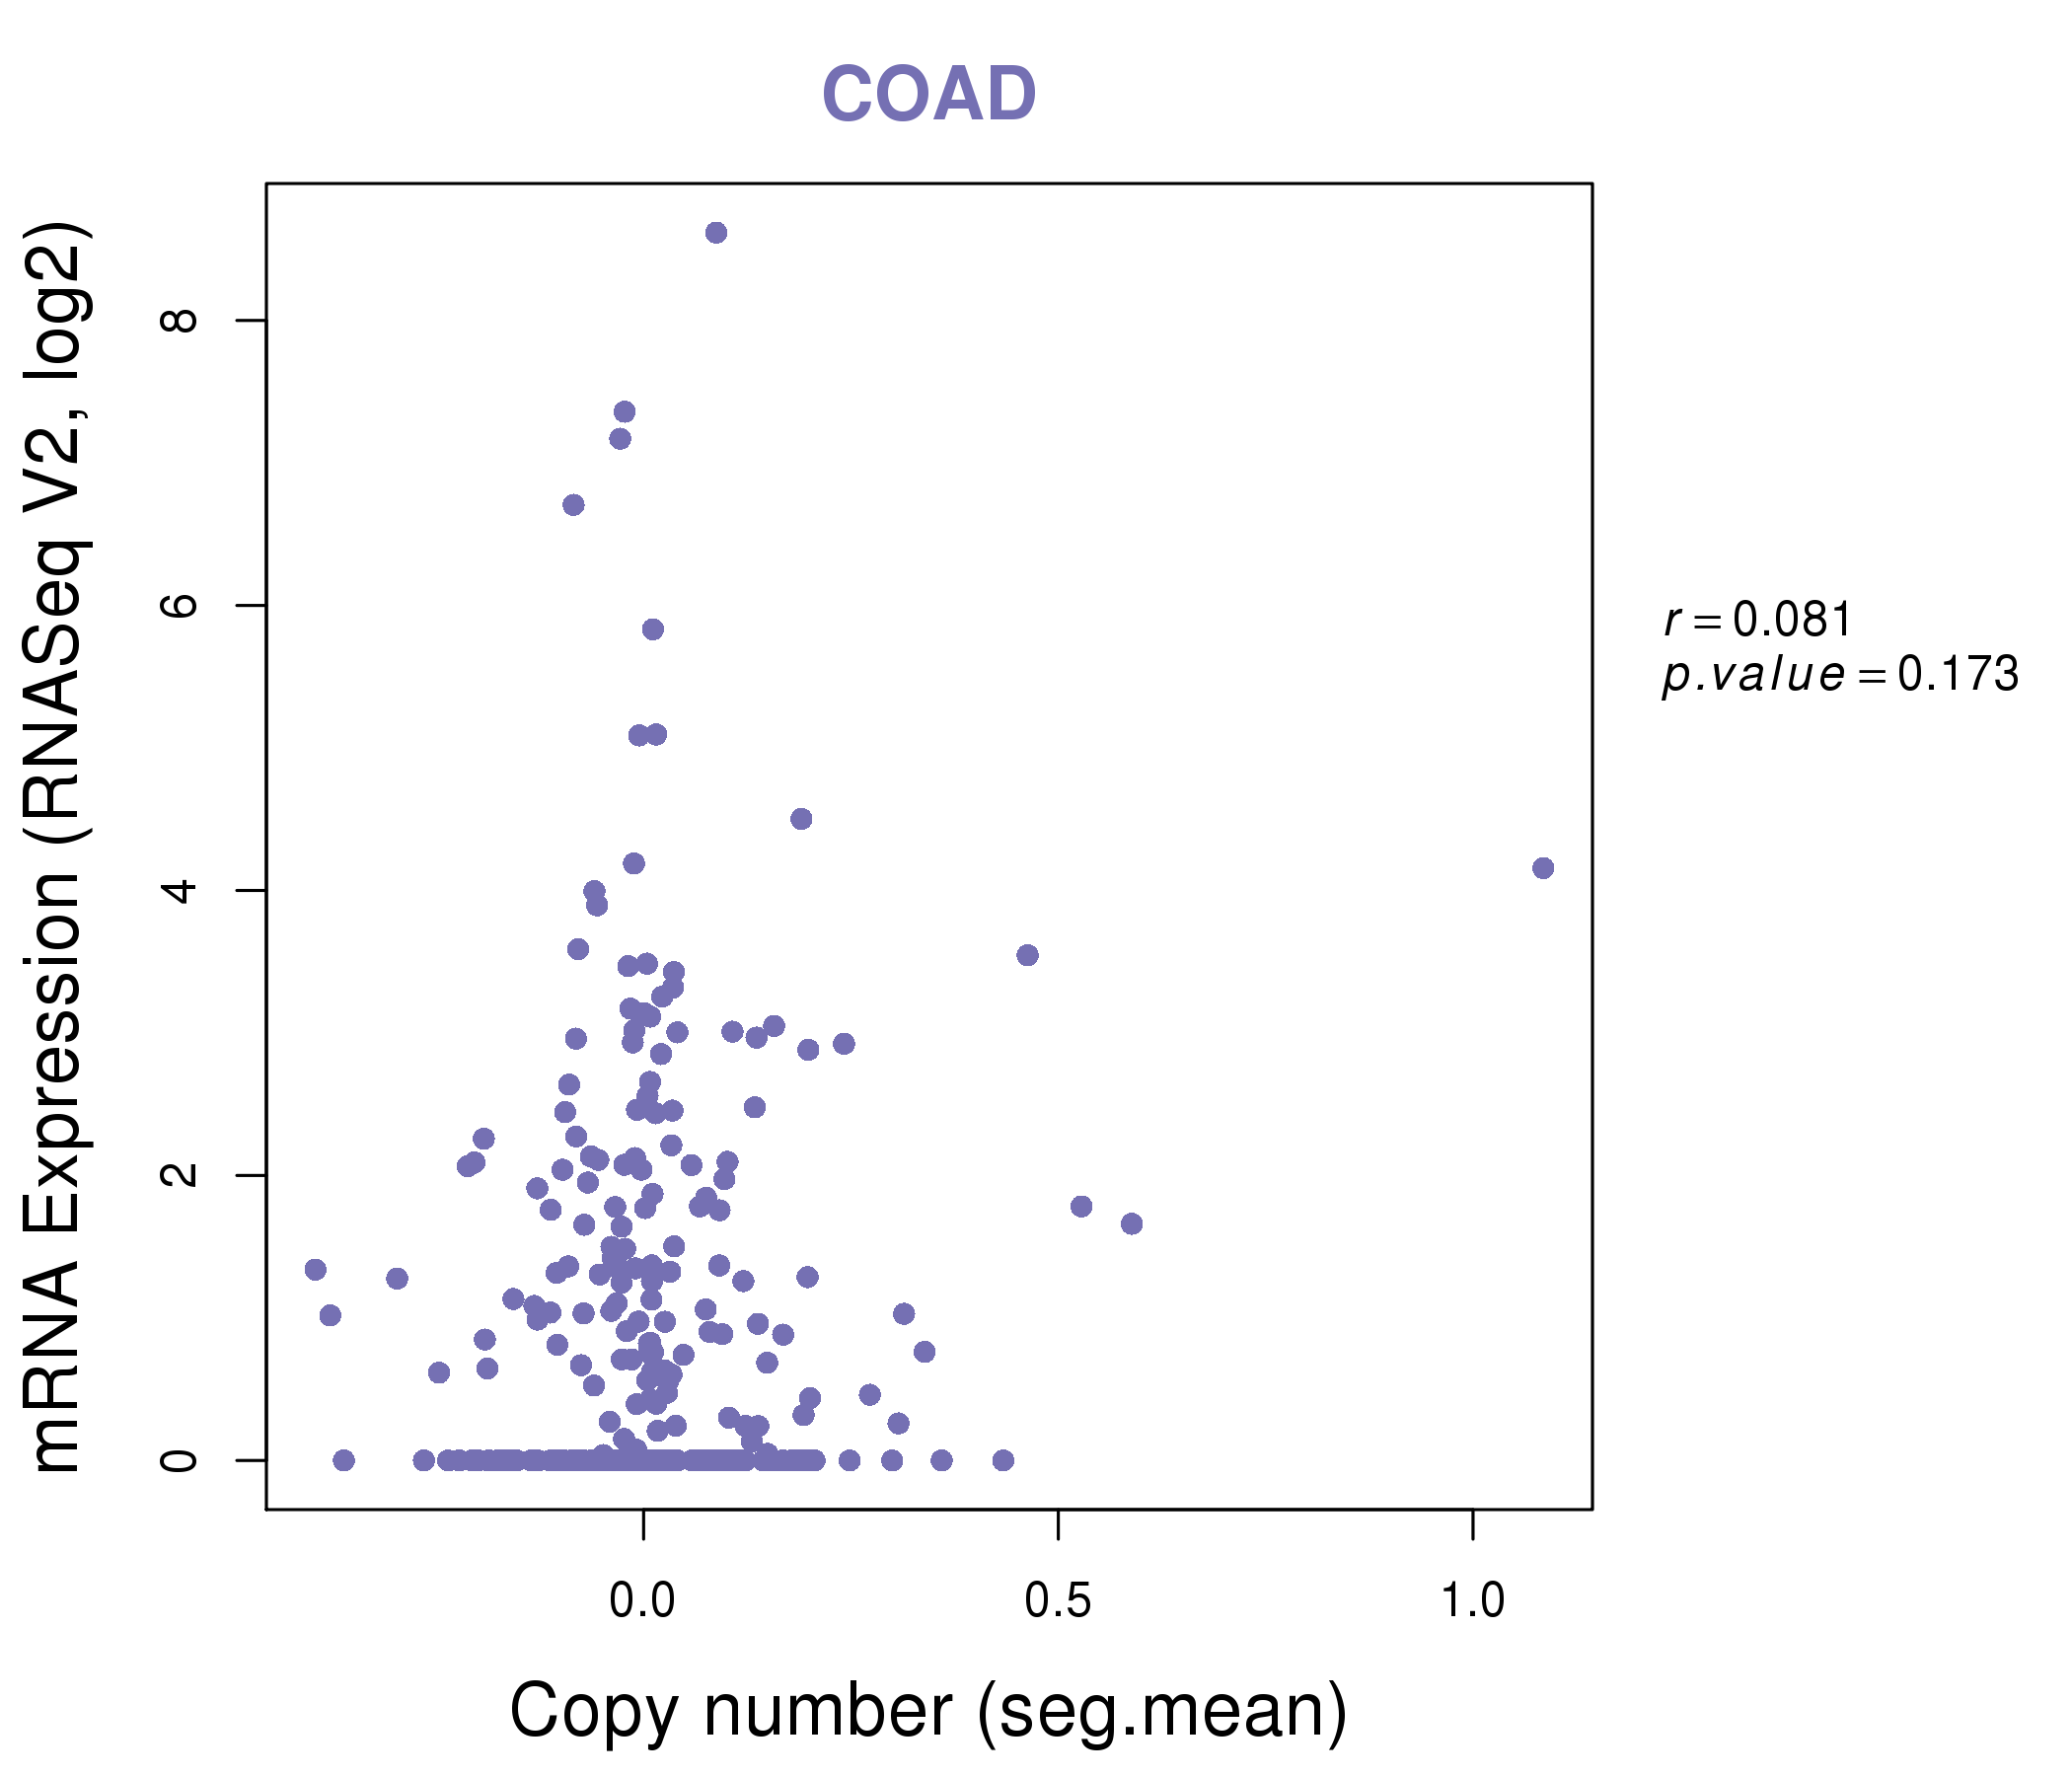
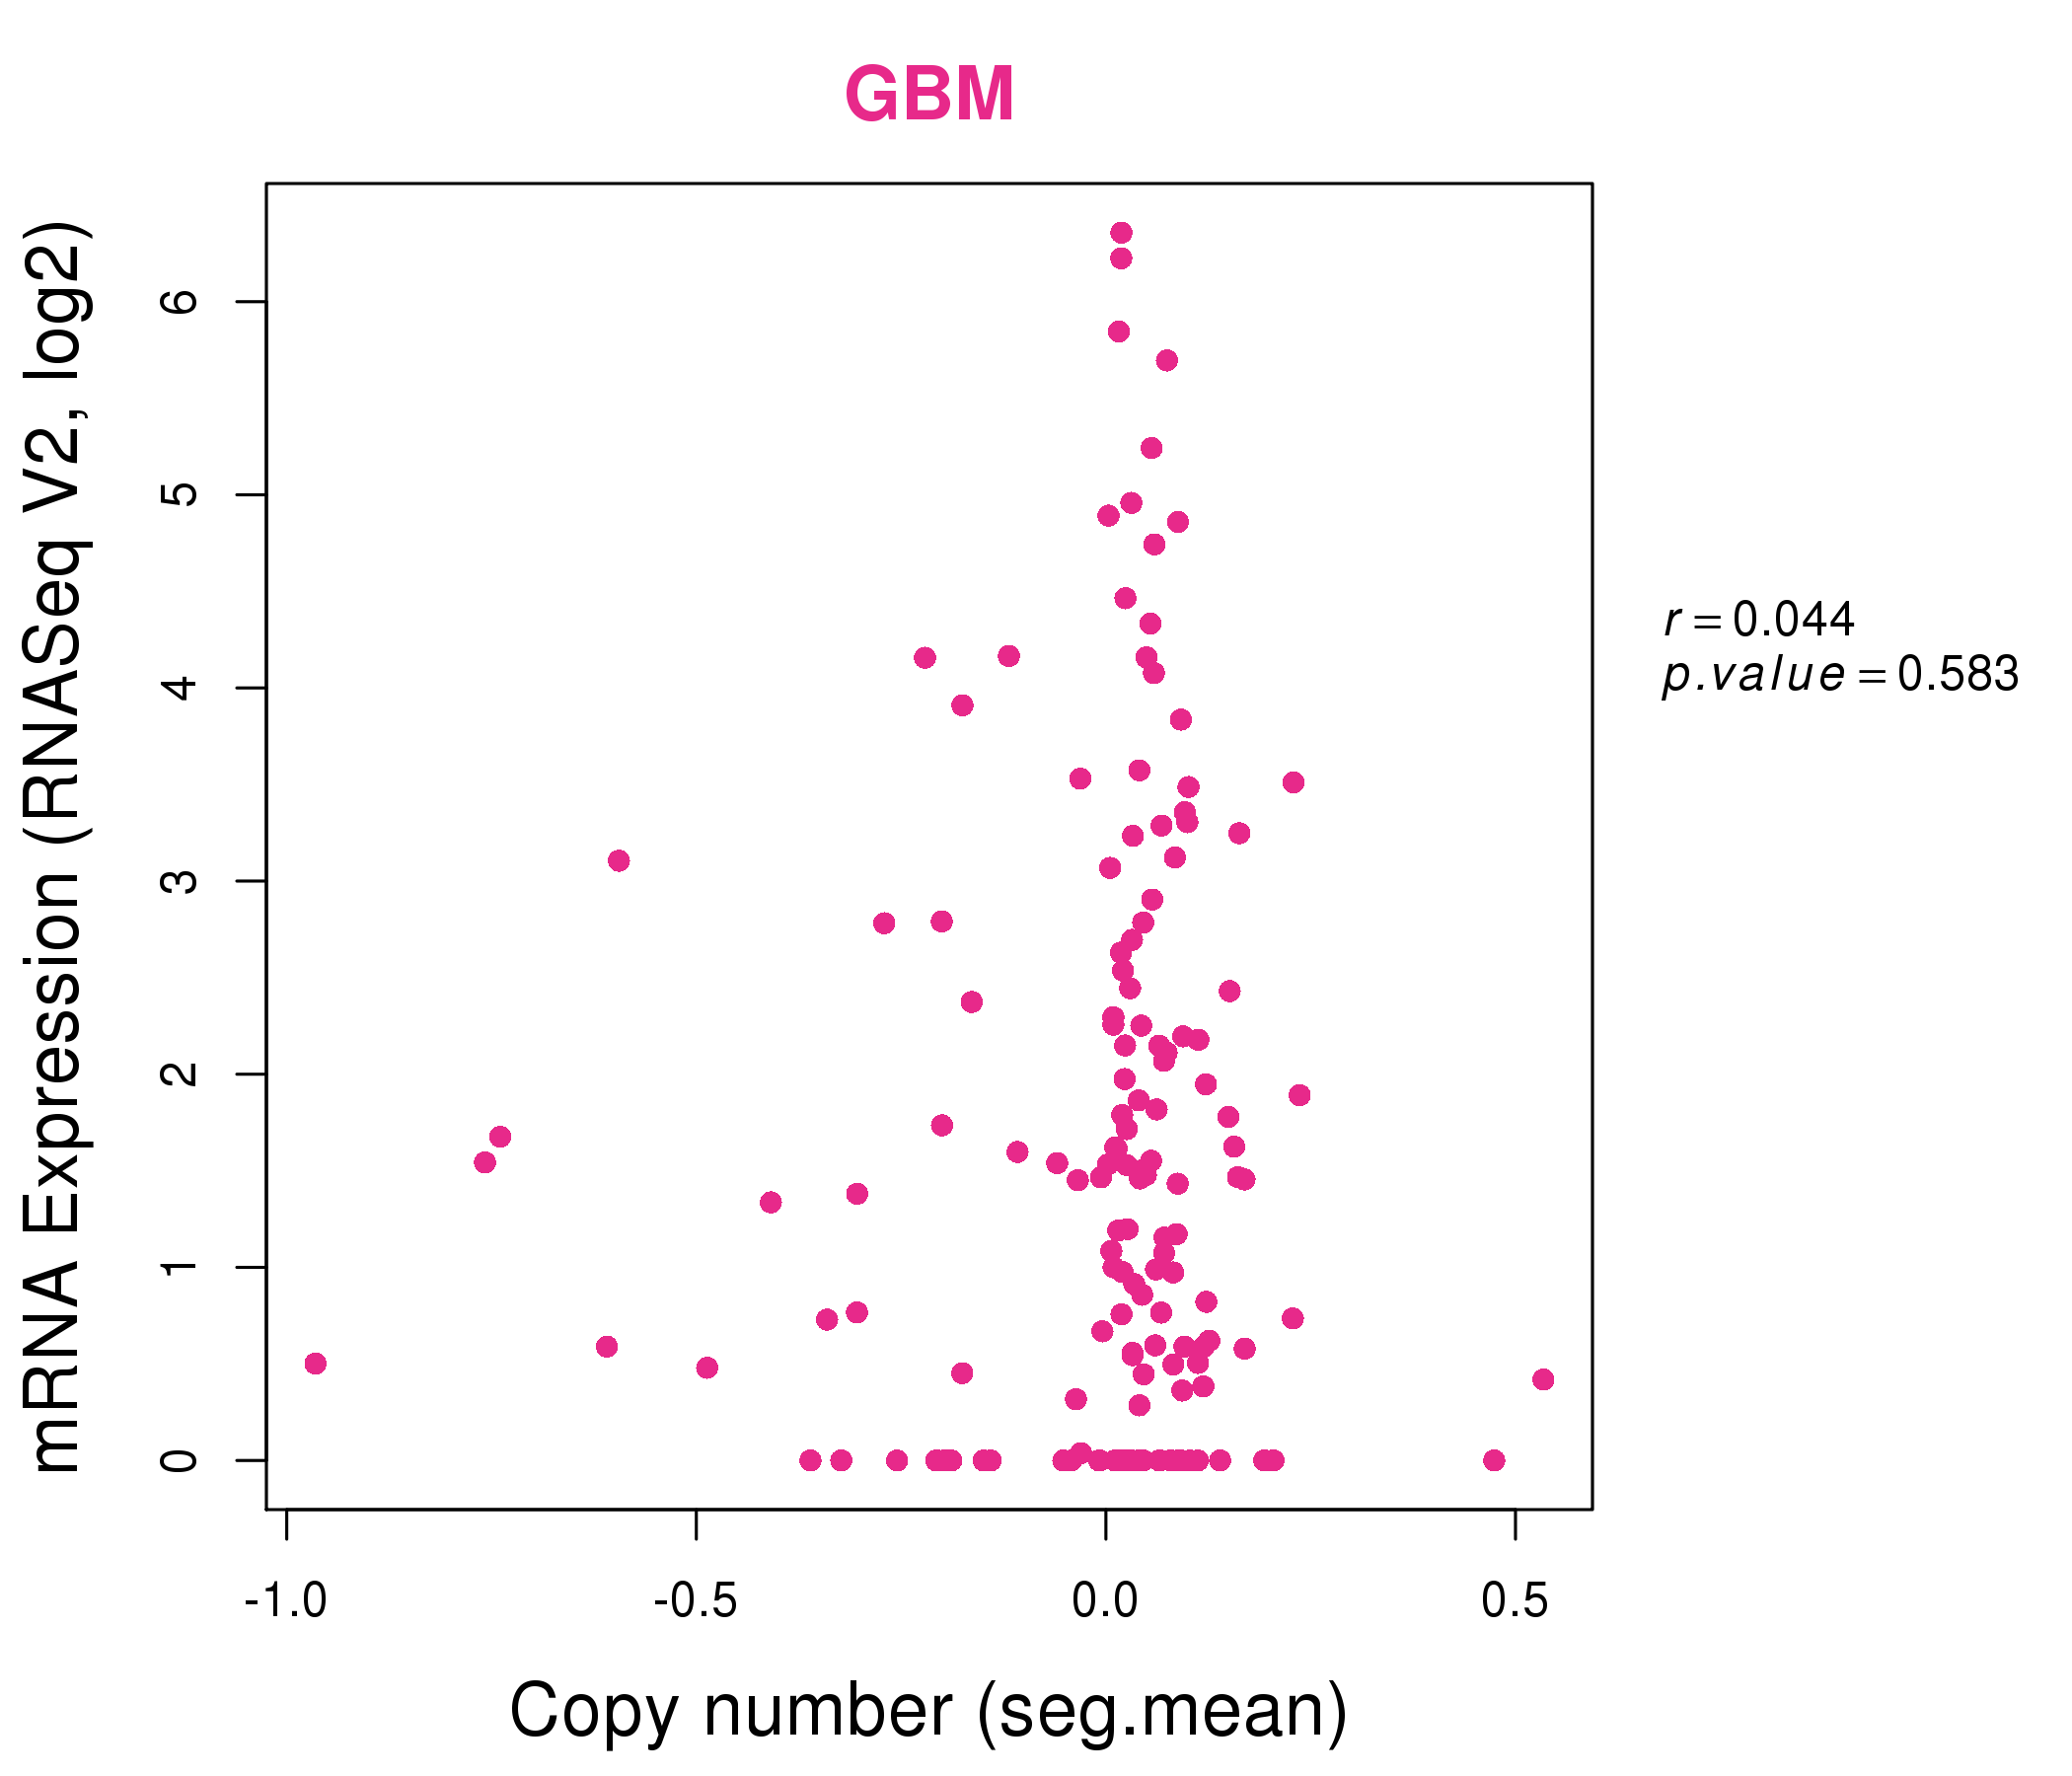
| * This plots show the correlation between CNV and gene expression. |
: Open all plots for all cancer types
 |
|
 |
|

| Top |
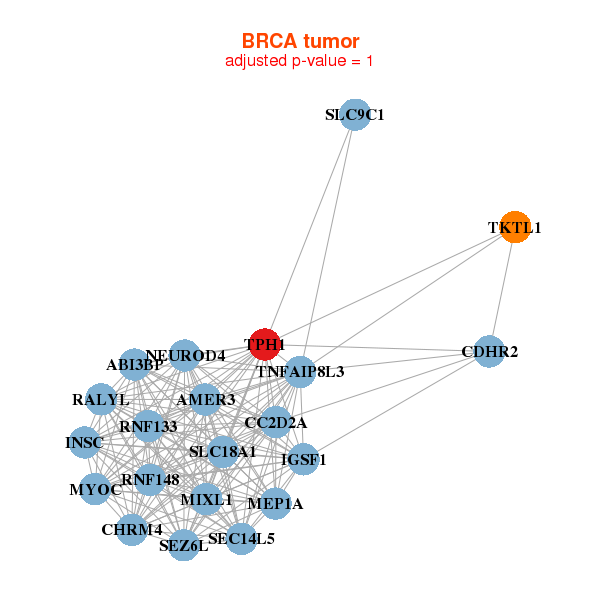
| Gene-Gene Network Information |
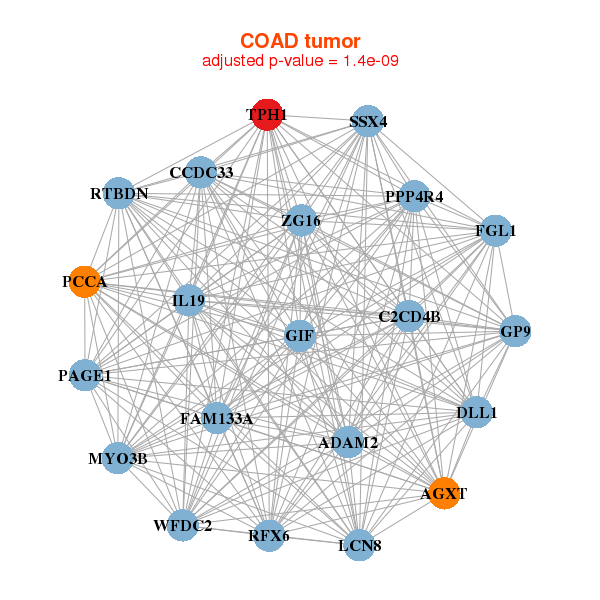
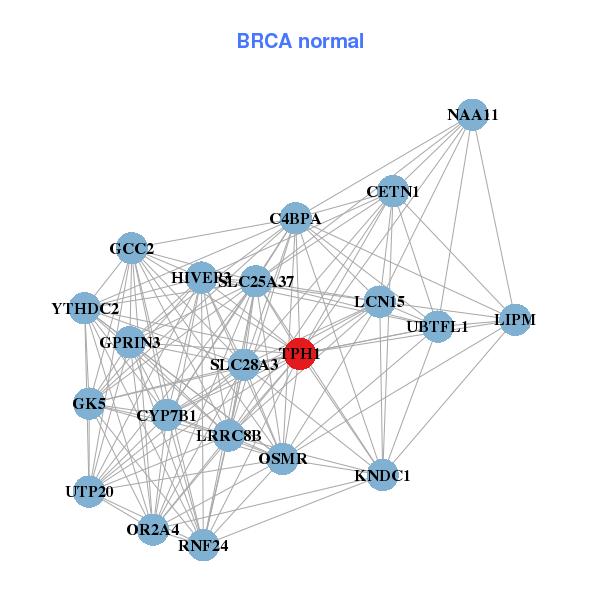
| * Co-Expression network figures were drawn using R package igraph. Only the top 20 genes with the highest correlations were shown. Red circle: input gene, orange circle: cell metabolism gene, sky circle: other gene |
: Open all plots for all cancer types
 |
| ||||
| ABI3BP,CC2D2A,CDHR2,CHRM4,AMER3,IGSF1,INSC, MEP1A,MIXL1,MYOC,NEUROD4,RALYL,RNF133,RNF148, SEC14L5,SEZ6L,SLC18A1,SLC9C1,TKTL1,TNFAIP8L3,TPH1 | C4BPA,CETN1,CYP7B1,GCC2,GK5,GPRIN3,HIVEP3, KNDC1,LCN15,LIPM,LRRC8B,NAA11,OR2A4,OSMR, RNF24,SLC25A37,SLC28A3,TPH1,UBTFL1,UTP20,YTHDC2 | ||||
 |
| ||||
| ADAM2,AGXT,C2CD4B,CCDC33,DLL1,FAM133A,FGL1, GIF,GP9,IL19,LCN8,MYO3B,PAGE1,PCCA, PPP4R4,RFX6,RTBDN,SSX4,TPH1,WFDC2,ZG16 | AVPR1B,CFC1B,CRH,CYP2W1,GABRA6,INSL5,KLK3, KRTAP3-3,LMX1A,MYBPC1,NEUROD1,NKX2-2,PF4V1,RFX6, RIMS4,SLC38A11,SST,TBX4,TNNC1,TPH1,TTR |
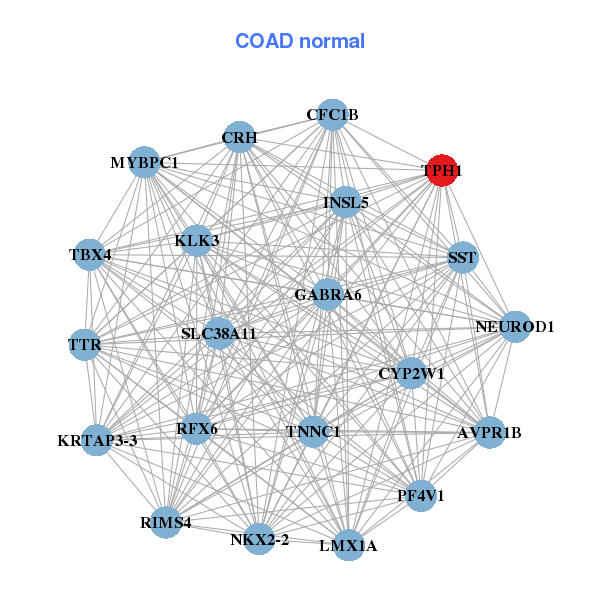
| * Co-Expression network figures were drawn using R package igraph. Only the top 20 genes with the highest correlations were shown. Red circle: input gene, orange circle: cell metabolism gene, sky circle: other gene |
: Open all plots for all cancer types
| Top |
: Open all interacting genes' information including KEGG pathway for all interacting genes from DAVID
| Top |
| Pharmacological Information for TPH1 |
| DB Category | DB Name | DB's ID and Url link |
| Chemistry | BindingDB | P17752; -. |
| Chemistry | ChEMBL | CHEMBL5689; -. |
| Chemistry | GuidetoPHARMACOLOGY | 1241; -. |
| Organism-specific databases | PharmGKB | PA355; -. |
| Organism-specific databases | CTD | 7166; -. |
| * Gene Centered Interaction Network. |
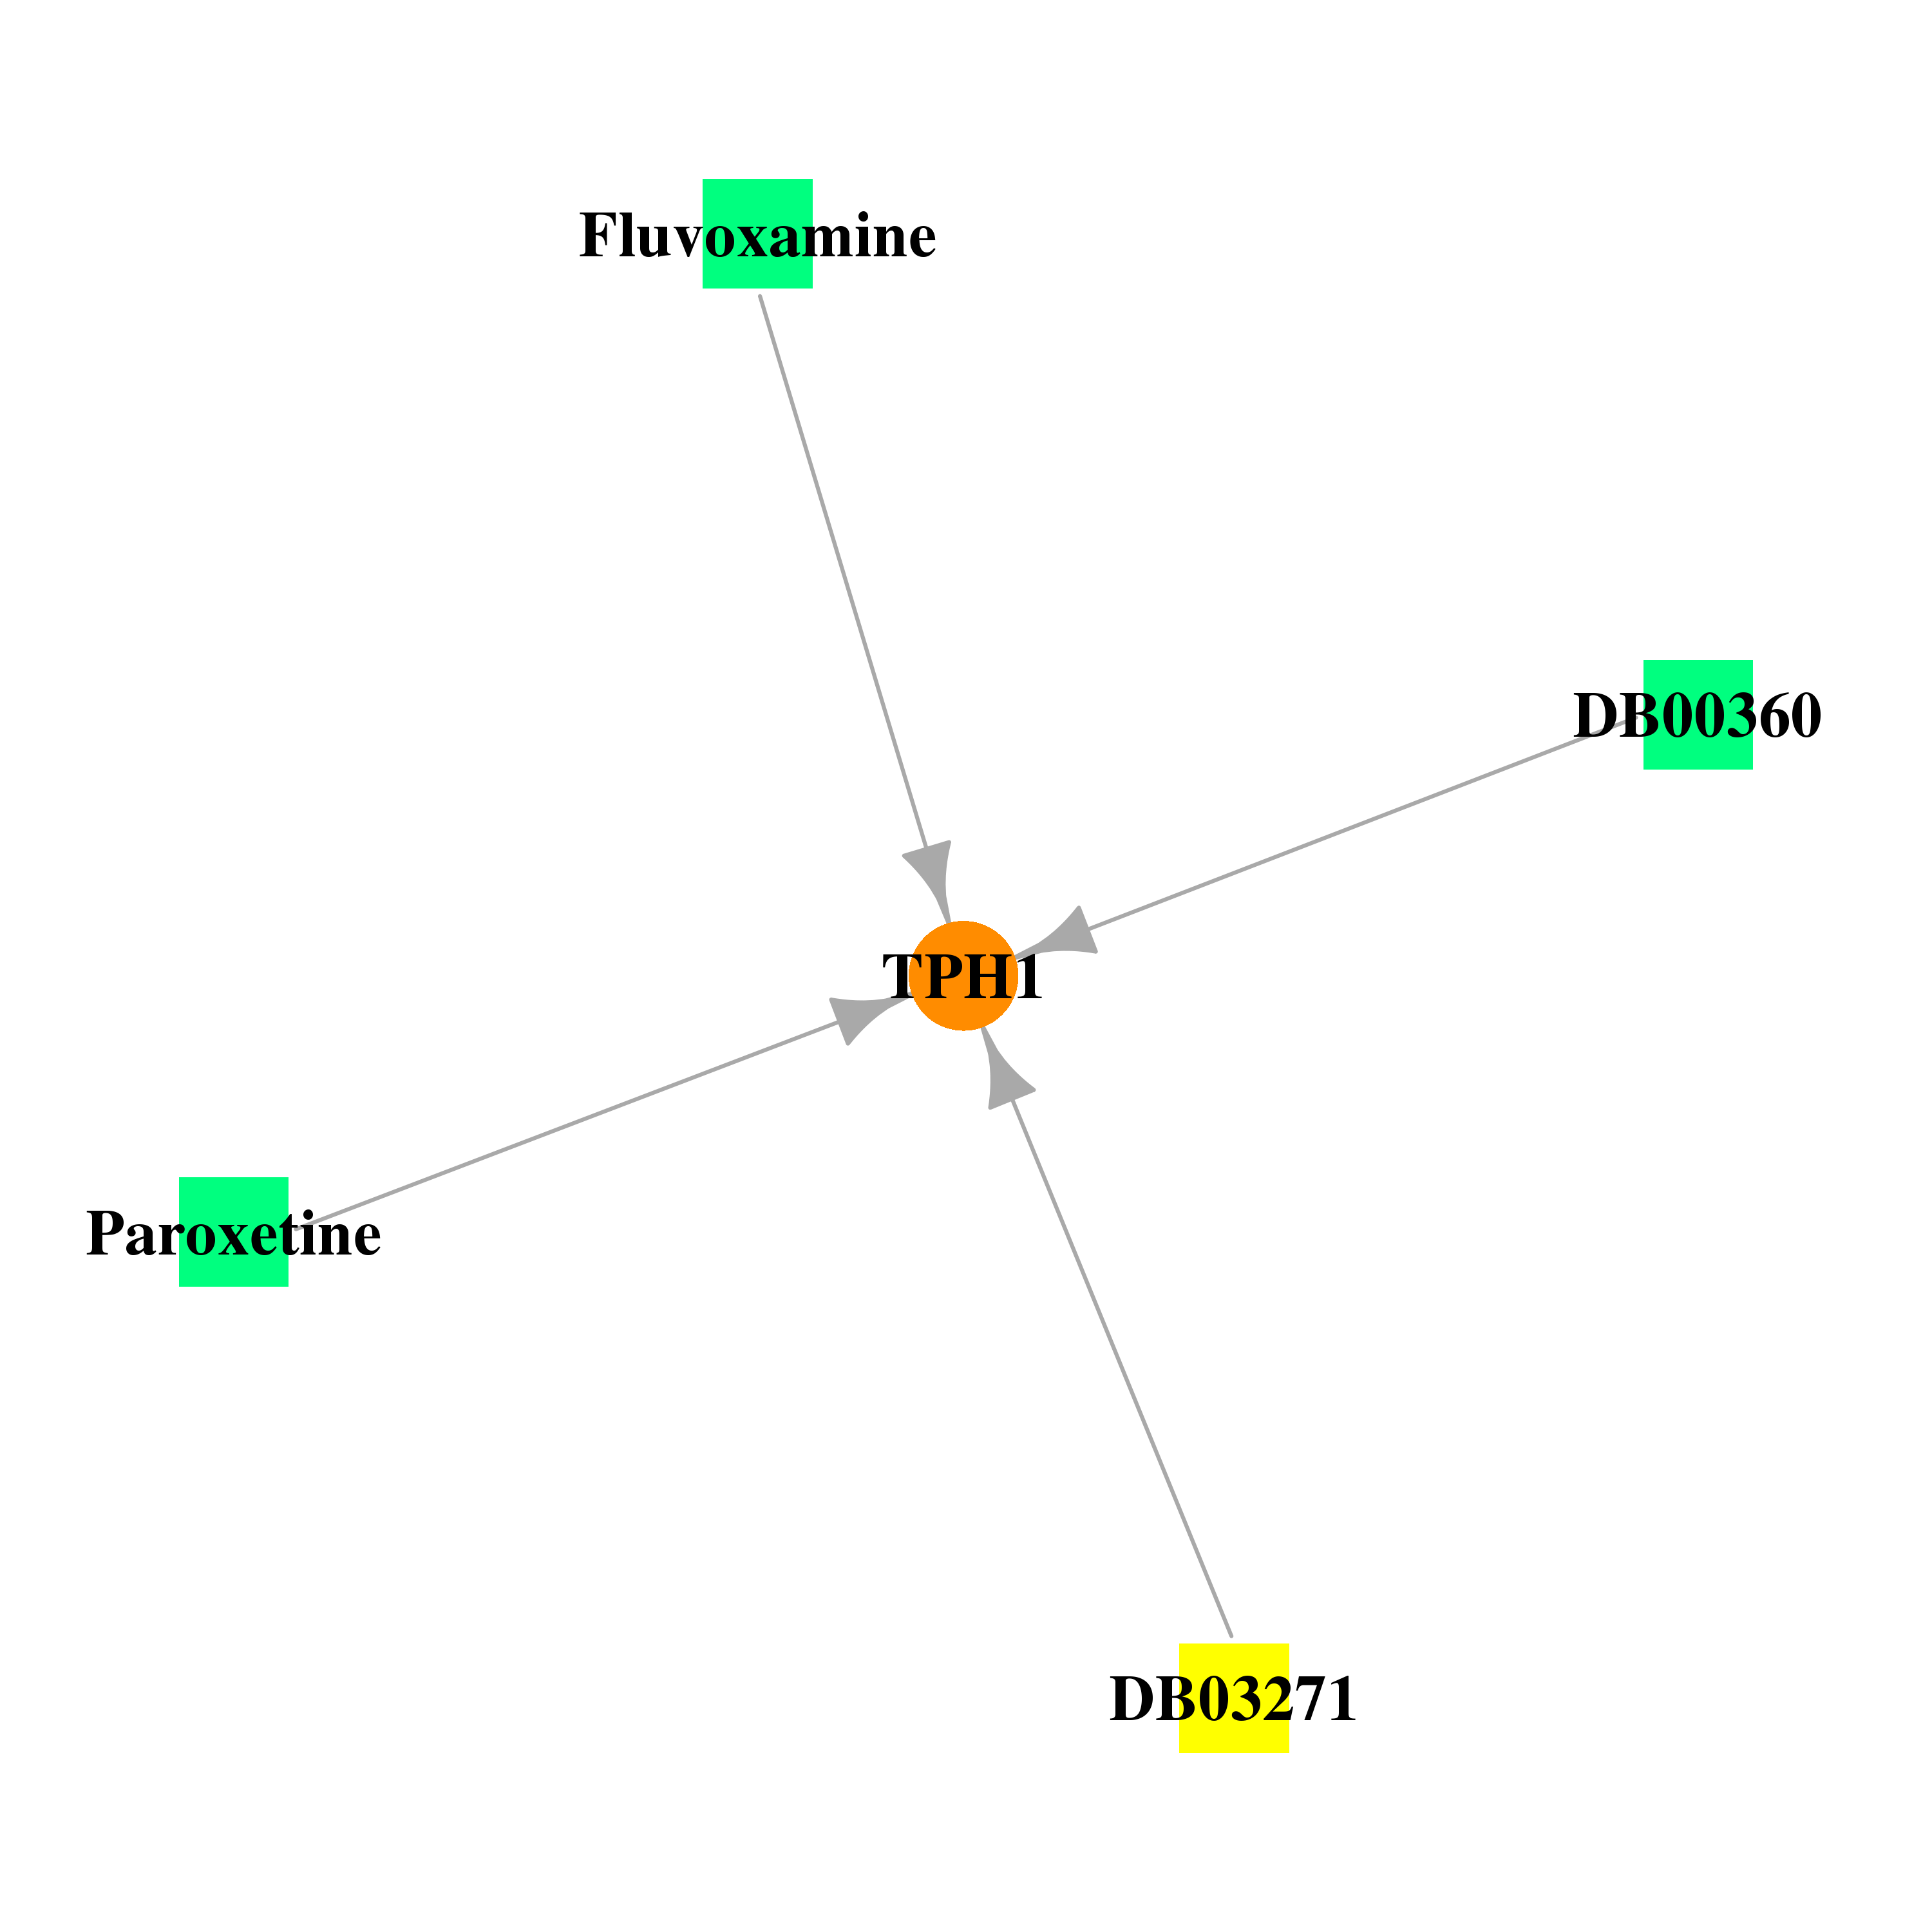 |
| * Drug Centered Interaction Network. |
| DrugBank ID | Target Name | Drug Groups | Generic Name | Drug Centered Network | Drug Structure |
| DB00360 | tryptophan hydroxylase 1 | approved; investigational | Tetrahydrobiopterin | 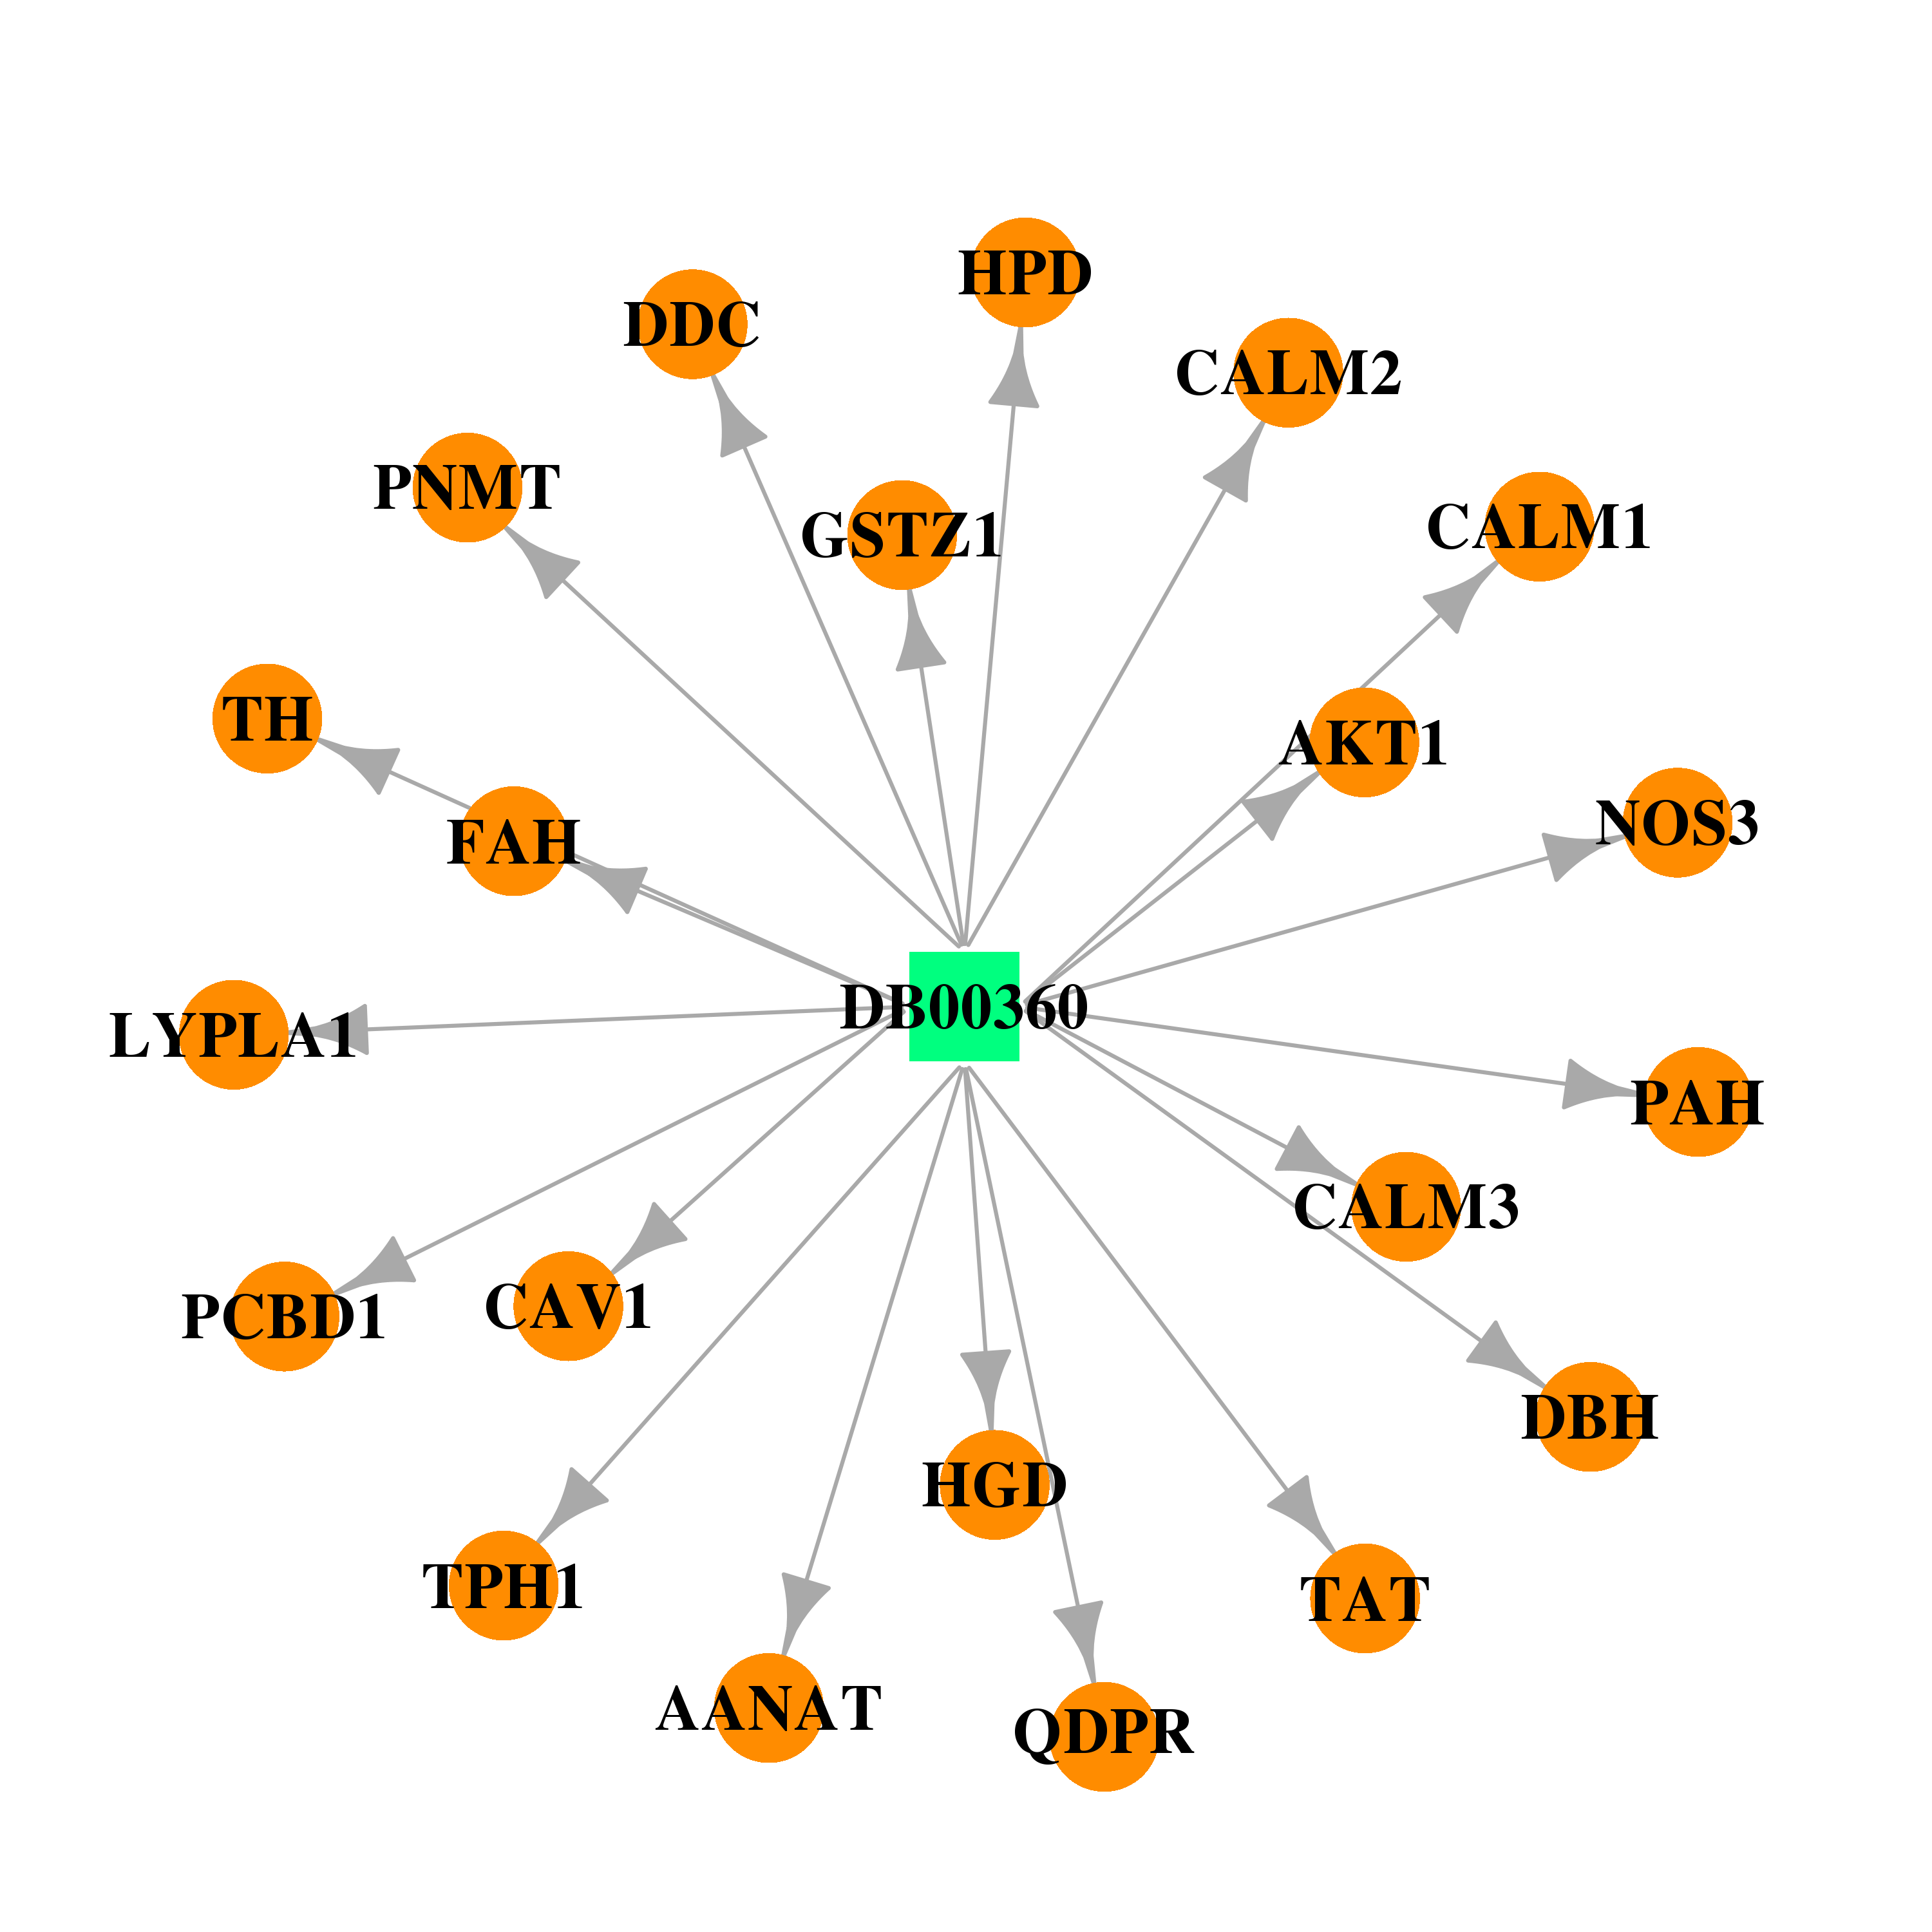 | 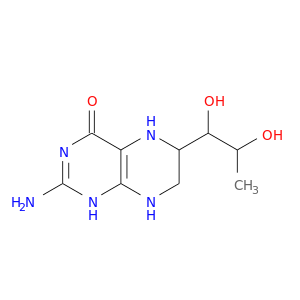 |
| DB03271 | tryptophan hydroxylase 1 | experimental | 7,8-Dihydro-L-Biopterin |  | 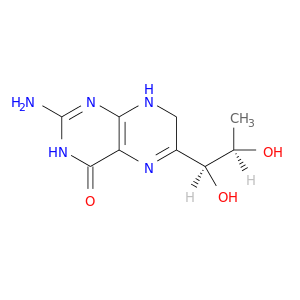 |
| DB00715 | tryptophan hydroxylase 1 | approved; investigational | Paroxetine | 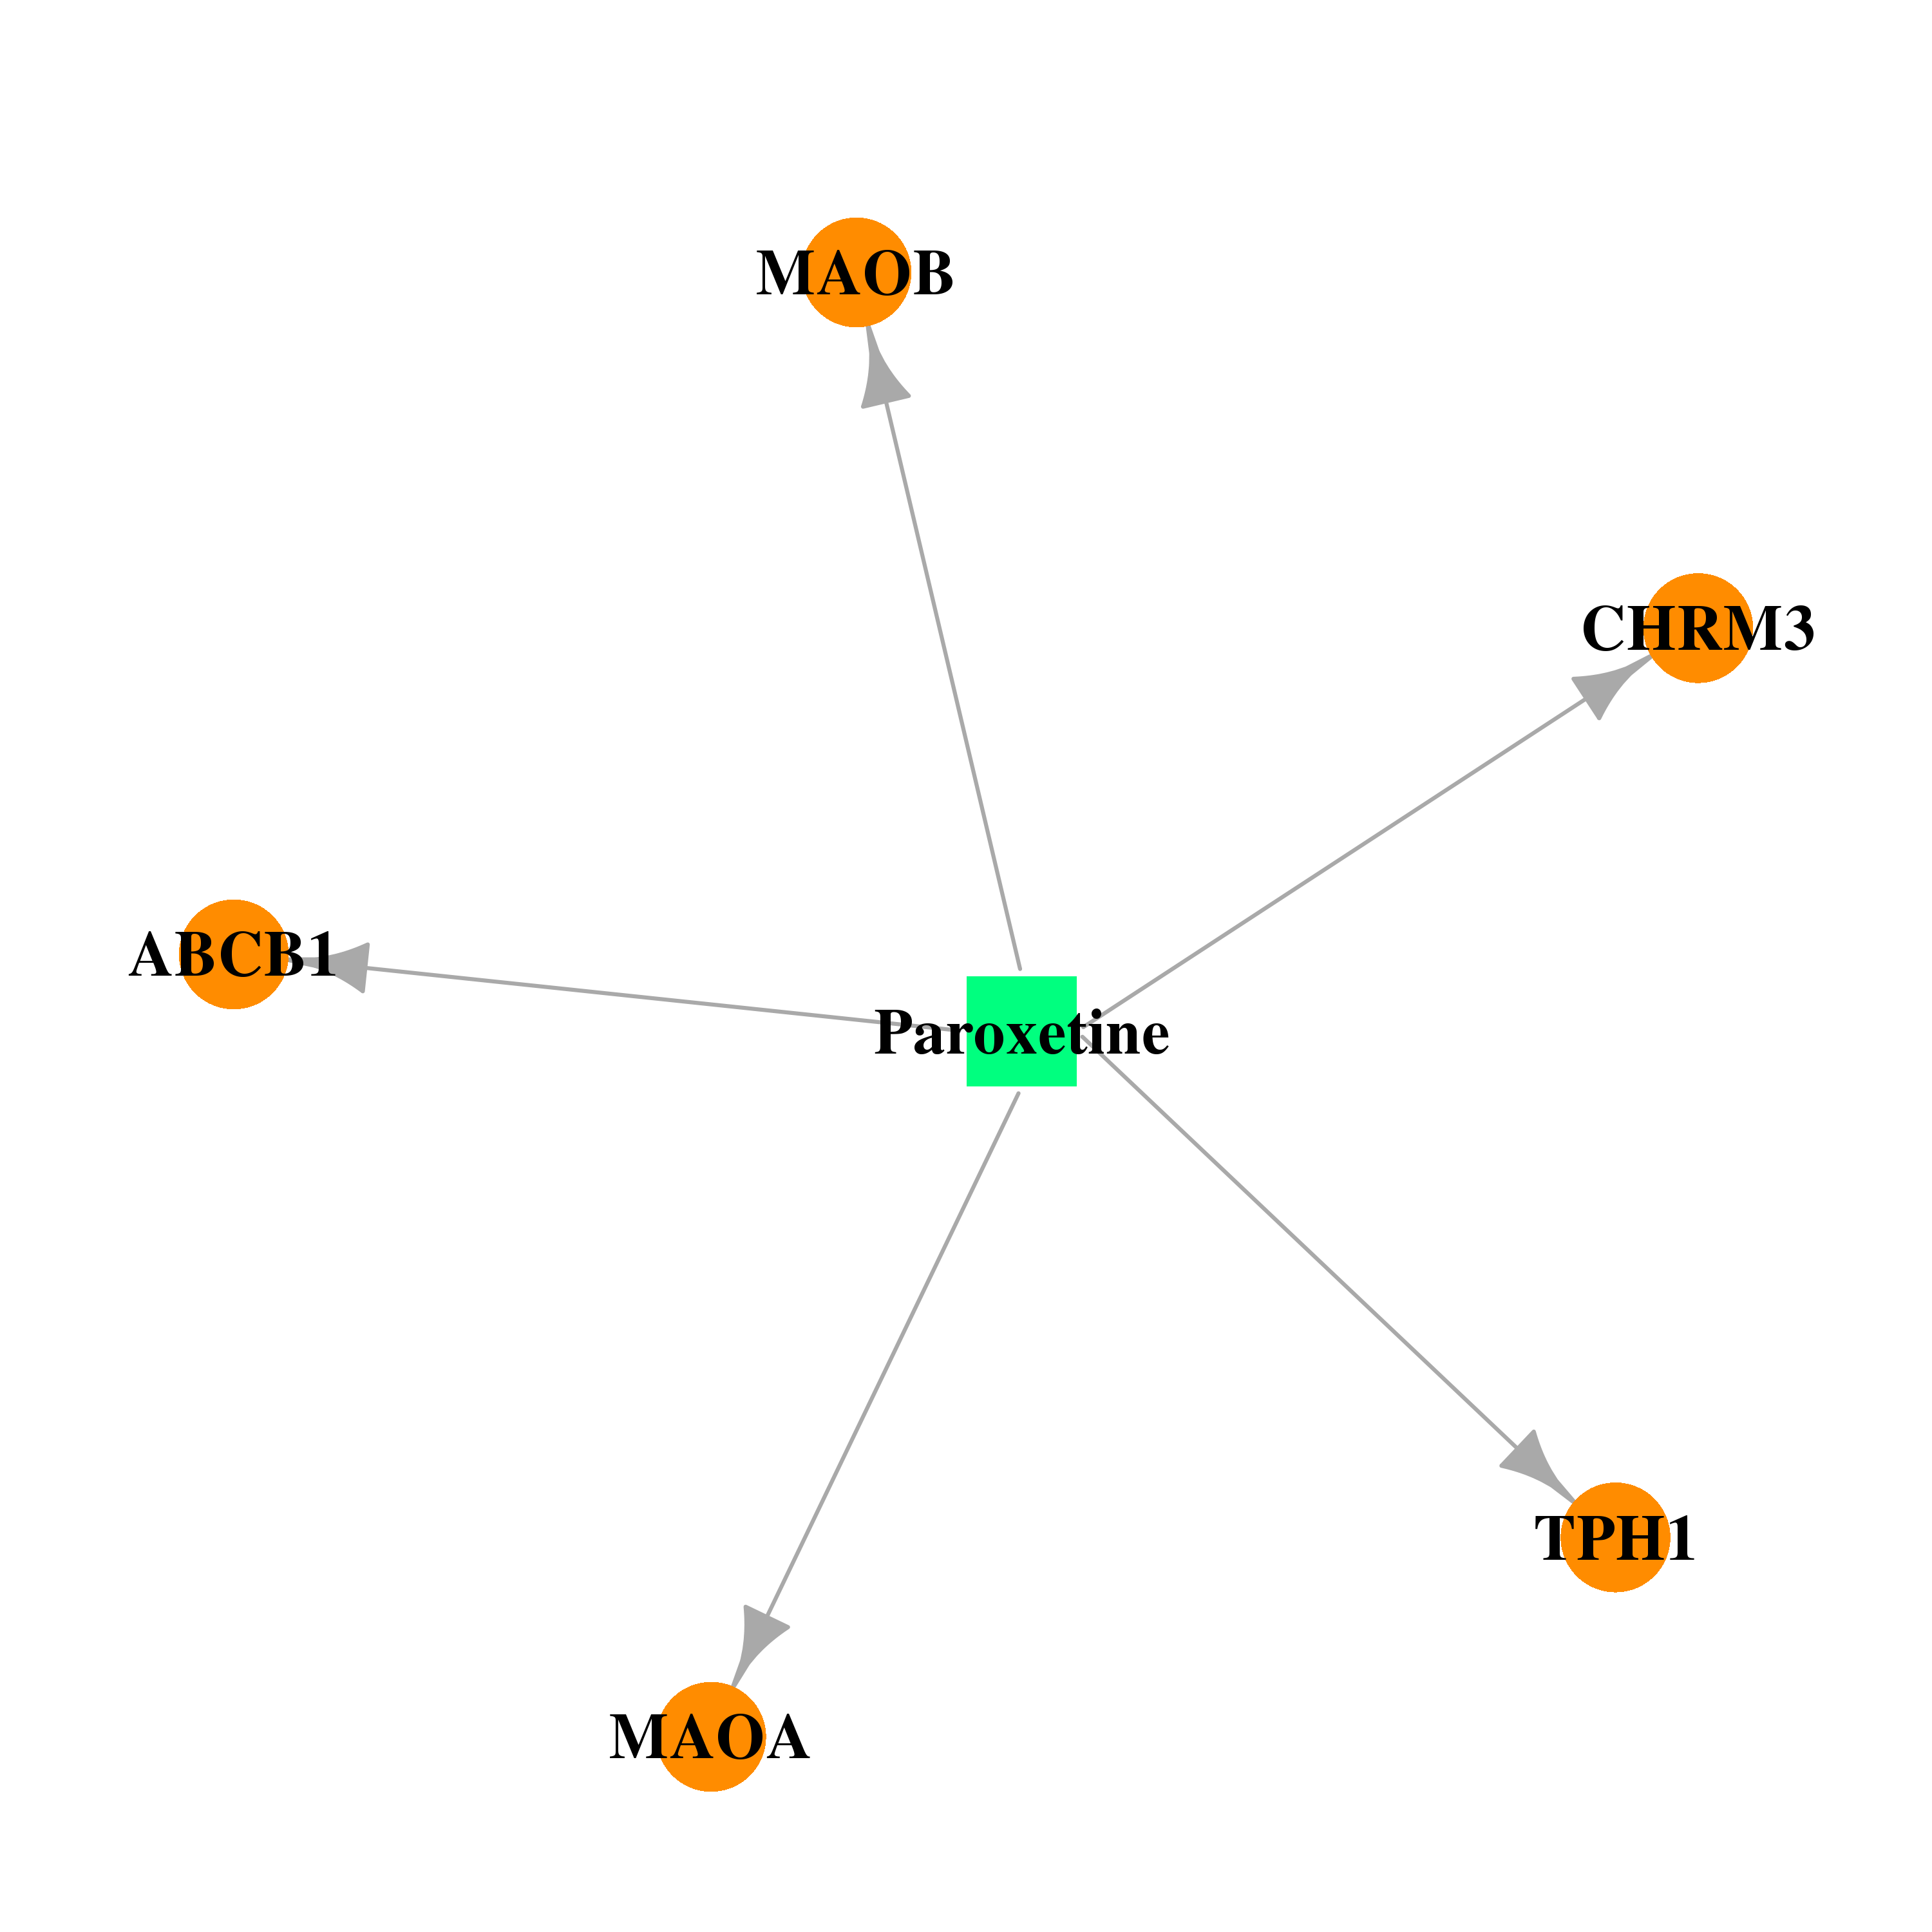 |  |
| DB00176 | tryptophan hydroxylase 1 | approved; investigational | Fluvoxamine |  |  |
| Top |
| Cross referenced IDs for TPH1 |
| * We obtained these cross-references from Uniprot database. It covers 150 different DBs, 18 categories. http://www.uniprot.org/help/cross_references_section |
: Open all cross reference information
|
Copyright © 2016-Present - The Univsersity of Texas Health Science Center at Houston @ |