|
||||||||||||||||||||
| |
| Phenotypic Information (metabolism pathway, cancer, disease, phenome) |
| |
| |
| Gene-Gene Network Information: Co-Expression Network, Interacting Genes & KEGG |
| |
|


| Gene Summary for TPI1 |
| Top |
| Phenotypic Information for TPI1(metabolism pathway, cancer, disease, phenome) |
| Cancer | CGAP: TPI1 |
| Familial Cancer Database: TPI1 | |
| * This gene is included in those cancer gene databases. |
|
|
|
|
|
| . | ||||||||||||||
Oncogene 1 | Significant driver gene in | |||||||||||||||||||
| cf) number; DB name 1 Oncogene; http://nar.oxfordjournals.org/content/35/suppl_1/D721.long, 2 Tumor Suppressor gene; https://bioinfo.uth.edu/TSGene/, 3 Cancer Gene Census; http://www.nature.com/nrc/journal/v4/n3/abs/nrc1299.html, 4 CancerGenes; http://nar.oxfordjournals.org/content/35/suppl_1/D721.long, 5 Network of Cancer Gene; http://ncg.kcl.ac.uk/index.php, 1Therapeutic Vulnerabilities in Cancer; http://cbio.mskcc.org/cancergenomics/statius/ |
| KEGG_GLYCOLYSIS_GLUCONEOGENESIS KEGG_FRUCTOSE_AND_MANNOSE_METABOLISM KEGG_INOSITOL_PHOSPHATE_METABOLISM BIOCARTA_GLYCOLYSIS_PATHWAY REACTOME_METABOLISM_OF_CARBOHYDRATES REACTOME_GLUCOSE_METABOLISM | |
| OMIM | |
| Orphanet | |
| Disease | KEGG Disease: TPI1 |
| MedGen: TPI1 (Human Medical Genetics with Condition) | |
| ClinVar: TPI1 | |
| Phenotype | MGI: TPI1 (International Mouse Phenotyping Consortium) |
| PhenomicDB: TPI1 | |
| Mutations for TPI1 |
| * Under tables are showing count per each tissue to give us broad intuition about tissue specific mutation patterns.You can go to the detailed page for each mutation database's web site. |
| There's no structural variation information in COSMIC data for this gene. |
| * From mRNA Sanger sequences, Chitars2.0 arranged chimeric transcripts. This table shows TPI1 related fusion information. |
| ID | Head Gene | Tail Gene | Accession | Gene_a | qStart_a | qEnd_a | Chromosome_a | tStart_a | tEnd_a | Gene_a | qStart_a | qEnd_a | Chromosome_a | tStart_a | tEnd_a |
| BC054482 | TPI1 | 5 | 102 | 12 | 6976695 | 6976792 | TOP2B | 95 | 559 | 3 | 25656965 | 25661417 | |
| DW413329 | CHD2 | 17 | 143 | 15 | 93467720 | 93470537 | TPI1 | 144 | 320 | 12 | 6979751 | 6979927 | |
| CA431273 | TPI1 | 19 | 189 | 12 | 6979822 | 6979992 | ILF3 | 187 | 774 | 19 | 10801474 | 10802067 | |
| BQ000670 | SERPINH1 | 18 | 298 | 11 | 75283546 | 75283826 | TPI1 | 294 | 683 | 12 | 6979538 | 6979927 | |
| BG751641 | CAPNS1 | 4 | 536 | 19 | 36636905 | 36641020 | TPI1 | 529 | 633 | 12 | 6979864 | 6979968 | |
| AI652202 | TPI1 | 18 | 72 | 12 | 6979938 | 6979992 | MAPK14 | 69 | 205 | 6 | 36076697 | 36076833 | |
| AF086180 | TPI1 | 1 | 88 | 12 | 6979877 | 6979964 | PFKL | 83 | 322 | 21 | 45747008 | 45747247 | |
| BC004230 | RPL28 | 44 | 532 | 19 | 55897311 | 55899744 | TPI1 | 529 | 1753 | 12 | 6976702 | 6979993 | |
| BC009885 | RPL28 | 44 | 532 | 19 | 55897311 | 55899744 | TPI1 | 529 | 1753 | 12 | 6976702 | 6979993 | |
| Top |
| There's no copy number variation information in COSMIC data for this gene. |
| Top |
|
 |
| Top |
| Stat. for Non-Synonymous SNVs (# total SNVs=27) | (# total SNVs=6) |
 |  |
(# total SNVs=0) | (# total SNVs=0) |
| Top |
| * When you move the cursor on each content, you can see more deailed mutation information on the Tooltip. Those are primary_site,primary_histology,mutation(aa),pubmedID. |
| GRCh37 position | Mutation(aa) | Unique sampleID count |
| chr12:6978532-6978532 | p.F145F | 2 |
| chr12:6978338-6978338 | p.E105D | 2 |
| chr12:6978930-6978930 | p.P179L | 1 |
| chr12:6976808-6976808 | p.I26I | 1 |
| chr12:6979542-6979542 | p.Q249K | 1 |
| chr12:6978433-6978433 | p.Q112H | 1 |
| chr12:6979213-6979213 | p.A182S | 1 |
| chr12:6976815-6976815 | p.L29V | 1 |
| chr12:6978441-6978441 | p.A115V | 1 |
| chr12:6979227-6979227 | p.H186H | 1 |
| Top |
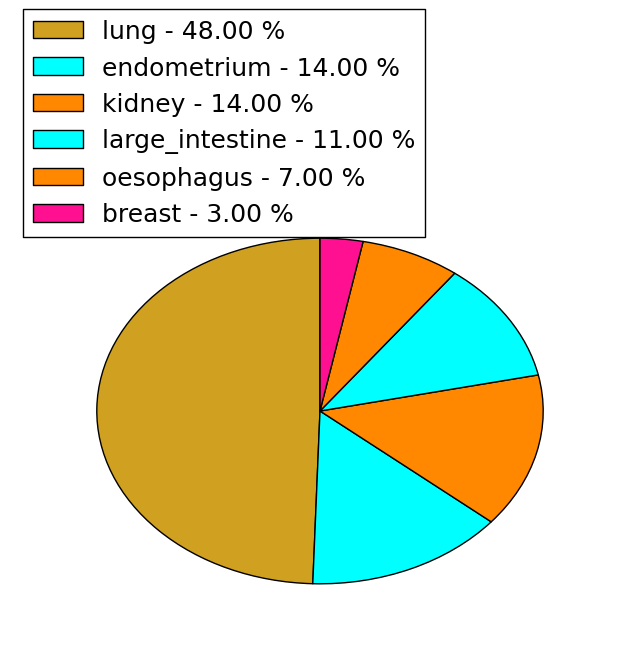
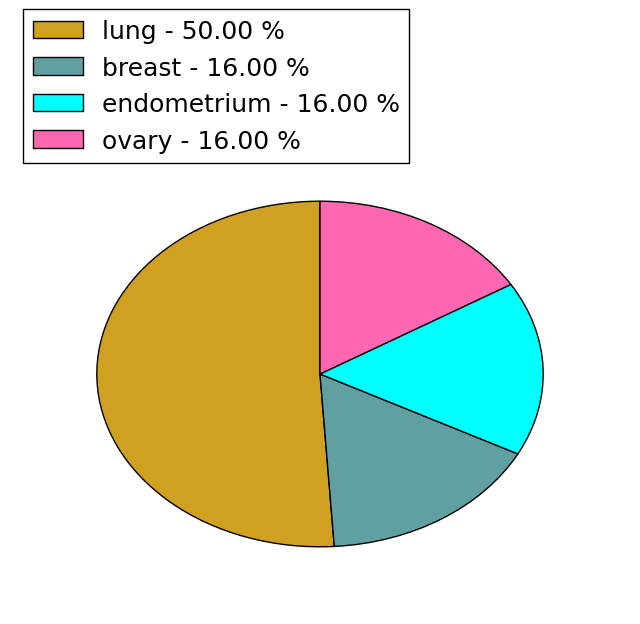
|
 |
| Point Mutation/ Tissue ID | 1 | 2 | 3 | 4 | 5 | 6 | 7 | 8 | 9 | 10 | 11 | 12 | 13 | 14 | 15 | 16 | 17 | 18 | 19 | 20 |
| # sample | 1 | 3 | 2 | 3 | 8 | 4 | 3 | 5 | ||||||||||||
| # mutation | 1 | 3 | 2 | 3 | 9 | 5 | 3 | 5 | ||||||||||||
| nonsynonymous SNV | 1 | 3 | 2 | 3 | 7 | 4 | 2 | 4 | ||||||||||||
| synonymous SNV | 2 | 1 | 1 | 1 |
| cf) Tissue ID; Tissue type (1; BLCA[Bladder Urothelial Carcinoma], 2; BRCA[Breast invasive carcinoma], 3; CESC[Cervical squamous cell carcinoma and endocervical adenocarcinoma], 4; COAD[Colon adenocarcinoma], 5; GBM[Glioblastoma multiforme], 6; Glioma Low Grade, 7; HNSC[Head and Neck squamous cell carcinoma], 8; KICH[Kidney Chromophobe], 9; KIRC[Kidney renal clear cell carcinoma], 10; KIRP[Kidney renal papillary cell carcinoma], 11; LAML[Acute Myeloid Leukemia], 12; LUAD[Lung adenocarcinoma], 13; LUSC[Lung squamous cell carcinoma], 14; OV[Ovarian serous cystadenocarcinoma ], 15; PAAD[Pancreatic adenocarcinoma], 16; PRAD[Prostate adenocarcinoma], 17; SKCM[Skin Cutaneous Melanoma], 18:STAD[Stomach adenocarcinoma], 19:THCA[Thyroid carcinoma], 20:UCEC[Uterine Corpus Endometrial Carcinoma]) |
| Top |
| * We represented just top 10 SNVs. When you move the cursor on each content, you can see more deailed mutation information on the Tooltip. Those are primary_site, primary_histology, mutation(aa), pubmedID. |
| Genomic Position | Mutation(aa) | Unique sampleID count |
| chr12:6976727 | p.S36R | 3 |
| chr12:6978532 | p.F145L,TPI1 | 2 |
| chr12:6979288 | p.P45L,TPI1 | 1 |
| chr12:6976808 | p.T176N,TPI1 | 1 |
| chr12:6978441 | p.I49V,TPI1 | 1 |
| chr12:6979473 | p.A182S,TPI1 | 1 |
| chr12:6976815 | p.D86G,TPI1 | 1 |
| chr12:6978443 | p.R206C,TPI1 | 1 |
| chr12:6979488 | p.G88R,TPI1 | 1 |
| chr12:6978046 | p.I207V,TPI1 | 1 |
| * Copy number data were extracted from TCGA using R package TCGA-Assembler. The URLs of all public data files on TCGA DCC data server were gathered on Jan-05-2015. Function ProcessCNAData in TCGA-Assembler package was used to obtain gene-level copy number value which is calculated as the average copy number of the genomic region of a gene. |
 |
| cf) Tissue ID[Tissue type]: BLCA[Bladder Urothelial Carcinoma], BRCA[Breast invasive carcinoma], CESC[Cervical squamous cell carcinoma and endocervical adenocarcinoma], COAD[Colon adenocarcinoma], GBM[Glioblastoma multiforme], Glioma Low Grade, HNSC[Head and Neck squamous cell carcinoma], KICH[Kidney Chromophobe], KIRC[Kidney renal clear cell carcinoma], KIRP[Kidney renal papillary cell carcinoma], LAML[Acute Myeloid Leukemia], LUAD[Lung adenocarcinoma], LUSC[Lung squamous cell carcinoma], OV[Ovarian serous cystadenocarcinoma ], PAAD[Pancreatic adenocarcinoma], PRAD[Prostate adenocarcinoma], SKCM[Skin Cutaneous Melanoma], STAD[Stomach adenocarcinoma], THCA[Thyroid carcinoma], UCEC[Uterine Corpus Endometrial Carcinoma] |
| Top |
| Gene Expression for TPI1 |
| * CCLE gene expression data were extracted from CCLE_Expression_Entrez_2012-10-18.res: Gene-centric RMA-normalized mRNA expression data. |
 |
| * Normalized gene expression data of RNASeqV2 was extracted from TCGA using R package TCGA-Assembler. The URLs of all public data files on TCGA DCC data server were gathered at Jan-05-2015. Only eight cancer types have enough normal control samples for differential expression analysis. (t test, adjusted p<0.05 (using Benjamini-Hochberg FDR)) |
 |
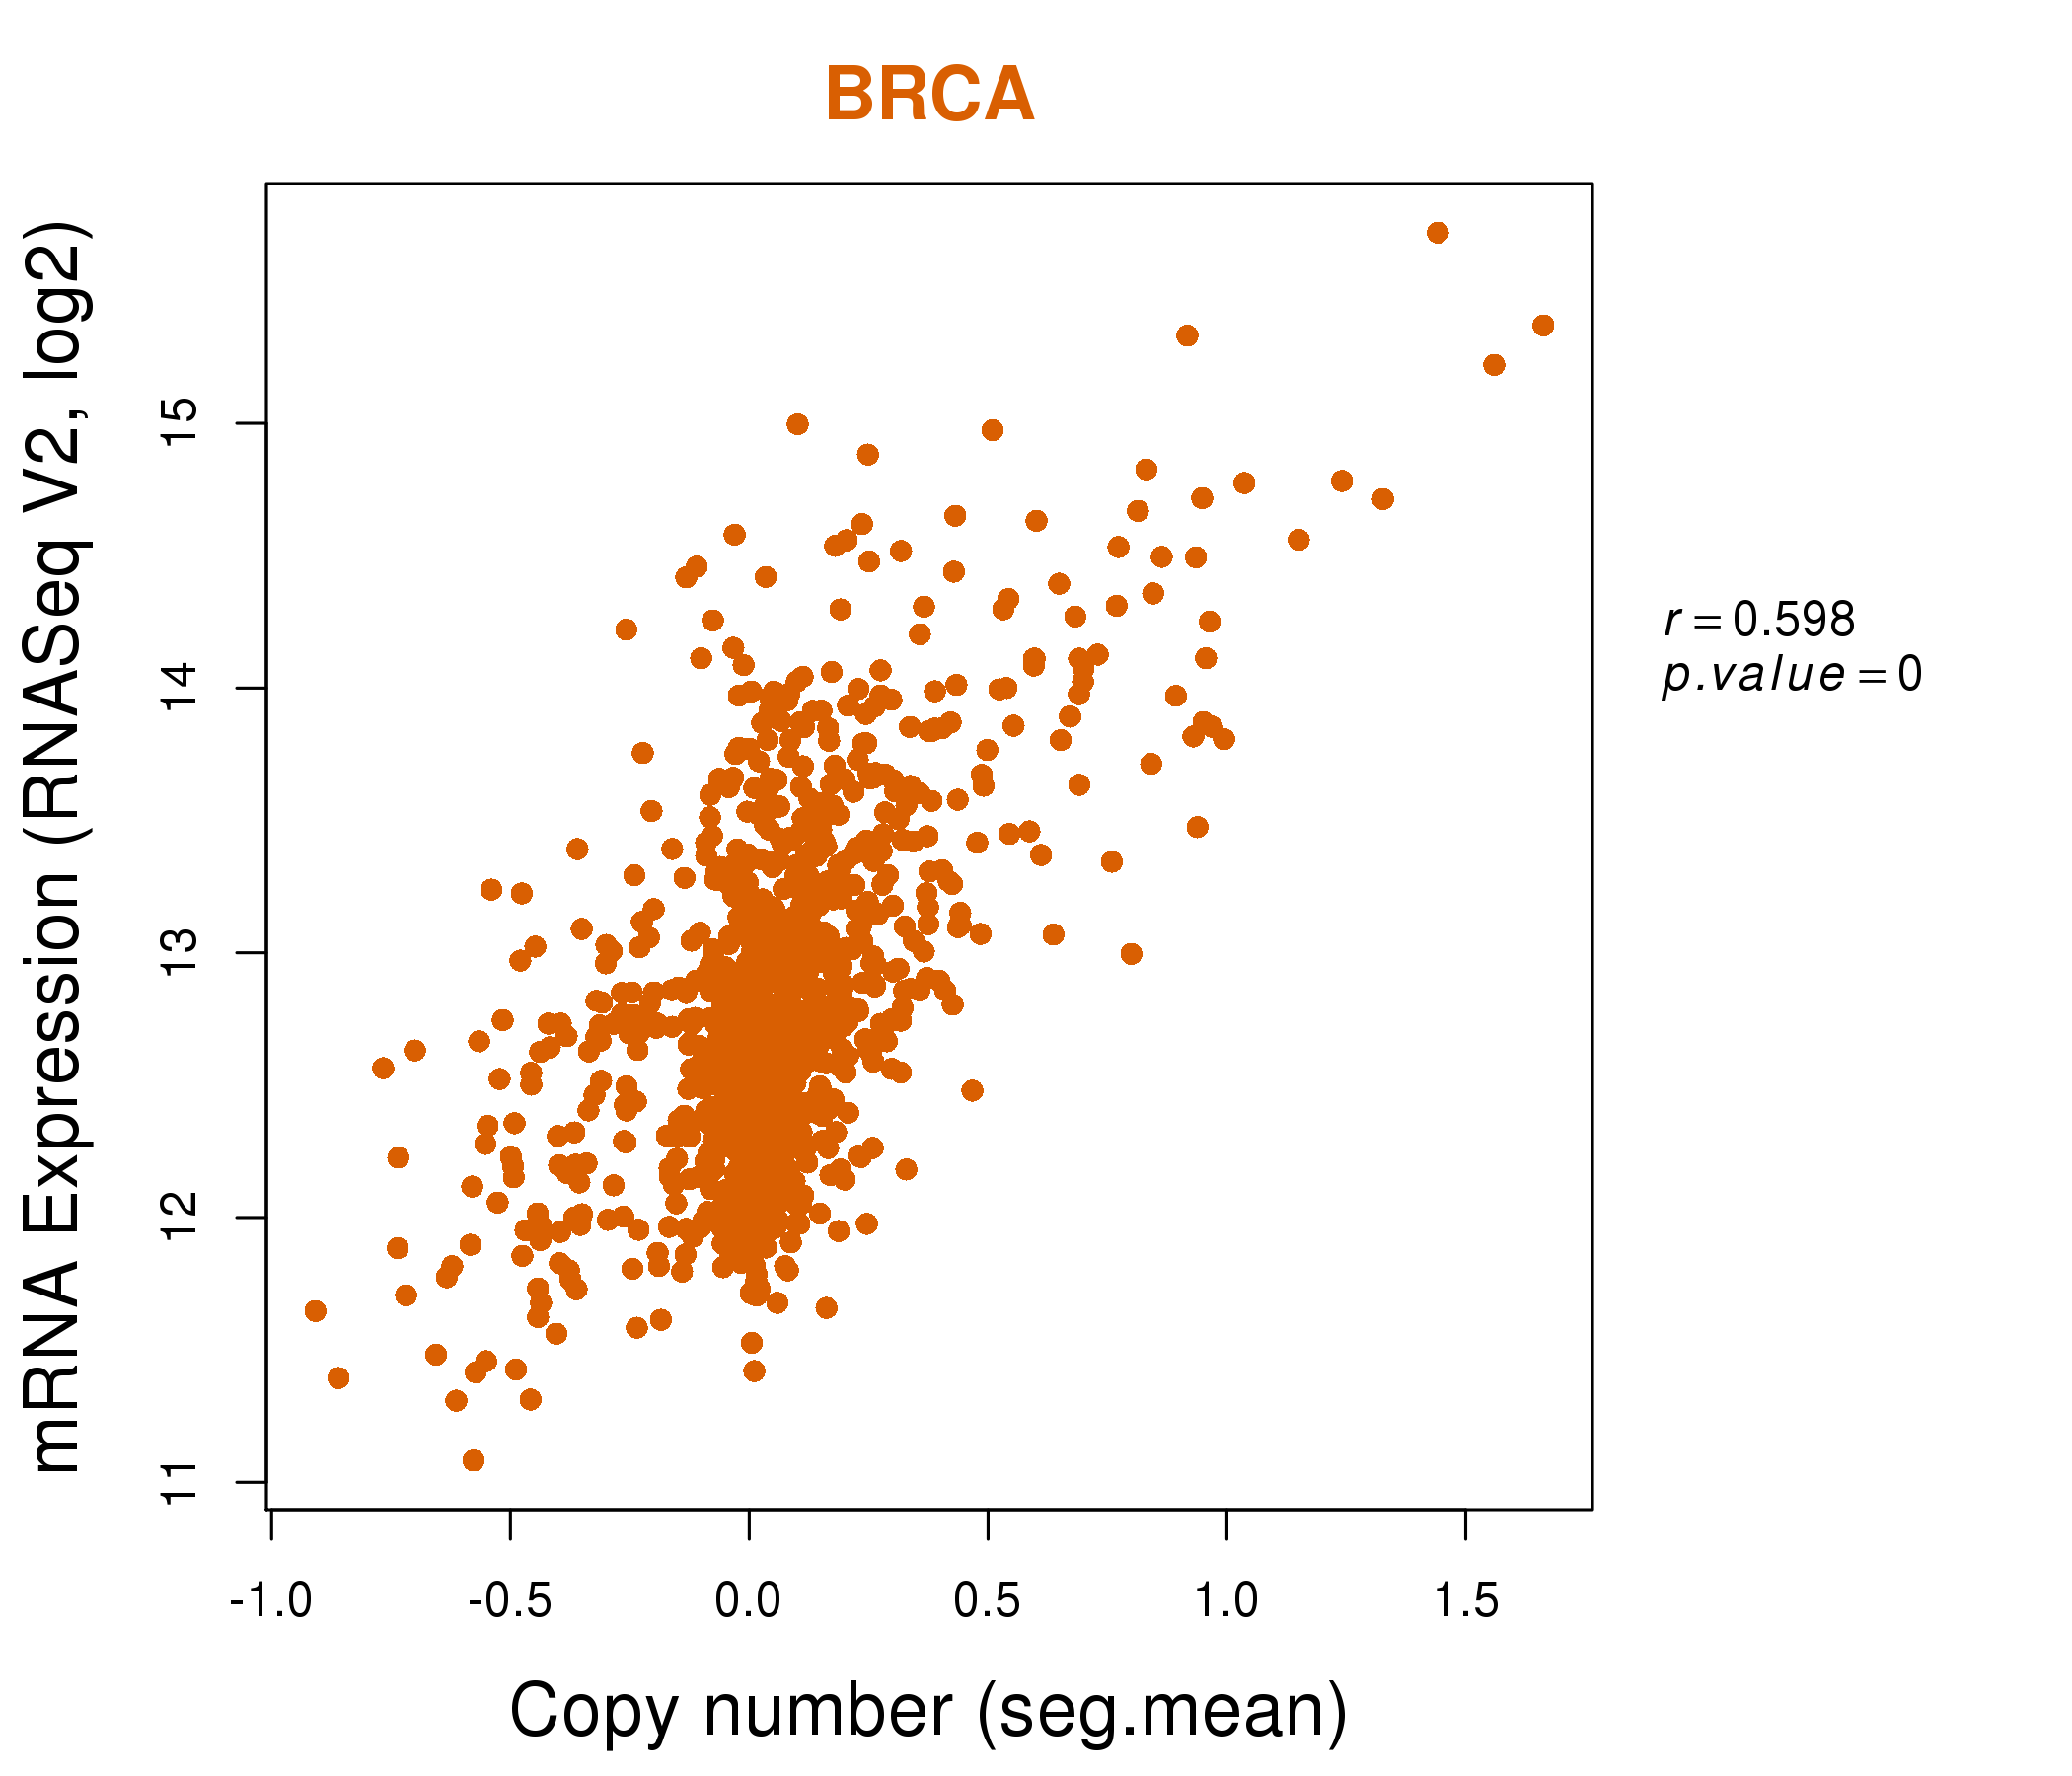
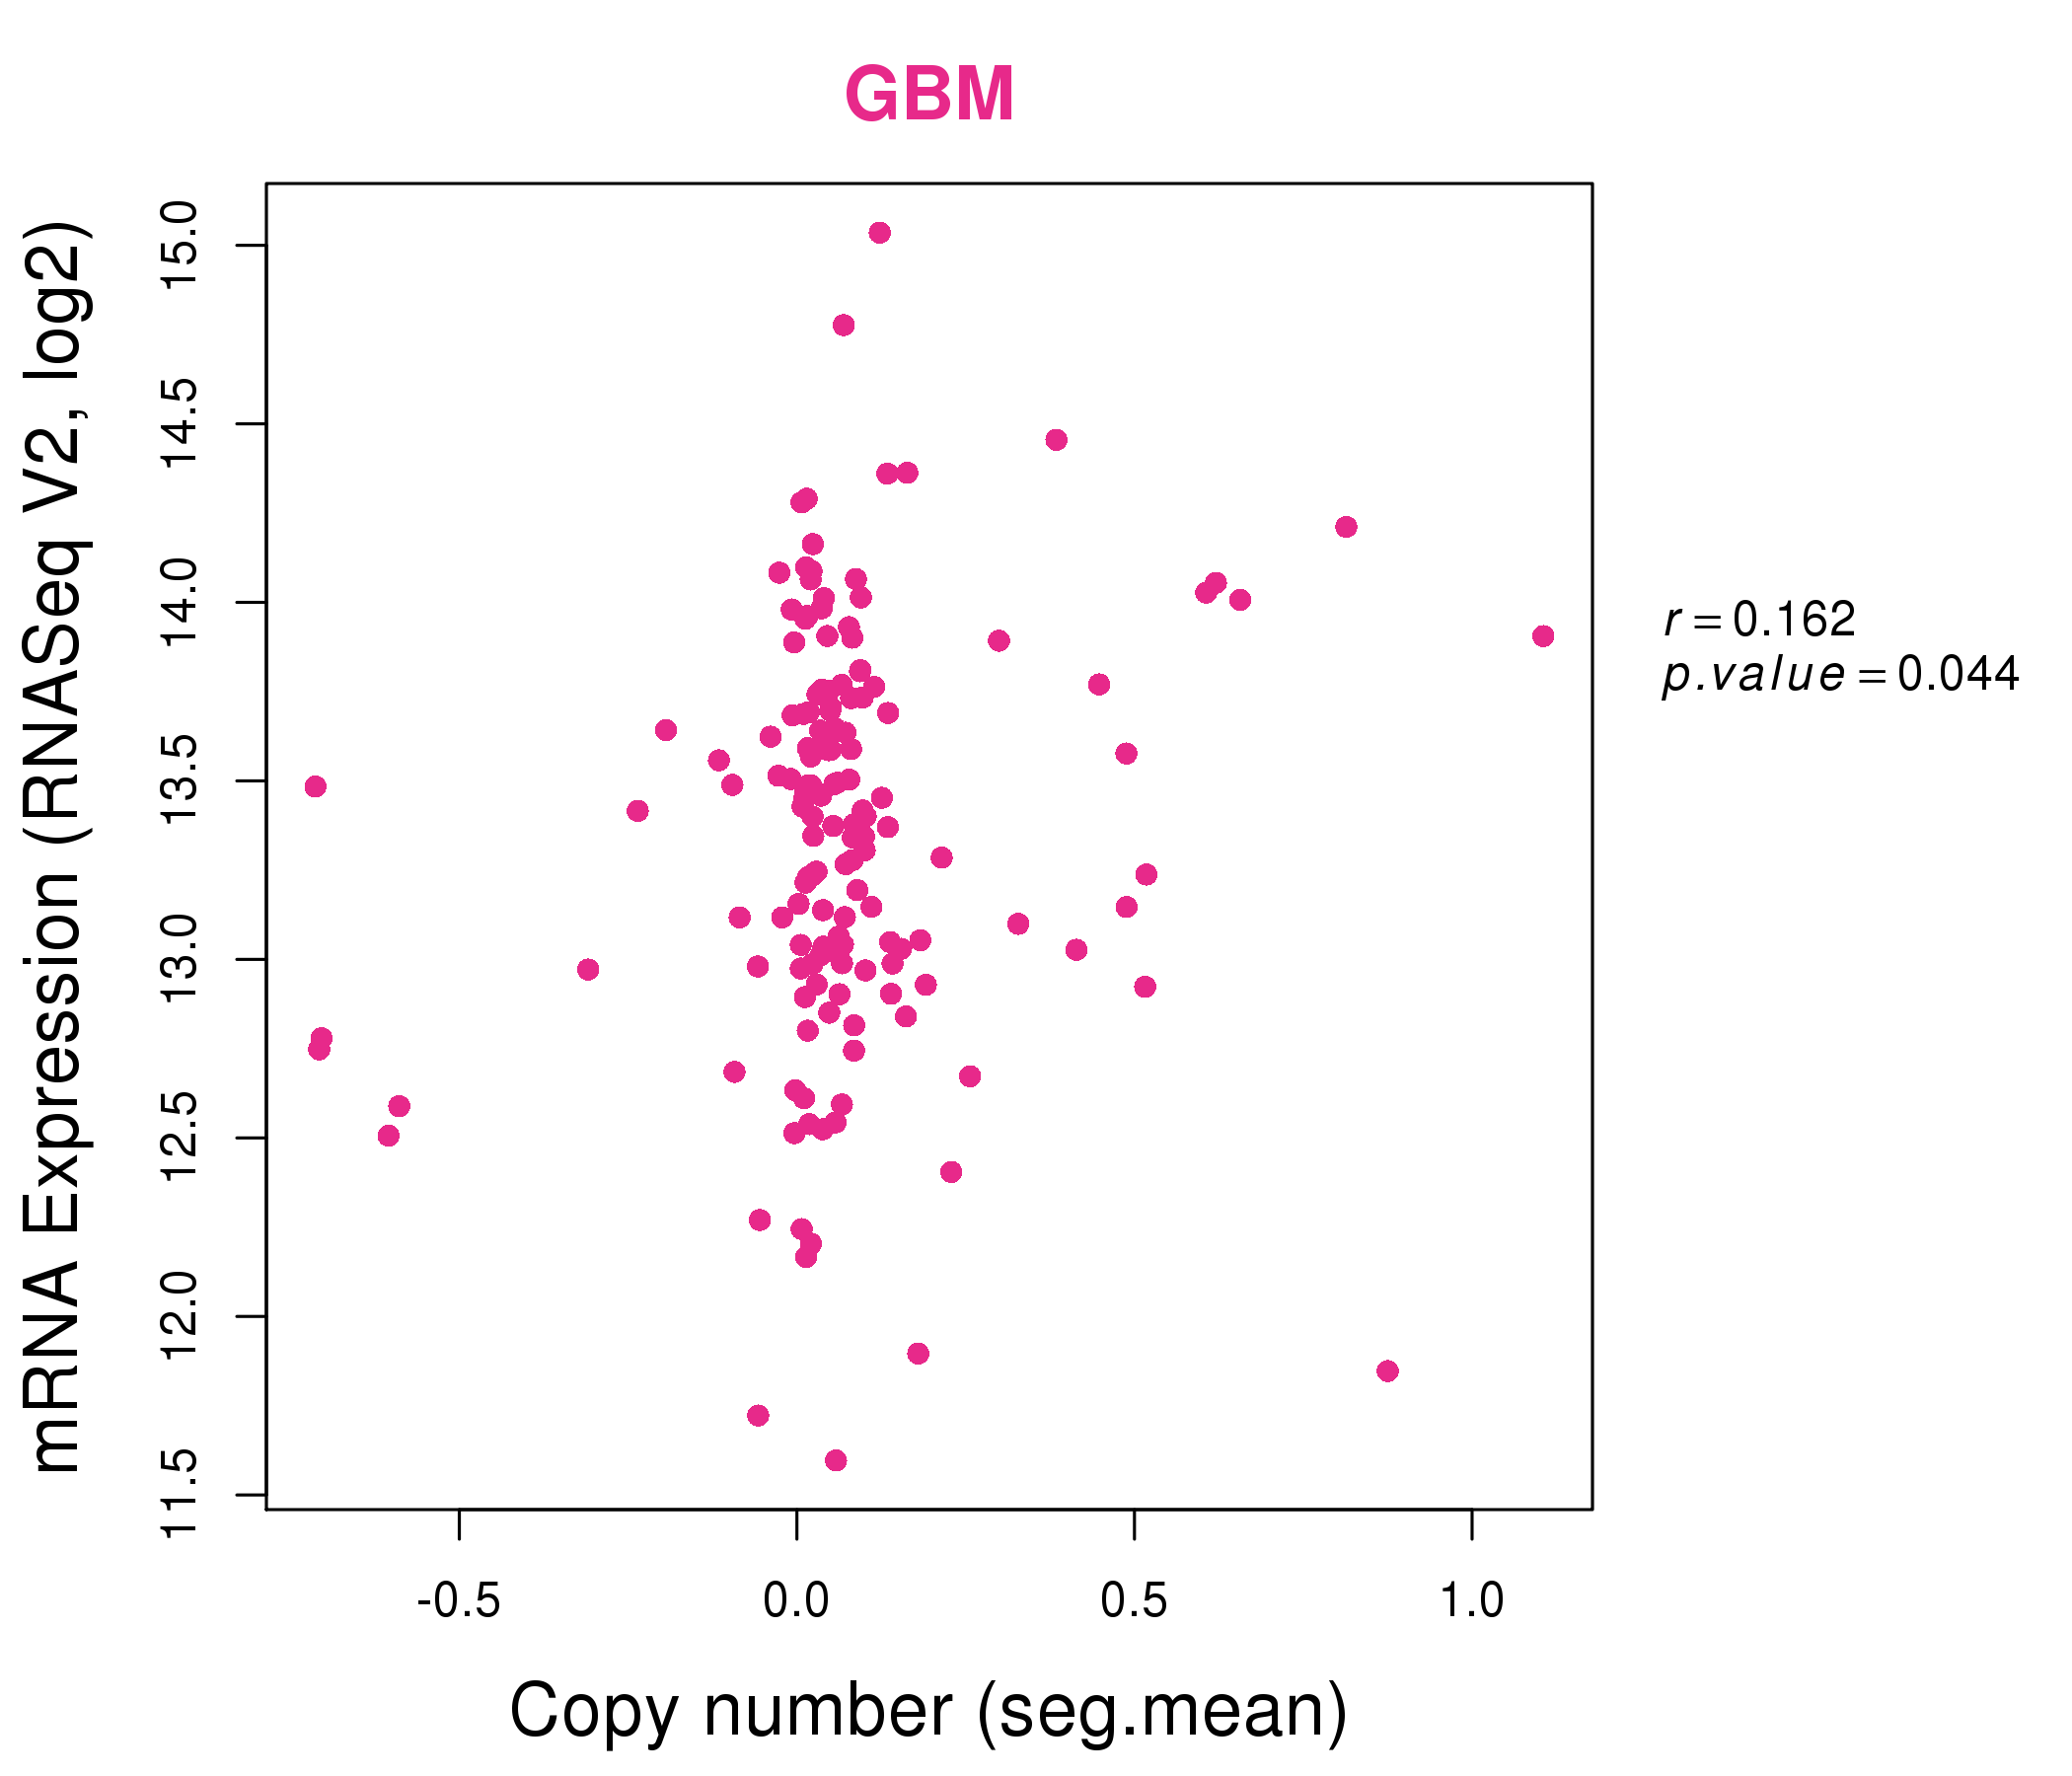
| Top |
| * This plots show the correlation between CNV and gene expression. |
: Open all plots for all cancer types
 |
|
 |
|
| Top |
| Gene-Gene Network Information |
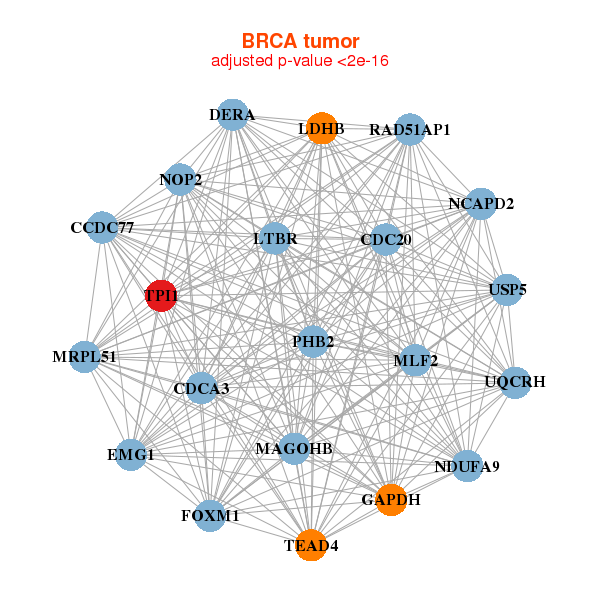
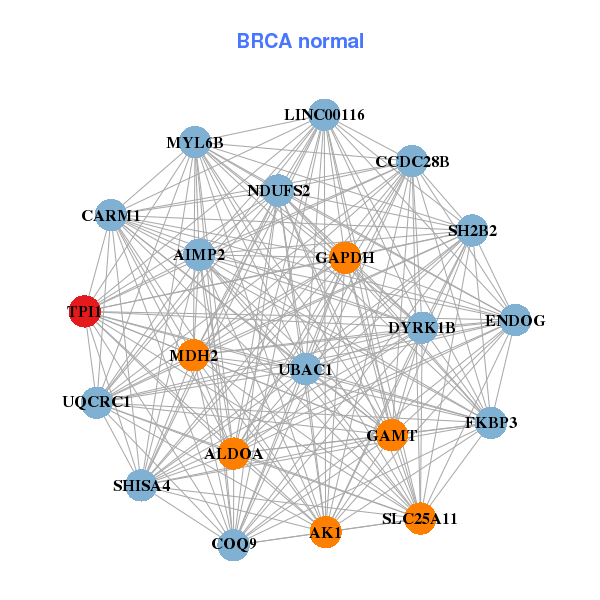
| * Co-Expression network figures were drawn using R package igraph. Only the top 20 genes with the highest correlations were shown. Red circle: input gene, orange circle: cell metabolism gene, sky circle: other gene |
: Open all plots for all cancer types
 |
| ||||
| CCDC77,CDC20,CDCA3,DERA,EMG1,FOXM1,GAPDH, LDHB,LTBR,MAGOHB,MLF2,MRPL51,NCAPD2,NDUFA9, NOP2,PHB2,RAD51AP1,TEAD4,TPI1,UQCRH,USP5 | AIMP2,AK1,ALDOA,CARM1,CCDC28B,COQ9,DYRK1B, ENDOG,FKBP3,GAMT,GAPDH,MDH2,MYL6B,LINC00116, NDUFS2,SH2B2,SHISA4,SLC25A11,TPI1,UBAC1,UQCRC1 | ||||
 |
| ||||
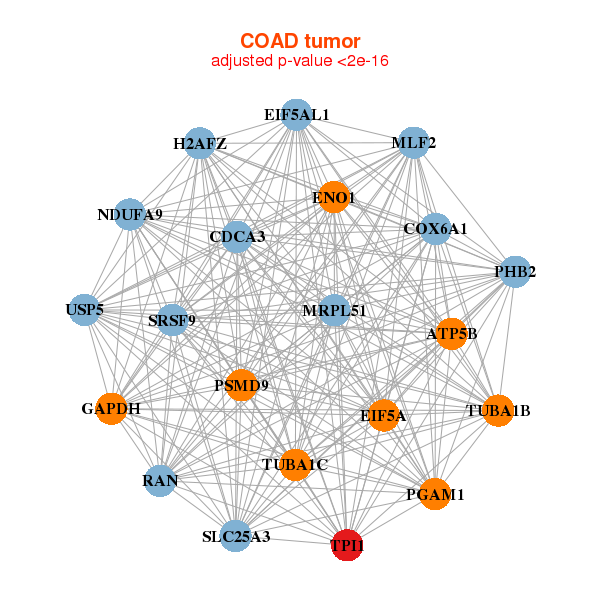
| ATP5B,CDCA3,COX6A1,EIF5A,EIF5AL1,ENO1,GAPDH, H2AFZ,MLF2,MRPL51,NDUFA9,PGAM1,PHB2,PSMD9, RAN,SRSF9,SLC25A3,TPI1,TUBA1B,TUBA1C,USP5 | ANXA4,AP2S1,ASL,AURKAIP1,C2orf47,COX6B1,EDF1, ETFB,GDI2,LMAN2,MDH2,MGST2,MPDU1,NDUFC1, POP4,TACO1,TALDO1,EMC3,TMEM208,TPI1,UQCRC1 |
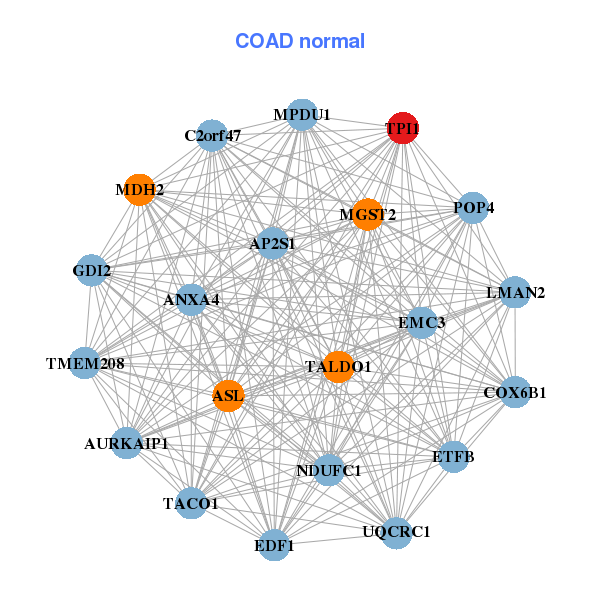
| * Co-Expression network figures were drawn using R package igraph. Only the top 20 genes with the highest correlations were shown. Red circle: input gene, orange circle: cell metabolism gene, sky circle: other gene |
: Open all plots for all cancer types
| Top |
: Open all interacting genes' information including KEGG pathway for all interacting genes from DAVID
| Top |
| Pharmacological Information for TPI1 |
| DB Category | DB Name | DB's ID and Url link |
| * Gene Centered Interaction Network. |
 |
| * Drug Centered Interaction Network. |
| DrugBank ID | Target Name | Drug Groups | Generic Name | Drug Centered Network | Drug Structure |
| DB01709 | triosephosphate isomerase 1 | experimental | 2-Phosphoglyceric Acid |  | 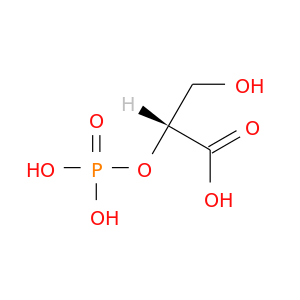 |
| DB01779 | triosephosphate isomerase 1 | experimental | Glycerol-2-Phosphate |  | 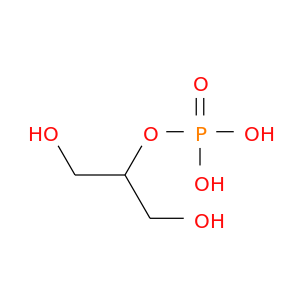 |
| DB02515 | triosephosphate isomerase 1 | experimental | 3-Phosphoglycerol |  | 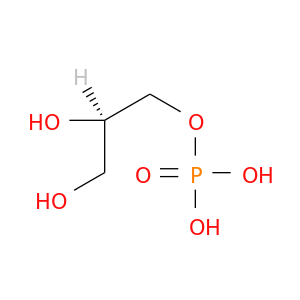 |
| DB02726 | triosephosphate isomerase 1 | experimental | 2-Phosphoglycolic Acid | 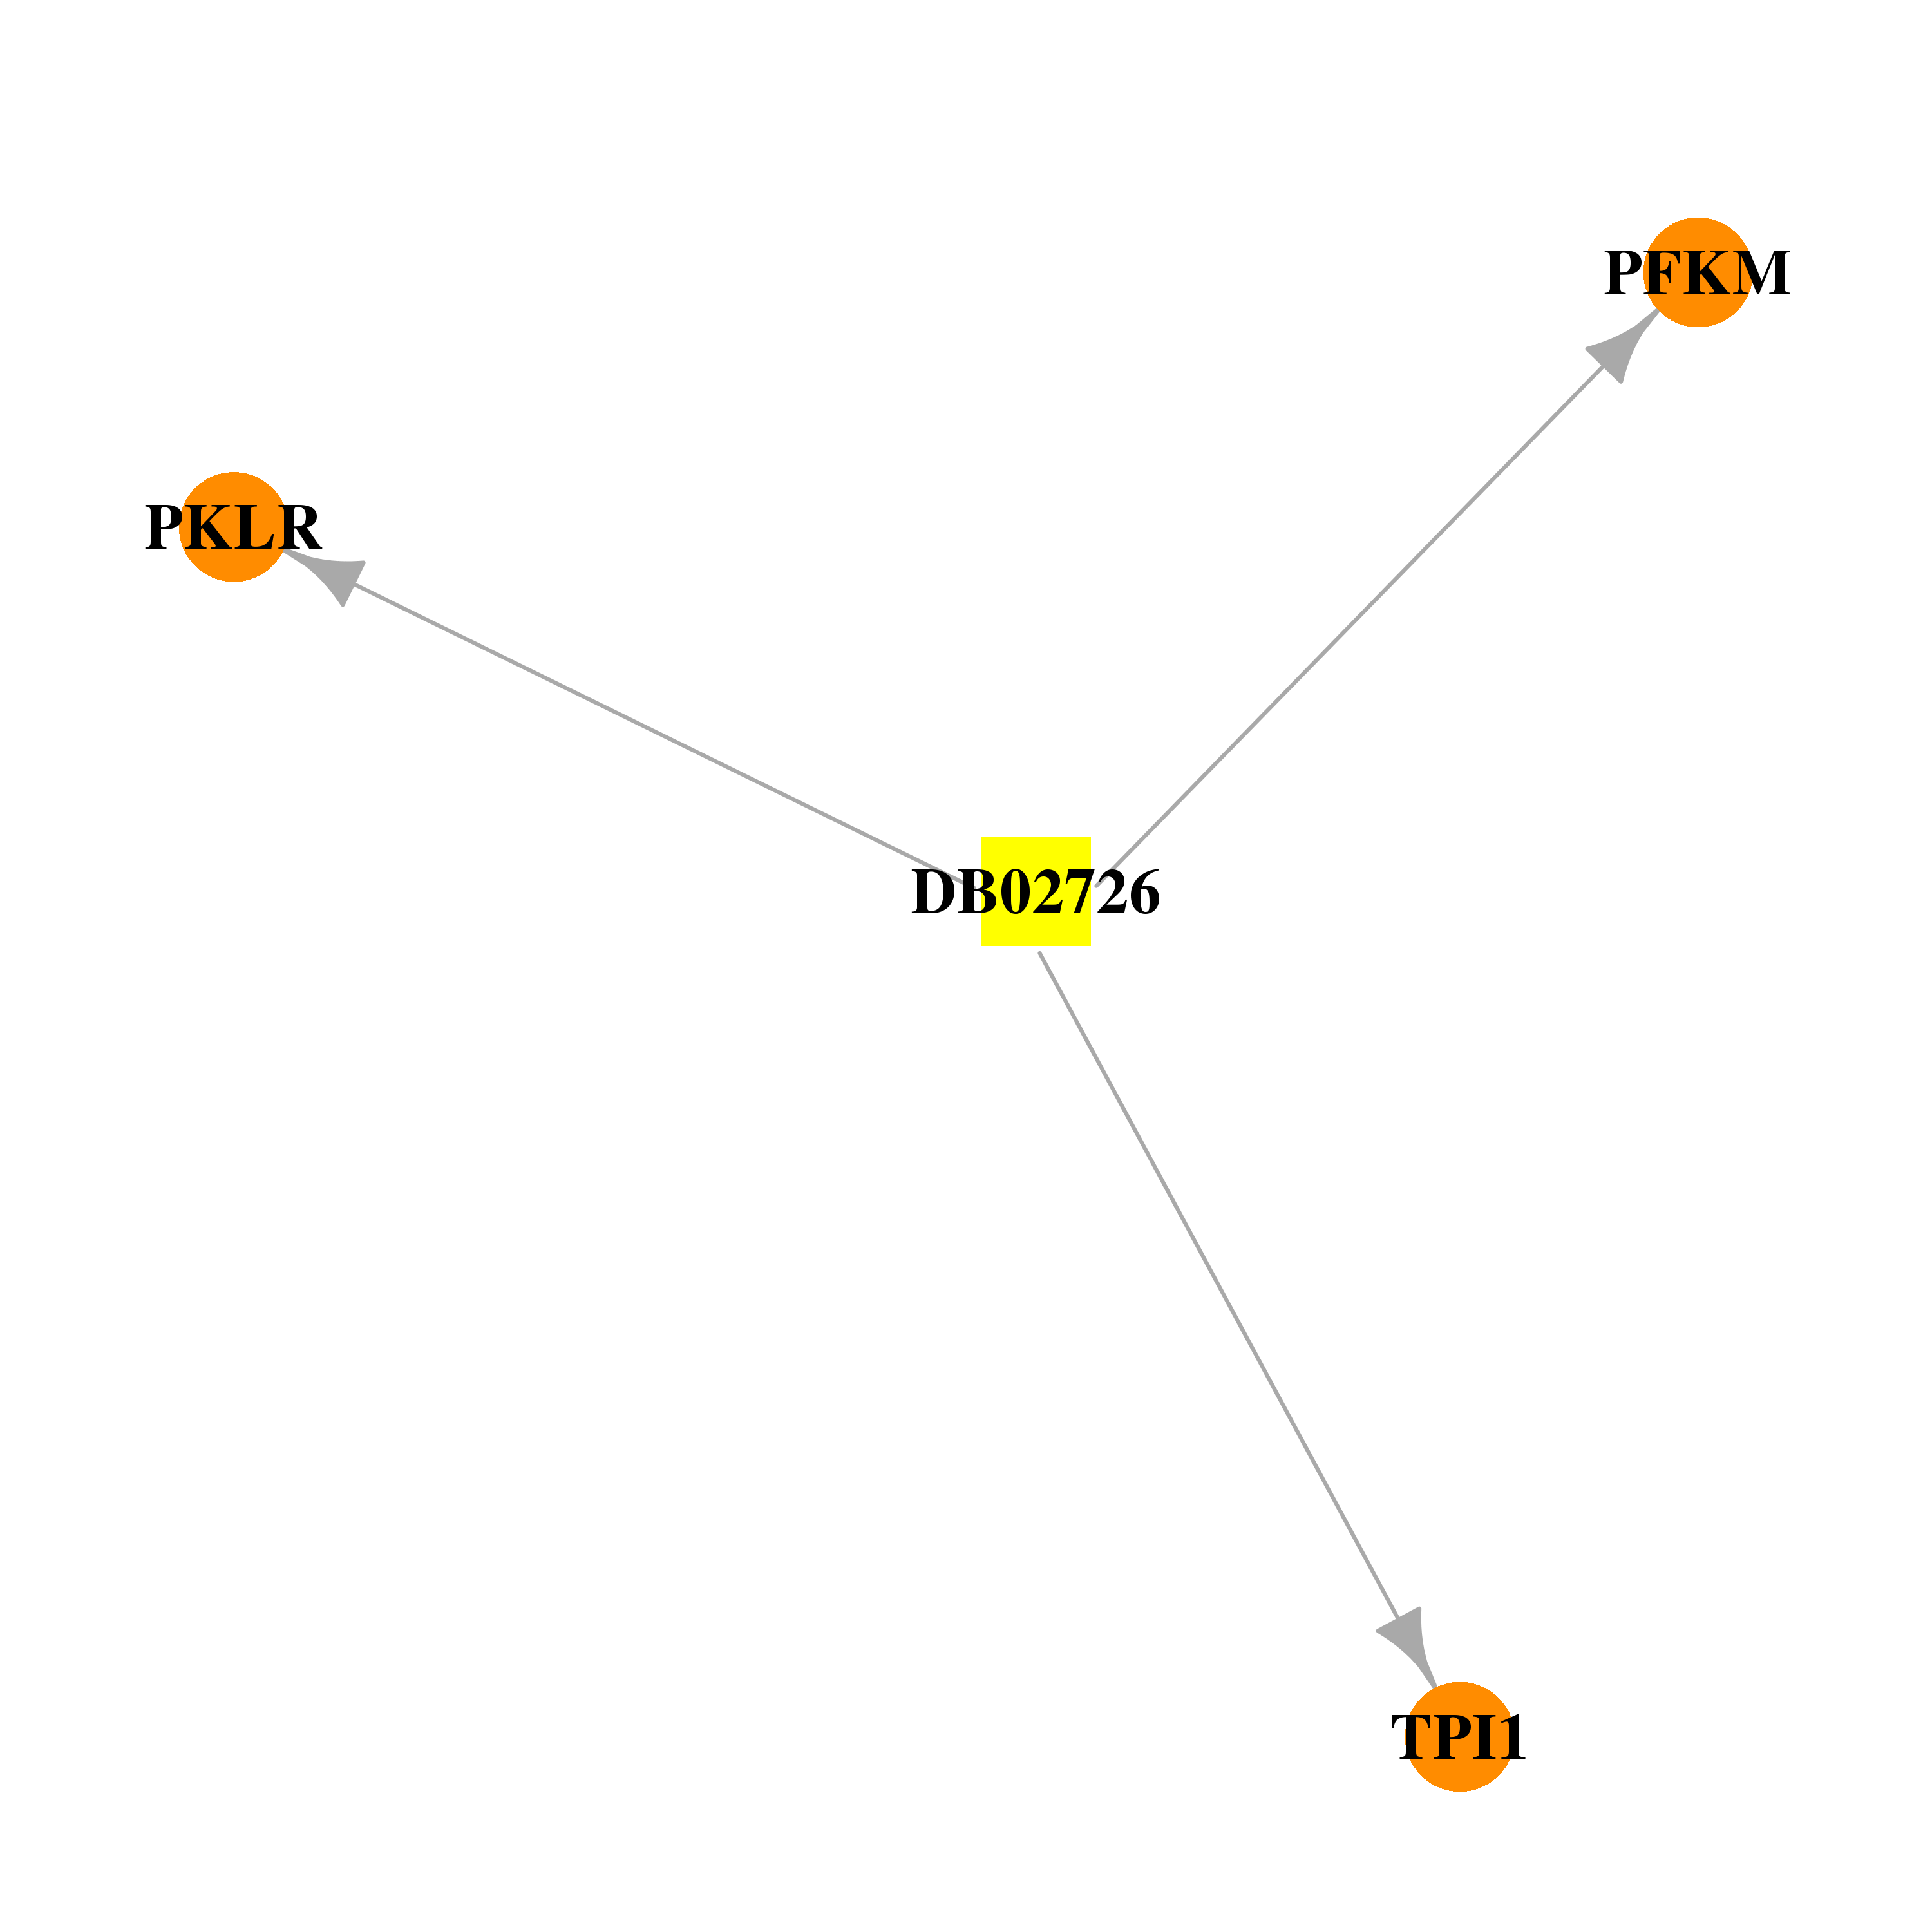 | 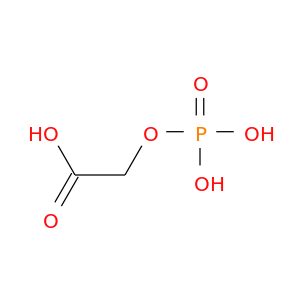 |
| DB02951 | triosephosphate isomerase 1 | experimental | 3-Hydroxypyruvic Acid |  | 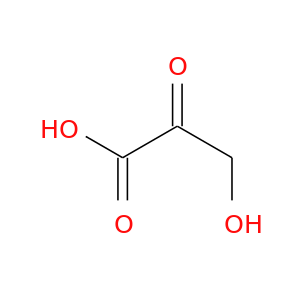 |
| DB04510 | triosephosphate isomerase 1 | experimental | 3-Phosphoglyceric Acid |  | 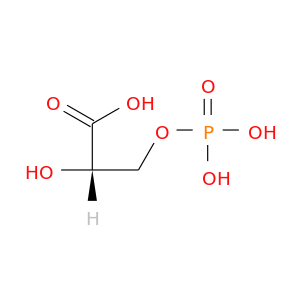 |
| DB01695 | triosephosphate isomerase 1 | experimental | N-Hydroxy-4-Phosphono-Butanamide |  |  |
| DB03026 | triosephosphate isomerase 1 | experimental | Phosphoglycolohydroxamic Acid |  |  |
| DB03132 | triosephosphate isomerase 1 | experimental | 3-(2-Benzothiazolylthio)-1-Propanesulfonic Acid |  | 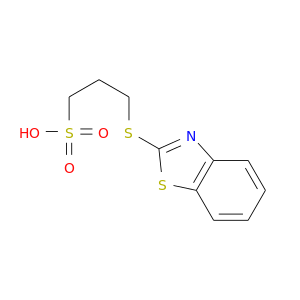 |
| DB03135 | triosephosphate isomerase 1 | experimental | [2(Formyl-Hydroxy-Amino)-Ethyl]-Phosphonic Acid |  | 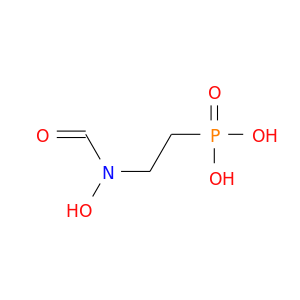 |
| DB03314 | triosephosphate isomerase 1 | experimental | Fluorotryptophane | 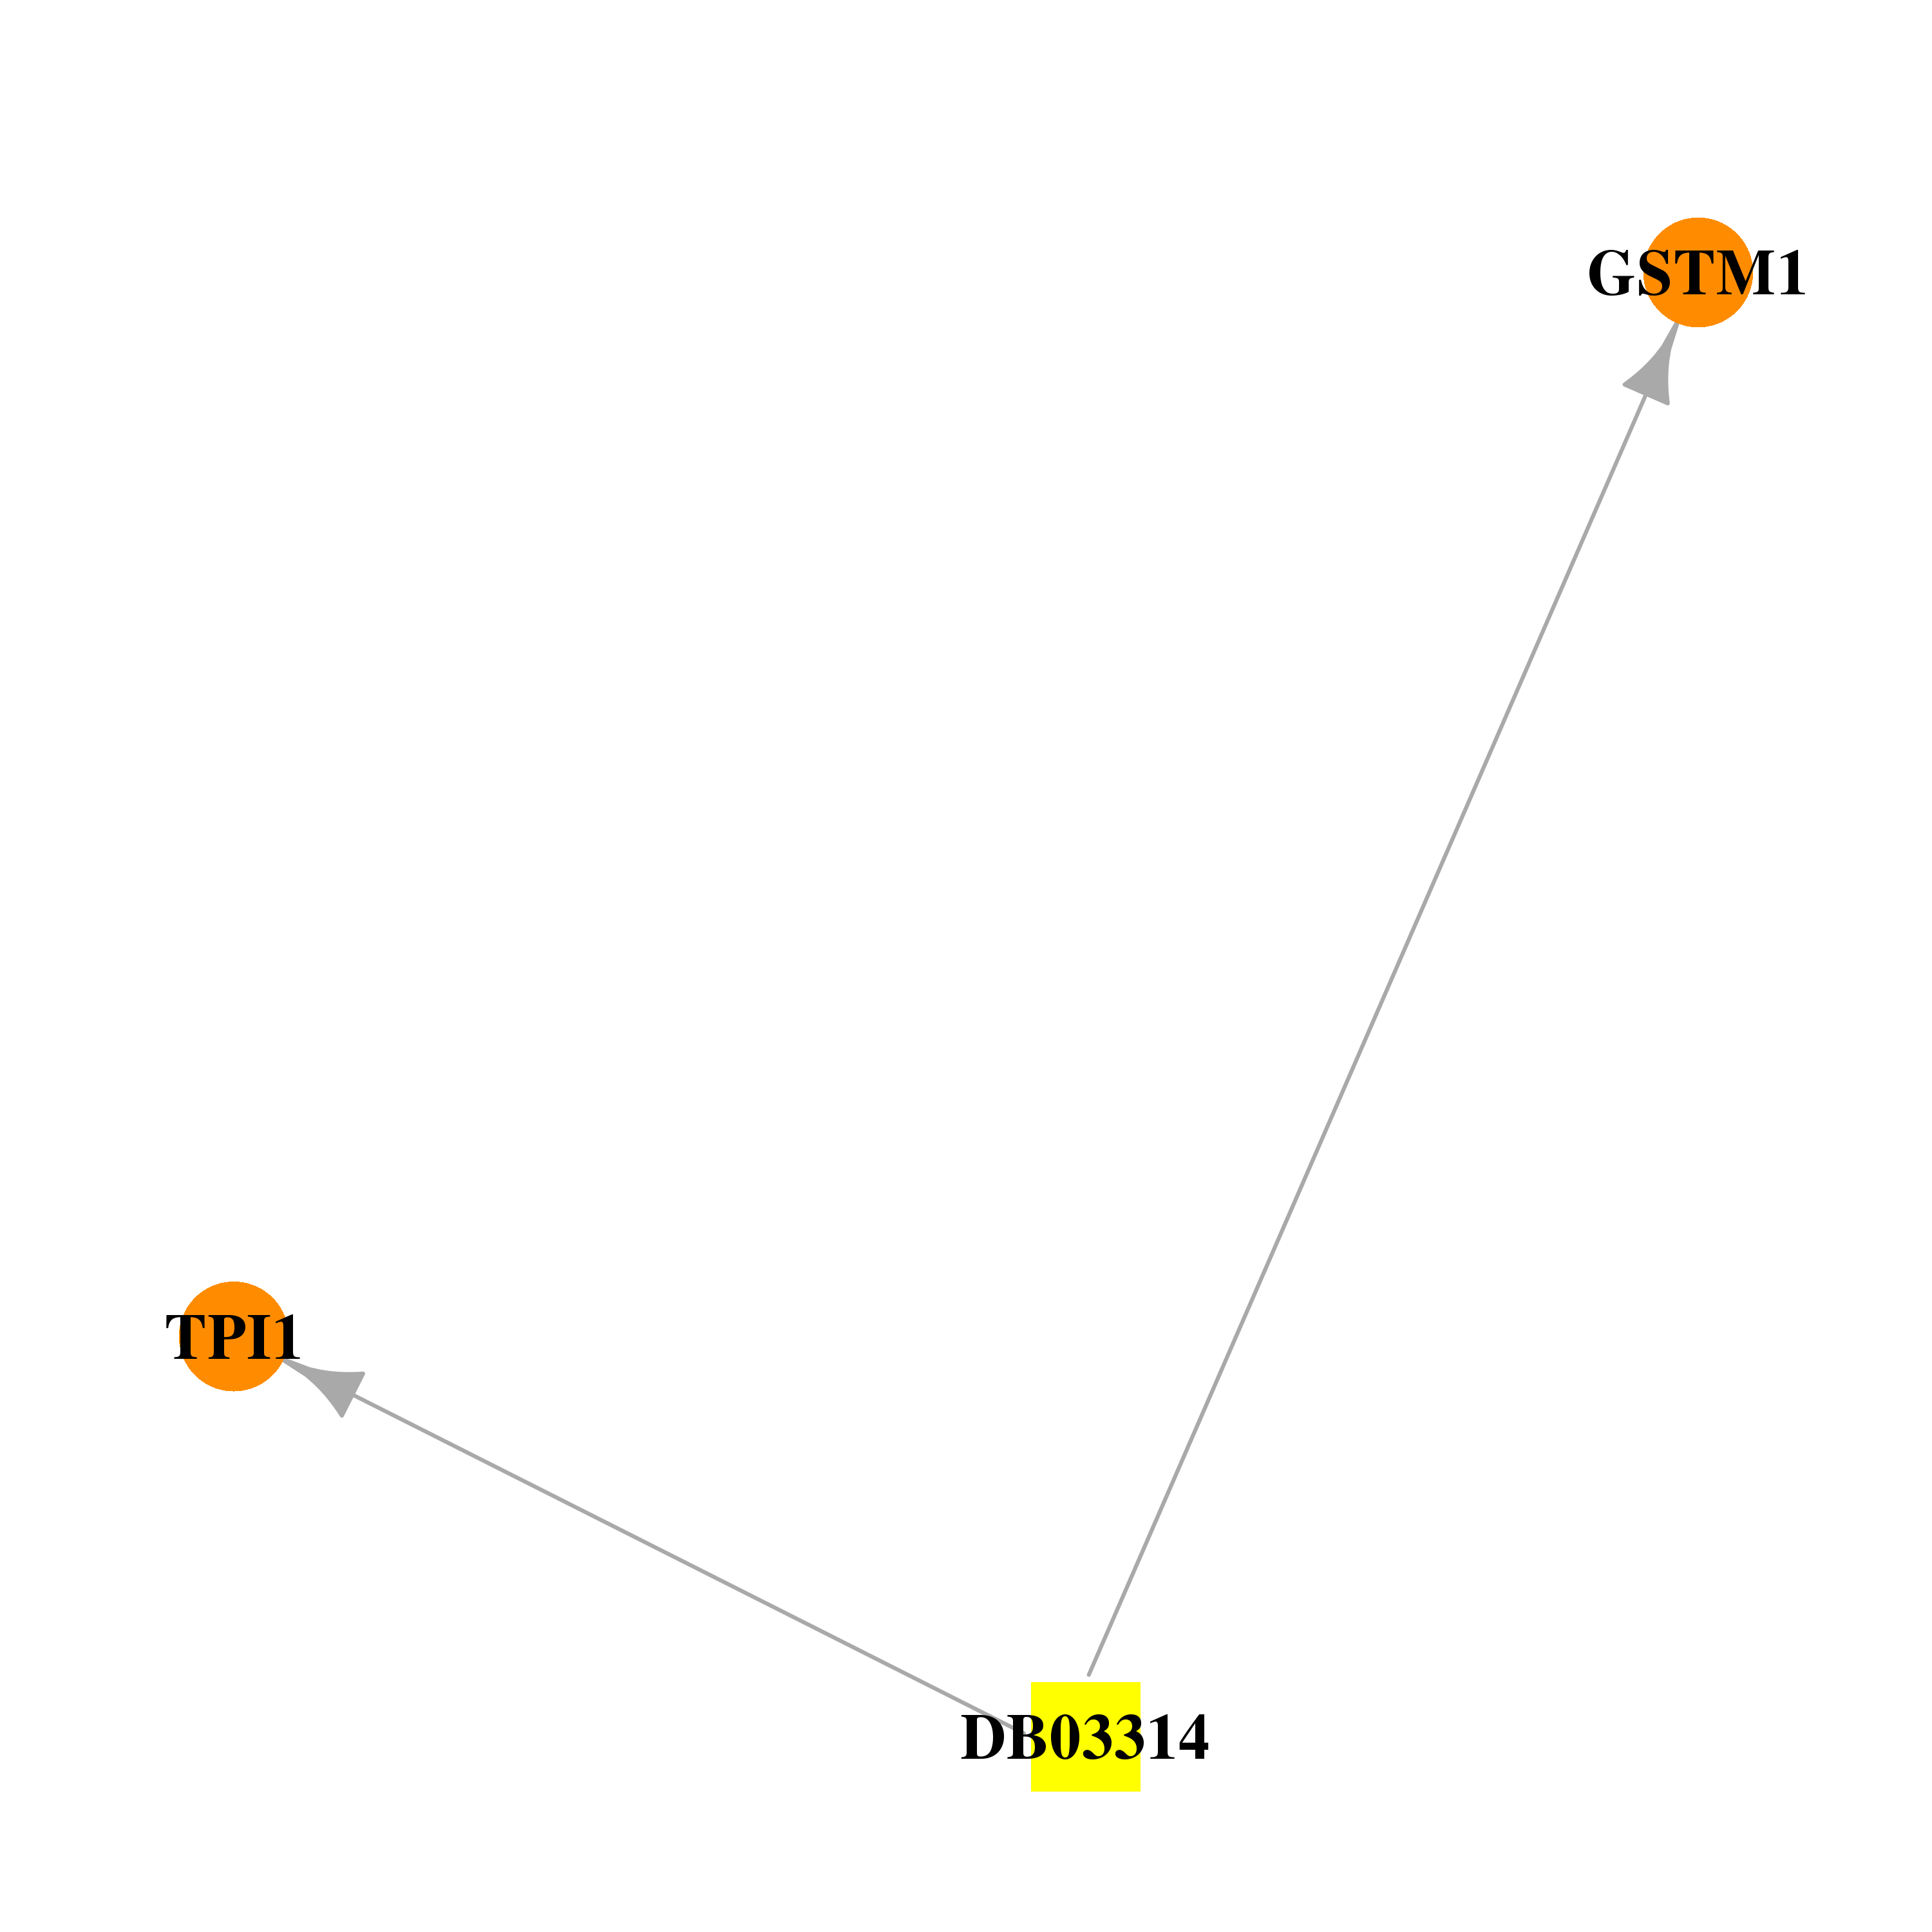 | 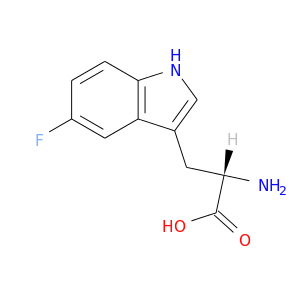 |
| DB03379 | triosephosphate isomerase 1 | experimental | 2-Carboxyethylphosphonic Acid | 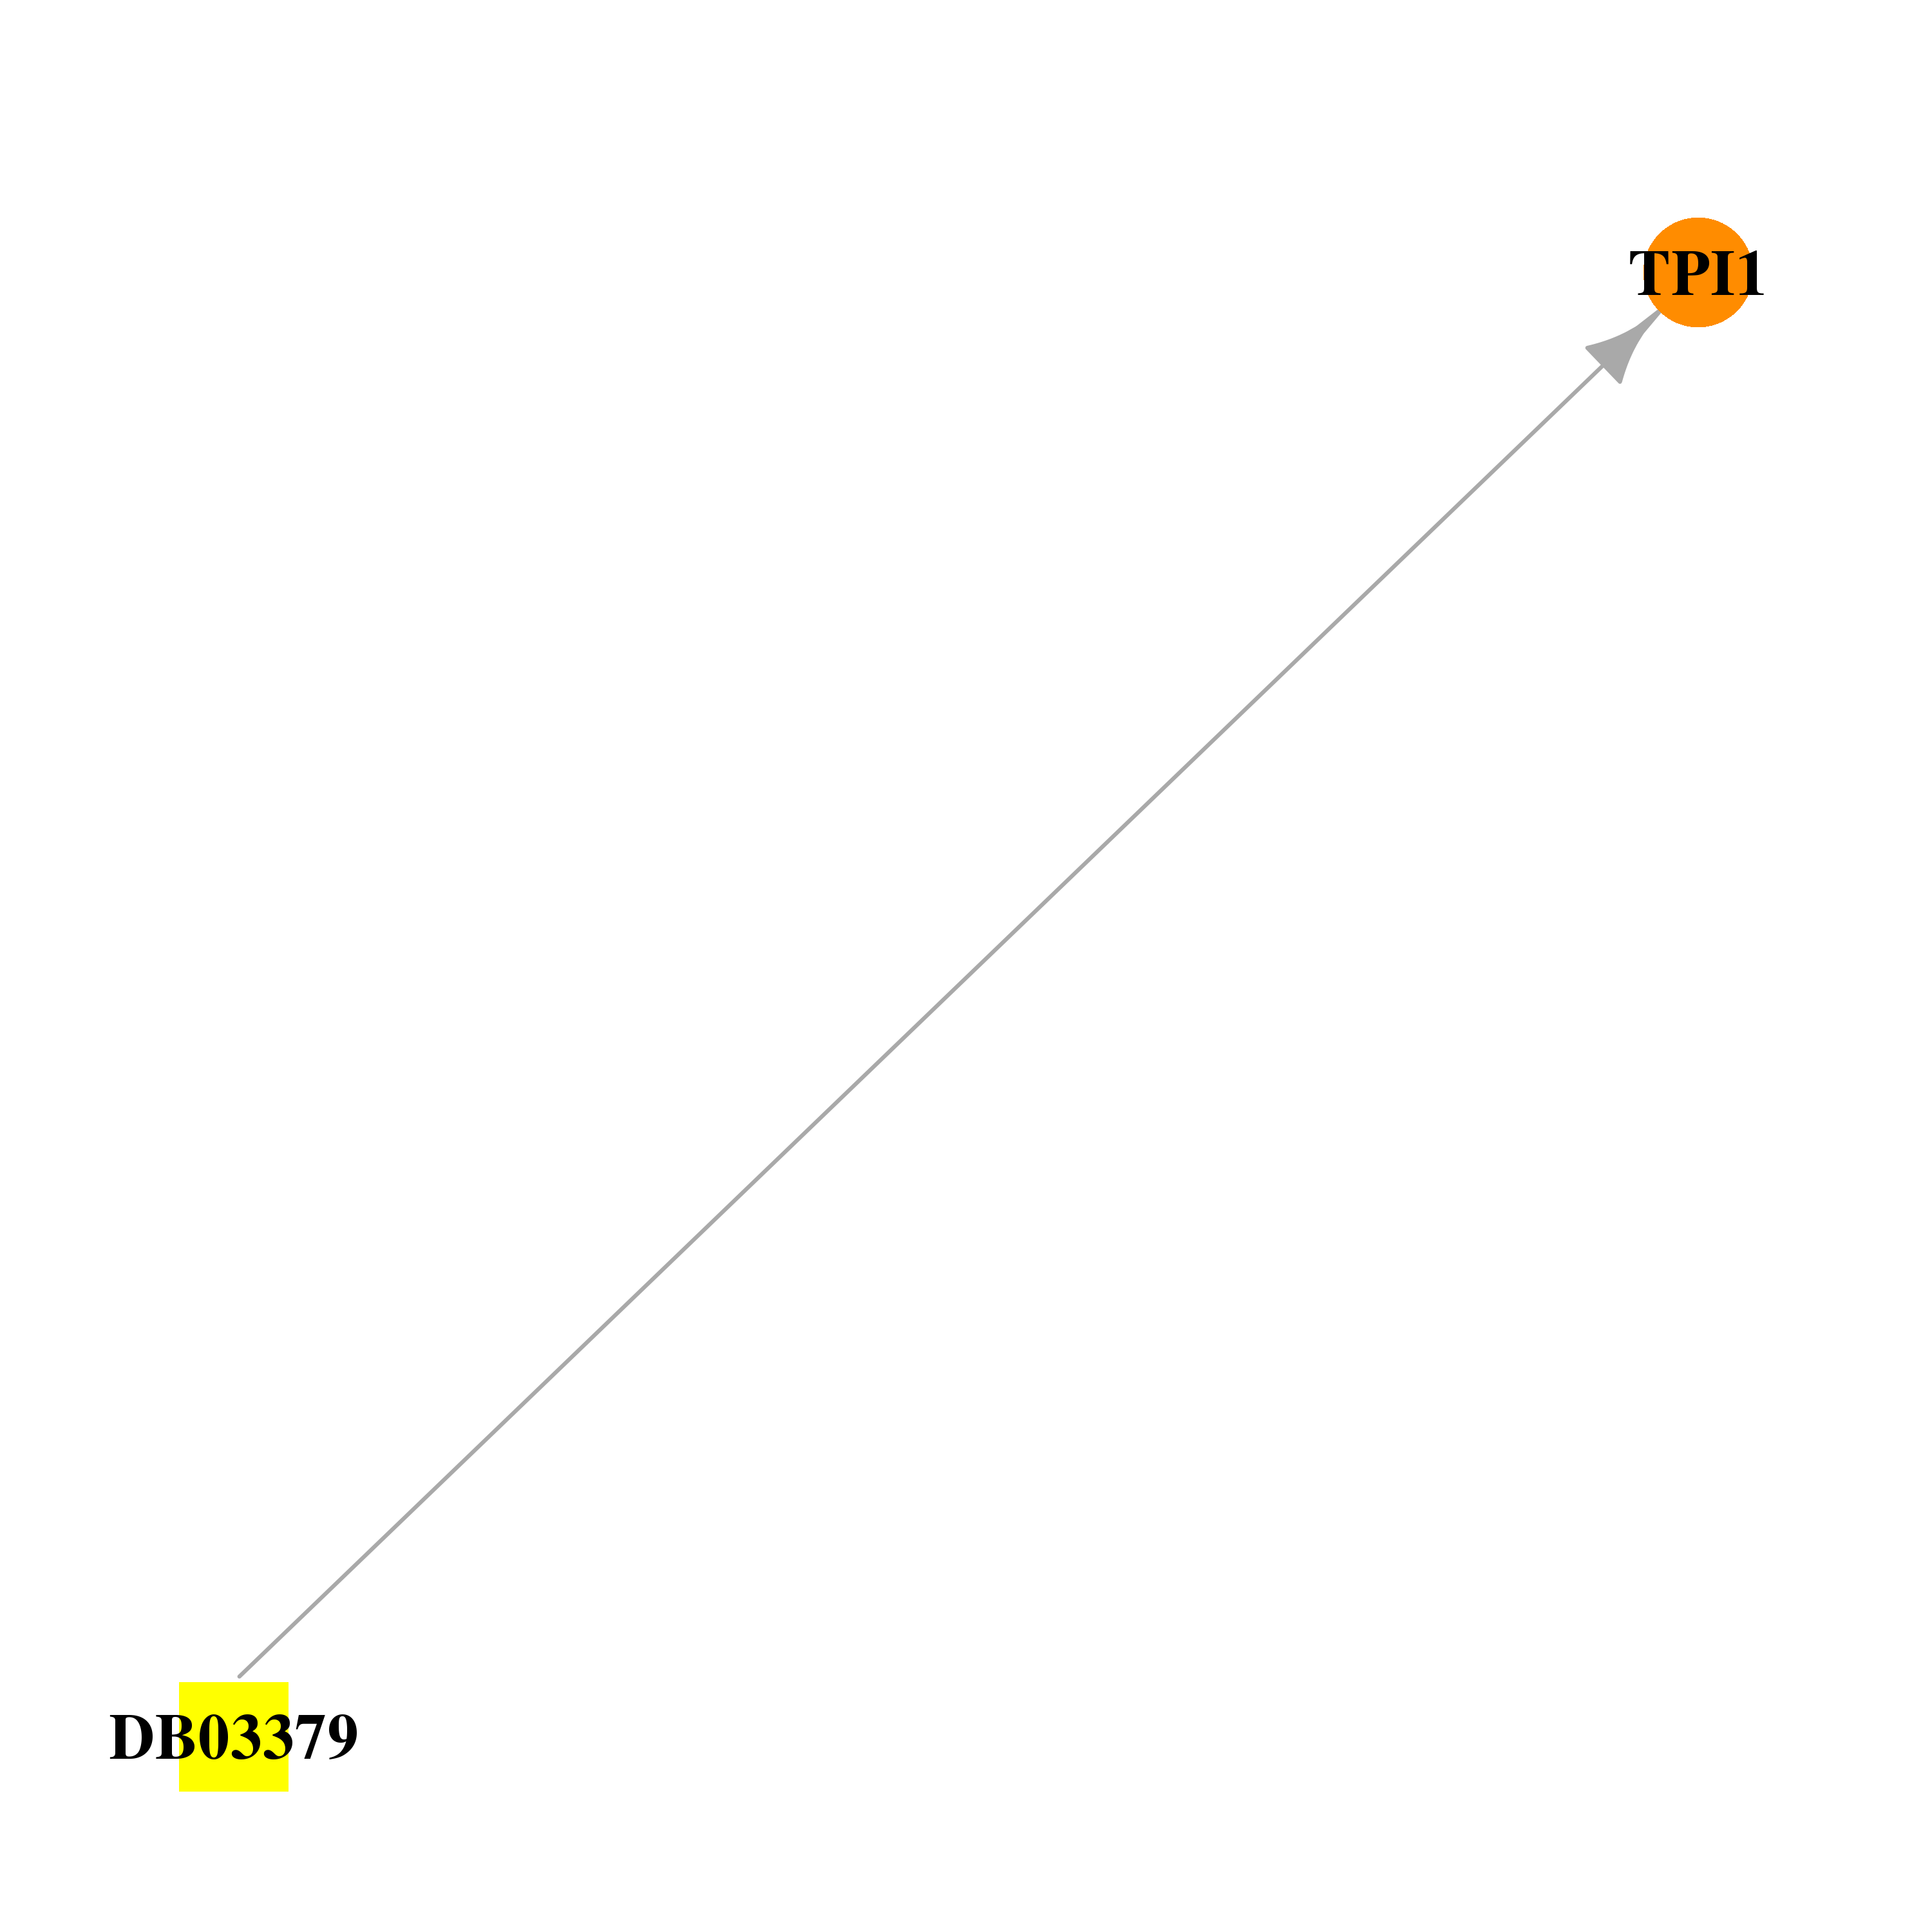 | 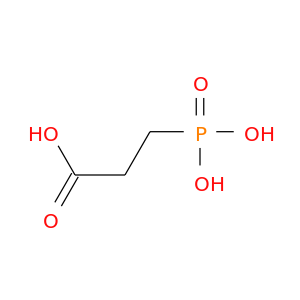 |
| DB03900 | triosephosphate isomerase 1 | experimental | 2-Methyl-2-Propanol | 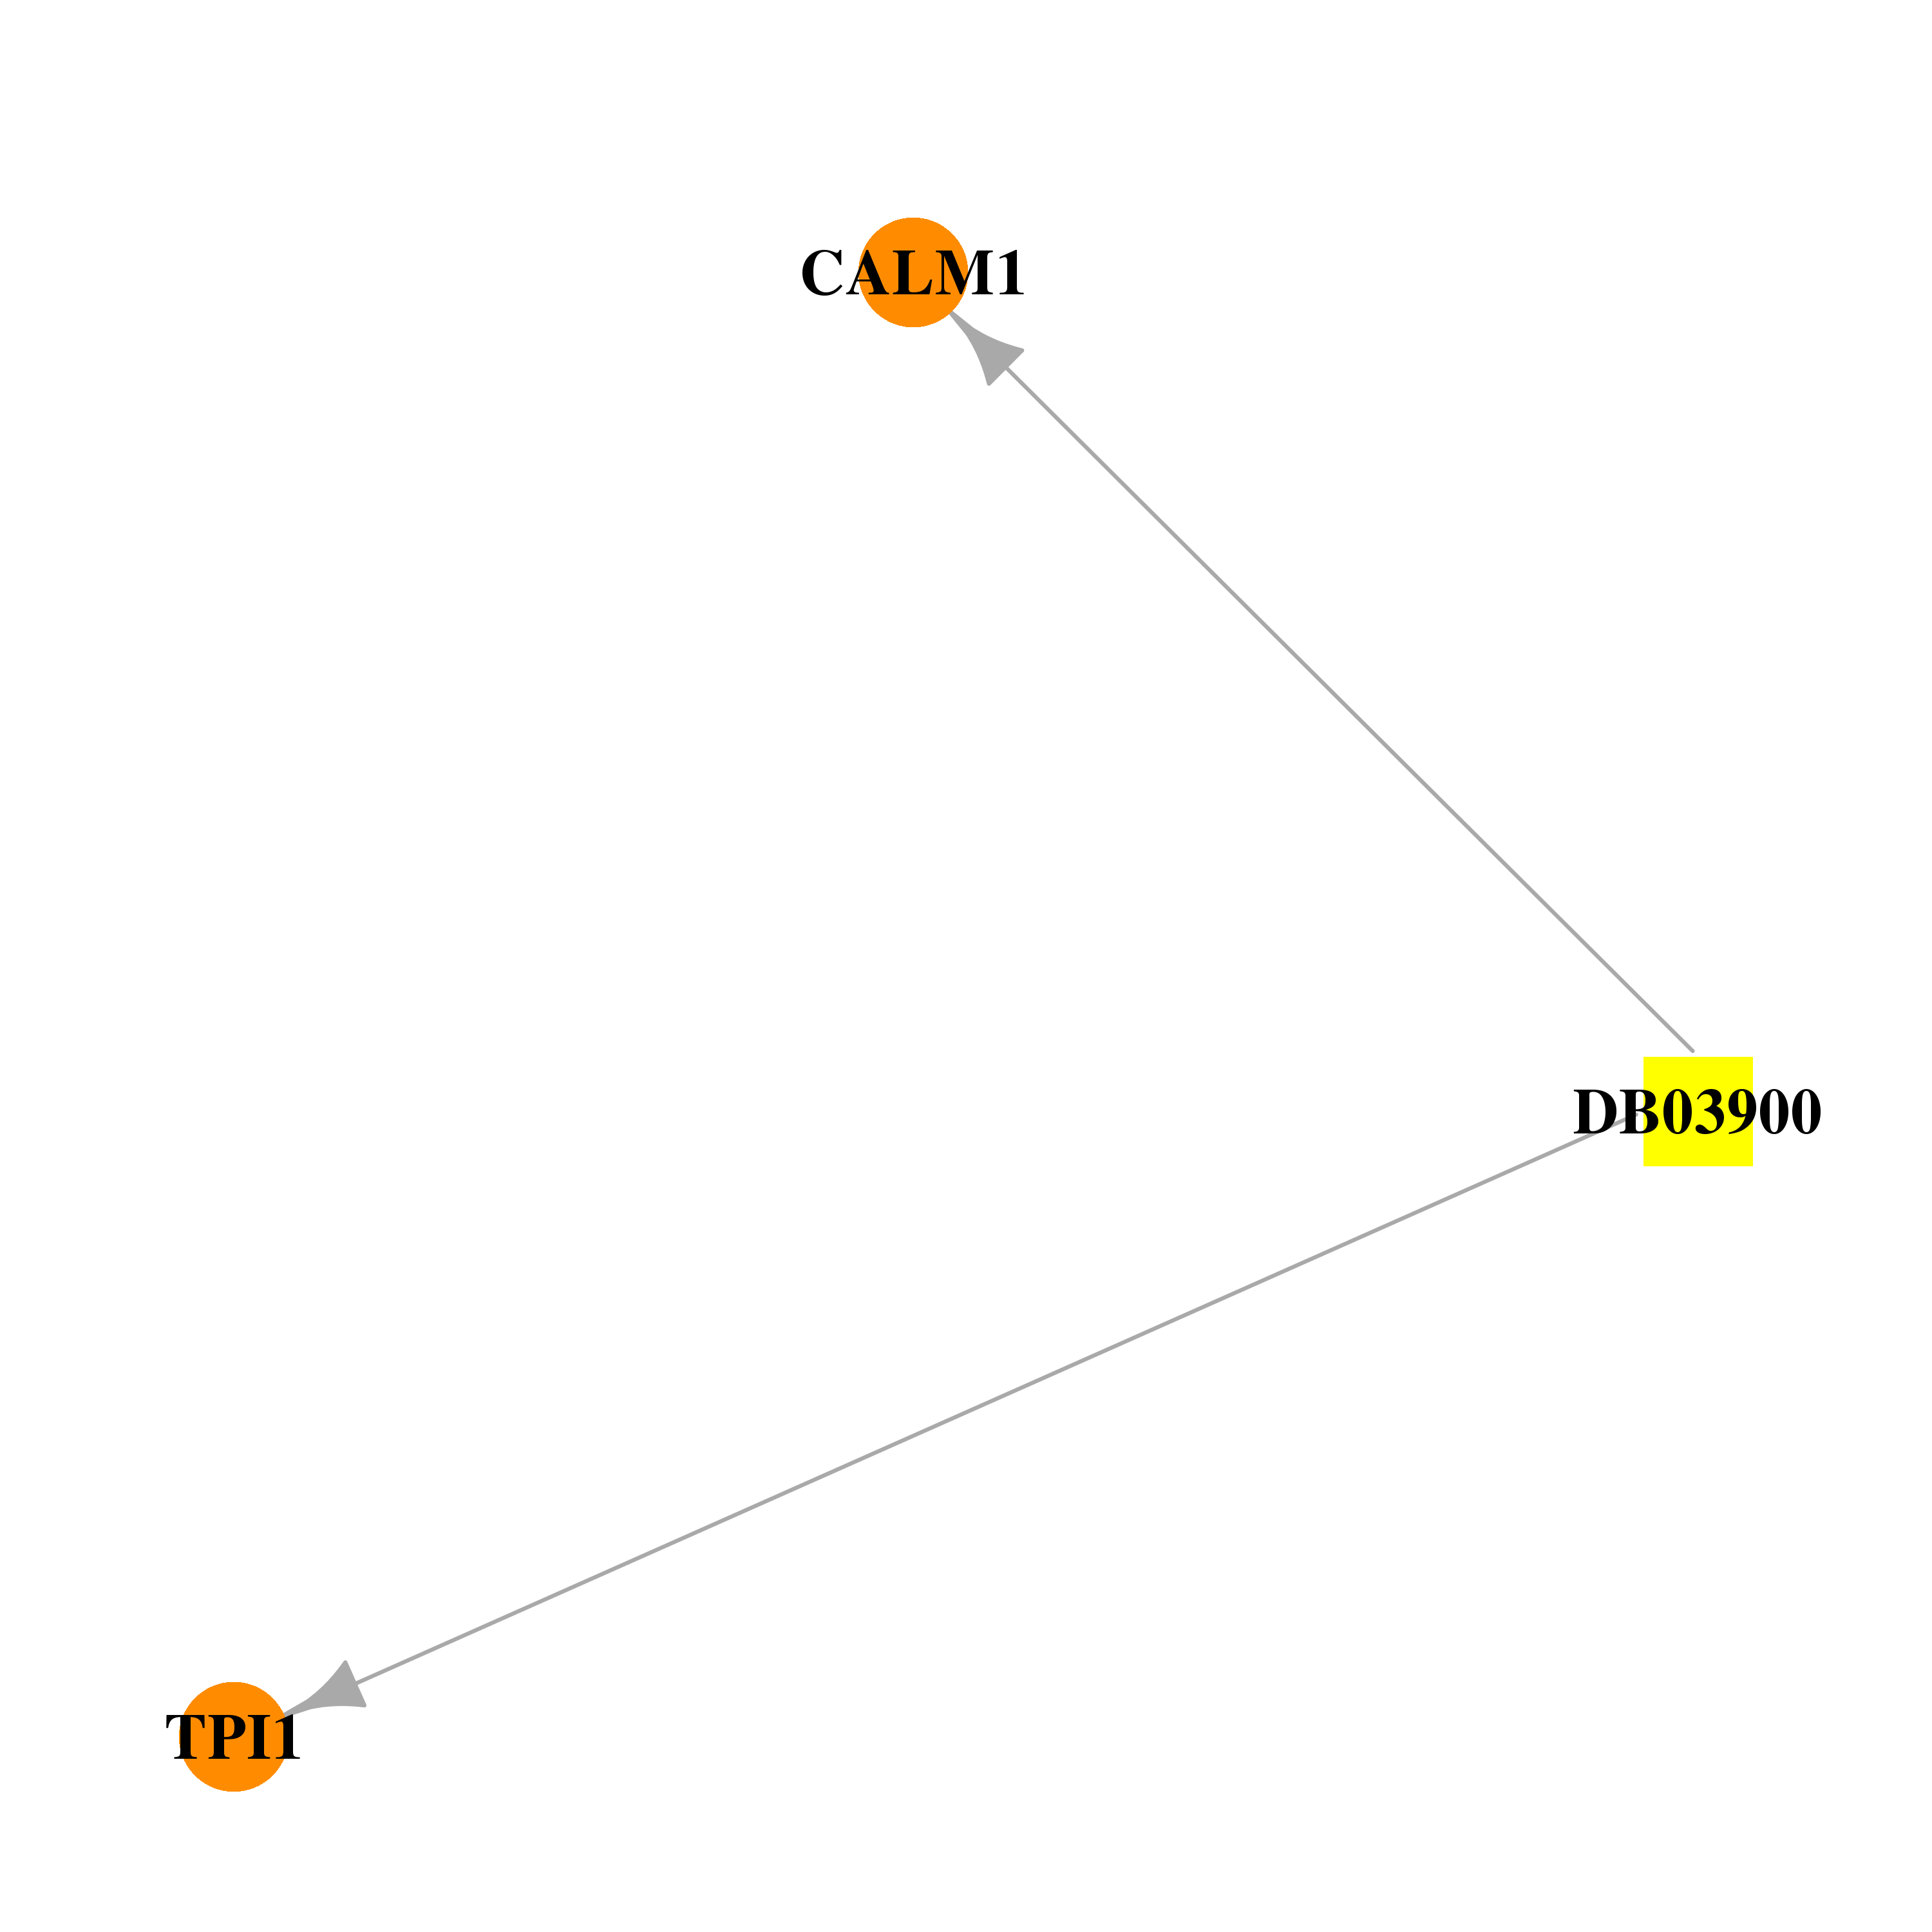 | 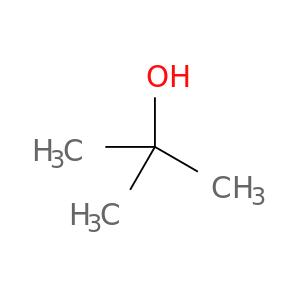 |
| DB04326 | triosephosphate isomerase 1 | experimental | 1,3-Dihydroxyacetonephosphate | 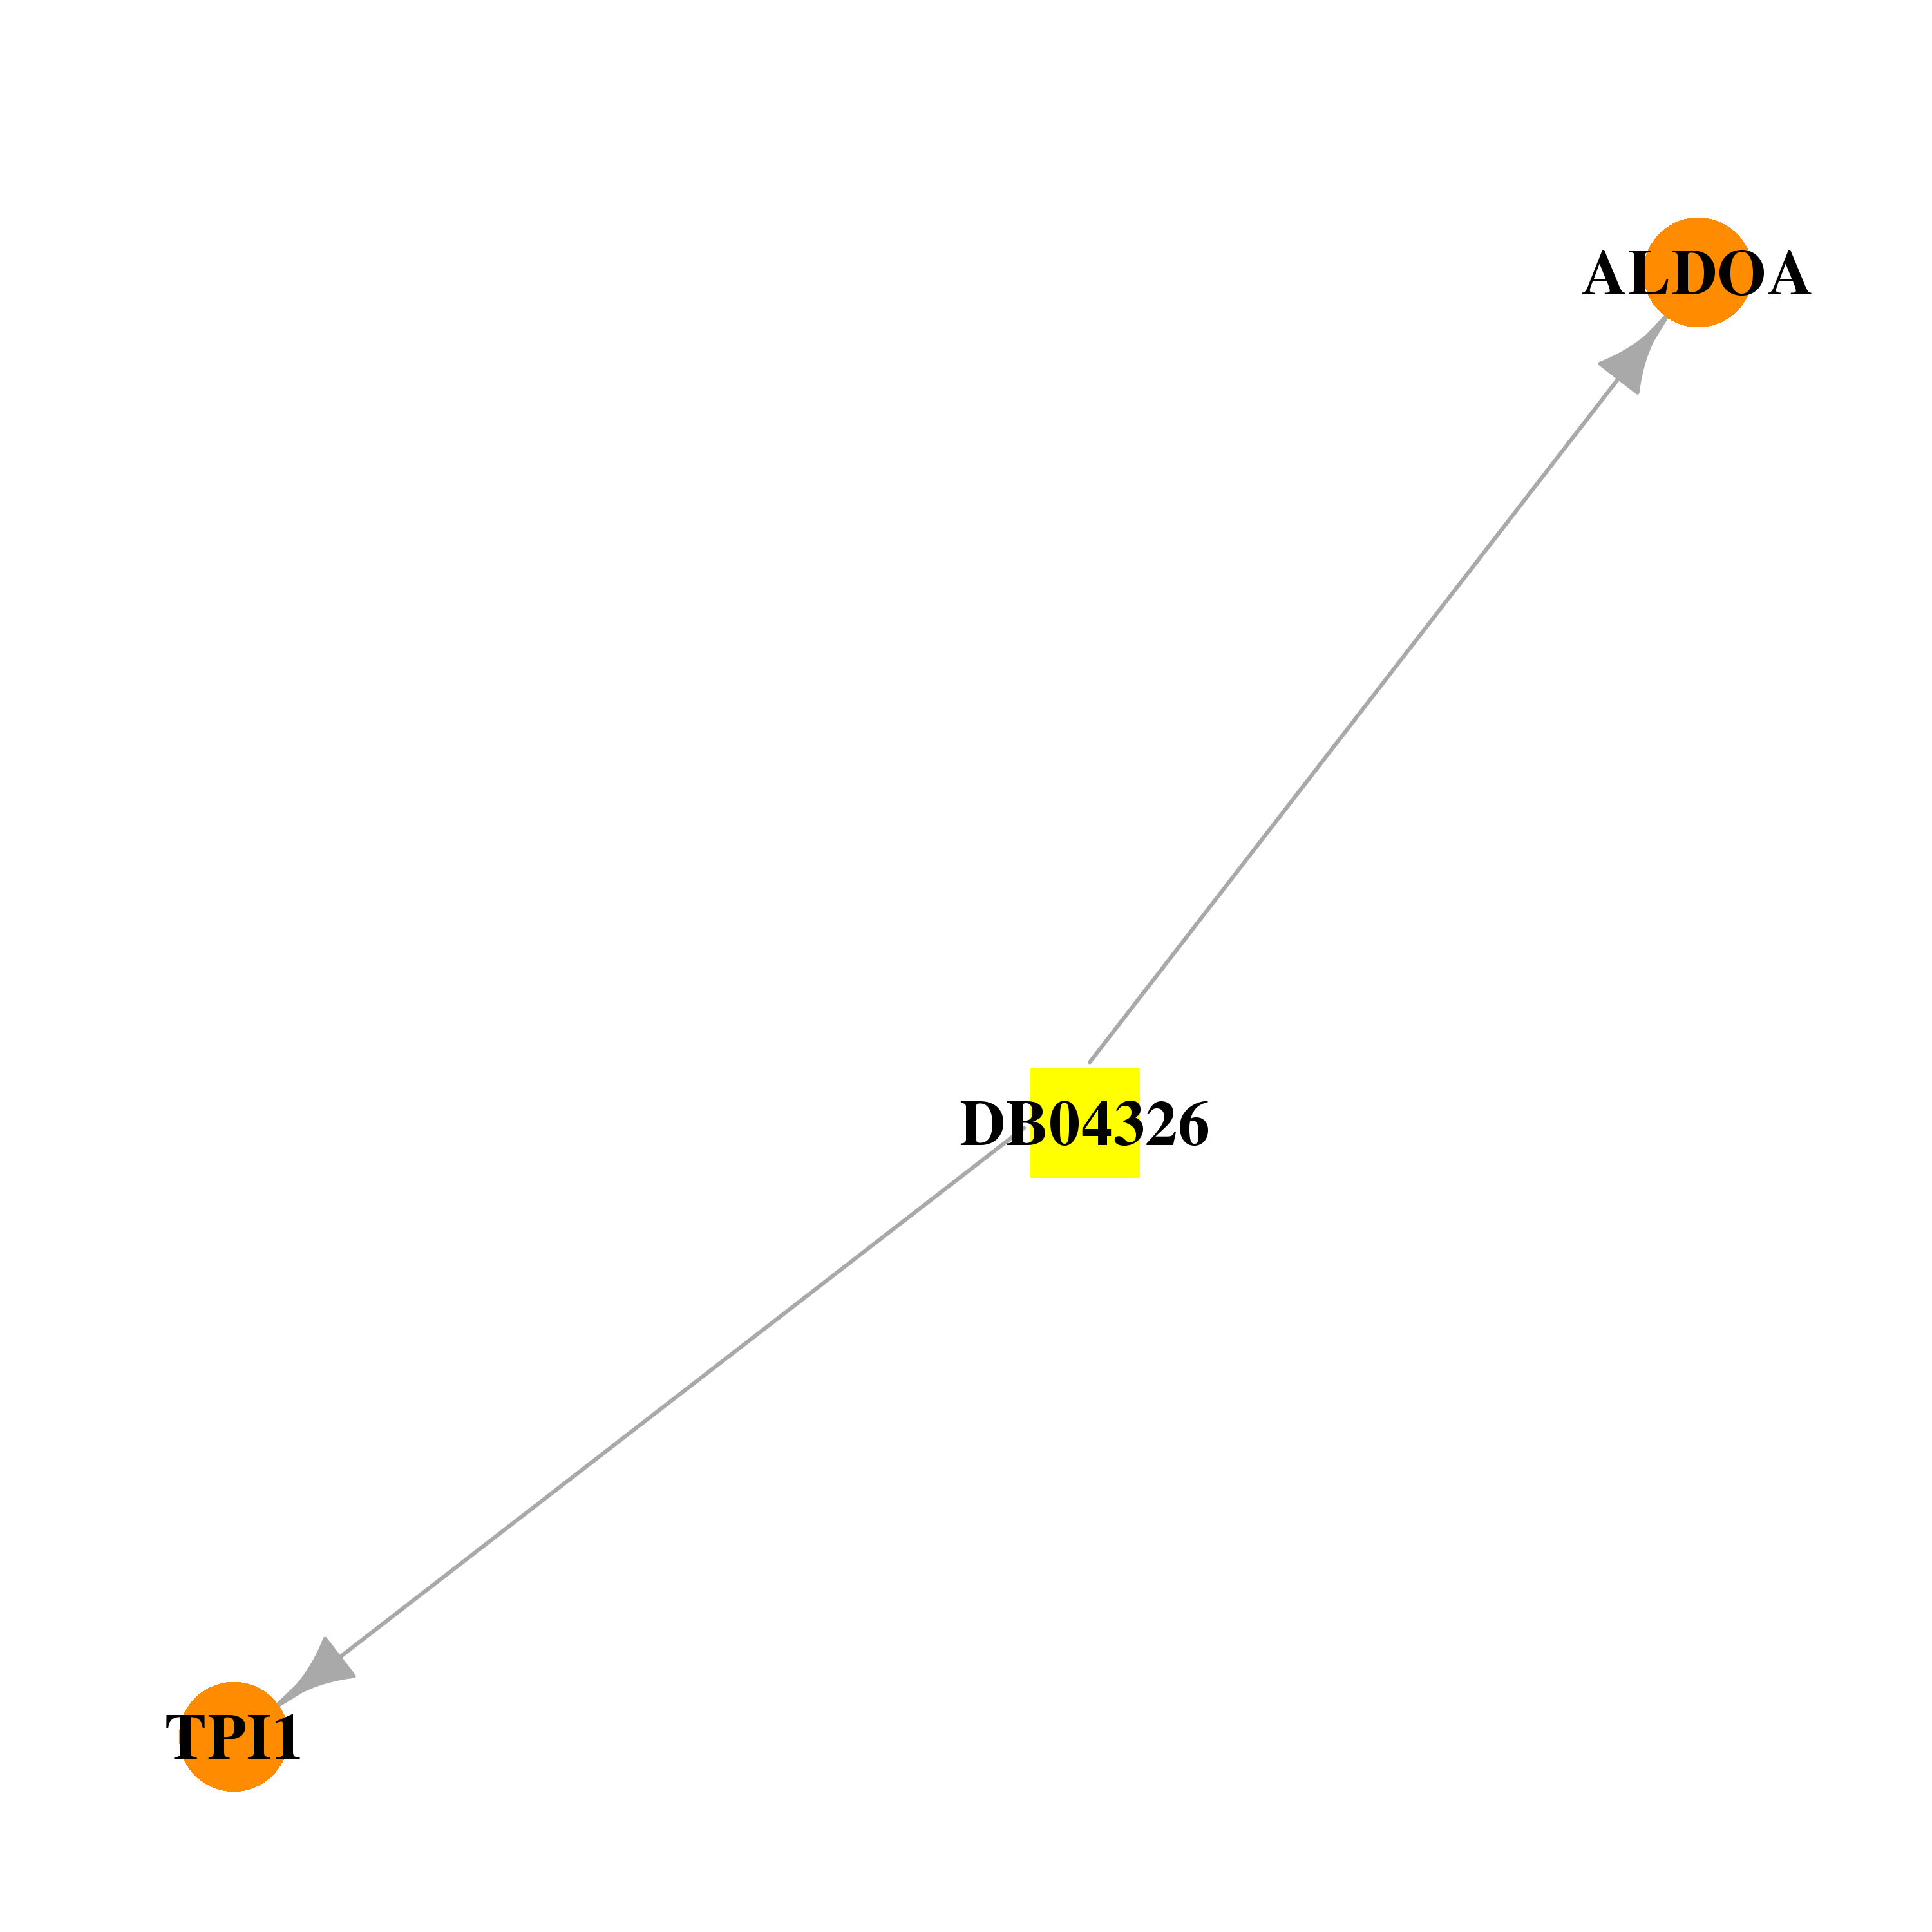 |  |
| DB04447 | triosephosphate isomerase 1 | experimental | 1,4-Dithiothreitol | 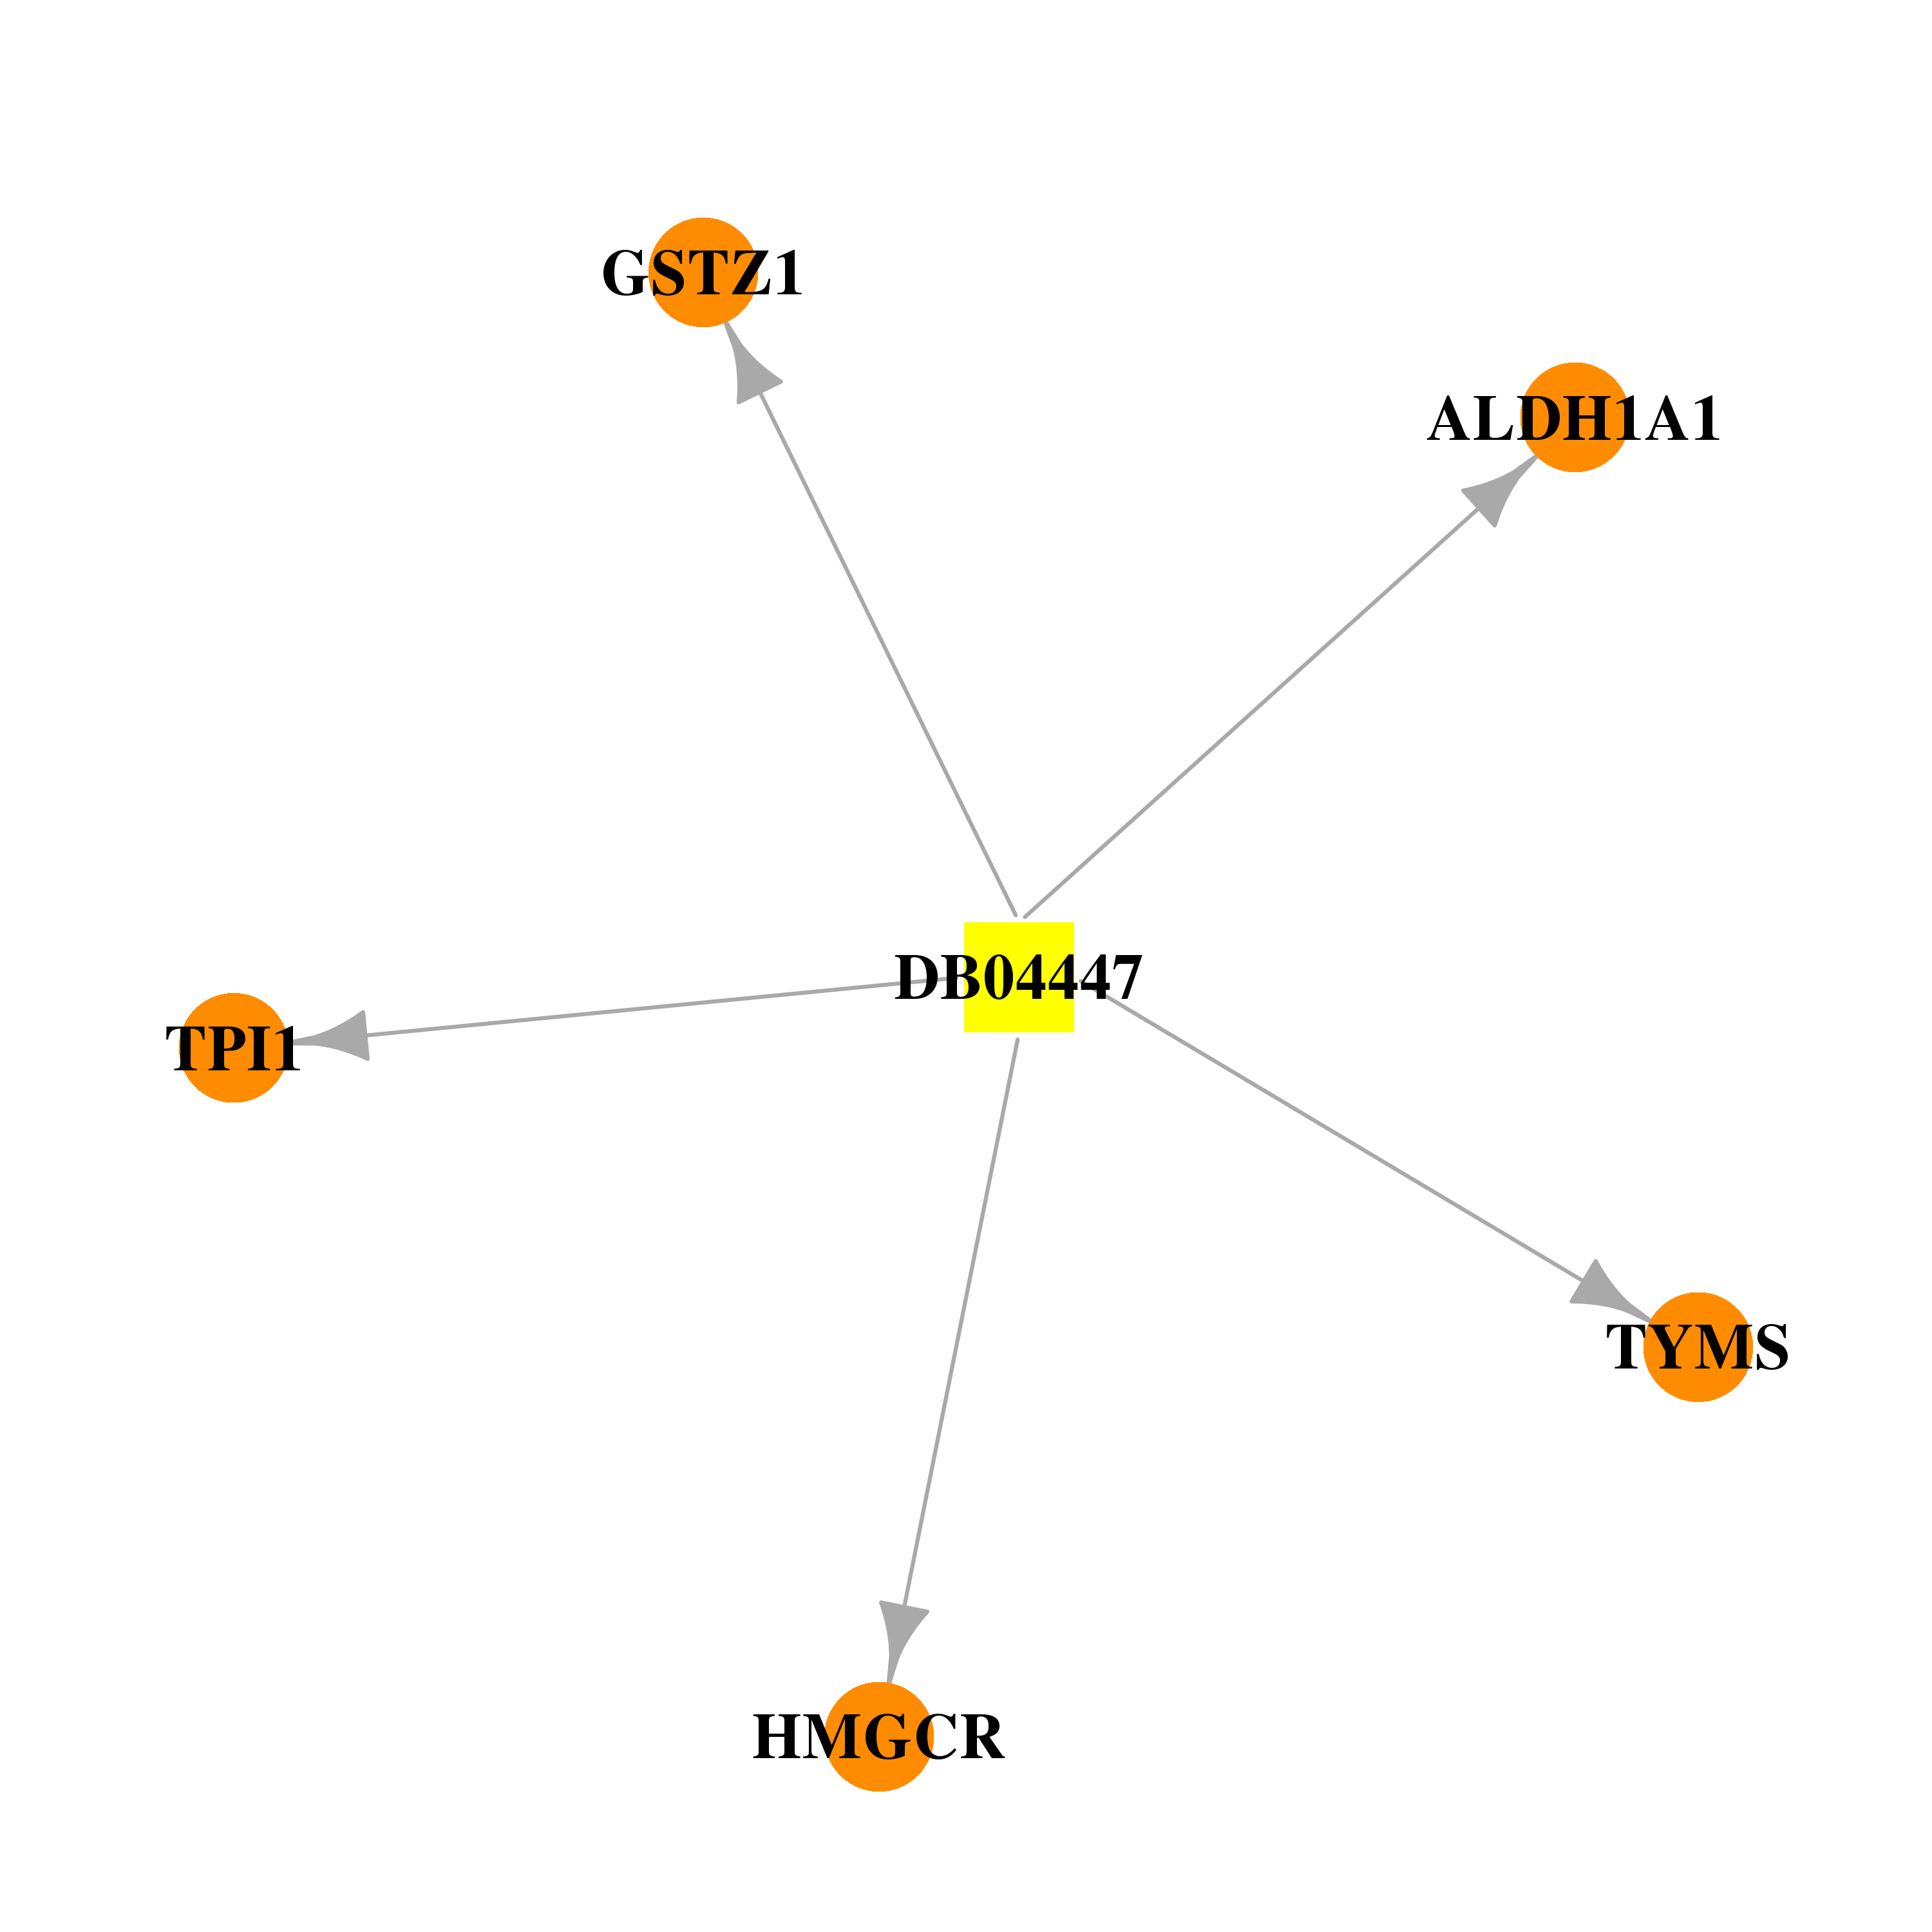 | 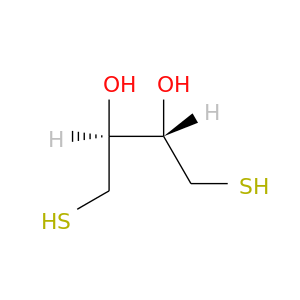 |
| DB07387 | triosephosphate isomerase 1 | experimental | 3-(BUTYLSULPHONYL)-PROPANOIC ACID | 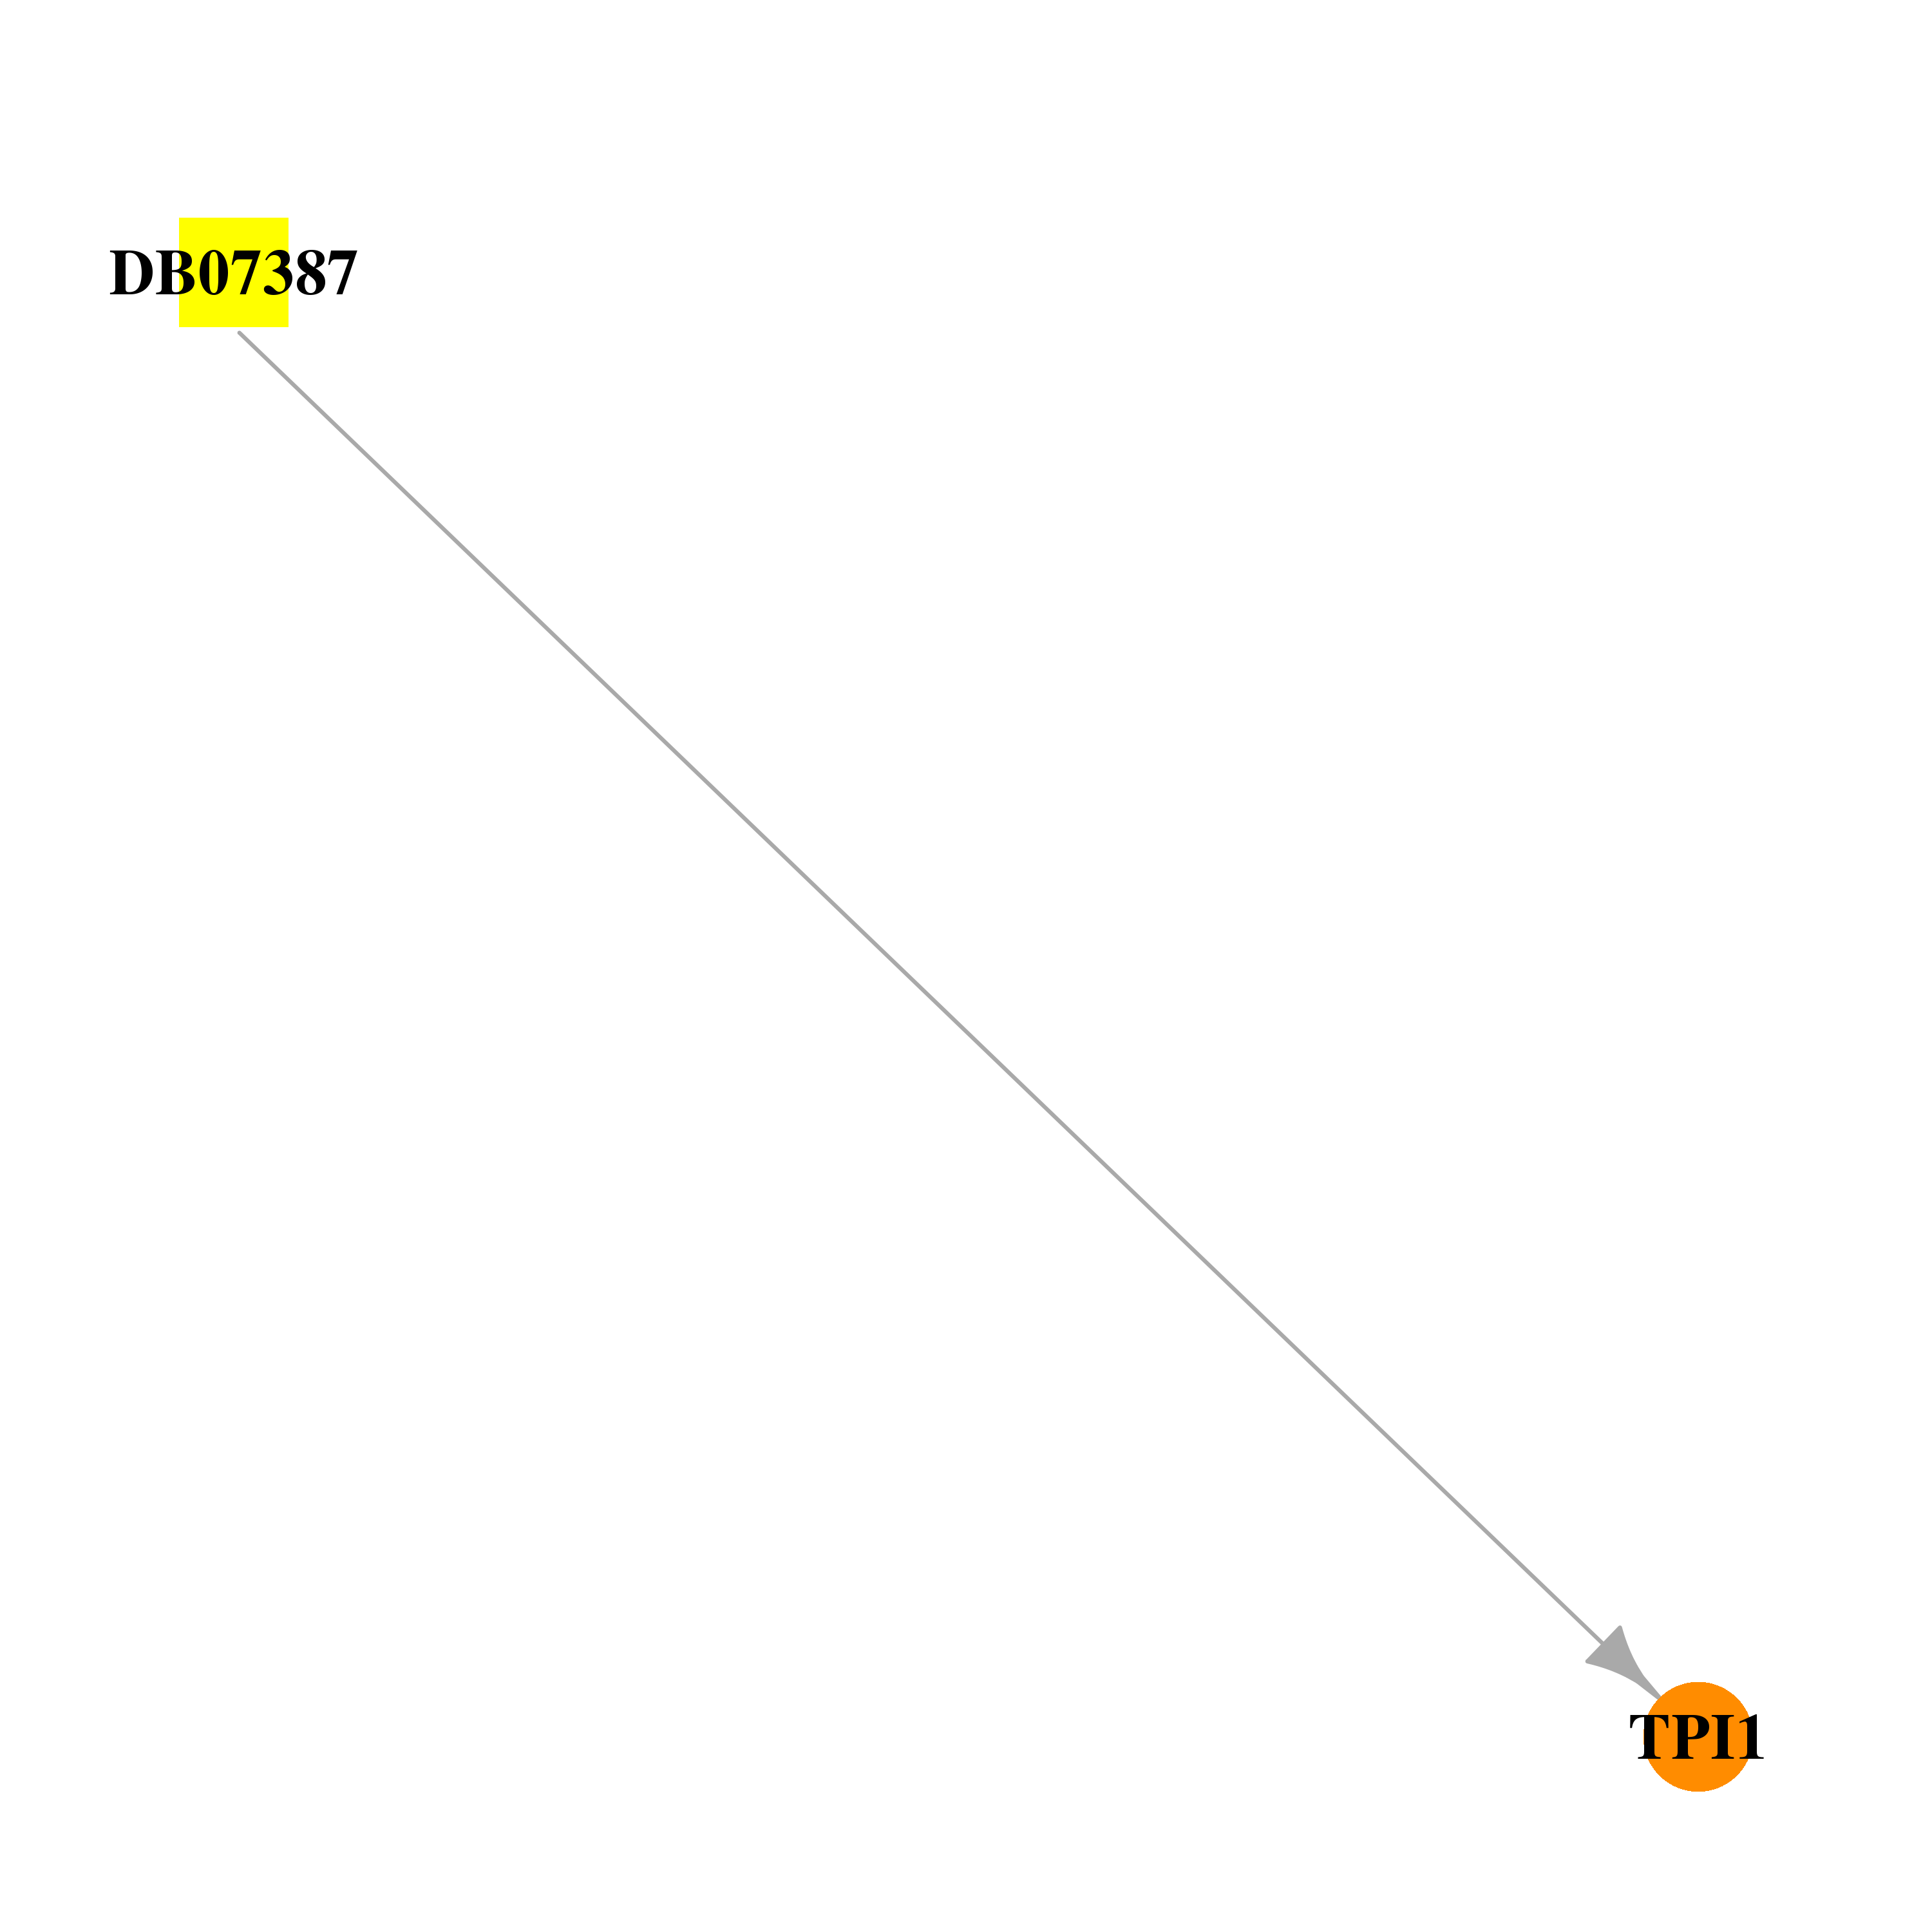 |  |
| DB00121 | triosephosphate isomerase 1 | approved; nutraceutical | Biotin | 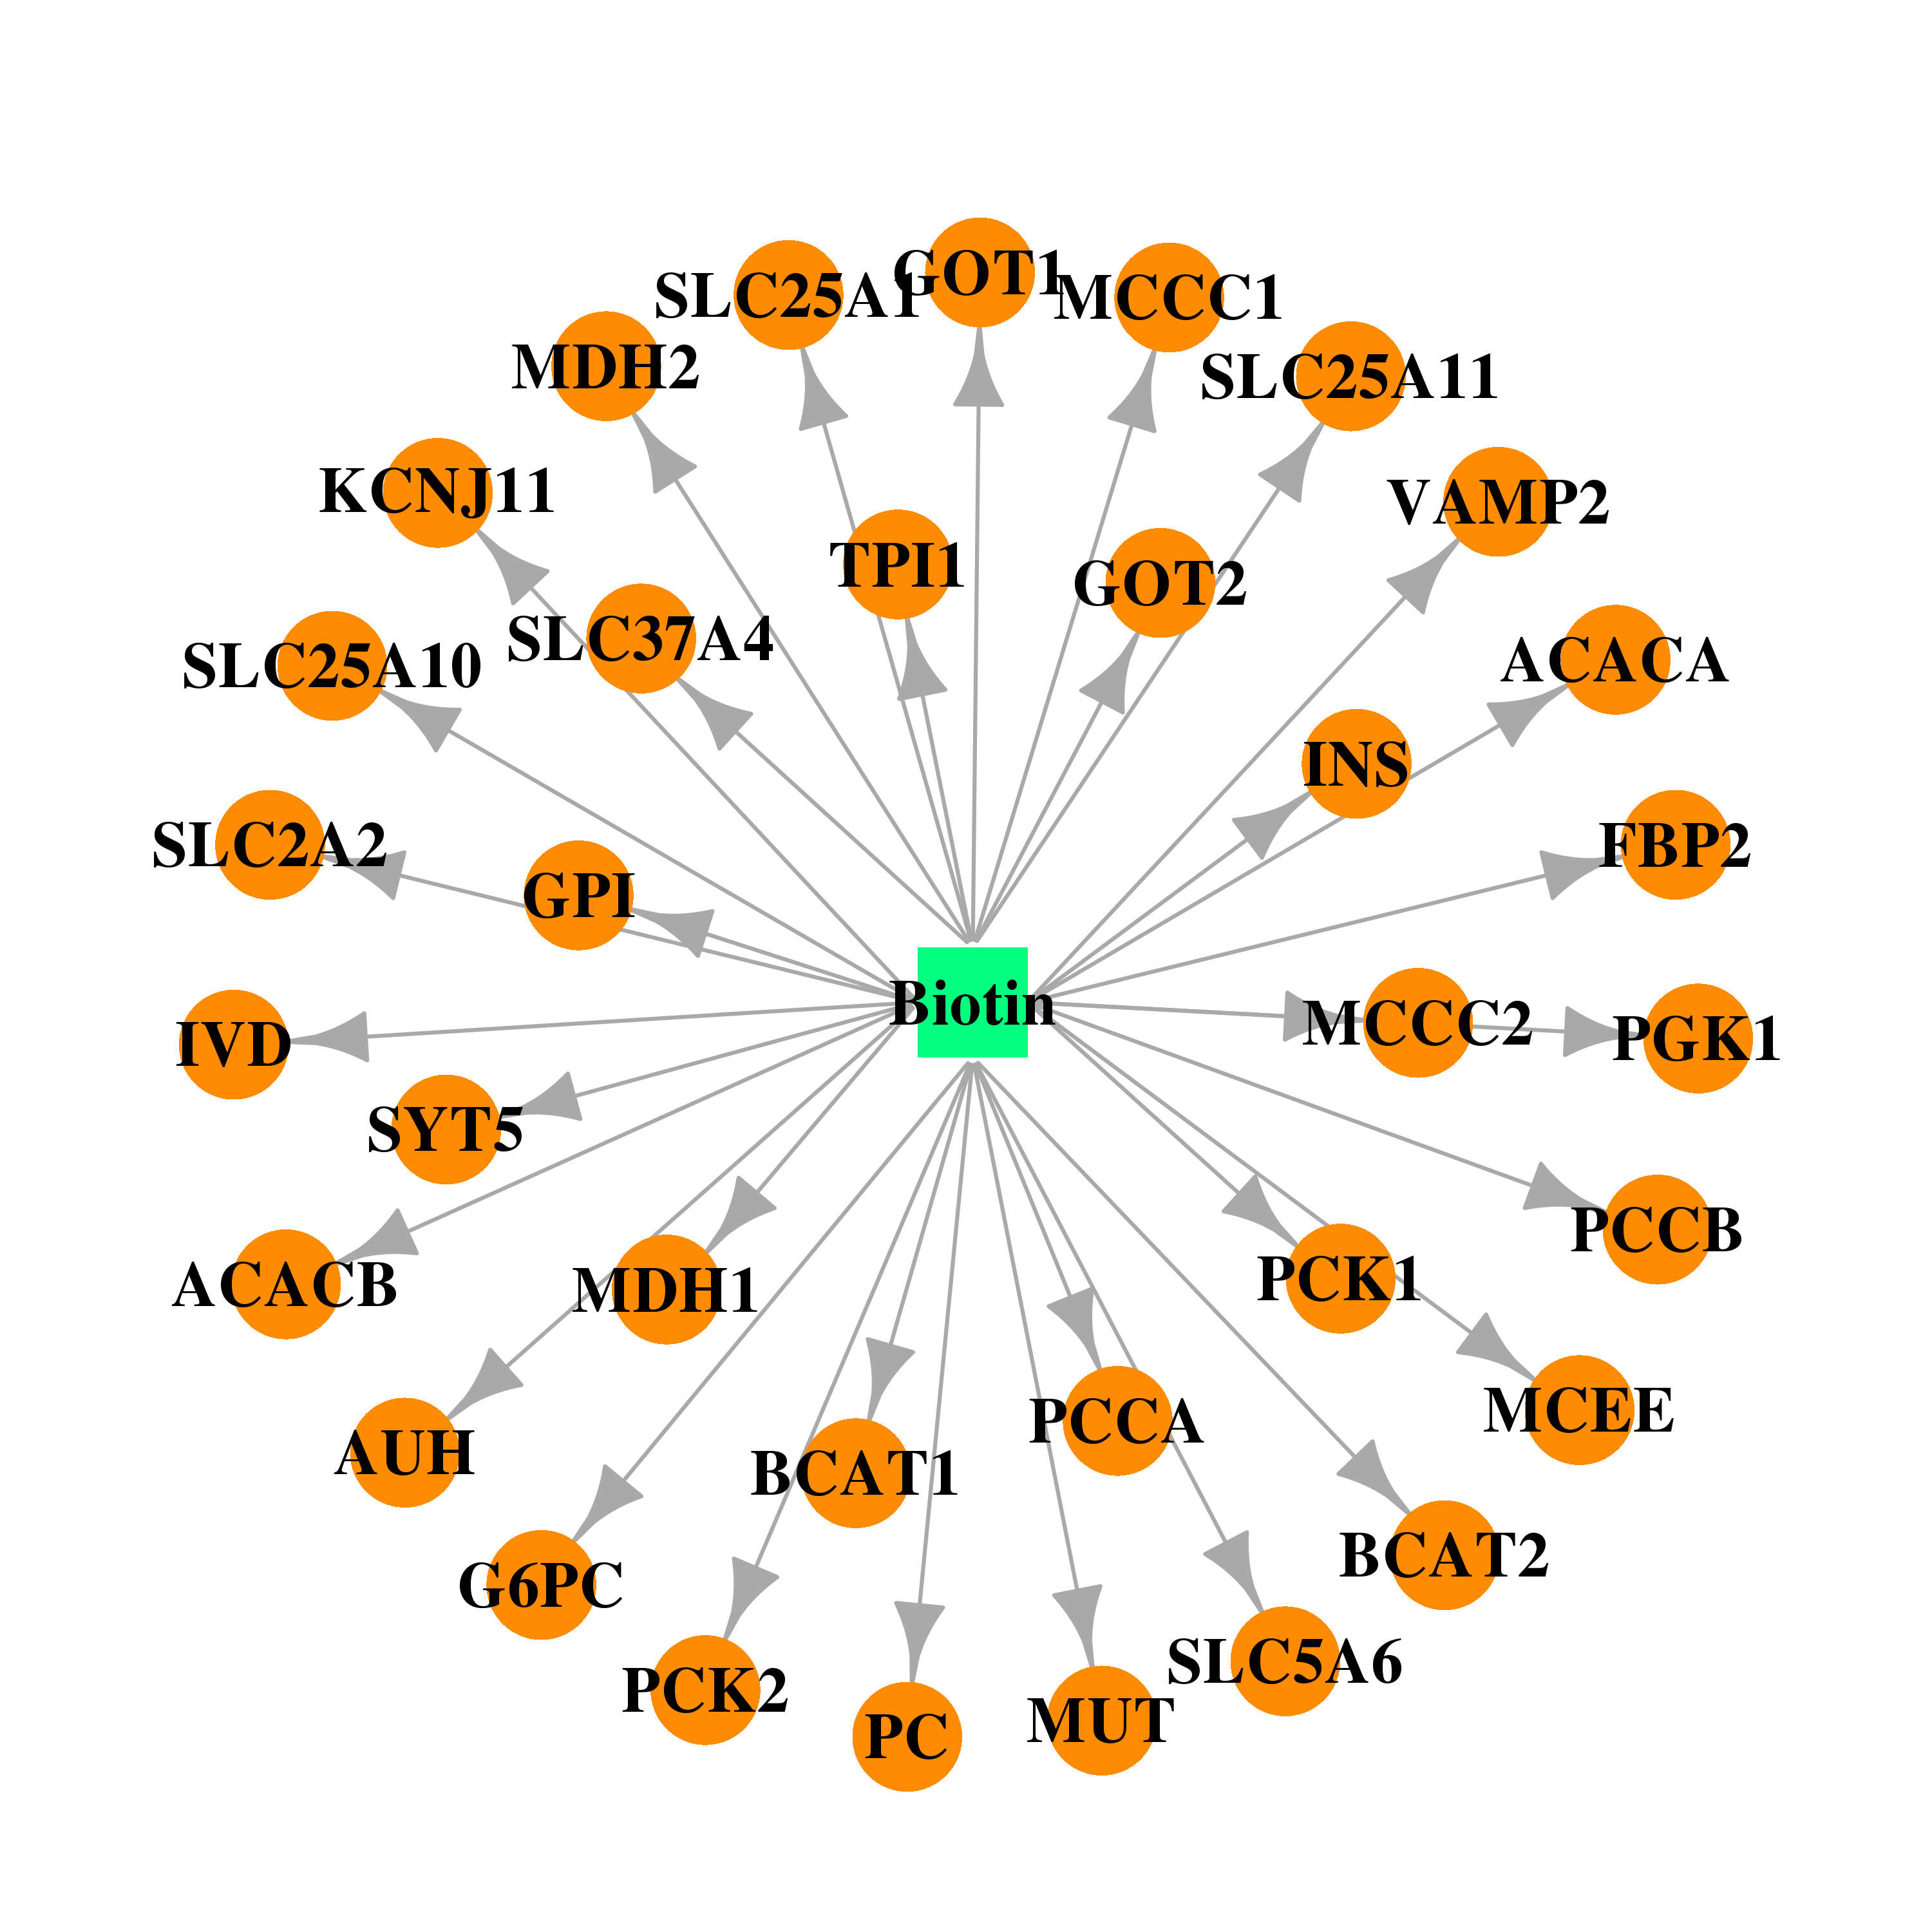 | 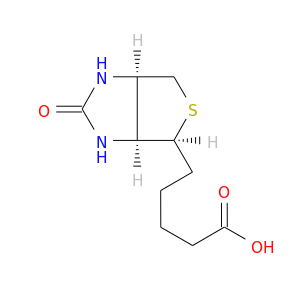 |
| Top |
| Cross referenced IDs for TPI1 |
| * We obtained these cross-references from Uniprot database. It covers 150 different DBs, 18 categories. http://www.uniprot.org/help/cross_references_section |
: Open all cross reference information
|
Copyright © 2016-Present - The Univsersity of Texas Health Science Center at Houston @ |