|
||||||||||||||||||||||||||||||||||||||||||||||||||||||||||||||||||||||||||||||||||||||||||||||||||||||||||||||||||||||||||||||||||||||||||||||||||||||||||||||||||||||||||||||||||||||||||||||||||||||||||||||||||||||||||||||||||||||||||||||||||||||||||||||||||||||||||||||||||||||||||||||||||||||||||||||||||||||||||
| |
| Phenotypic Information (metabolism pathway, cancer, disease, phenome) |
| |
| |
| Gene-Gene Network Information: Co-Expression Network, Interacting Genes & KEGG |
| |
|


| Gene Summary for CCT3 |
| Top |
| Phenotypic Information for CCT3(metabolism pathway, cancer, disease, phenome) |
| Cancer | CGAP: CCT3 |
| Familial Cancer Database: CCT3 | |
| * This gene is included in those cancer gene databases. |
|
|
|
|
|
| . | ||||||||||||||||||||||||||||||||||||||||||||||||||||||||||||||||||||||||||||||||||||||||||||||||||||||||||||||||||||||||||||||||||||||||||||||||||||||||||||||||||||||||||||||||||||||||||||||||||||||||||||||||||||||||||||||||||||||||||||||||||||||||||||||||||||||||||||||||||||||||||||||||||||||||||||||||||||
Oncogene 1 | Significant driver gene in | |||||||||||||||||||||||||||||||||||||||||||||||||||||||||||||||||||||||||||||||||||||||||||||||||||||||||||||||||||||||||||||||||||||||||||||||||||||||||||||||||||||||||||||||||||||||||||||||||||||||||||||||||||||||||||||||||||||||||||||||||||||||||||||||||||||||||||||||||||||||||||||||||||||||||||||||||||||||||
| cf) number; DB name 1 Oncogene; http://nar.oxfordjournals.org/content/35/suppl_1/D721.long, 2 Tumor Suppressor gene; https://bioinfo.uth.edu/TSGene/, 3 Cancer Gene Census; http://www.nature.com/nrc/journal/v4/n3/abs/nrc1299.html, 4 CancerGenes; http://nar.oxfordjournals.org/content/35/suppl_1/D721.long, 5 Network of Cancer Gene; http://ncg.kcl.ac.uk/index.php, 1Therapeutic Vulnerabilities in Cancer; http://cbio.mskcc.org/cancergenomics/statius/ |
| REACTOME_METABOLISM_OF_PROTEINS | |
| OMIM | |
| Orphanet | |
| Disease | KEGG Disease: CCT3 |
| MedGen: CCT3 (Human Medical Genetics with Condition) | |
| ClinVar: CCT3 | |
| Phenotype | MGI: CCT3 (International Mouse Phenotyping Consortium) |
| PhenomicDB: CCT3 | |
| Mutations for CCT3 |
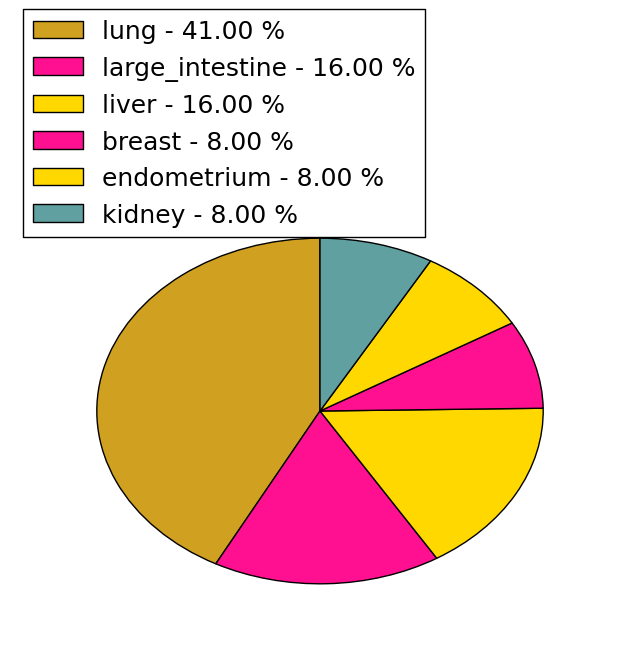
| * Under tables are showing count per each tissue to give us broad intuition about tissue specific mutation patterns.You can go to the detailed page for each mutation database's web site. |
| - Statistics for Tissue and Mutation type | Top |
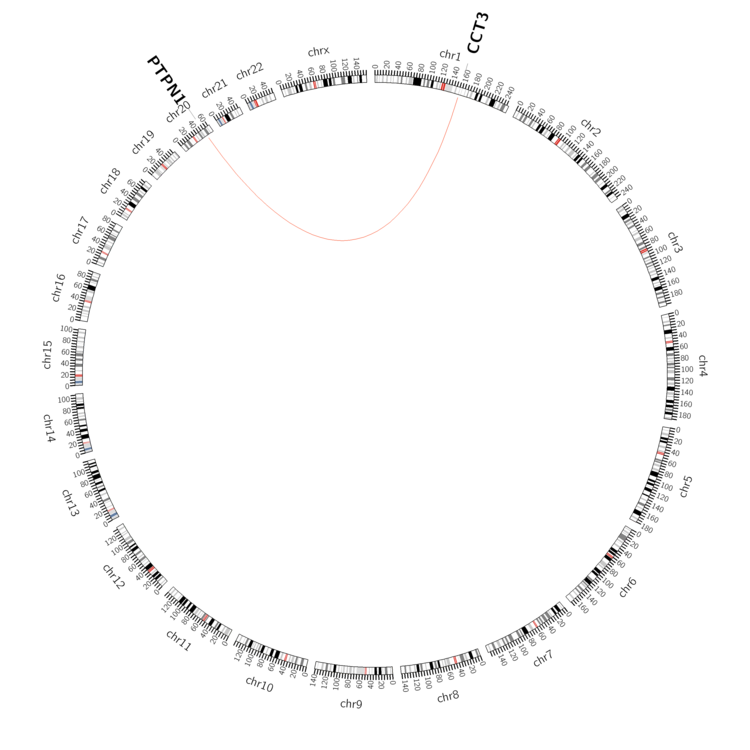 |
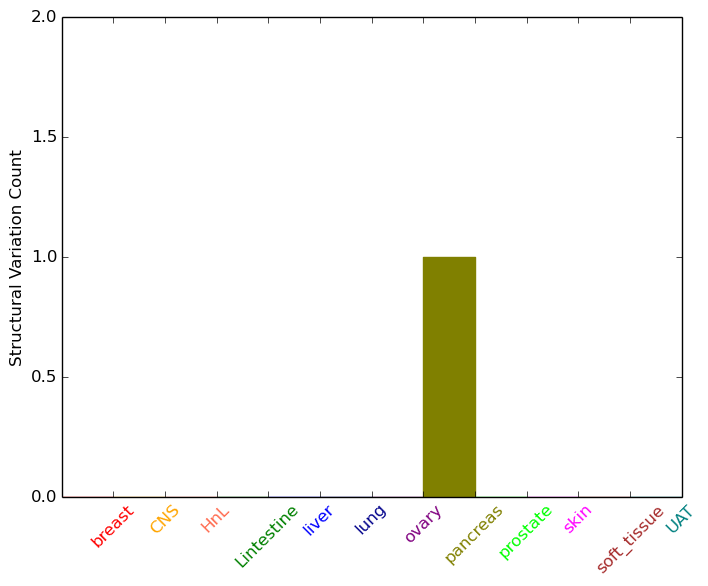
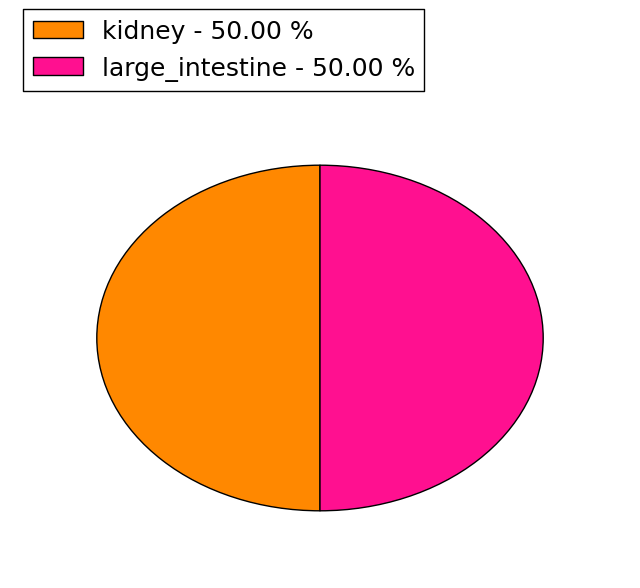
| - For Inter-chromosomal Variations |
| * Inter-chromosomal variantions includes 'interchromosomal amplicon to amplicon', 'interchromosomal amplicon to non-amplified dna', 'interchromosomal insertion', 'Interchromosomal unknown type'. |
 |
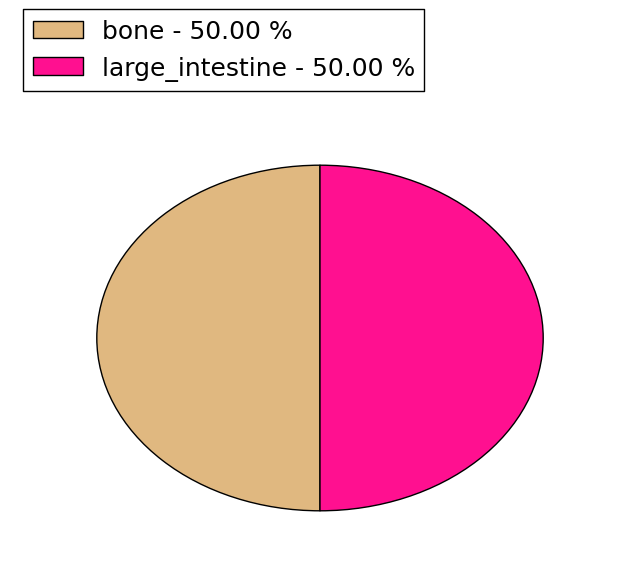
| - For Intra-chromosomal Variations |
| There's no intra-chromosomal structural variation. |
| Sample | Symbol_a | Chr_a | Start_a | End_a | Symbol_b | Chr_b | Start_b | End_b |
| pancreas | CCT3 | chr1 | 156306971 | 156306991 | PTPN1 | chr20 | 49197356 | 49197376 |
| cf) Tissue number; Tissue name (1;Breast, 2;Central_nervous_system, 3;Haematopoietic_and_lymphoid_tissue, 4;Large_intestine, 5;Liver, 6;Lung, 7;Ovary, 8;Pancreas, 9;Prostate, 10;Skin, 11;Soft_tissue, 12;Upper_aerodigestive_tract) |
| * From mRNA Sanger sequences, Chitars2.0 arranged chimeric transcripts. This table shows CCT3 related fusion information. |
| ID | Head Gene | Tail Gene | Accession | Gene_a | qStart_a | qEnd_a | Chromosome_a | tStart_a | tEnd_a | Gene_a | qStart_a | qEnd_a | Chromosome_a | tStart_a | tEnd_a |
| AA748732 | CCT3 | 10 | 379 | 1 | 156278759 | 156280436 | HVCN1 | 374 | 489 | 12 | 111091636 | 111091751 | |
| CB114948 | CCT3 | 1 | 87 | 1 | 156287279 | 156288685 | RAC1 | 79 | 167 | 7 | 6442050 | 6442138 | |
| AA010637 | CCT3 | 1 | 265 | 1 | 156306743 | 156307005 | TRAF3IP1 | 259 | 359 | 2 | 239309092 | 239309191 | |
| BE783136 | CCT3 | 20 | 99 | 1 | 156303346 | 156303425 | CCT3 | 90 | 140 | 1 | 156290660 | 156290710 | |
| BQ353904 | MDM2 | 1 | 235 | 12 | 69237587 | 69237822 | CCT3 | 234 | 463 | 1 | 156280758 | 156280987 | |
| DB040324 | LOC100507412 | 1 | 107 | ? | 112074 | 112180 | CCT3 | 108 | 572 | 1 | 156290766 | 156308030 | |
| Top |
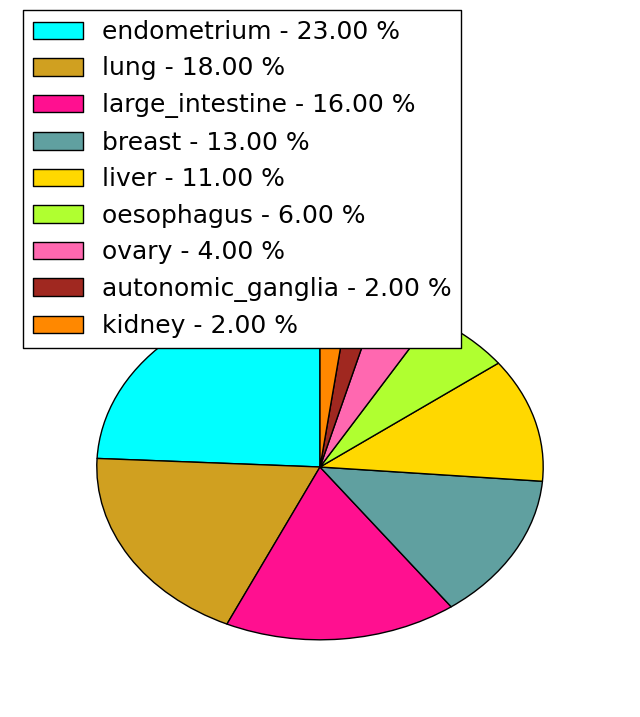
| Mutation type/ Tissue ID | brca | cns | cerv | endome | haematopo | kidn | Lintest | liver | lung | ns | ovary | pancre | prost | skin | stoma | thyro | urina | |||
| Total # sample | 1 | 1 | ||||||||||||||||||
| GAIN (# sample) | 1 | 1 | ||||||||||||||||||
| LOSS (# sample) |
| cf) Tissue ID; Tissue type (1; Breast, 2; Central_nervous_system, 3; Cervix, 4; Endometrium, 5; Haematopoietic_and_lymphoid_tissue, 6; Kidney, 7; Large_intestine, 8; Liver, 9; Lung, 10; NS, 11; Ovary, 12; Pancreas, 13; Prostate, 14; Skin, 15; Stomach, 16; Thyroid, 17; Urinary_tract) |
| Top |
|
 |
| Top |
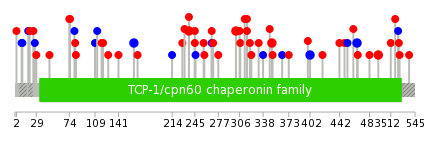
| Stat. for Non-Synonymous SNVs (# total SNVs=43) | (# total SNVs=12) |
 |  |
(# total SNVs=2) | (# total SNVs=2) |
 |  |
| Top |
| * When you move the cursor on each content, you can see more deailed mutation information on the Tooltip. Those are primary_site,primary_histology,mutation(aa),pubmedID. |
| GRCh37 position | Mutation(aa) | Unique sampleID count |
| chr1:156280399-156280399 | p.I495V | 2 |
| chr1:156290648-156290648 | p.K197fs*23 | 2 |
| chr1:156290753-156290753 | p.T162T | 2 |
| chr1:156280744-156280744 | p.L466L | 2 |
| chr1:156288685-156288685 | p.L245V | 2 |
| chr1:156281939-156281939 | p.L350M | 2 |
| chr1:156287030-156287030 | p.Q301E | 2 |
| chr1:156288708-156288708 | p.R237H | 2 |
| chr1:156280936-156280936 | p.L402L | 2 |
| chr1:156280947-156280947 | p.R399C | 1 |
| Top |
|
 |
| Point Mutation/ Tissue ID | 1 | 2 | 3 | 4 | 5 | 6 | 7 | 8 | 9 | 10 | 11 | 12 | 13 | 14 | 15 | 16 | 17 | 18 | 19 | 20 |
| # sample | 4 | 4 | 4 | 1 | 7 | 4 | 2 | 4 | 4 | 10 | ||||||||||
| # mutation | 4 | 4 | 4 | 1 | 8 | 4 | 2 | 4 | 4 | 11 | ||||||||||
| nonsynonymous SNV | 2 | 4 | 3 | 1 | 5 | 1 | 2 | 2 | 3 | 10 | ||||||||||
| synonymous SNV | 2 | 1 | 3 | 3 | 2 | 1 | 1 |
| cf) Tissue ID; Tissue type (1; BLCA[Bladder Urothelial Carcinoma], 2; BRCA[Breast invasive carcinoma], 3; CESC[Cervical squamous cell carcinoma and endocervical adenocarcinoma], 4; COAD[Colon adenocarcinoma], 5; GBM[Glioblastoma multiforme], 6; Glioma Low Grade, 7; HNSC[Head and Neck squamous cell carcinoma], 8; KICH[Kidney Chromophobe], 9; KIRC[Kidney renal clear cell carcinoma], 10; KIRP[Kidney renal papillary cell carcinoma], 11; LAML[Acute Myeloid Leukemia], 12; LUAD[Lung adenocarcinoma], 13; LUSC[Lung squamous cell carcinoma], 14; OV[Ovarian serous cystadenocarcinoma ], 15; PAAD[Pancreatic adenocarcinoma], 16; PRAD[Prostate adenocarcinoma], 17; SKCM[Skin Cutaneous Melanoma], 18:STAD[Stomach adenocarcinoma], 19:THCA[Thyroid carcinoma], 20:UCEC[Uterine Corpus Endometrial Carcinoma]) |
| Top |
| * We represented just top 10 SNVs. When you move the cursor on each content, you can see more deailed mutation information on the Tooltip. Those are primary_site, primary_histology, mutation(aa), pubmedID. |
| Genomic Position | Mutation(aa) | Unique sampleID count |
| chr1:156288685 | p.L207M,CCT3 | 2 |
| chr1:156286984 | p.Q404H,CCT3 | 1 |
| chr1:156280760 | p.R228R,CCT3 | 1 |
| chr1:156303398 | p.M47I | 1 |
| chr1:156286994 | p.L364L,CCT3 | 1 |
| chr1:156288708 | p.I220S,CCT3 | 1 |
| chr1:156280783 | p.R20T,CCT3 | 1 |
| chr1:156303399 | p.R361C,CCT3 | 1 |
| chr1:156287012 | p.E208E,CCT3 | 1 |
| chr1:156288726 | p.S18S,CCT3 | 1 |
| * Copy number data were extracted from TCGA using R package TCGA-Assembler. The URLs of all public data files on TCGA DCC data server were gathered on Jan-05-2015. Function ProcessCNAData in TCGA-Assembler package was used to obtain gene-level copy number value which is calculated as the average copy number of the genomic region of a gene. |
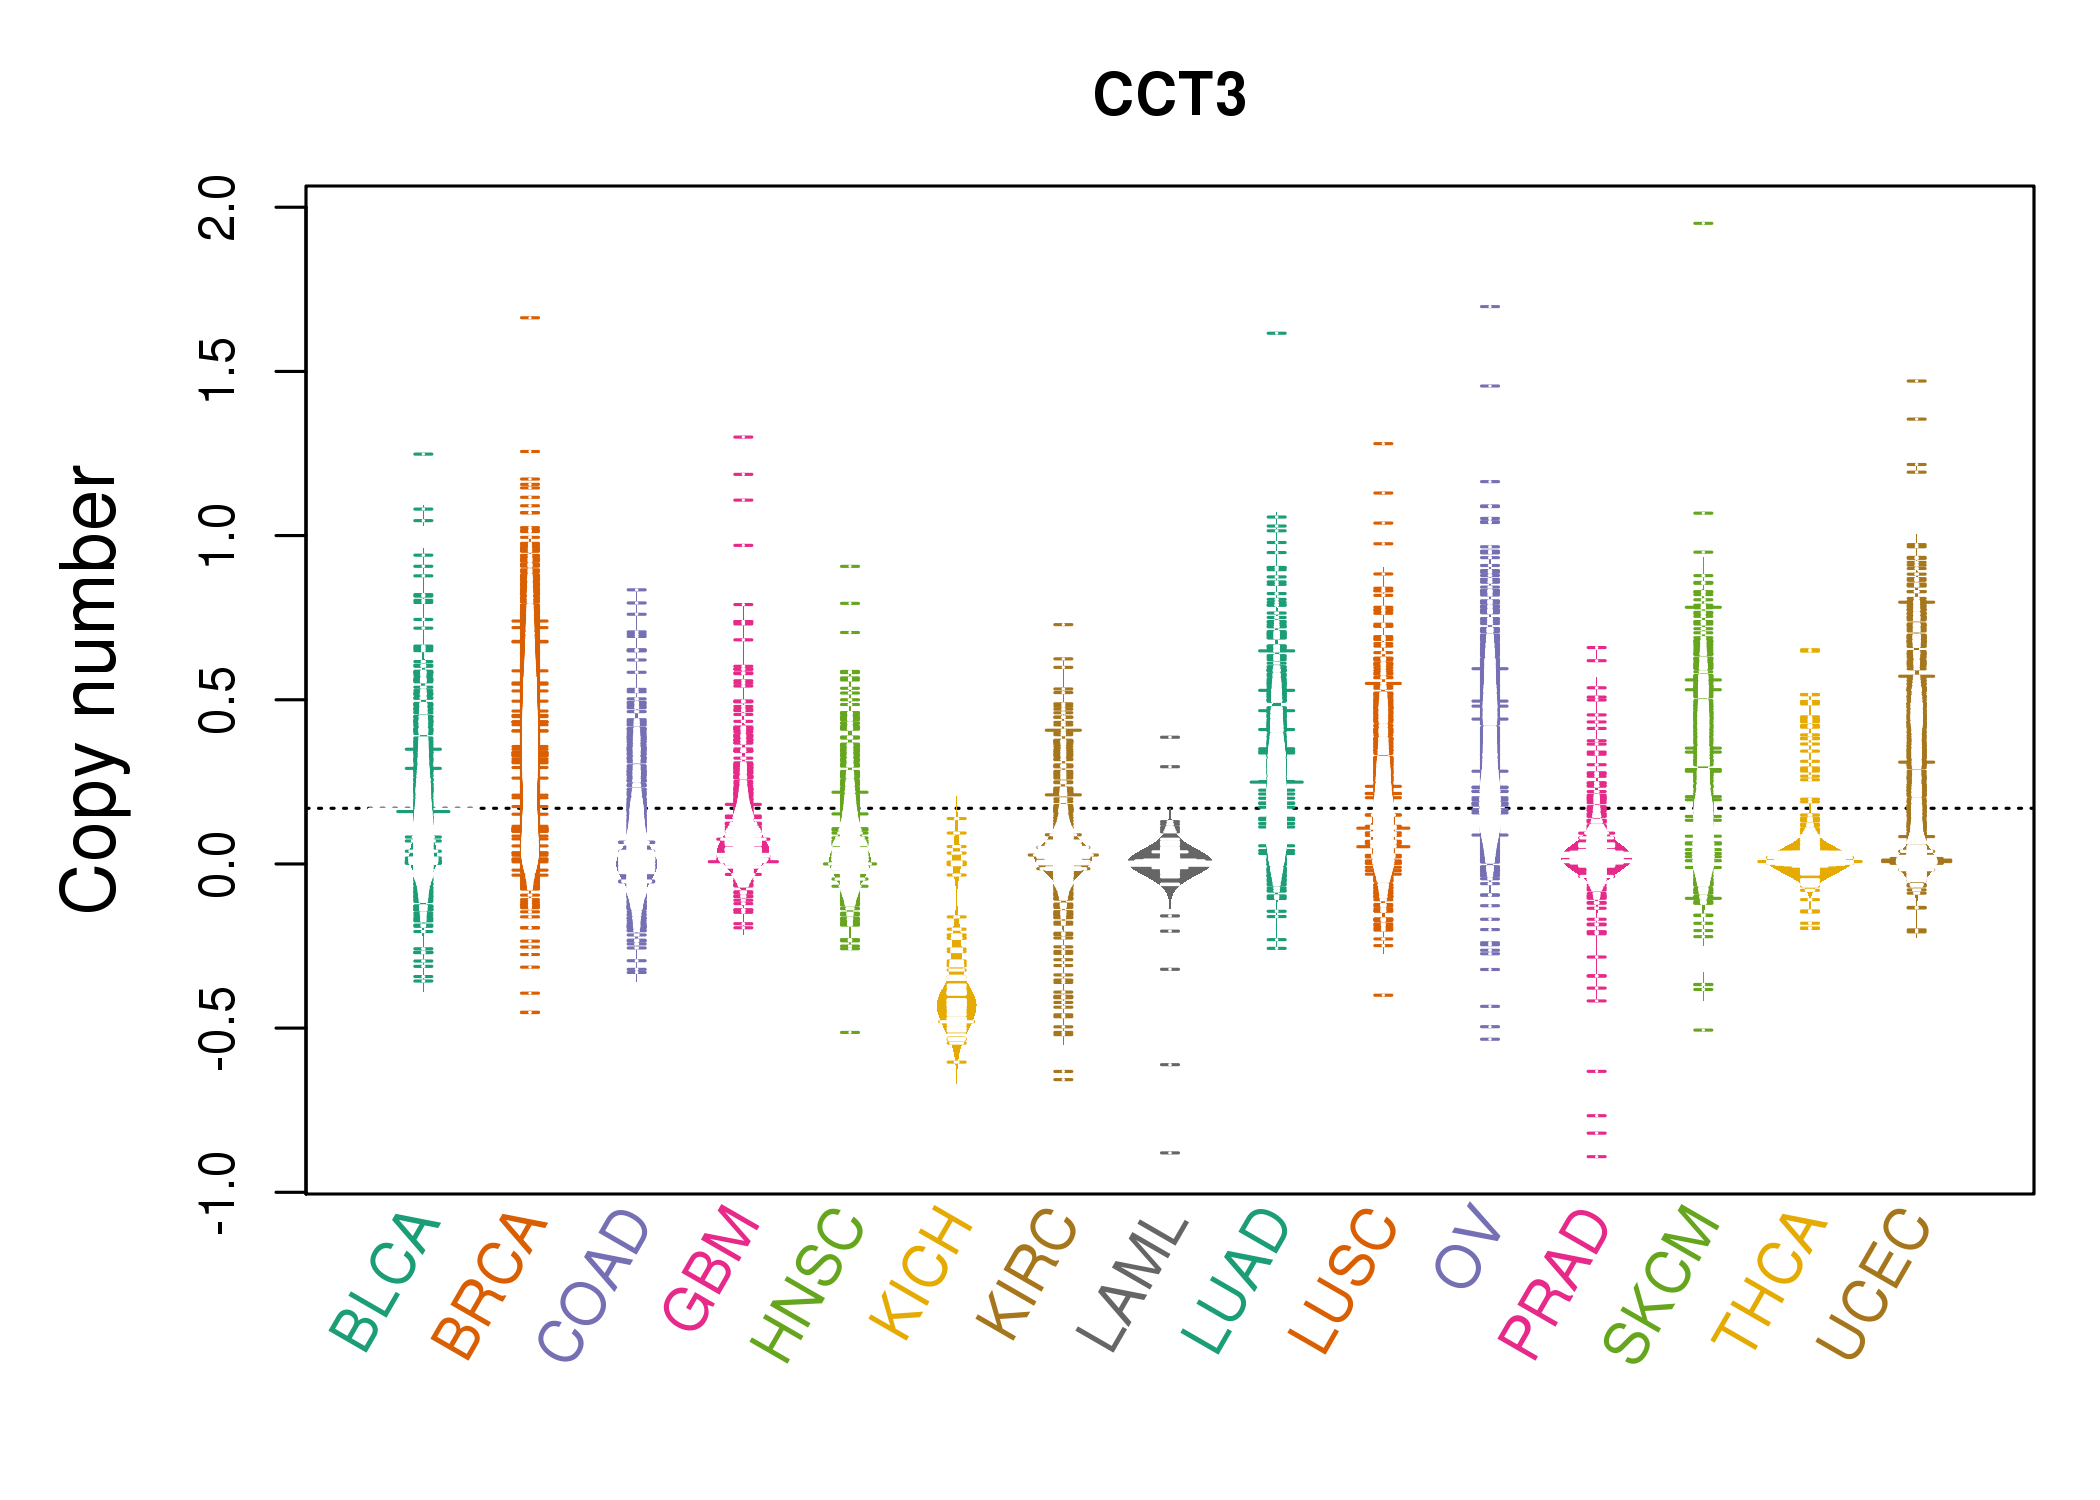 |
| cf) Tissue ID[Tissue type]: BLCA[Bladder Urothelial Carcinoma], BRCA[Breast invasive carcinoma], CESC[Cervical squamous cell carcinoma and endocervical adenocarcinoma], COAD[Colon adenocarcinoma], GBM[Glioblastoma multiforme], Glioma Low Grade, HNSC[Head and Neck squamous cell carcinoma], KICH[Kidney Chromophobe], KIRC[Kidney renal clear cell carcinoma], KIRP[Kidney renal papillary cell carcinoma], LAML[Acute Myeloid Leukemia], LUAD[Lung adenocarcinoma], LUSC[Lung squamous cell carcinoma], OV[Ovarian serous cystadenocarcinoma ], PAAD[Pancreatic adenocarcinoma], PRAD[Prostate adenocarcinoma], SKCM[Skin Cutaneous Melanoma], STAD[Stomach adenocarcinoma], THCA[Thyroid carcinoma], UCEC[Uterine Corpus Endometrial Carcinoma] |
| Top |
| Gene Expression for CCT3 |
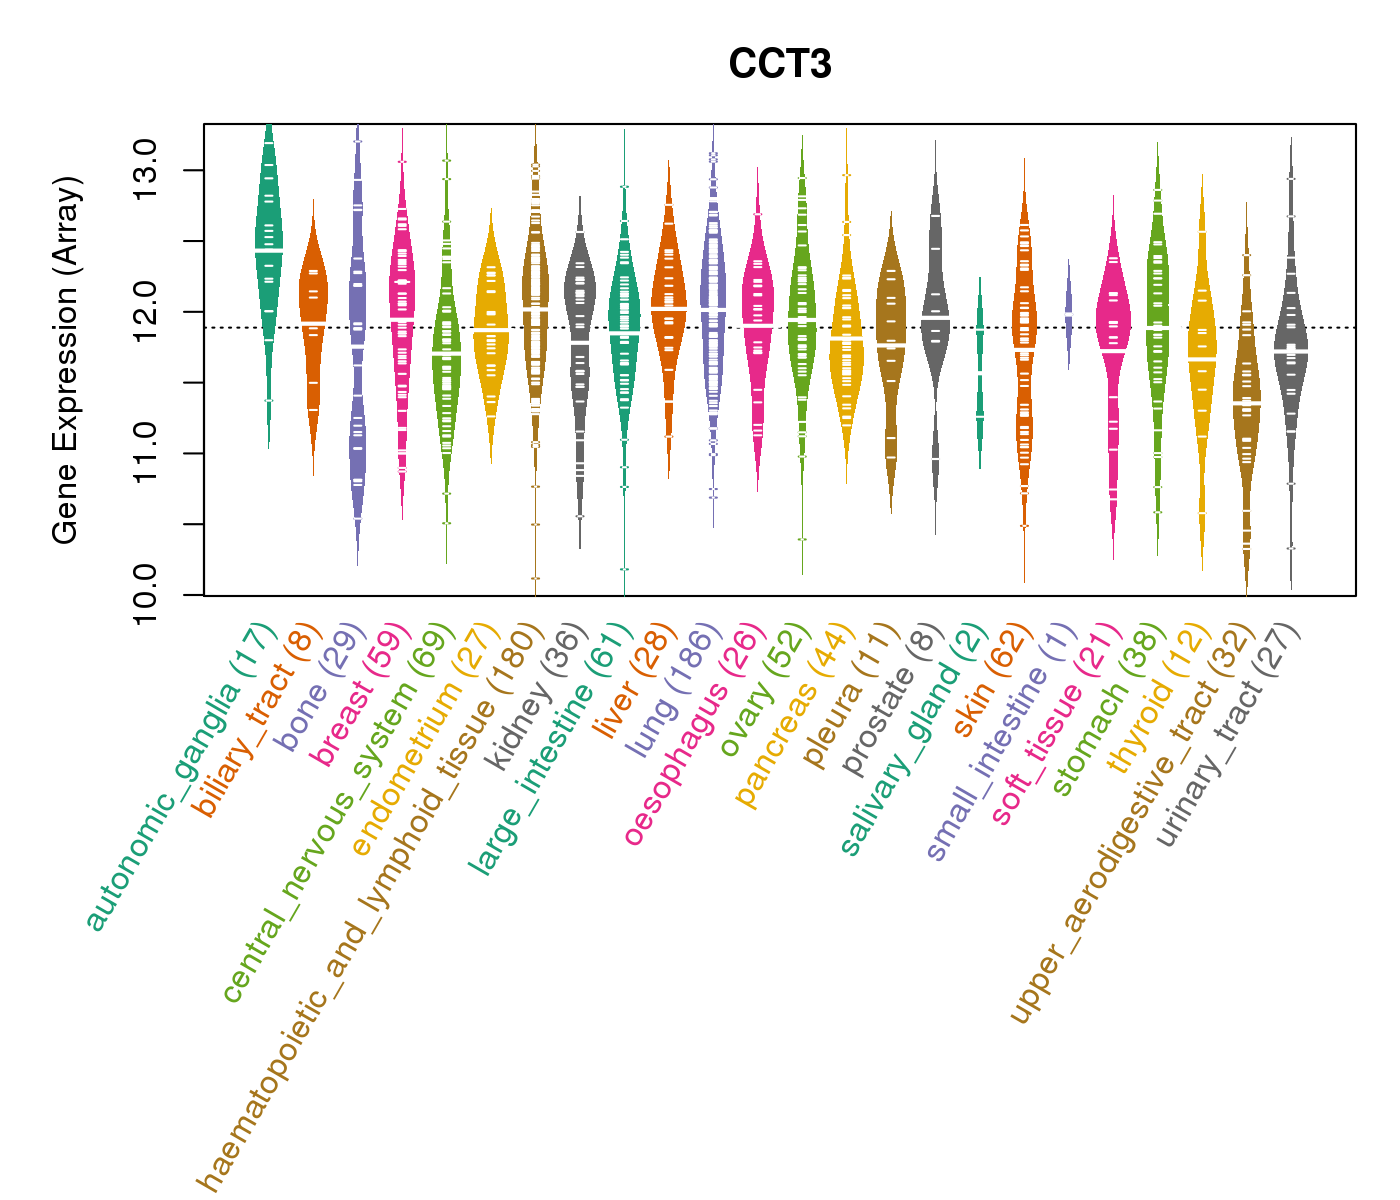
| * CCLE gene expression data were extracted from CCLE_Expression_Entrez_2012-10-18.res: Gene-centric RMA-normalized mRNA expression data. |
 |
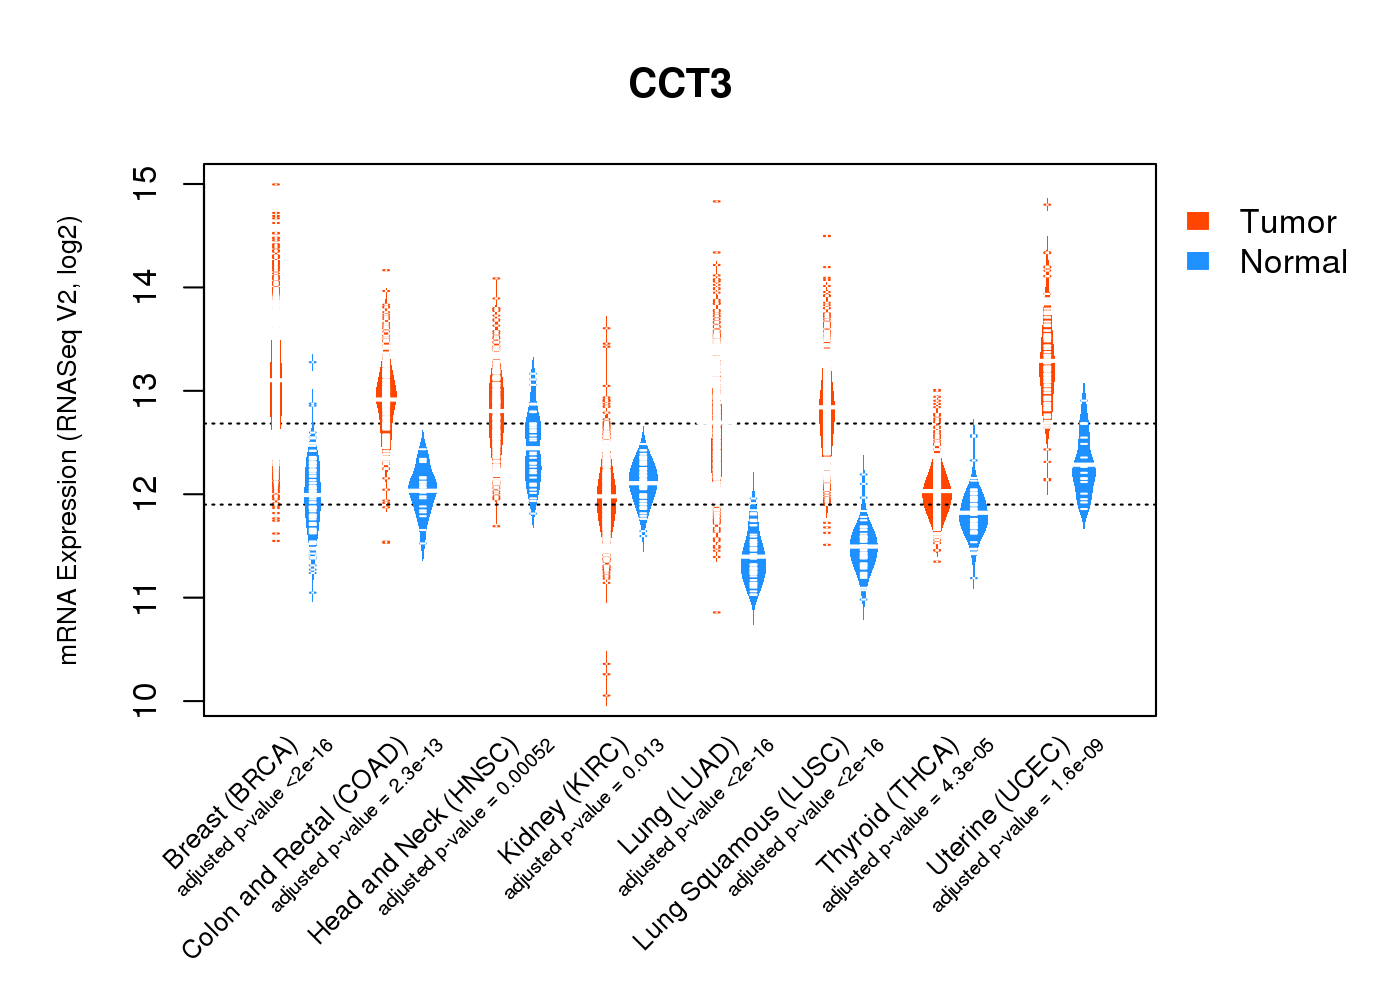
| * Normalized gene expression data of RNASeqV2 was extracted from TCGA using R package TCGA-Assembler. The URLs of all public data files on TCGA DCC data server were gathered at Jan-05-2015. Only eight cancer types have enough normal control samples for differential expression analysis. (t test, adjusted p<0.05 (using Benjamini-Hochberg FDR)) |
 |
| Top |
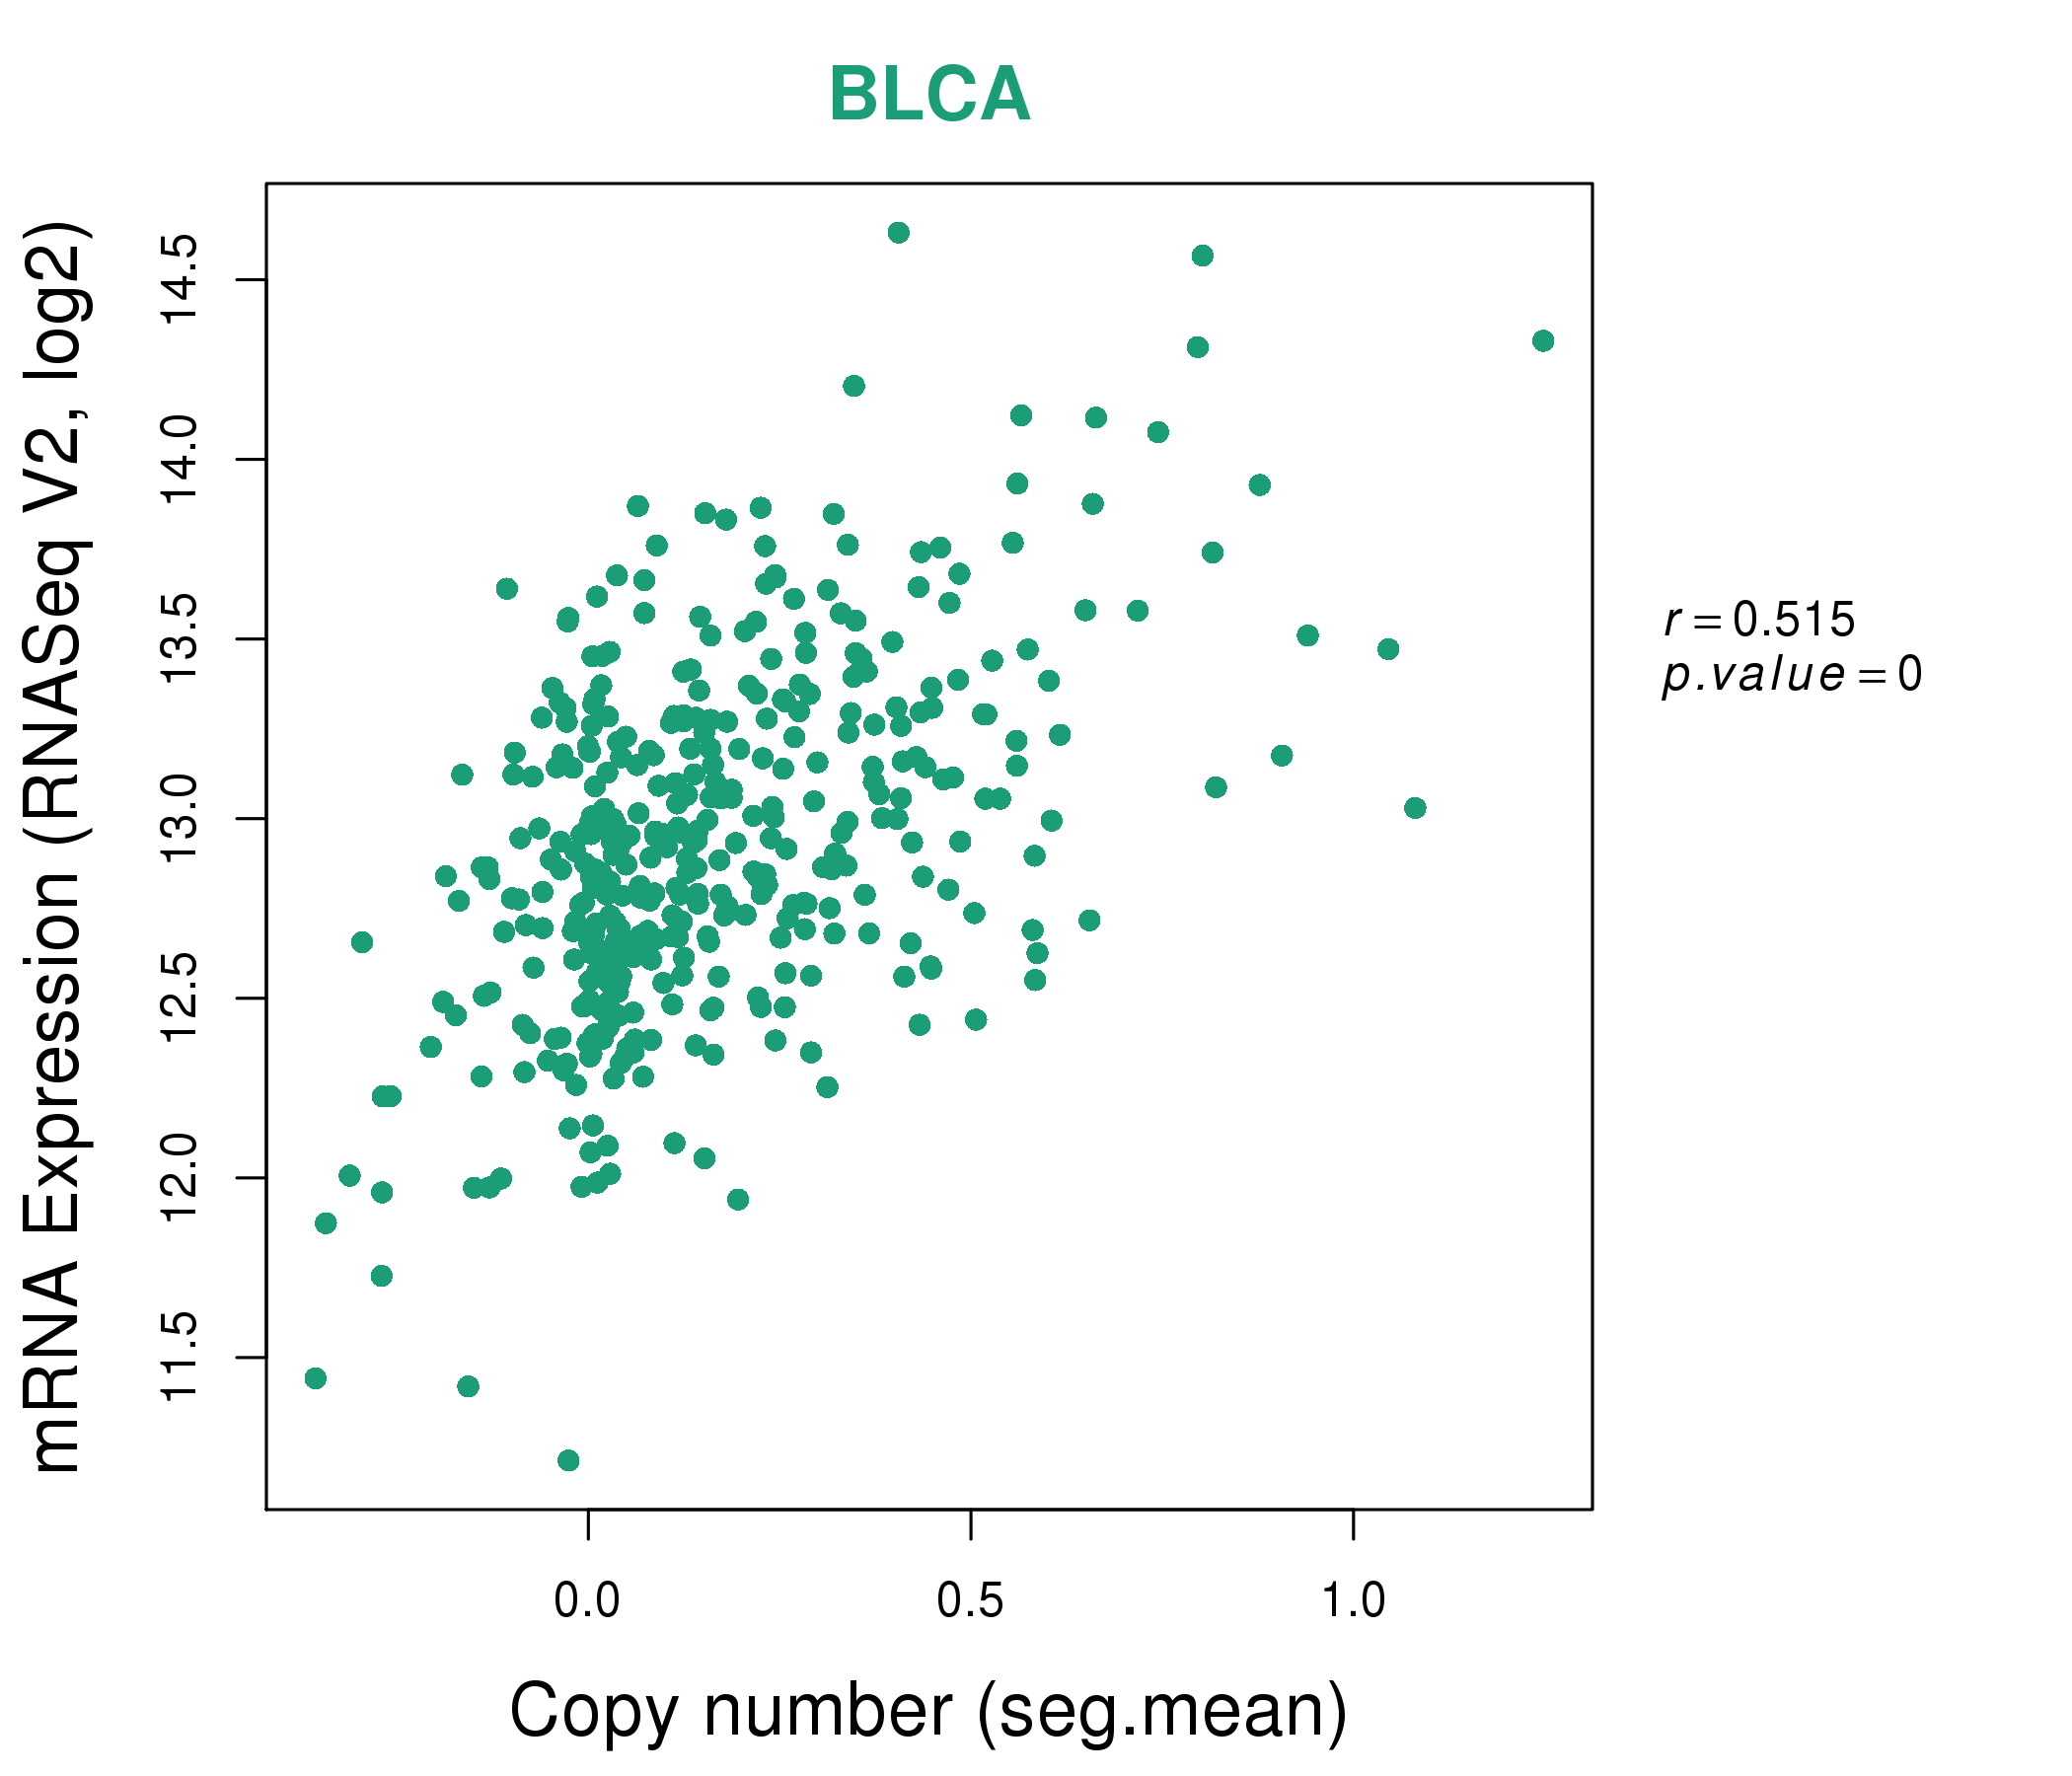
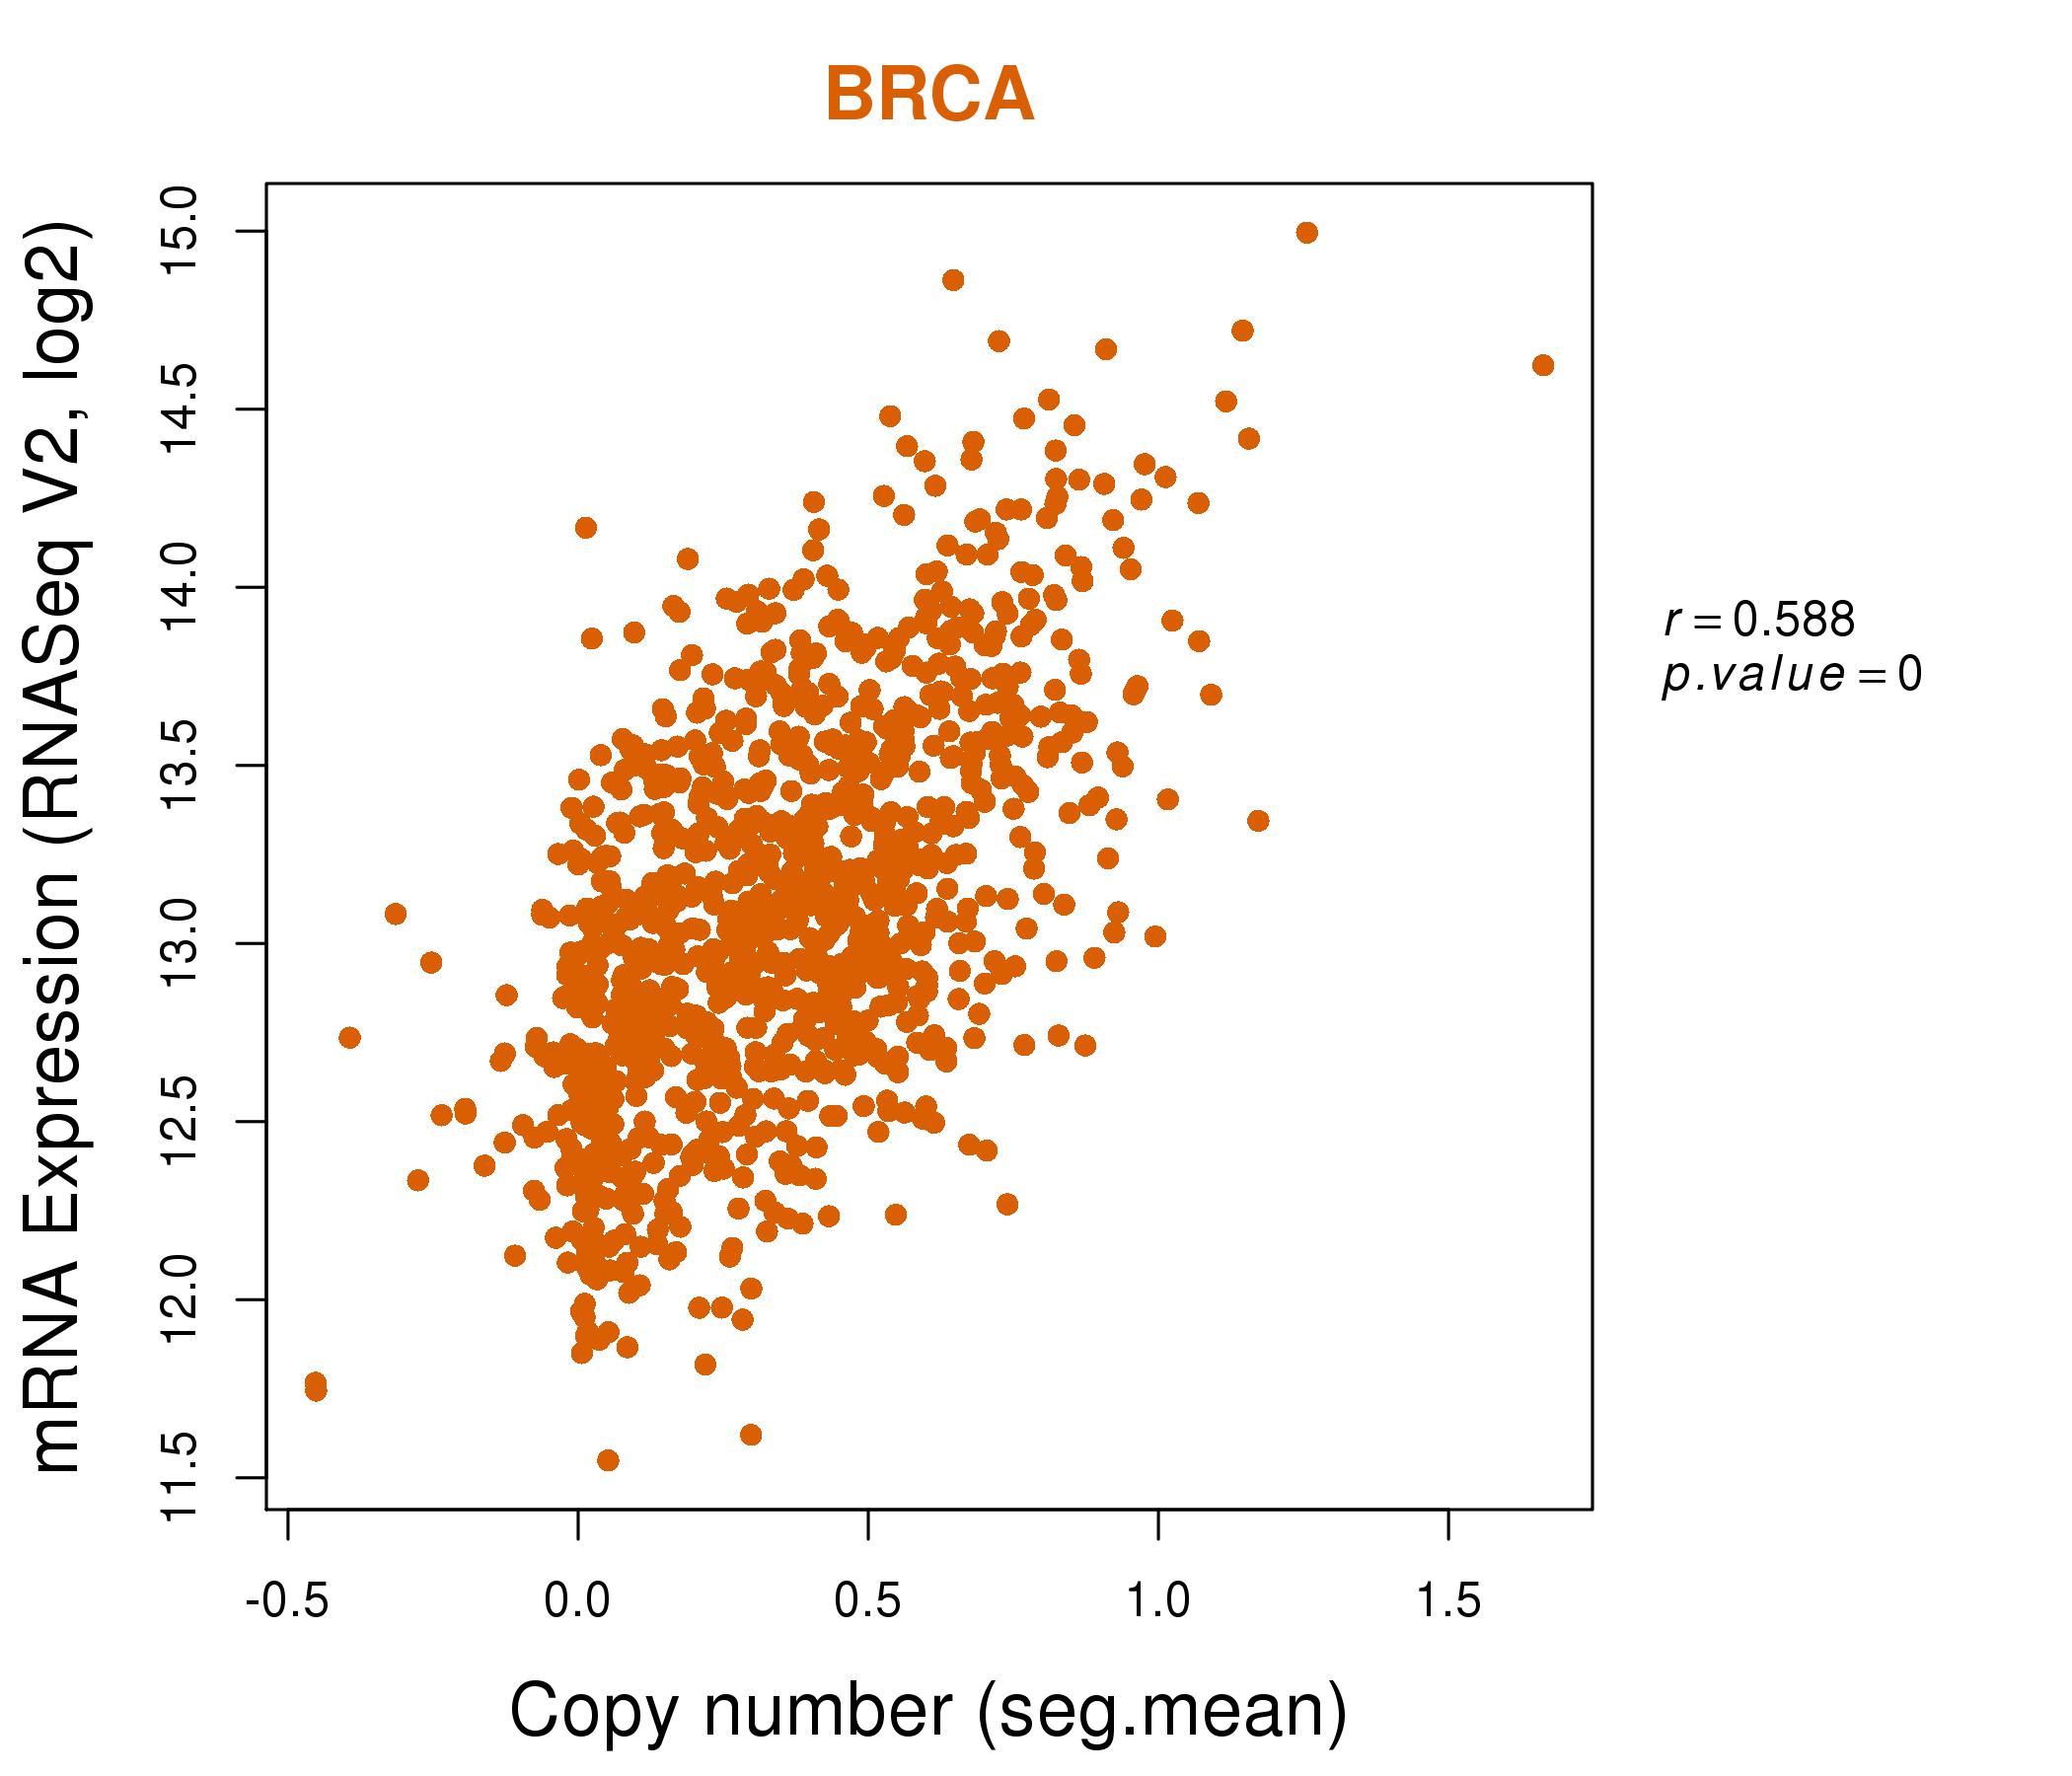
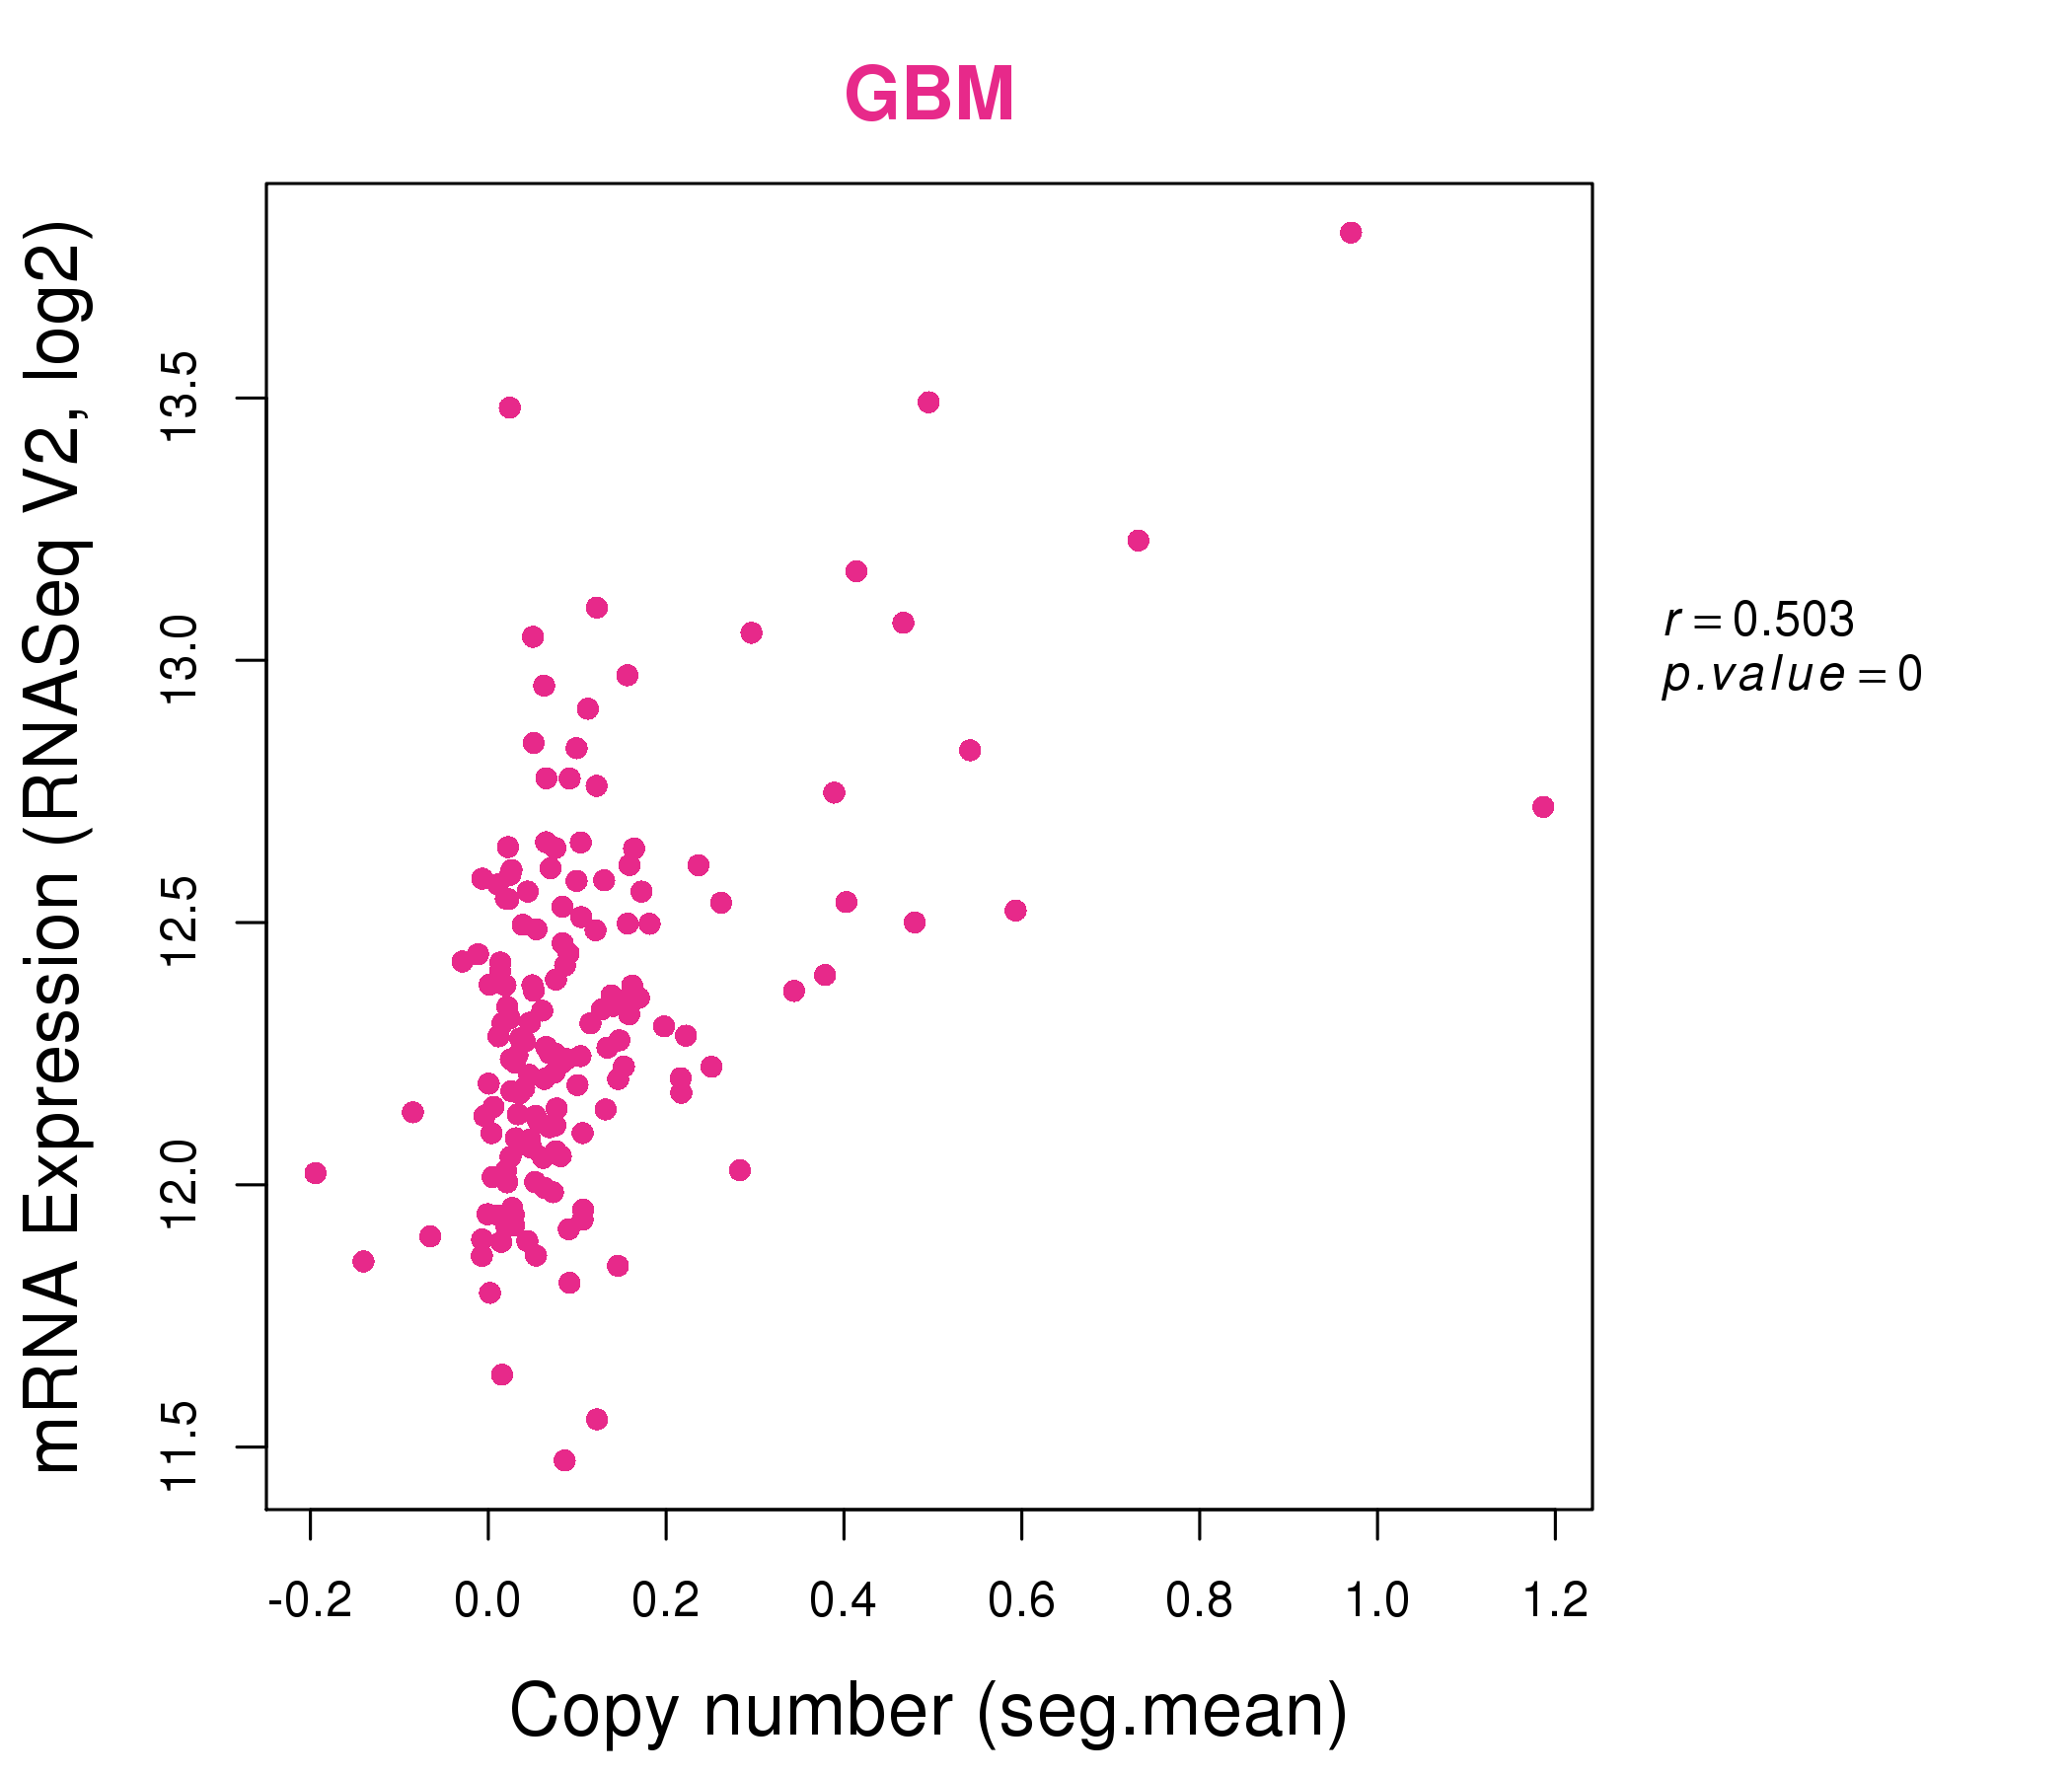
| * This plots show the correlation between CNV and gene expression. |
: Open all plots for all cancer types
 |
|
 |
|
| Top |
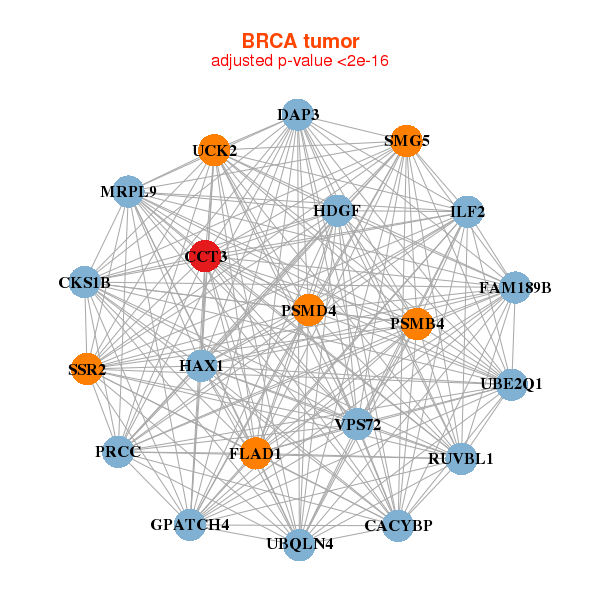
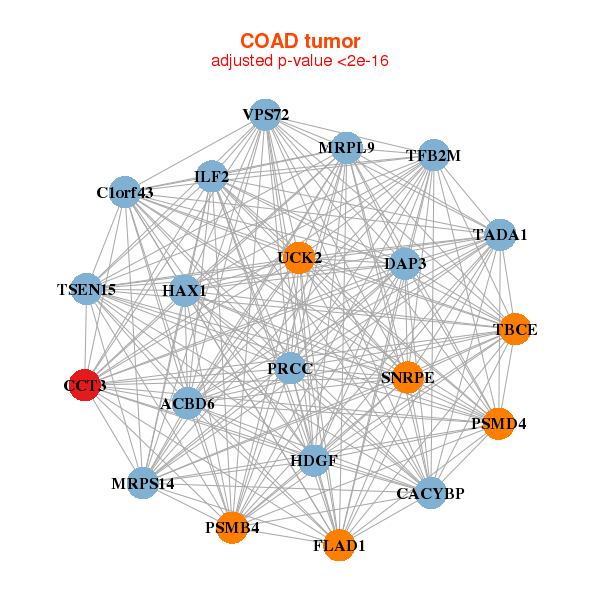
| Gene-Gene Network Information |
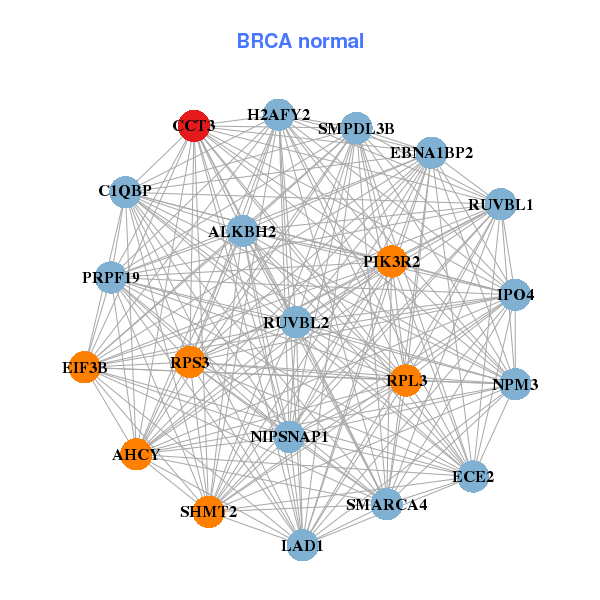
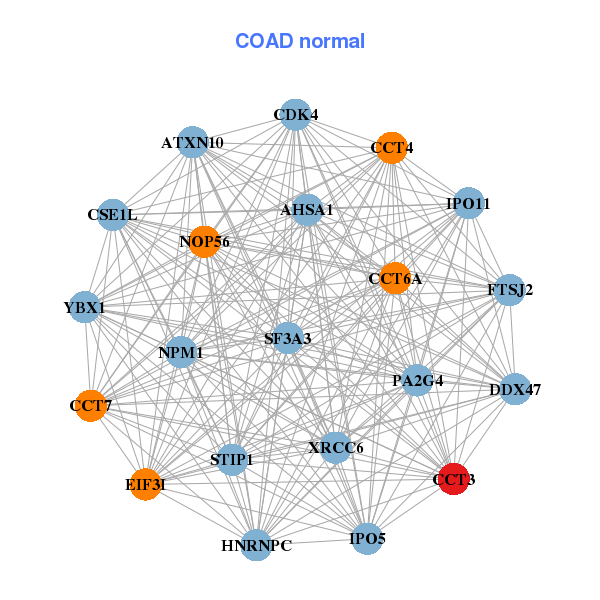
| * Co-Expression network figures were drawn using R package igraph. Only the top 20 genes with the highest correlations were shown. Red circle: input gene, orange circle: cell metabolism gene, sky circle: other gene |
: Open all plots for all cancer types
 |
|
| CACYBP,CCT3,CKS1B,DAP3,FAM189B,FLAD1,GPATCH4, HAX1,HDGF,ILF2,MRPL9,PRCC,PSMB4,PSMD4, RUVBL1,SMG5,SSR2,UBE2Q1,UBQLN4,UCK2,VPS72 | AHCY,ALKBH2,C1QBP,CCT3,EBNA1BP2,ECE2,EIF3B, H2AFY2,IPO4,LAD1,NIPSNAP1,NPM3,PIK3R2,PRPF19, RPL3,RPS3,RUVBL1,RUVBL2,SHMT2,SMARCA4,SMPDL3B |
 |
|
| ACBD6,C1orf43,CACYBP,CCT3,DAP3,FLAD1,HAX1, HDGF,ILF2,MRPL9,MRPS14,PRCC,PSMB4,PSMD4, SNRPE,TADA1,TBCE,TFB2M,TSEN15,UCK2,VPS72 | AHSA1,ATXN10,CCT3,CCT4,CCT6A,CCT7,CDK4, CSE1L,DDX47,EIF3I,FTSJ2,HNRNPC,IPO11,IPO5, NOP56,NPM1,PA2G4,SF3A3,STIP1,XRCC6,YBX1 |
| * Co-Expression network figures were drawn using R package igraph. Only the top 20 genes with the highest correlations were shown. Red circle: input gene, orange circle: cell metabolism gene, sky circle: other gene |
: Open all plots for all cancer types
| Top |
: Open all interacting genes' information including KEGG pathway for all interacting genes from DAVID
| Top |
| Pharmacological Information for CCT3 |
| There's no related Drug. |
| Top |
| Cross referenced IDs for CCT3 |
| * We obtained these cross-references from Uniprot database. It covers 150 different DBs, 18 categories. http://www.uniprot.org/help/cross_references_section |
: Open all cross reference information
|
Copyright © 2016-Present - The Univsersity of Texas Health Science Center at Houston @ |