|
||||||||||||||||||||
| |
| Phenotypic Information (metabolism pathway, cancer, disease, phenome) |
| |
| |
| Gene-Gene Network Information: Co-Expression Network, Interacting Genes & KEGG |
| |
|


| Gene Summary for TSHB |
| Basic gene info. | Gene symbol | TSHB |
| Gene name | thyroid stimulating hormone, beta | |
| Synonyms | TSH-B|TSH-BETA | |
| Cytomap | UCSC genome browser: 1p13 | |
| Genomic location | chr1 :115572414-115576941 | |
| Type of gene | protein-coding | |
| RefGenes | NM_000549.4, NM_001277991.1, | |
| Ensembl id | ENSG00000134200 | |
| Description | thyrotropin beta chainthyrotropin subunit beta | |
| Modification date | 20141207 | |
| dbXrefs | MIM : 188540 | |
| HGNC : HGNC | ||
| Ensembl : ENSG00000134200 | ||
| HPRD : 11766 | ||
| Protein | UniProt: go to UniProt's Cross Reference DB Table | |
| Expression | CleanEX: HS_TSHB | |
| BioGPS: 7252 | ||
| Gene Expression Atlas: ENSG00000134200 | ||
| The Human Protein Atlas: ENSG00000134200 | ||
| Pathway | NCI Pathway Interaction Database: TSHB | |
| KEGG: TSHB | ||
| REACTOME: TSHB | ||
| ConsensusPathDB | ||
| Pathway Commons: TSHB | ||
| Metabolism | MetaCyc: TSHB | |
| HUMANCyc: TSHB | ||
| Regulation | Ensembl's Regulation: ENSG00000134200 | |
| miRBase: chr1 :115,572,414-115,576,941 | ||
| TargetScan: NM_000549 | ||
| cisRED: ENSG00000134200 | ||
| Context | iHOP: TSHB | |
| cancer metabolism search in PubMed: TSHB | ||
| UCL Cancer Institute: TSHB | ||
| Assigned class in ccmGDB | C | |
| Top |
| Phenotypic Information for TSHB(metabolism pathway, cancer, disease, phenome) |
| Cancer | CGAP: TSHB |
| Familial Cancer Database: TSHB | |
| * This gene is included in those cancer gene databases. |
|
|
|
|
|
|
| ||||||||||||||
Oncogene 1 | Significant driver gene in | |||||||||||||||||||
| cf) number; DB name 1 Oncogene; http://nar.oxfordjournals.org/content/35/suppl_1/D721.long, 2 Tumor Suppressor gene; https://bioinfo.uth.edu/TSGene/, 3 Cancer Gene Census; http://www.nature.com/nrc/journal/v4/n3/abs/nrc1299.html, 4 CancerGenes; http://nar.oxfordjournals.org/content/35/suppl_1/D721.long, 5 Network of Cancer Gene; http://ncg.kcl.ac.uk/index.php, 1Therapeutic Vulnerabilities in Cancer; http://cbio.mskcc.org/cancergenomics/statius/ |
| REACTOME_METABOLISM_OF_AMINO_ACIDS_AND_DERIVATIVES | |
| OMIM | |
| Orphanet | |
| Disease | KEGG Disease: TSHB |
| MedGen: TSHB (Human Medical Genetics with Condition) | |
| ClinVar: TSHB | |
| Phenotype | MGI: TSHB (International Mouse Phenotyping Consortium) |
| PhenomicDB: TSHB | |
| Mutations for TSHB |
| * Under tables are showing count per each tissue to give us broad intuition about tissue specific mutation patterns.You can go to the detailed page for each mutation database's web site. |
| There's no structural variation information in COSMIC data for this gene. |
| * From mRNA Sanger sequences, Chitars2.0 arranged chimeric transcripts. This table shows TSHB related fusion information. |
| ID | Head Gene | Tail Gene | Accession | Gene_a | qStart_a | qEnd_a | Chromosome_a | tStart_a | tEnd_a | Gene_a | qStart_a | qEnd_a | Chromosome_a | tStart_a | tEnd_a |
| Top |
| There's no copy number variation information in COSMIC data for this gene. |
| Top |
|
 |
| Top |
| Stat. for Non-Synonymous SNVs (# total SNVs=13) | (# total SNVs=5) |
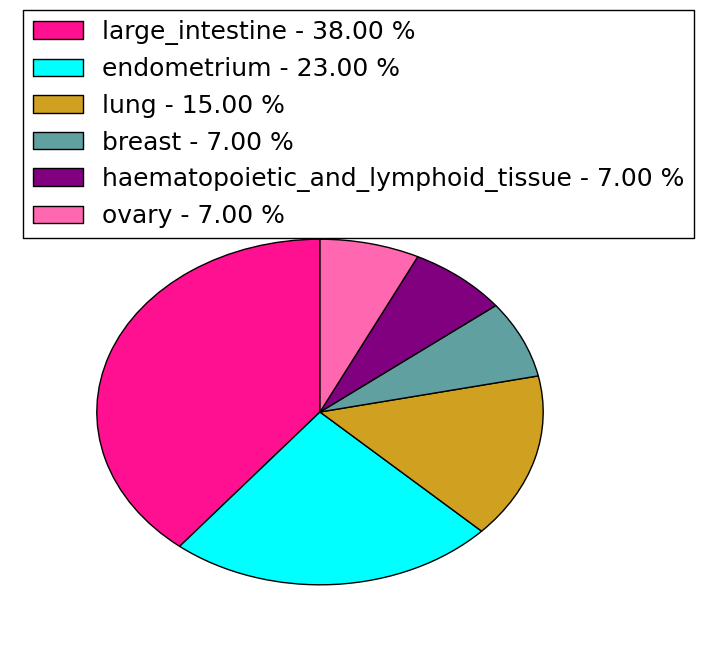 | 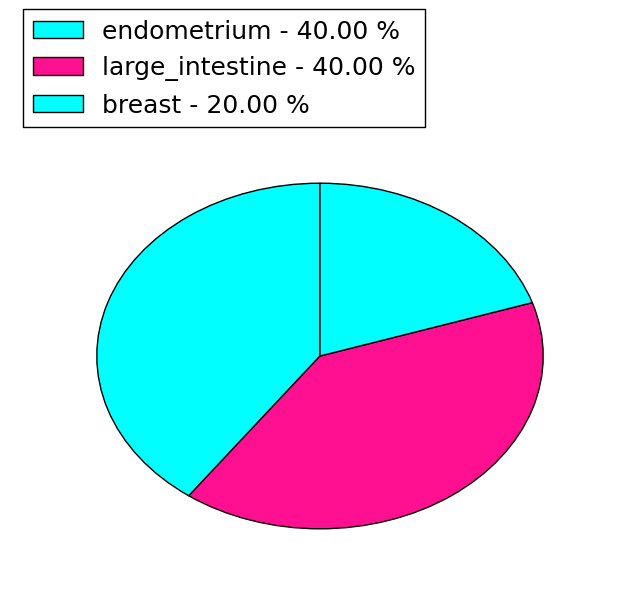 |
(# total SNVs=0) | (# total SNVs=0) |
| Top |
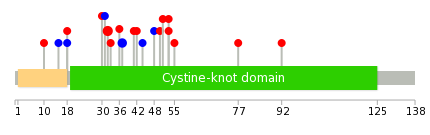
| * When you move the cursor on each content, you can see more deailed mutation information on the Tooltip. Those are primary_site,primary_histology,mutation(aa),pubmedID. |
| GRCh37 position | Mutation(aa) | Unique sampleID count |
| chr1:115576077-115576077 | p.E32K | 3 |
| chr1:115576036-115576036 | p.A18V | 2 |
| chr1:115576594-115576594 | p.D55N | 2 |
| chr1:115576076-115576076 | p.I31I | 2 |
| chr1:115576094-115576094 | p.A37A | 2 |
| chr1:115576718-115576718 | p.S96F | 2 |
| chr1:115576724-115576724 | p.P98H | 1 |
| chr1:115576115-115576115 | p.T44T | 1 |
| chr1:115576730-115576730 | p.A100D | 1 |
| chr1:115576038-115576038 | p.M19L | 1 |
| Top |
|
 |
| Point Mutation/ Tissue ID | 1 | 2 | 3 | 4 | 5 | 6 | 7 | 8 | 9 | 10 | 11 | 12 | 13 | 14 | 15 | 16 | 17 | 18 | 19 | 20 |
| # sample | 3 | 3 | 1 | 8 | 2 | 5 | ||||||||||||||
| # mutation | 3 | 4 | 1 | 7 | 2 | 5 | ||||||||||||||
| nonsynonymous SNV | 2 | 2 | 1 | 6 | 2 | 3 | ||||||||||||||
| synonymous SNV | 1 | 2 | 1 | 2 |
| cf) Tissue ID; Tissue type (1; BLCA[Bladder Urothelial Carcinoma], 2; BRCA[Breast invasive carcinoma], 3; CESC[Cervical squamous cell carcinoma and endocervical adenocarcinoma], 4; COAD[Colon adenocarcinoma], 5; GBM[Glioblastoma multiforme], 6; Glioma Low Grade, 7; HNSC[Head and Neck squamous cell carcinoma], 8; KICH[Kidney Chromophobe], 9; KIRC[Kidney renal clear cell carcinoma], 10; KIRP[Kidney renal papillary cell carcinoma], 11; LAML[Acute Myeloid Leukemia], 12; LUAD[Lung adenocarcinoma], 13; LUSC[Lung squamous cell carcinoma], 14; OV[Ovarian serous cystadenocarcinoma ], 15; PAAD[Pancreatic adenocarcinoma], 16; PRAD[Prostate adenocarcinoma], 17; SKCM[Skin Cutaneous Melanoma], 18:STAD[Stomach adenocarcinoma], 19:THCA[Thyroid carcinoma], 20:UCEC[Uterine Corpus Endometrial Carcinoma]) |
| Top |
| * We represented just top 10 SNVs. When you move the cursor on each content, you can see more deailed mutation information on the Tooltip. Those are primary_site, primary_histology, mutation(aa), pubmedID. |
| Genomic Position | Mutation(aa) | Unique sampleID count |
| chr1:115576077 | p.E32K | 3 |
| chr1:115576094 | p.A37A | 2 |
| chr1:115576710 | p.R33K | 1 |
| chr1:115576081 | p.S92F,TSHB | 1 |
| chr1:115576716 | p.C36Y | 1 |
| chr1:115576090 | p.I42V | 1 |
| chr1:115576718 | p.T44T | 1 |
| chr1:115576724 | p.T53A | 1 |
| chr1:115576107 | p.D10N,TSHB | 1 |
| chr1:115576730 | p.P18P,TSHB | 1 |
| * Copy number data were extracted from TCGA using R package TCGA-Assembler. The URLs of all public data files on TCGA DCC data server were gathered on Jan-05-2015. Function ProcessCNAData in TCGA-Assembler package was used to obtain gene-level copy number value which is calculated as the average copy number of the genomic region of a gene. |
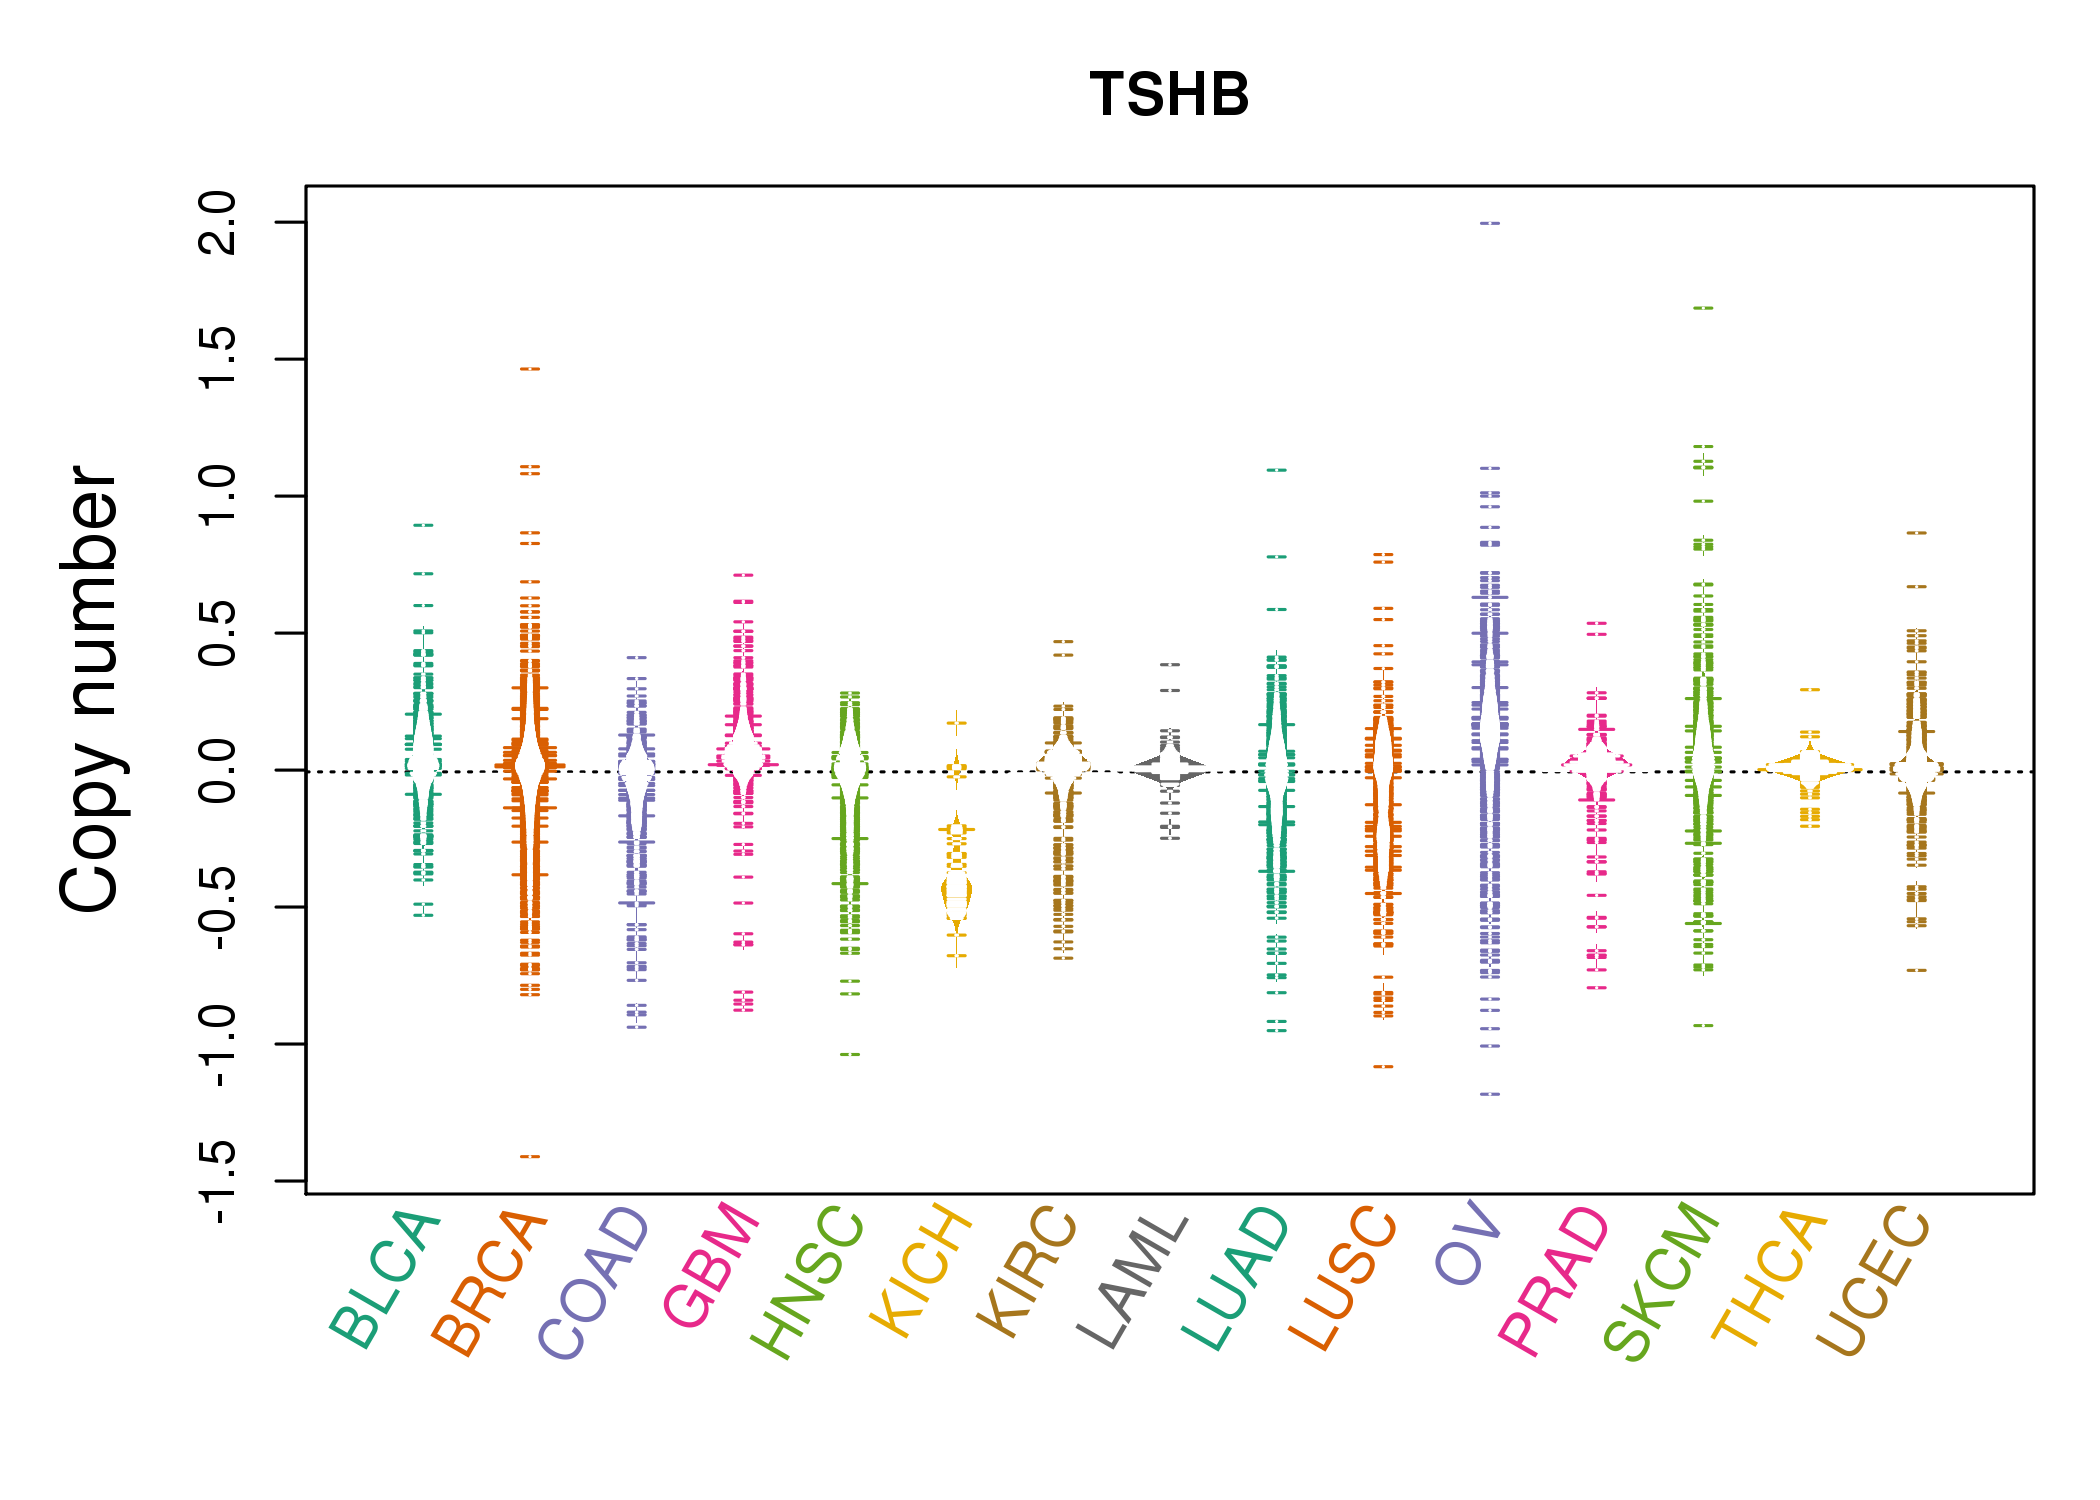 |
| cf) Tissue ID[Tissue type]: BLCA[Bladder Urothelial Carcinoma], BRCA[Breast invasive carcinoma], CESC[Cervical squamous cell carcinoma and endocervical adenocarcinoma], COAD[Colon adenocarcinoma], GBM[Glioblastoma multiforme], Glioma Low Grade, HNSC[Head and Neck squamous cell carcinoma], KICH[Kidney Chromophobe], KIRC[Kidney renal clear cell carcinoma], KIRP[Kidney renal papillary cell carcinoma], LAML[Acute Myeloid Leukemia], LUAD[Lung adenocarcinoma], LUSC[Lung squamous cell carcinoma], OV[Ovarian serous cystadenocarcinoma ], PAAD[Pancreatic adenocarcinoma], PRAD[Prostate adenocarcinoma], SKCM[Skin Cutaneous Melanoma], STAD[Stomach adenocarcinoma], THCA[Thyroid carcinoma], UCEC[Uterine Corpus Endometrial Carcinoma] |
| Top |
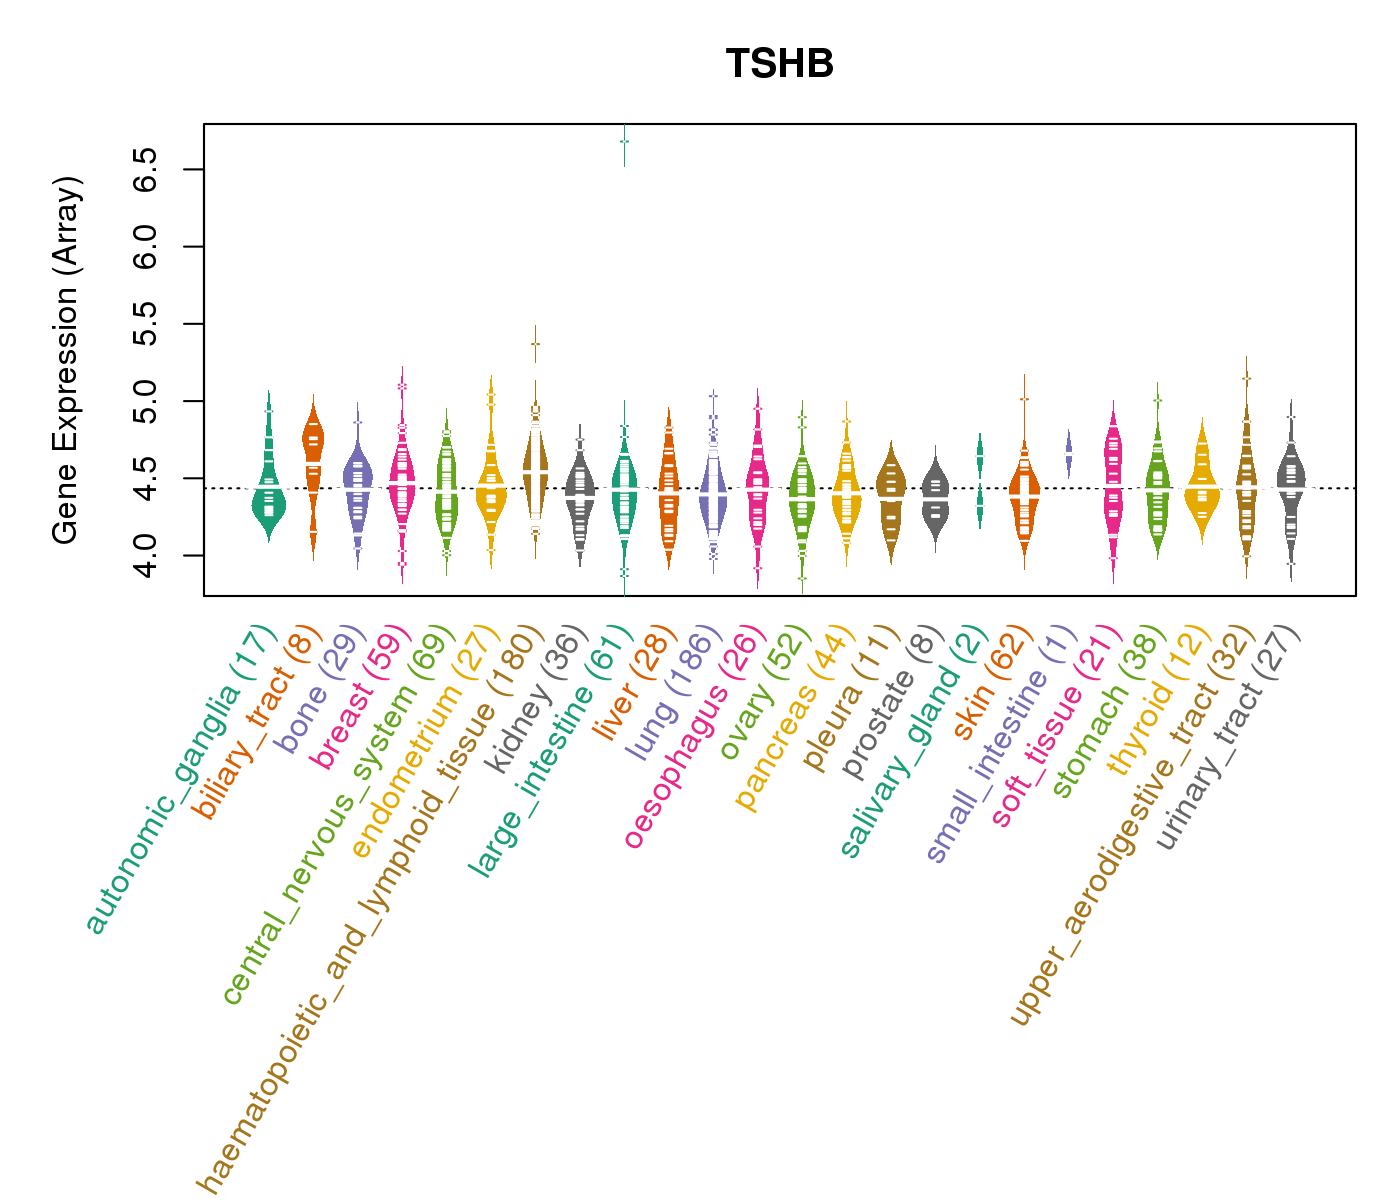
| Gene Expression for TSHB |
| * CCLE gene expression data were extracted from CCLE_Expression_Entrez_2012-10-18.res: Gene-centric RMA-normalized mRNA expression data. |
 |
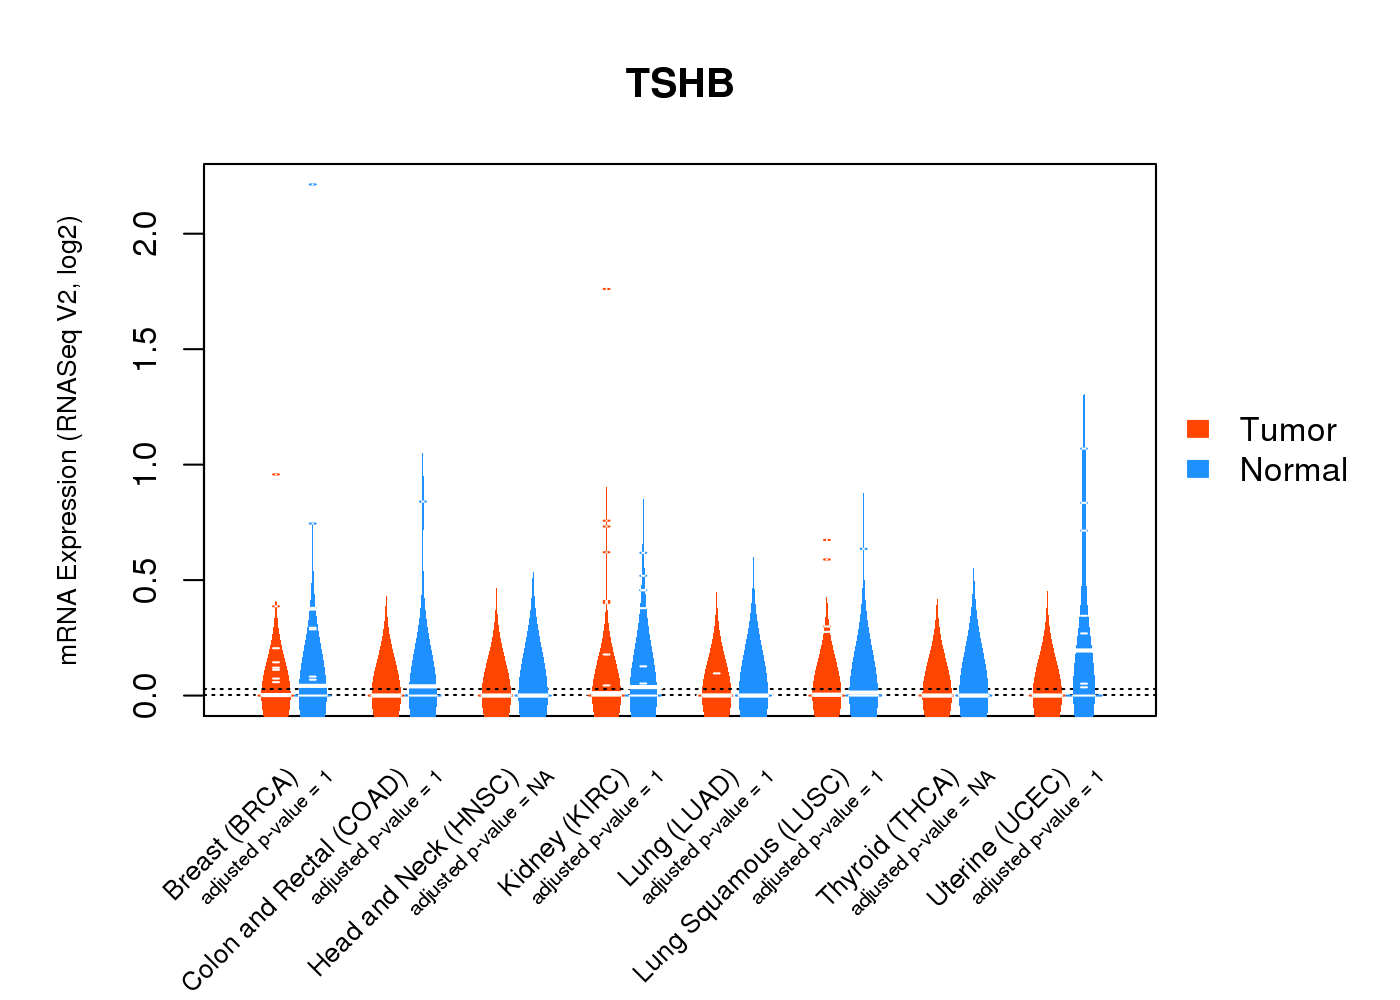
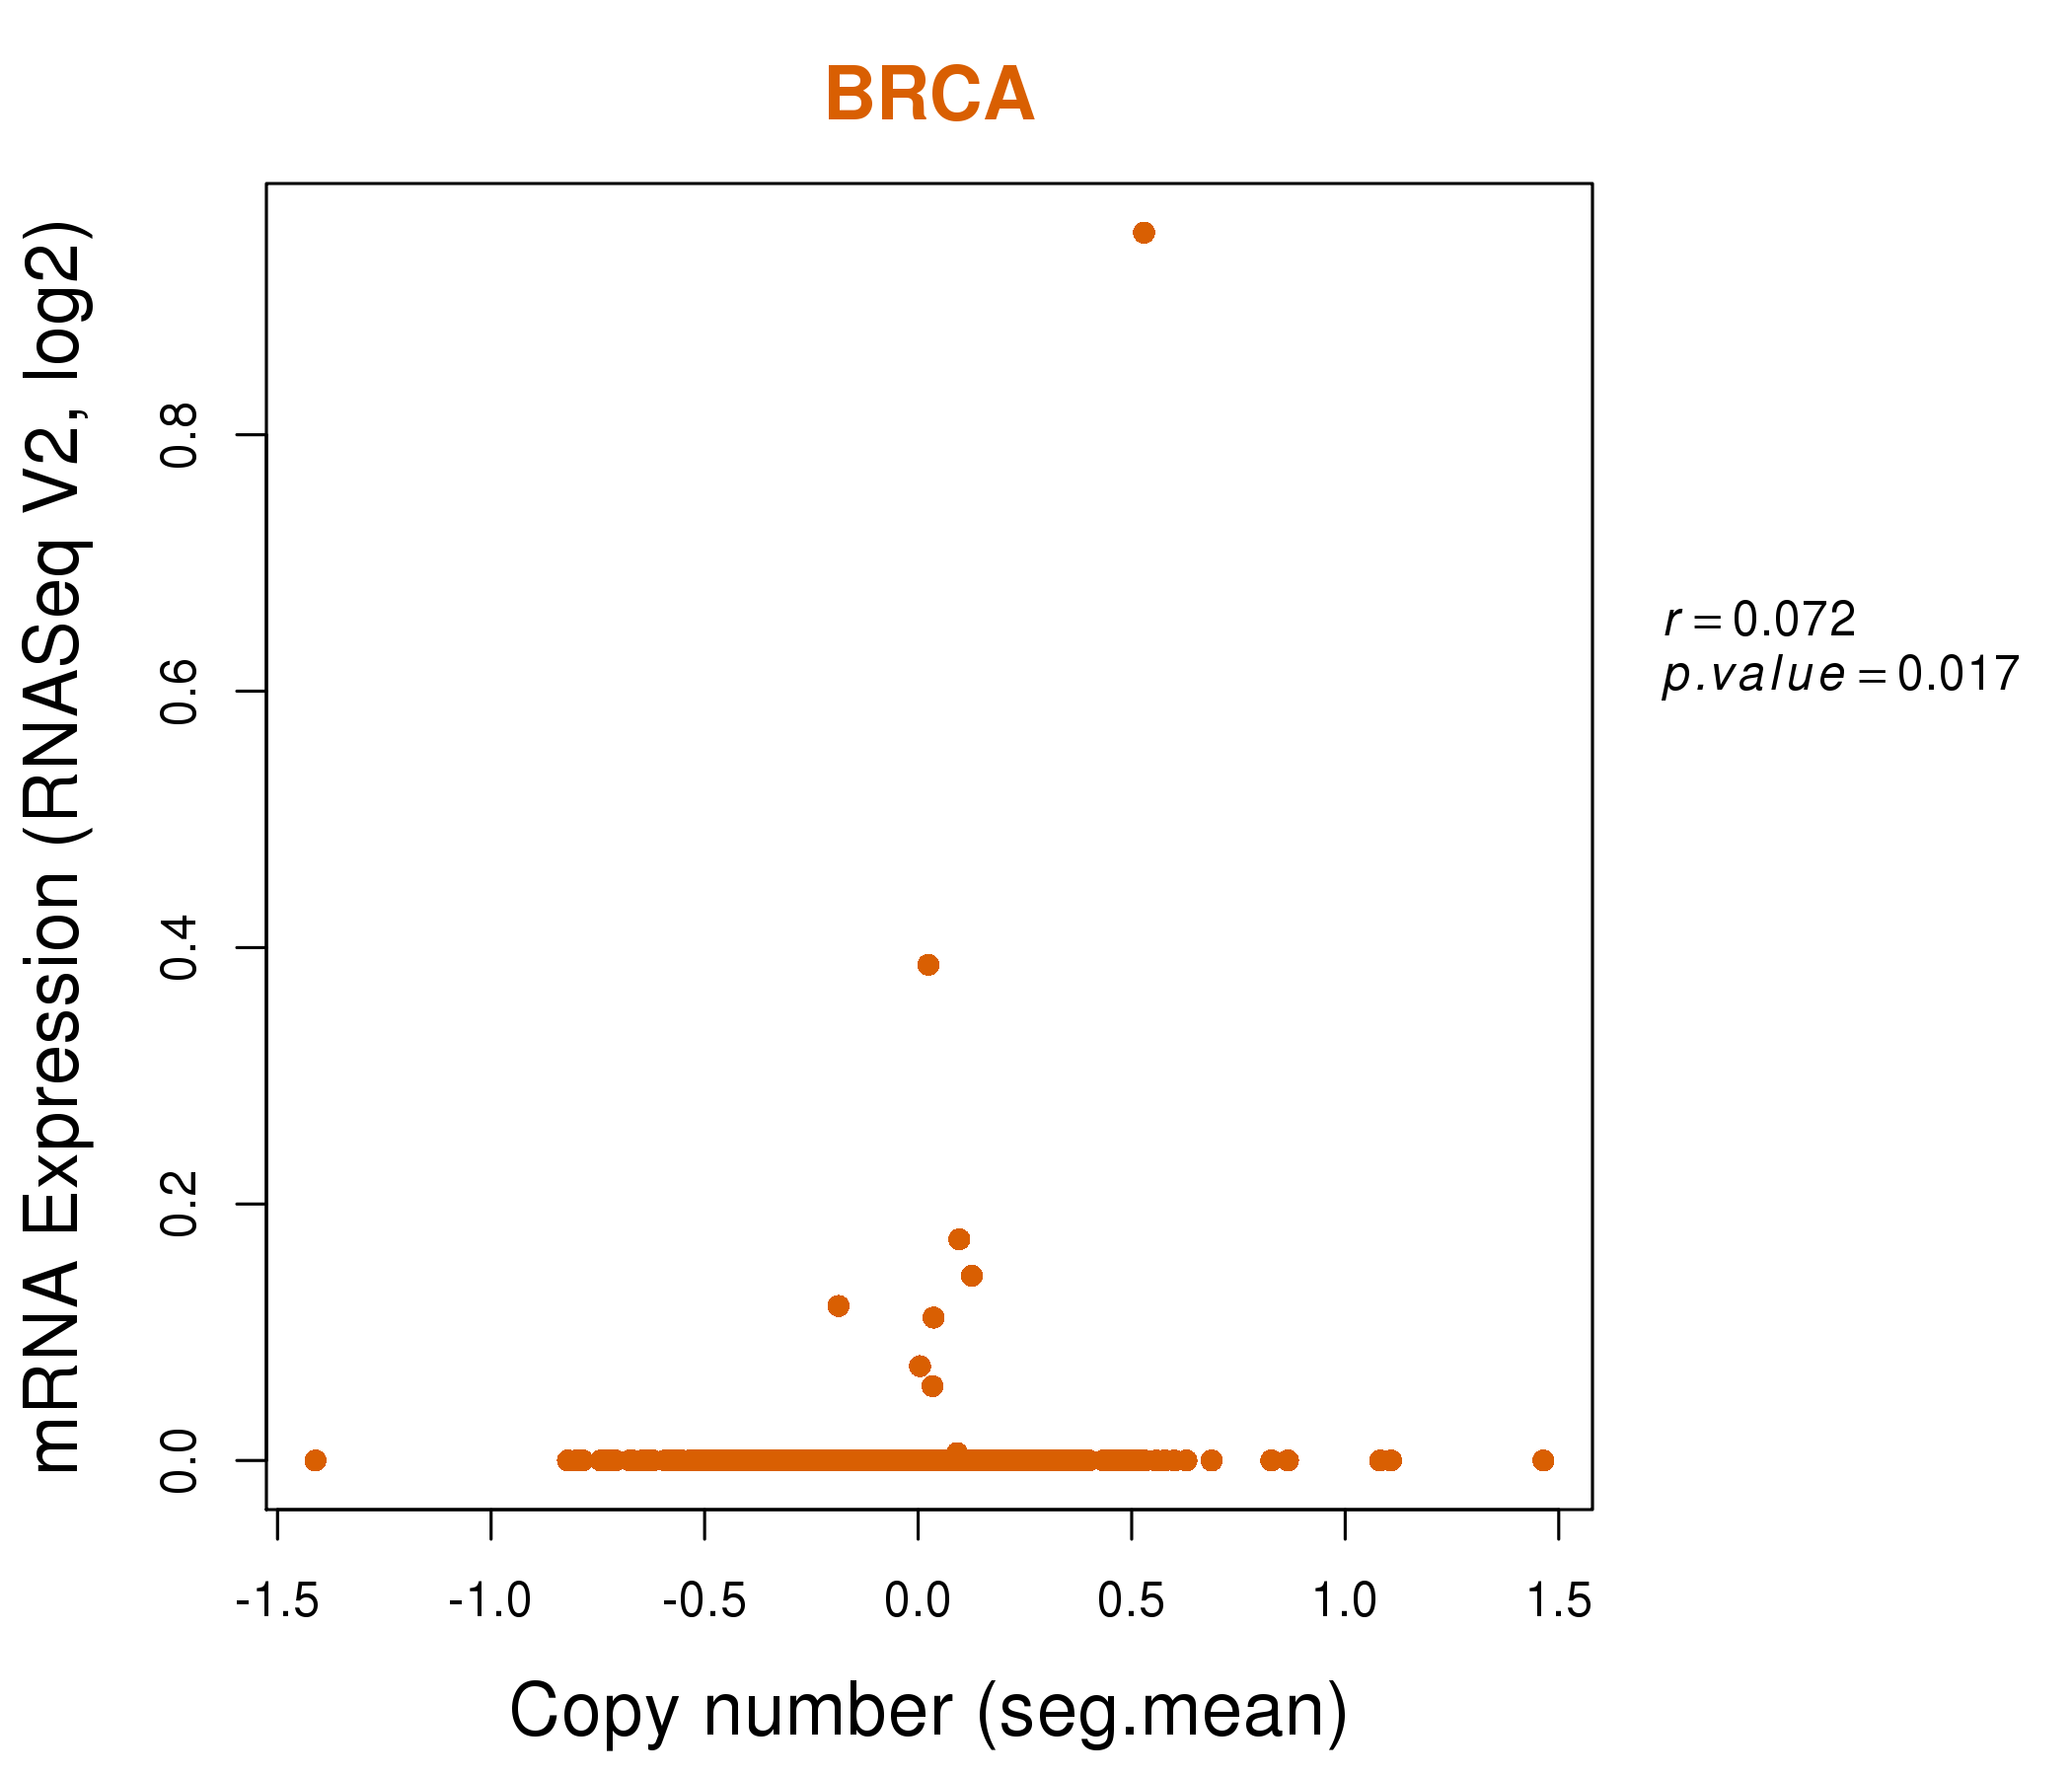
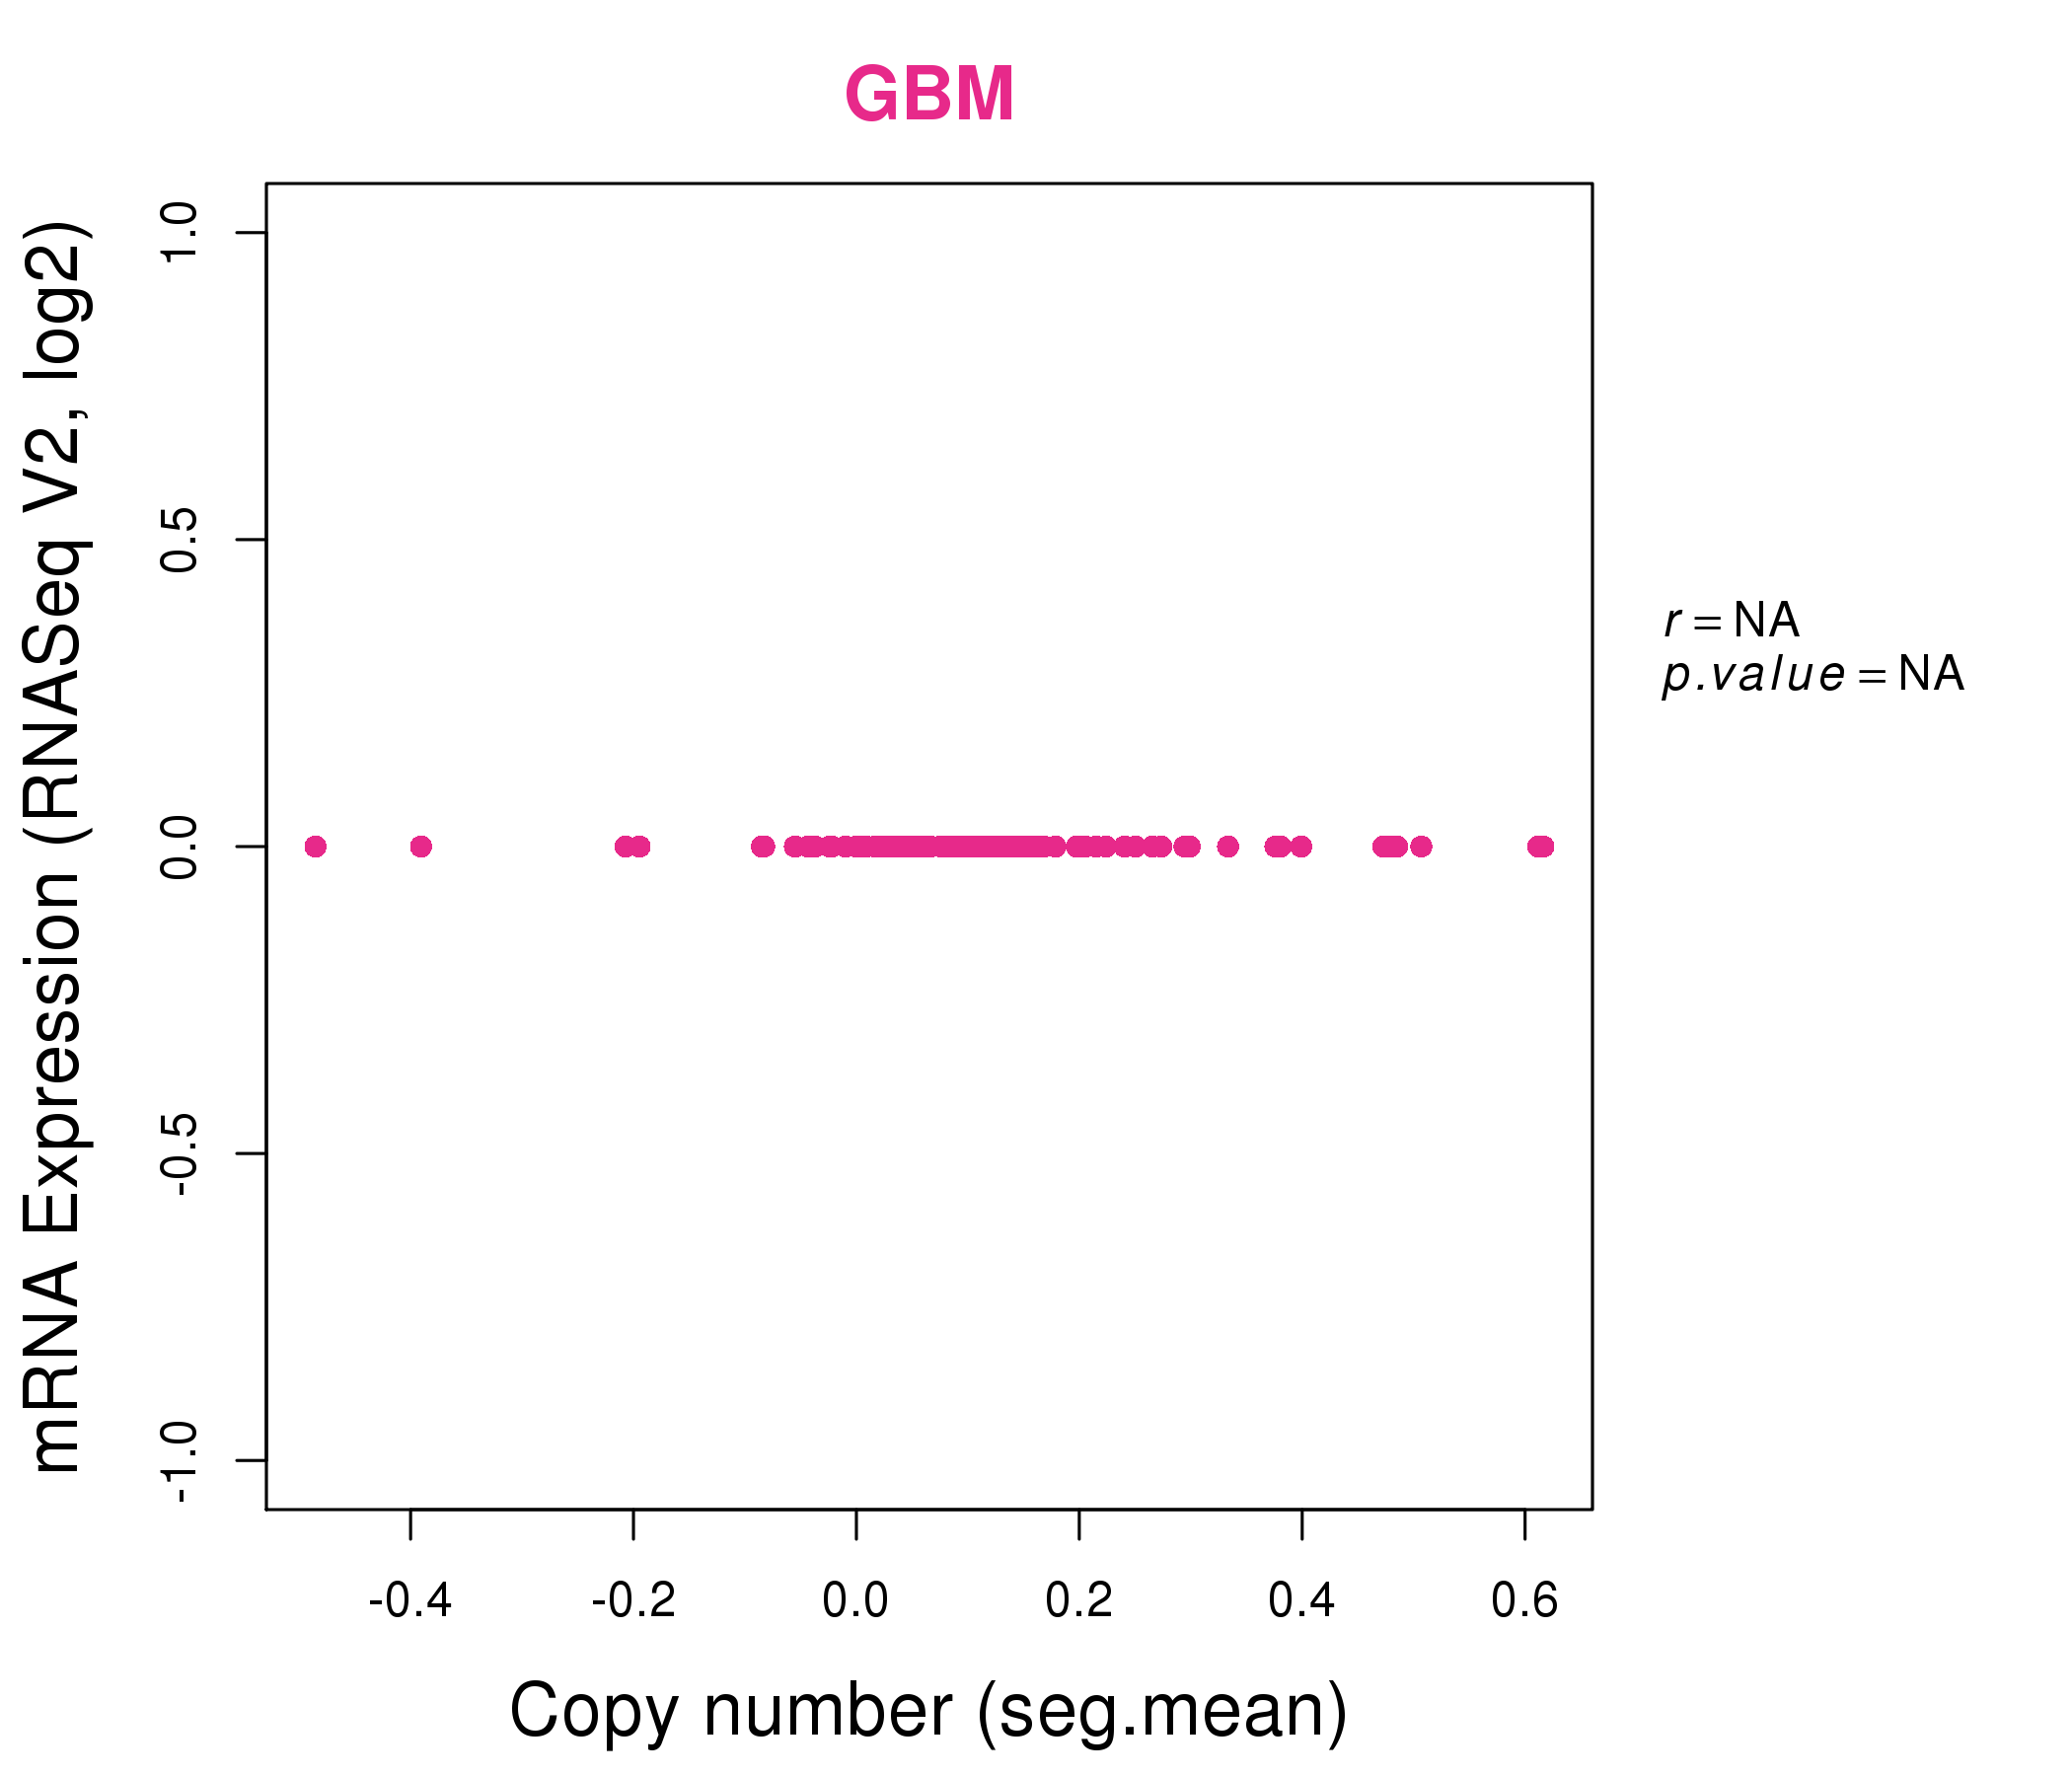
| * Normalized gene expression data of RNASeqV2 was extracted from TCGA using R package TCGA-Assembler. The URLs of all public data files on TCGA DCC data server were gathered at Jan-05-2015. Only eight cancer types have enough normal control samples for differential expression analysis. (t test, adjusted p<0.05 (using Benjamini-Hochberg FDR)) |
 |
| Top |
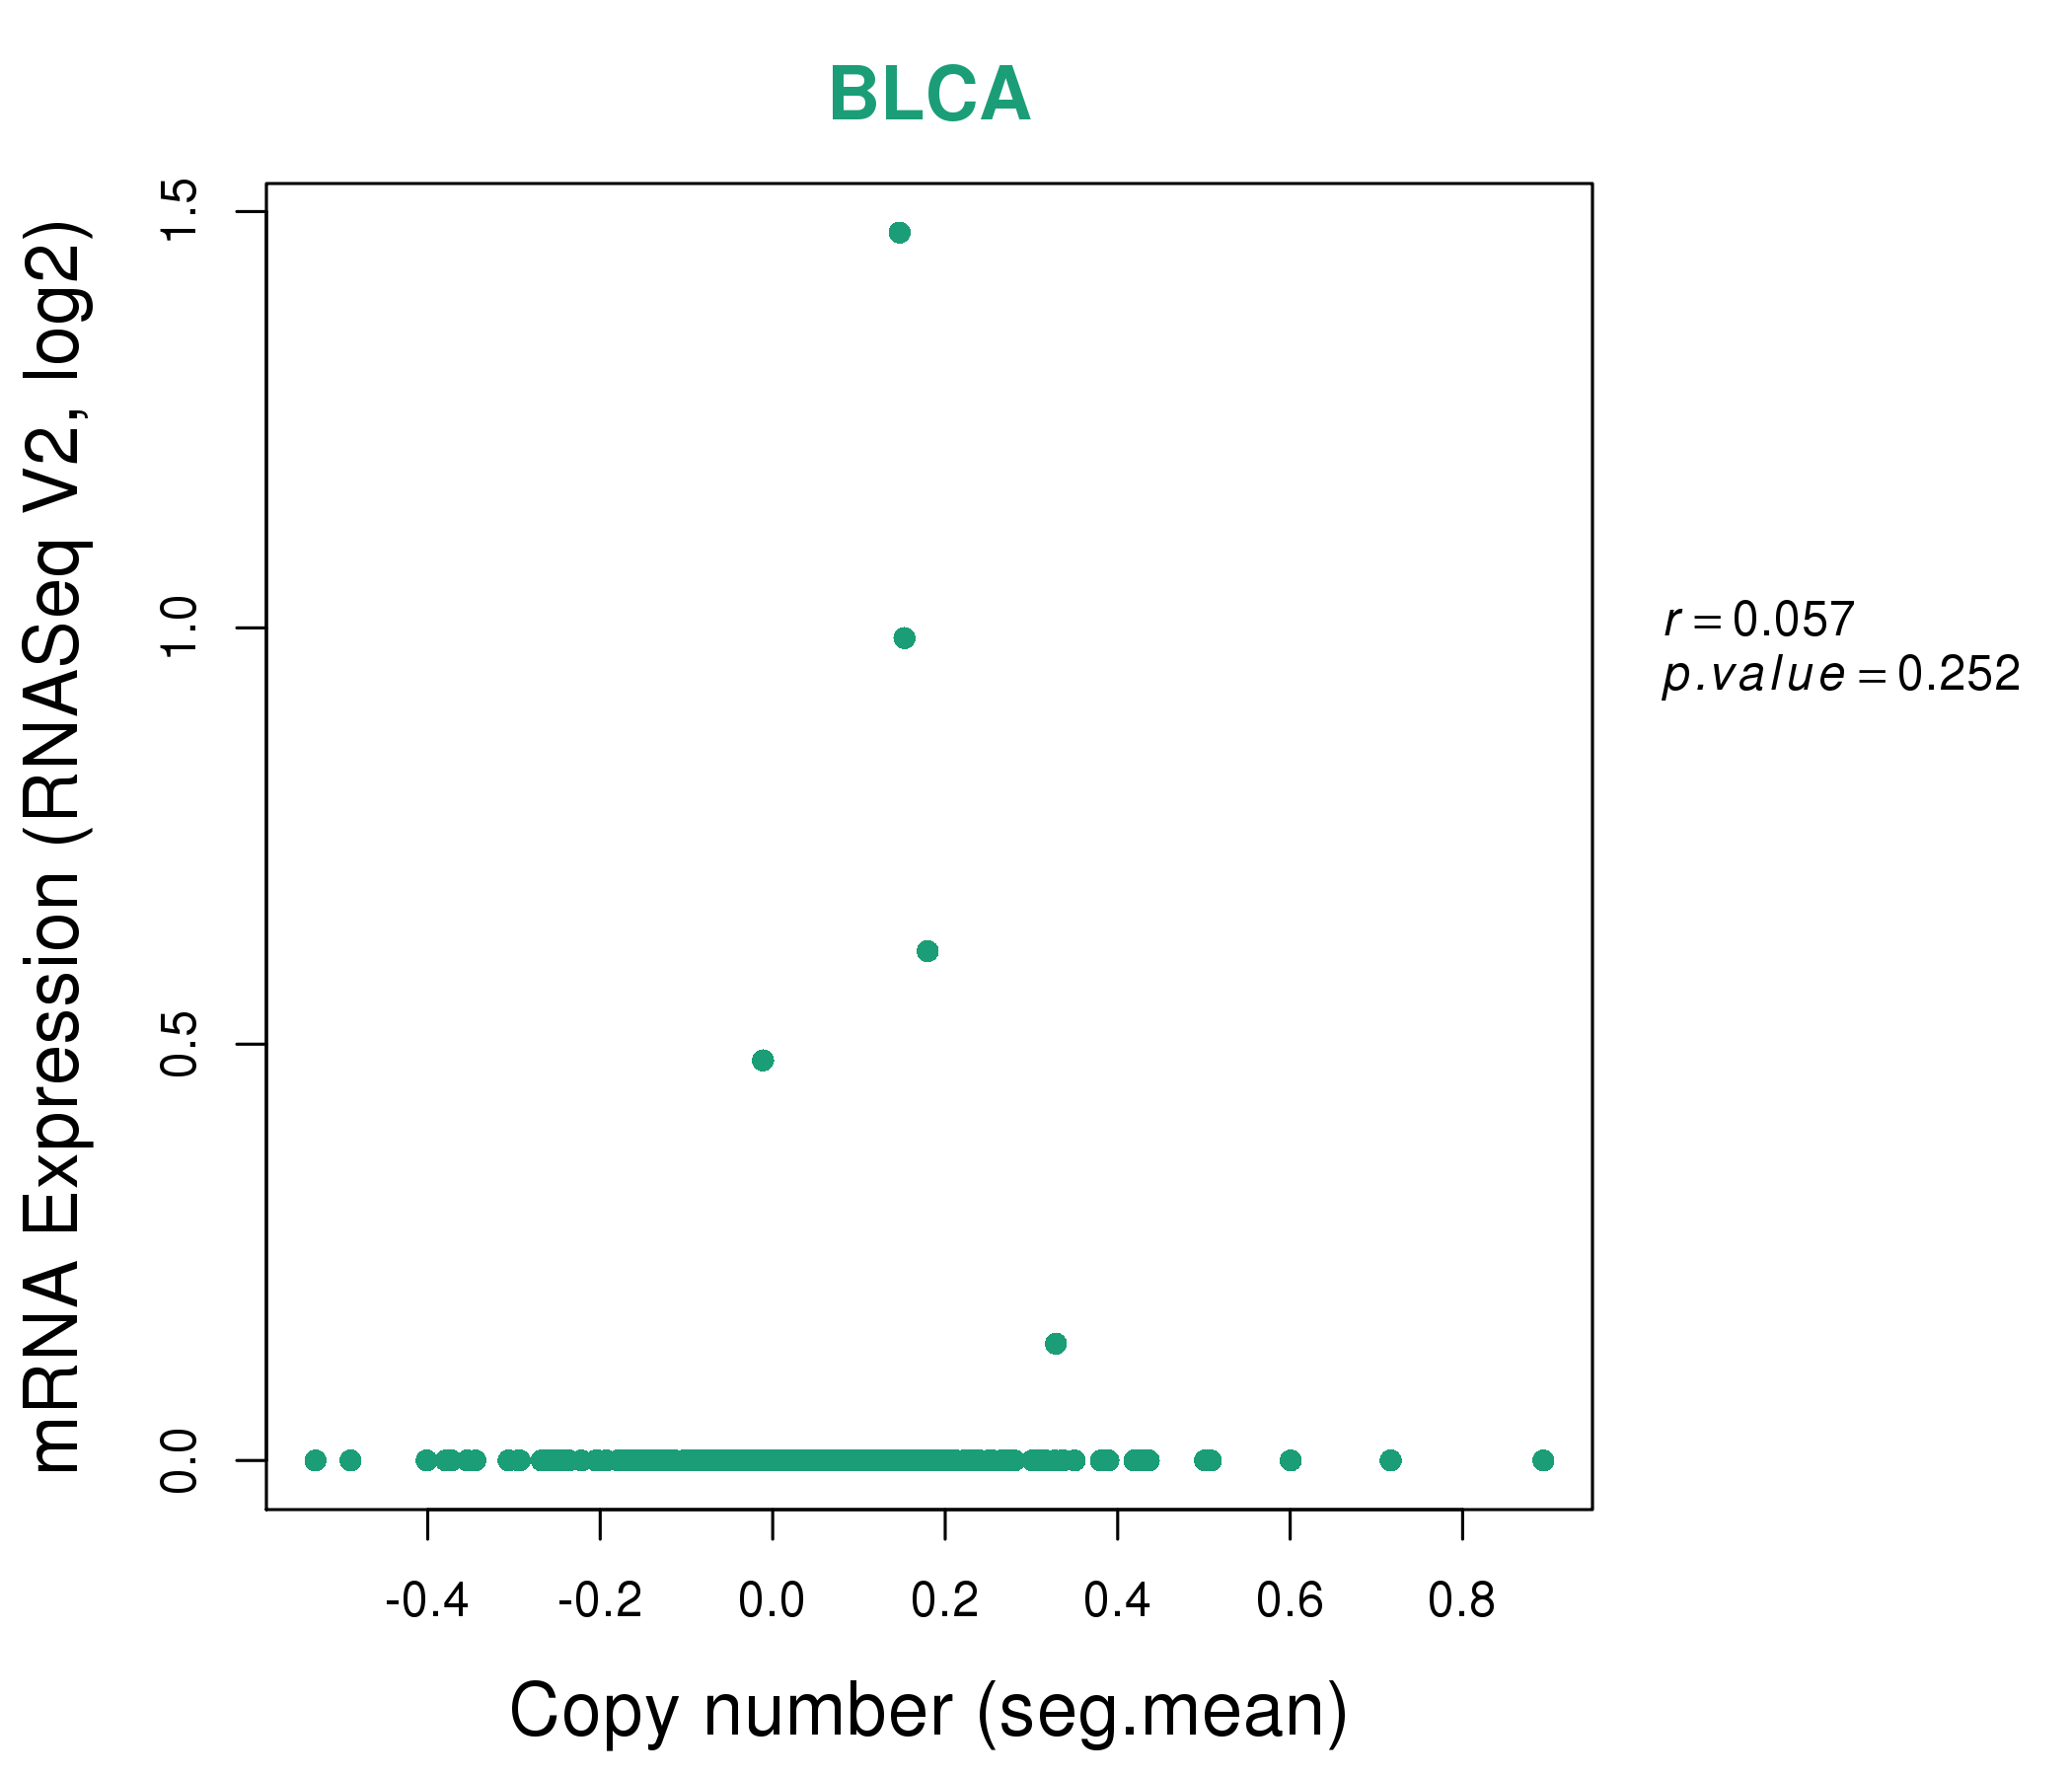
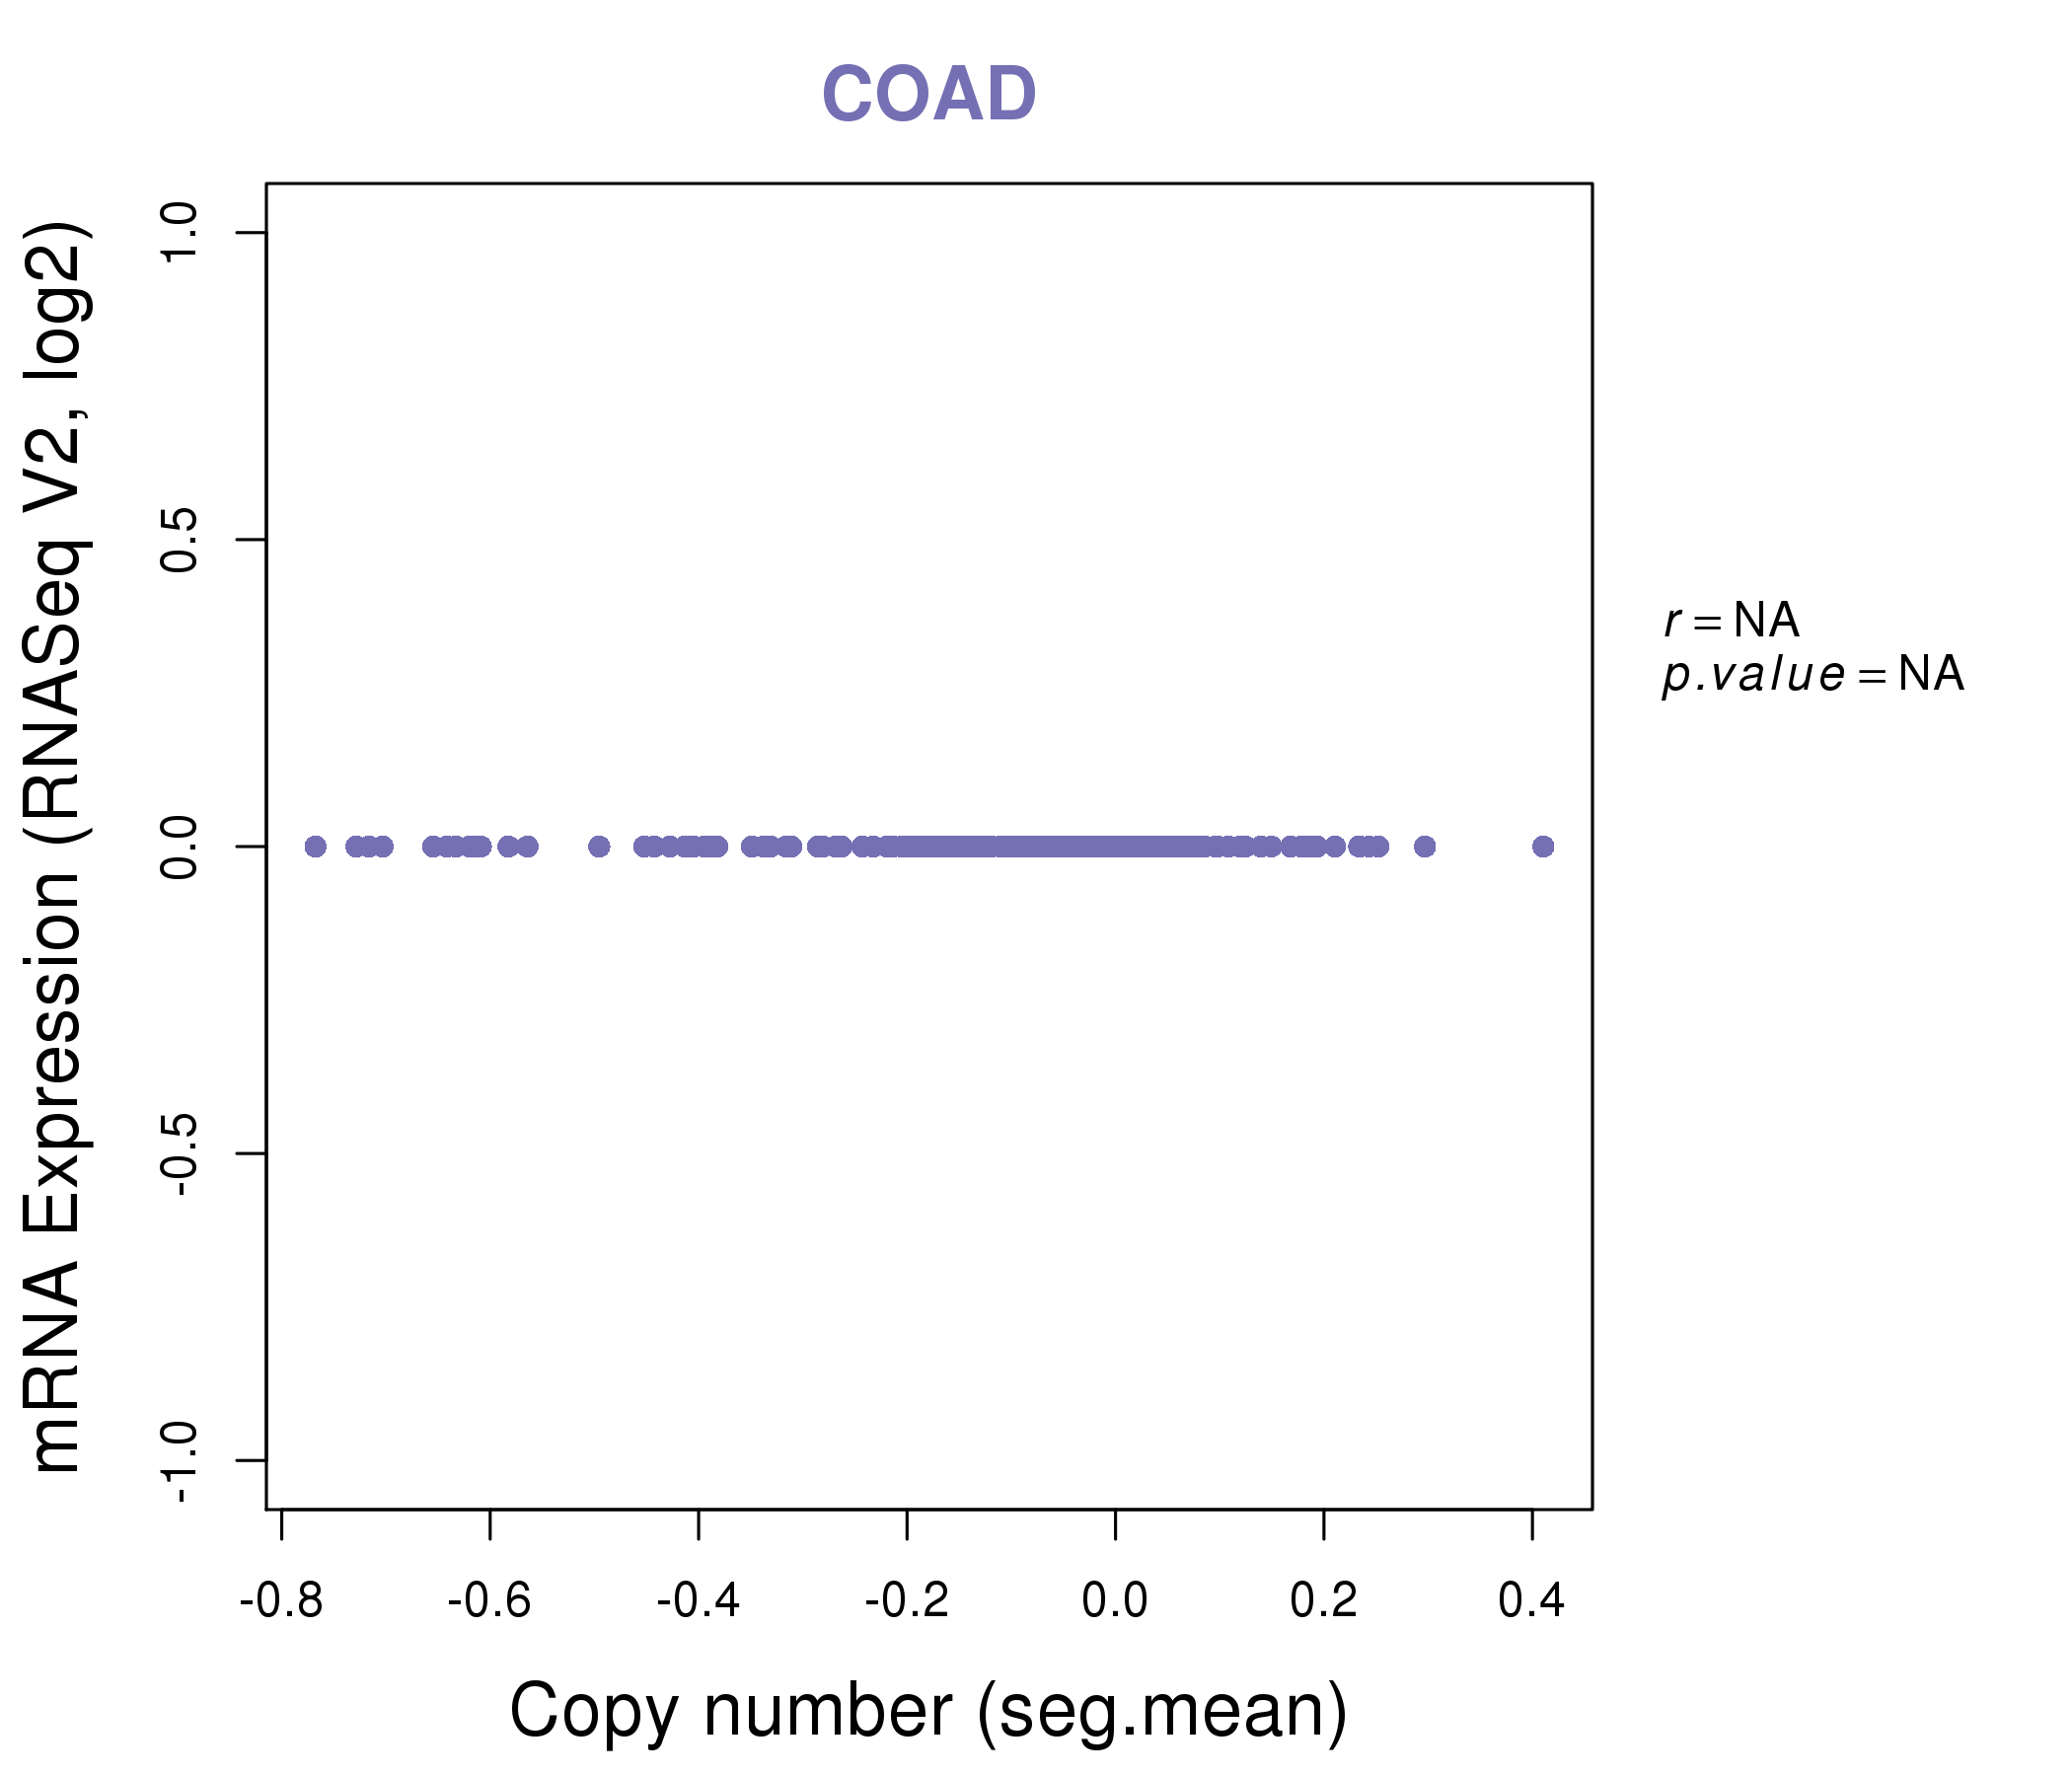
| * This plots show the correlation between CNV and gene expression. |
: Open all plots for all cancer types
 |
|
 |
|
| Top |
| Gene-Gene Network Information |
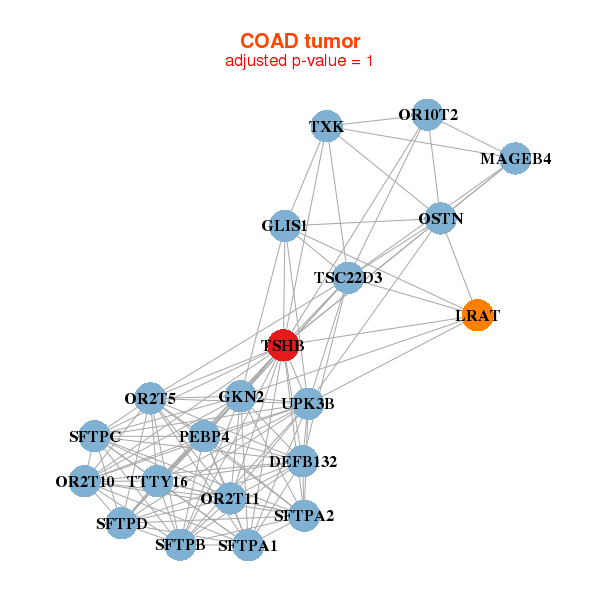
| * Co-Expression network figures were drawn using R package igraph. Only the top 20 genes with the highest correlations were shown. Red circle: input gene, orange circle: cell metabolism gene, sky circle: other gene |
: Open all plots for all cancer types
 |
| ||||
| ACTRT2,ARHGAP20,ARL10,COL14A1,CORO2B,EVX2,GLI2, GPX6,HAPLN4,IGF1,JPH4,LAMA2,LIX1,MYLK, NLGN3,NRXN2,NUP210L,PPP1R12B,PTGIS,SCN7A,TSHB | ANKRD7,PLET1,C9orf84,CCL27,CPN1,DEFB109P1B,GJA10, HIST1H1T,KRT84,LINC00159,OR1F1,OR1L1,OTOP3,PPY, RPTN,SNORA22,SNORA71D,SNORD15A,TSHB,UGT2A1,ZNRF4 | ||||
 |
| ||||
| DEFB132,GKN2,GLIS1,LRAT,MAGEB4,OR10T2,OR2T10, OR2T11,OR2T5,OSTN,PEBP4,SFTPA1,SFTPA2,SFTPB, SFTPC,SFTPD,TSC22D3,TSHB,TTTY16,TXK,UPK3B | ATXN8OS,LINC00301,C12orf50,SHCBP1L,C1QL4,CLPSL2,CYMP, SPATA31D1,GLYAT,LOC100130274,LOC388387,MMP20,OR52D1,PMCHL1, PRB2,PRKAG3,S100G,SNORD115-26,TAAR8,TSHB,USP17L9P |

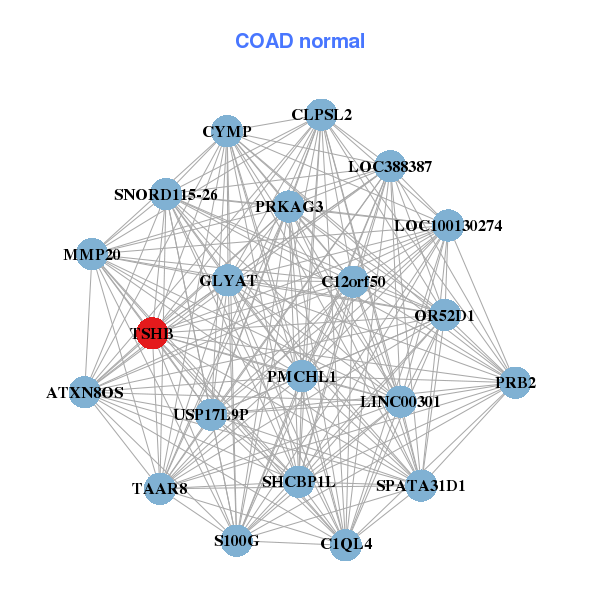
| * Co-Expression network figures were drawn using R package igraph. Only the top 20 genes with the highest correlations were shown. Red circle: input gene, orange circle: cell metabolism gene, sky circle: other gene |
: Open all plots for all cancer types
| Top |
: Open all interacting genes' information including KEGG pathway for all interacting genes from DAVID
| Top |
| Pharmacological Information for TSHB |
| DB Category | DB Name | DB's ID and Url link |
| * Gene Centered Interaction Network. |
 |
| * Drug Centered Interaction Network. |
| DrugBank ID | Target Name | Drug Groups | Generic Name | Drug Centered Network | Drug Structure |
| DB00451 | thyroid stimulating hormone, beta | approved | Levothyroxine | 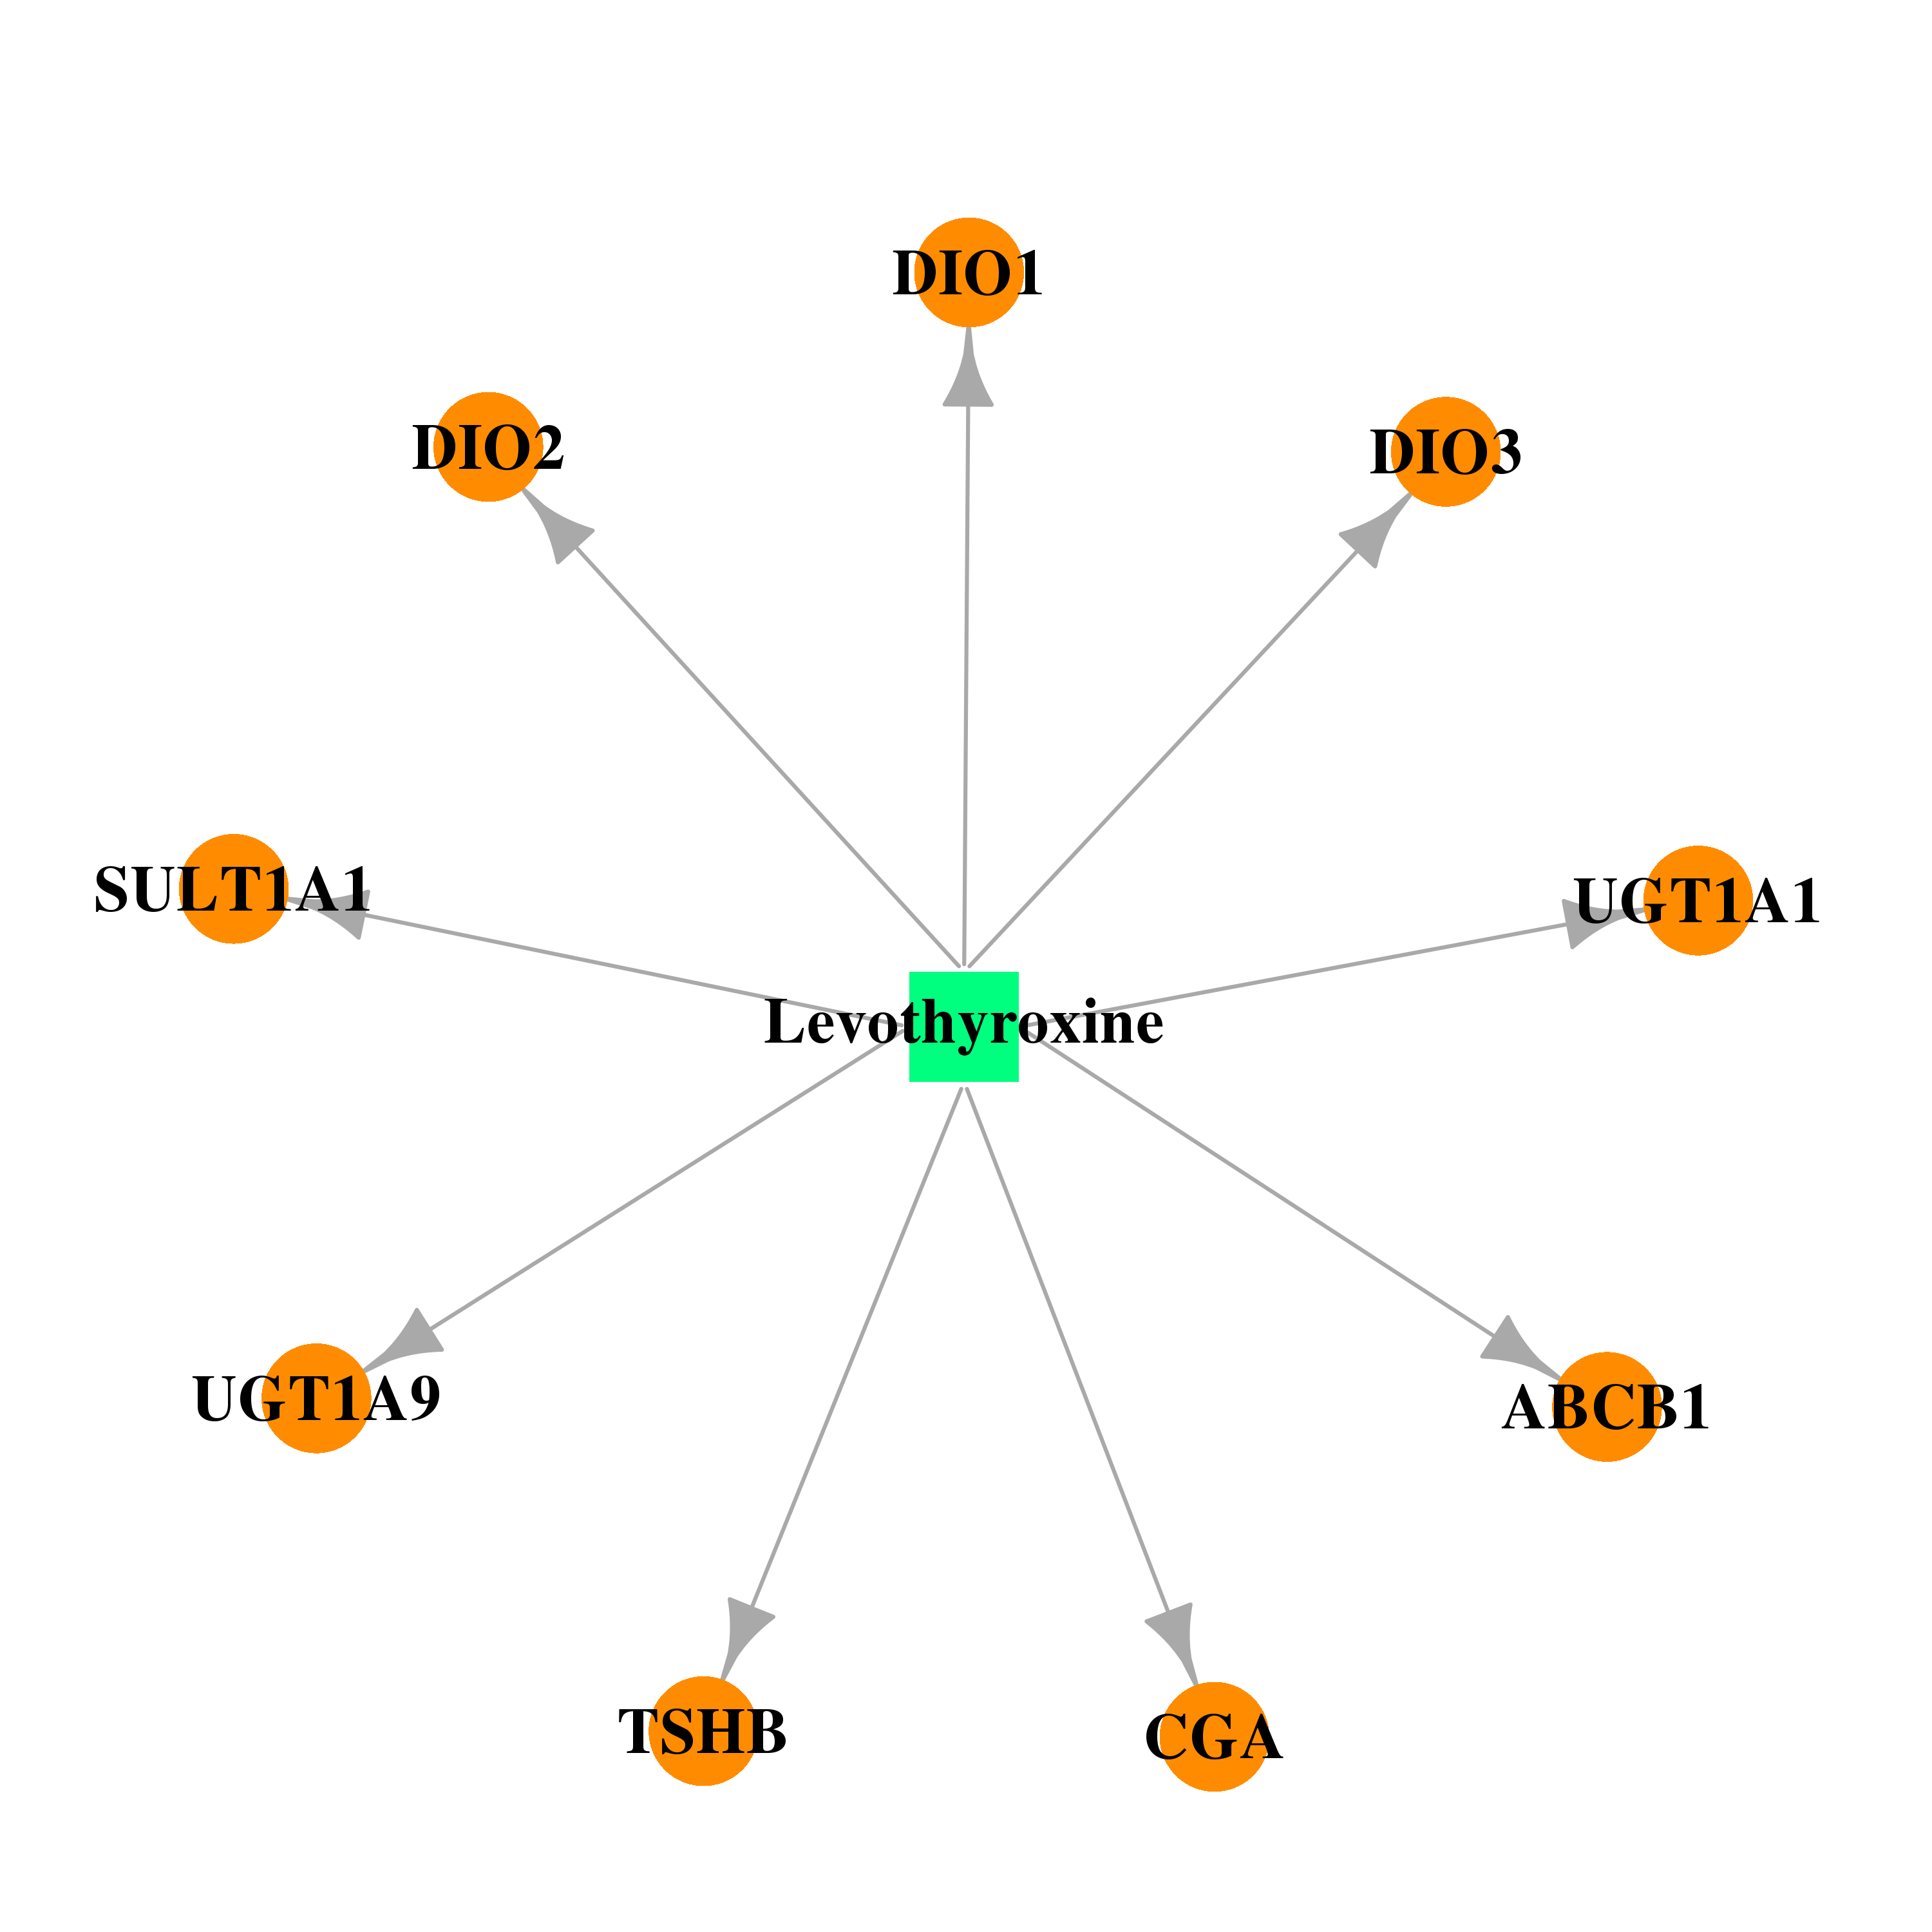 | 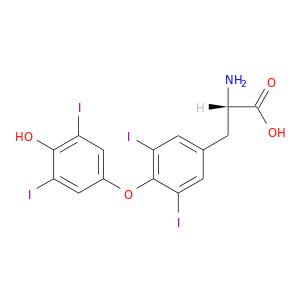 |
| Top |
| Cross referenced IDs for TSHB |
| * We obtained these cross-references from Uniprot database. It covers 150 different DBs, 18 categories. http://www.uniprot.org/help/cross_references_section |
: Open all cross reference information
|
Copyright © 2016-Present - The Univsersity of Texas Health Science Center at Houston @ |