|
||||||||||||||||||||
| |
| Phenotypic Information (metabolism pathway, cancer, disease, phenome) |
| |
| |
| Gene-Gene Network Information: Co-Expression Network, Interacting Genes & KEGG |
| |
|


| Gene Summary for TUBA3C |
| Top |
| Phenotypic Information for TUBA3C(metabolism pathway, cancer, disease, phenome) |
| Cancer | CGAP: TUBA3C |
| Familial Cancer Database: TUBA3C | |
| * This gene is included in those cancer gene databases. |
|
|
|
|
|
| . | ||||||||||||||
Oncogene 1 | Significant driver gene in | |||||||||||||||||||
| cf) number; DB name 1 Oncogene; http://nar.oxfordjournals.org/content/35/suppl_1/D721.long, 2 Tumor Suppressor gene; https://bioinfo.uth.edu/TSGene/, 3 Cancer Gene Census; http://www.nature.com/nrc/journal/v4/n3/abs/nrc1299.html, 4 CancerGenes; http://nar.oxfordjournals.org/content/35/suppl_1/D721.long, 5 Network of Cancer Gene; http://ncg.kcl.ac.uk/index.php, 1Therapeutic Vulnerabilities in Cancer; http://cbio.mskcc.org/cancergenomics/statius/ |
| REACTOME_METABOLISM_OF_PROTEINS | |
| OMIM | |
| Orphanet | |
| Disease | KEGG Disease: TUBA3C |
| MedGen: TUBA3C (Human Medical Genetics with Condition) | |
| ClinVar: TUBA3C | |
| Phenotype | MGI: TUBA3C (International Mouse Phenotyping Consortium) |
| PhenomicDB: TUBA3C | |
| Mutations for TUBA3C |
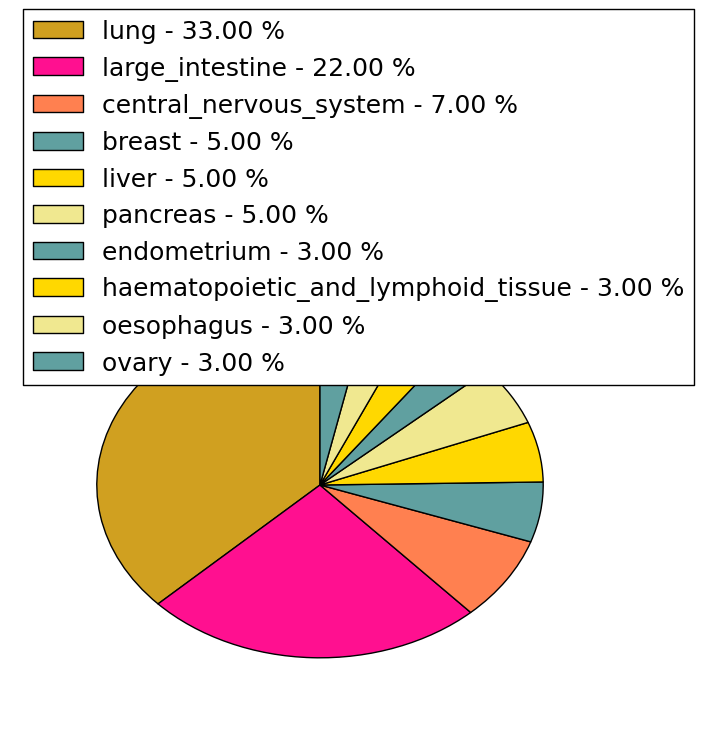
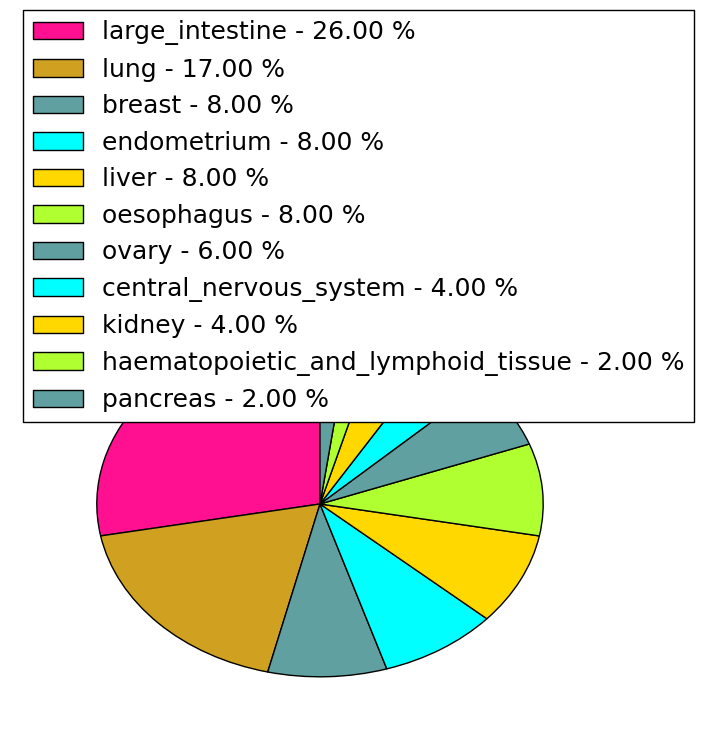
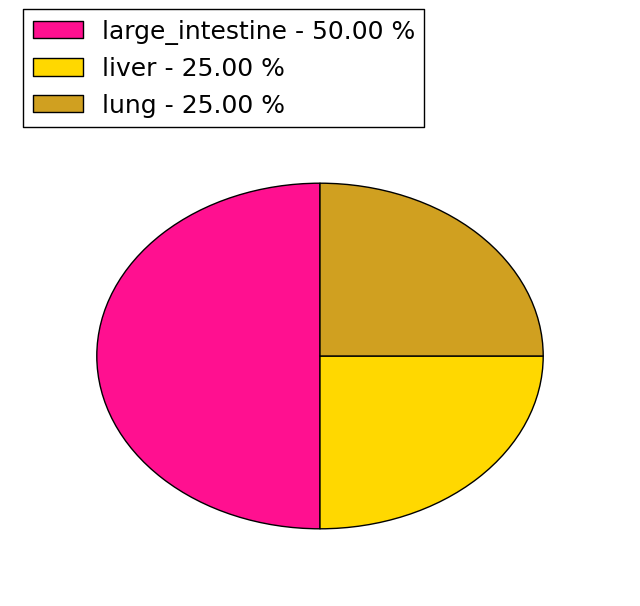
| * Under tables are showing count per each tissue to give us broad intuition about tissue specific mutation patterns.You can go to the detailed page for each mutation database's web site. |
| There's no structural variation information in COSMIC data for this gene. |
| * From mRNA Sanger sequences, Chitars2.0 arranged chimeric transcripts. This table shows TUBA3C related fusion information. |
| ID | Head Gene | Tail Gene | Accession | Gene_a | qStart_a | qEnd_a | Chromosome_a | tStart_a | tEnd_a | Gene_a | qStart_a | qEnd_a | Chromosome_a | tStart_a | tEnd_a |
| Top |
| There's no copy number variation information in COSMIC data for this gene. |
| Top |
|
 |
| Top |
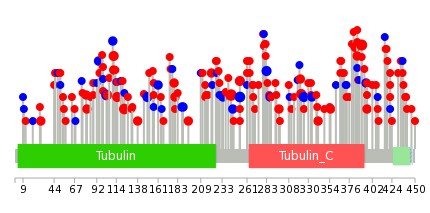
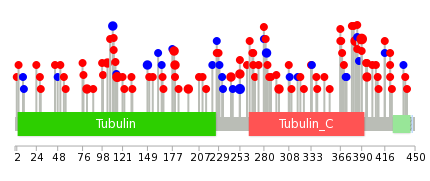
| Stat. for Non-Synonymous SNVs (# total SNVs=127) | (# total SNVs=45) |
 |  |
(# total SNVs=4) | (# total SNVs=1) |
 |  |
| Top |
| * When you move the cursor on each content, you can see more deailed mutation information on the Tooltip. Those are primary_site,primary_histology,mutation(aa),pubmedID. |
| GRCh37 position | Mutation(aa) | Unique sampleID count |
| chr13:19751395-19751395 | p.R243Q | 6 |
| chr13:19752452-19752452 | p.Y103* | 5 |
| chr13:19748188-19748188 | p.R390C | 5 |
| chr13:19751364-19751364 | p.T253T | 4 |
| chr13:19751365-19751365 | p.T253M | 4 |
| chr13:19752393-19752393 | p.R123H | 4 |
| chr13:19748202-19748202 | p.A385E | 3 |
| chr13:19751676-19751676 | p.F149F | 3 |
| chr13:19748209-19748209 | p.A383T | 3 |
| chr13:19748170-19748170 | p.D396H | 3 |
| Top |
|
 |
| Point Mutation/ Tissue ID | 1 | 2 | 3 | 4 | 5 | 6 | 7 | 8 | 9 | 10 | 11 | 12 | 13 | 14 | 15 | 16 | 17 | 18 | 19 | 20 |
| # sample | 3 | 6 | 1 | 26 | 6 | 5 | 2 | 3 | 16 | 9 | 4 | 3 | 30 | 6 | 1 | 5 | ||||
| # mutation | 3 | 6 | 1 | 24 | 6 | 5 | 1 | 3 | 17 | 9 | 3 | 3 | 30 | 6 | 1 | 7 | ||||
| nonsynonymous SNV | 3 | 3 | 1 | 21 | 6 | 5 | 2 | 15 | 8 | 2 | 2 | 19 | 6 | 1 | 4 | |||||
| synonymous SNV | 3 | 3 | 1 | 1 | 2 | 1 | 1 | 1 | 11 | 3 |
| cf) Tissue ID; Tissue type (1; BLCA[Bladder Urothelial Carcinoma], 2; BRCA[Breast invasive carcinoma], 3; CESC[Cervical squamous cell carcinoma and endocervical adenocarcinoma], 4; COAD[Colon adenocarcinoma], 5; GBM[Glioblastoma multiforme], 6; Glioma Low Grade, 7; HNSC[Head and Neck squamous cell carcinoma], 8; KICH[Kidney Chromophobe], 9; KIRC[Kidney renal clear cell carcinoma], 10; KIRP[Kidney renal papillary cell carcinoma], 11; LAML[Acute Myeloid Leukemia], 12; LUAD[Lung adenocarcinoma], 13; LUSC[Lung squamous cell carcinoma], 14; OV[Ovarian serous cystadenocarcinoma ], 15; PAAD[Pancreatic adenocarcinoma], 16; PRAD[Prostate adenocarcinoma], 17; SKCM[Skin Cutaneous Melanoma], 18:STAD[Stomach adenocarcinoma], 19:THCA[Thyroid carcinoma], 20:UCEC[Uterine Corpus Endometrial Carcinoma]) |
| Top |
| * We represented just top 10 SNVs. When you move the cursor on each content, you can see more deailed mutation information on the Tooltip. Those are primary_site, primary_histology, mutation(aa), pubmedID. |
| Genomic Position | Mutation(aa) | Unique sampleID count |
| chr13:19748188 | p.R390C | 4 |
| chr13:19748209 | p.V115A | 3 |
| chr13:19748170 | p.T253T | 3 |
| chr13:19751364 | p.D396H | 3 |
| chr13:19752417 | p.A383T | 3 |
| chr13:19751676 | p.L195M | 2 |
| chr13:19751234 | p.E297K | 2 |
| chr13:19751584 | p.T253M | 2 |
| chr13:19751321 | p.A180V | 2 |
| chr13:19752451 | p.T179M | 2 |
| * Copy number data were extracted from TCGA using R package TCGA-Assembler. The URLs of all public data files on TCGA DCC data server were gathered on Jan-05-2015. Function ProcessCNAData in TCGA-Assembler package was used to obtain gene-level copy number value which is calculated as the average copy number of the genomic region of a gene. |
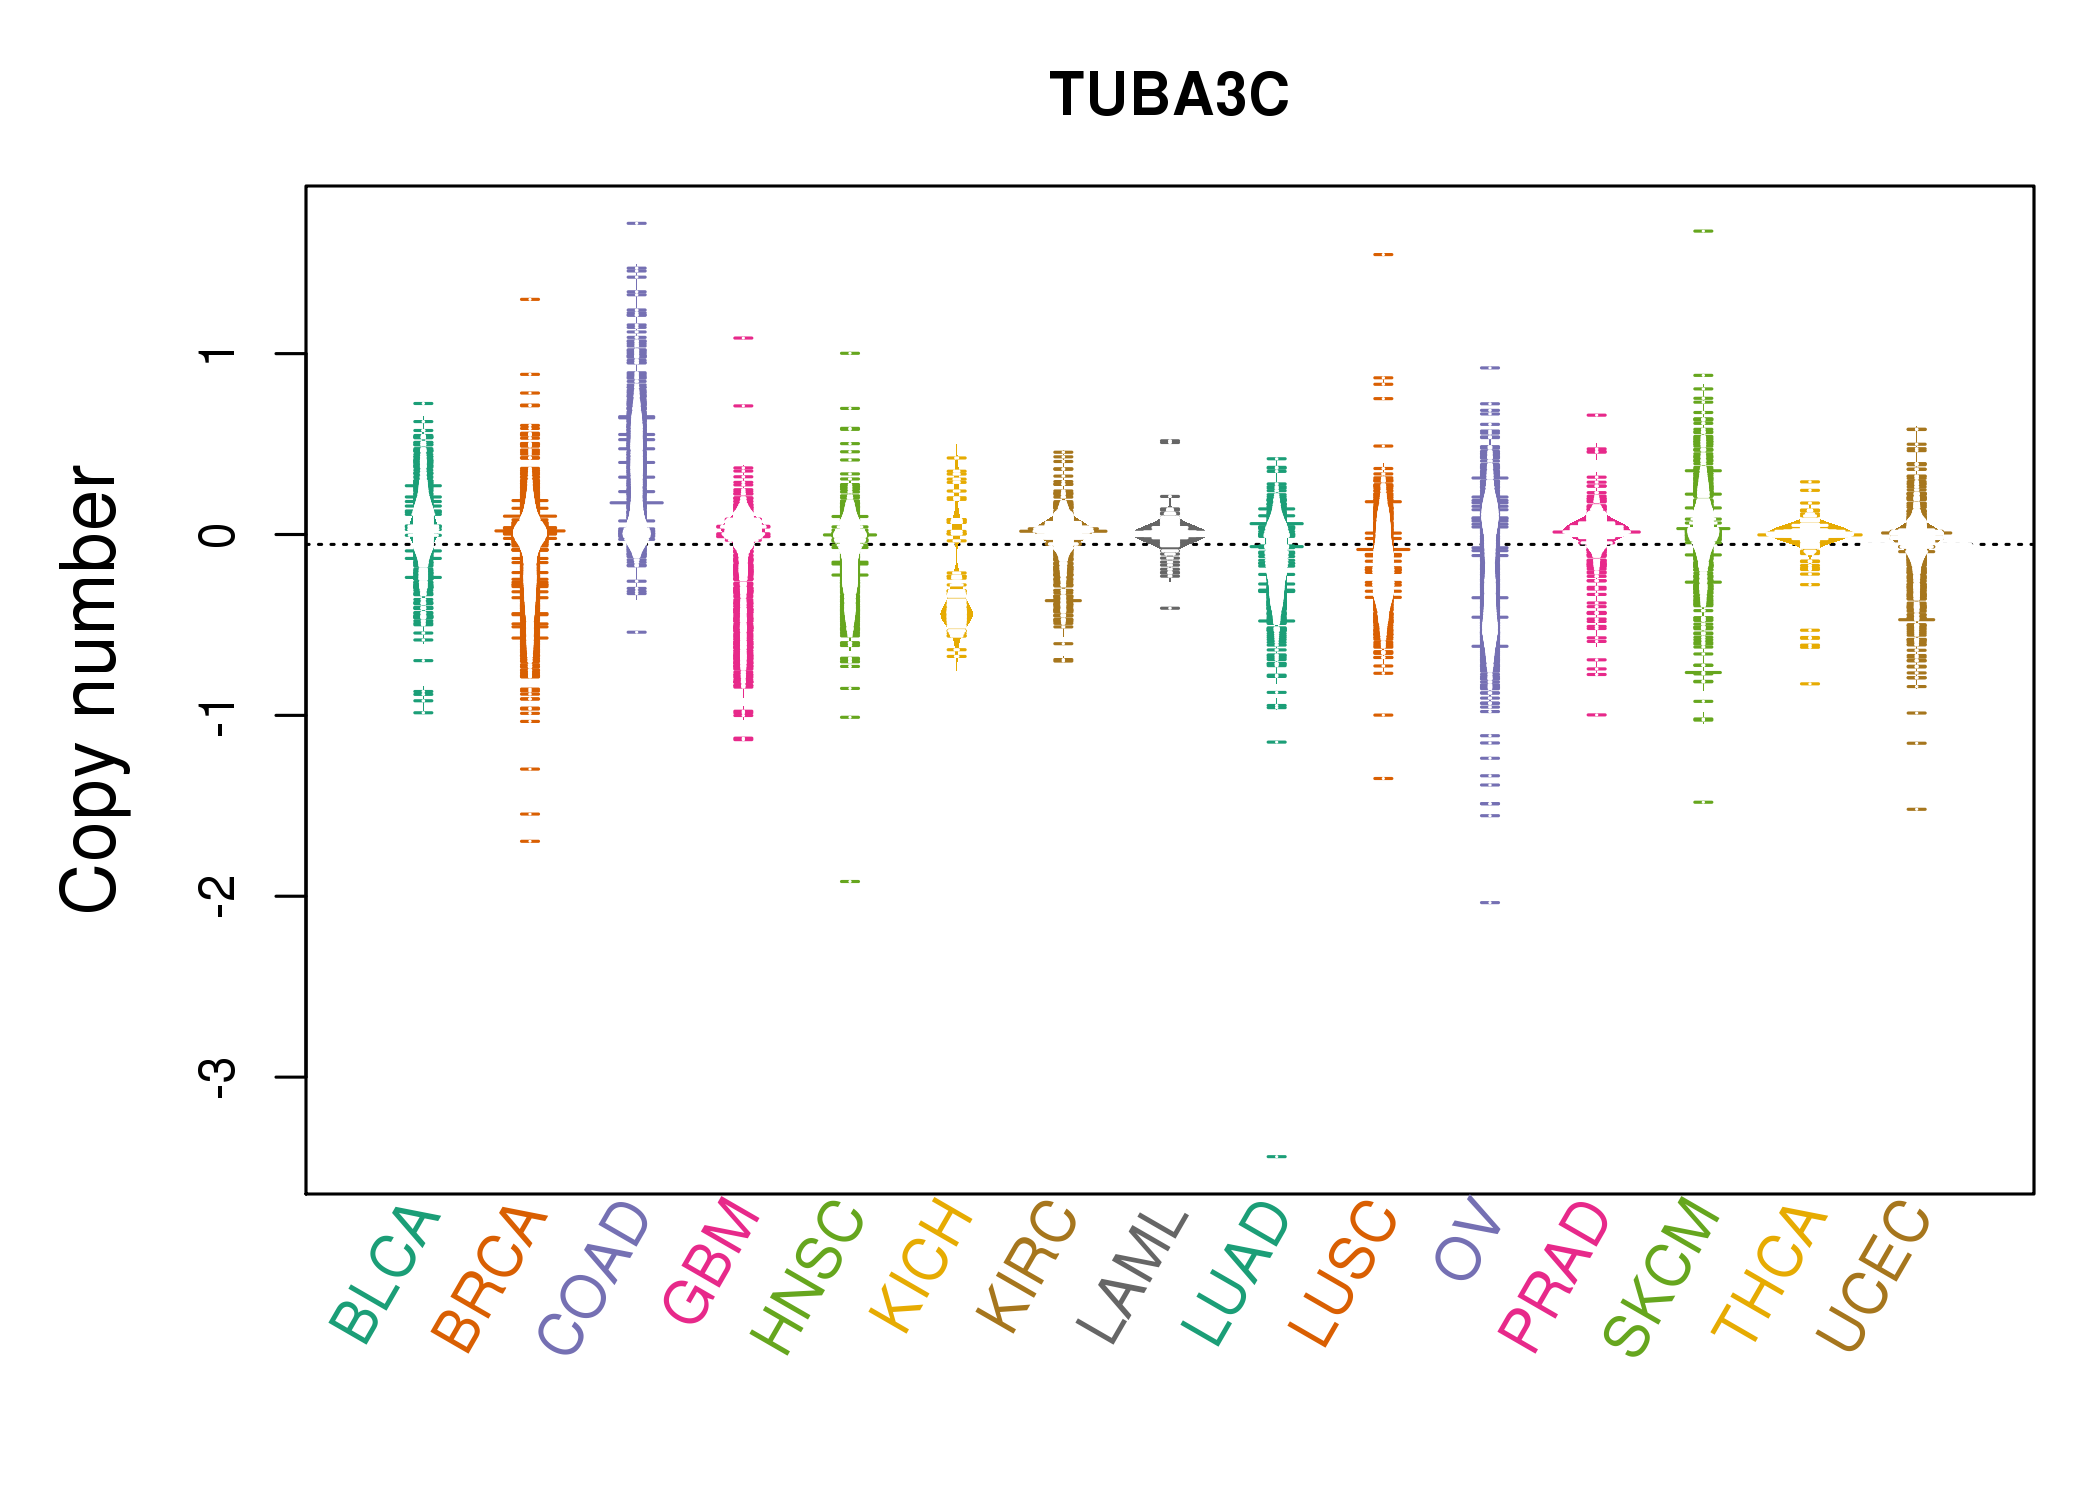 |
| cf) Tissue ID[Tissue type]: BLCA[Bladder Urothelial Carcinoma], BRCA[Breast invasive carcinoma], CESC[Cervical squamous cell carcinoma and endocervical adenocarcinoma], COAD[Colon adenocarcinoma], GBM[Glioblastoma multiforme], Glioma Low Grade, HNSC[Head and Neck squamous cell carcinoma], KICH[Kidney Chromophobe], KIRC[Kidney renal clear cell carcinoma], KIRP[Kidney renal papillary cell carcinoma], LAML[Acute Myeloid Leukemia], LUAD[Lung adenocarcinoma], LUSC[Lung squamous cell carcinoma], OV[Ovarian serous cystadenocarcinoma ], PAAD[Pancreatic adenocarcinoma], PRAD[Prostate adenocarcinoma], SKCM[Skin Cutaneous Melanoma], STAD[Stomach adenocarcinoma], THCA[Thyroid carcinoma], UCEC[Uterine Corpus Endometrial Carcinoma] |
| Top |
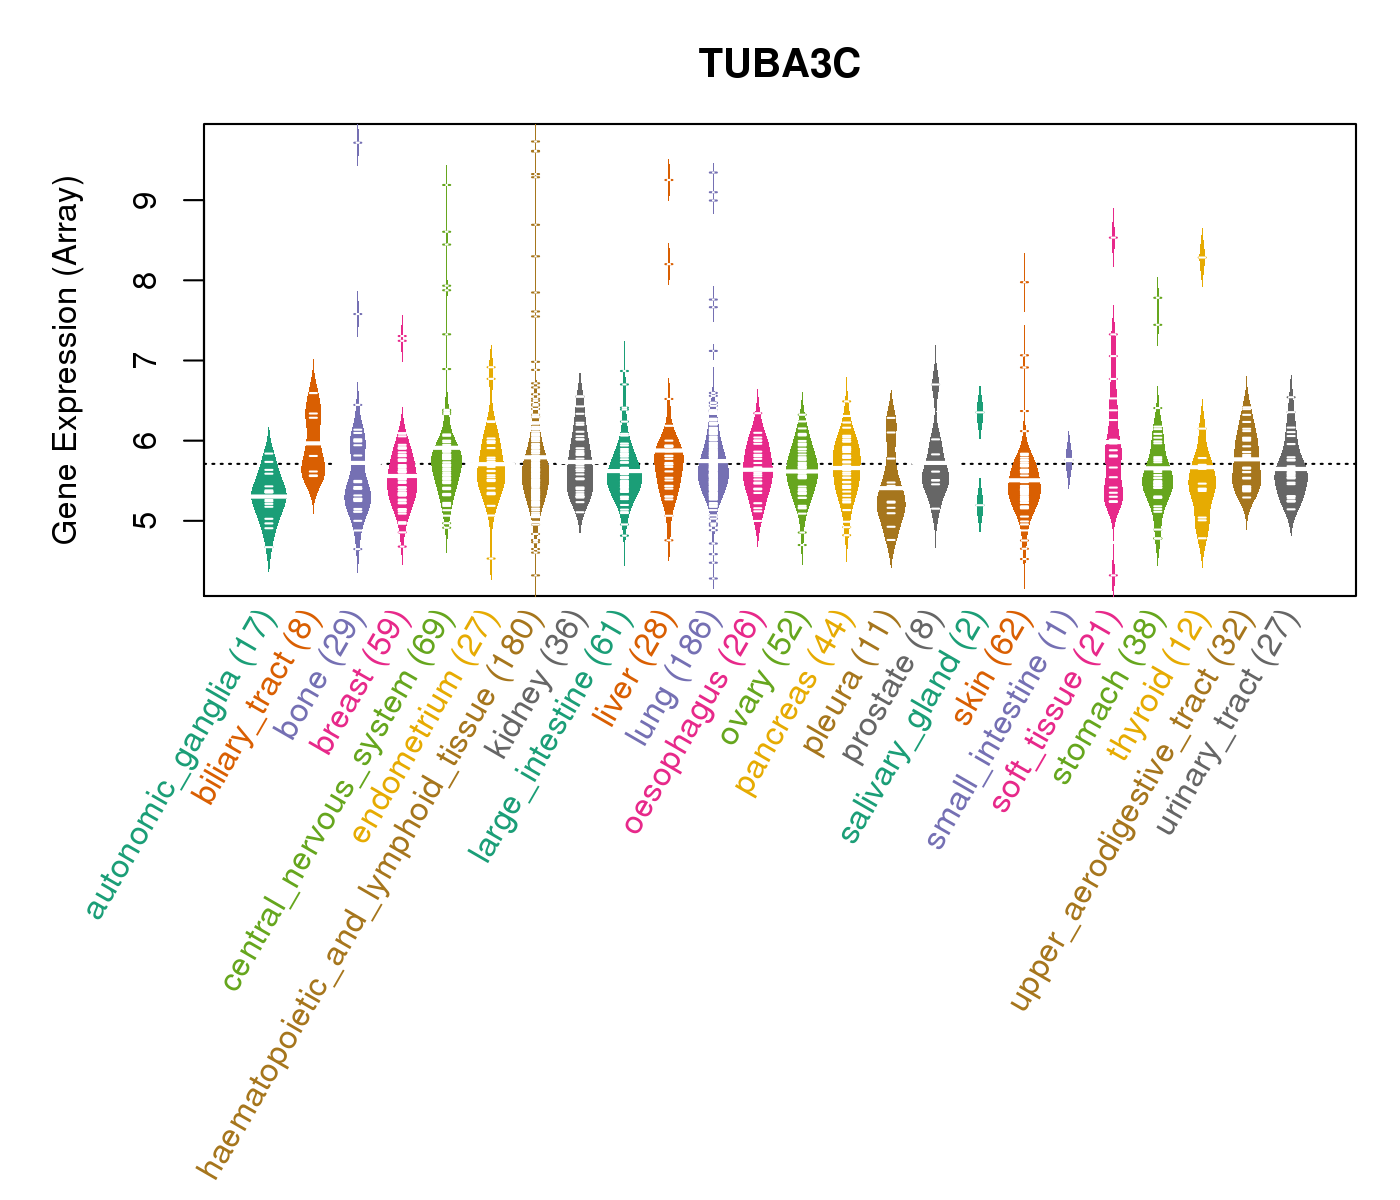
| Gene Expression for TUBA3C |
| * CCLE gene expression data were extracted from CCLE_Expression_Entrez_2012-10-18.res: Gene-centric RMA-normalized mRNA expression data. |
 |
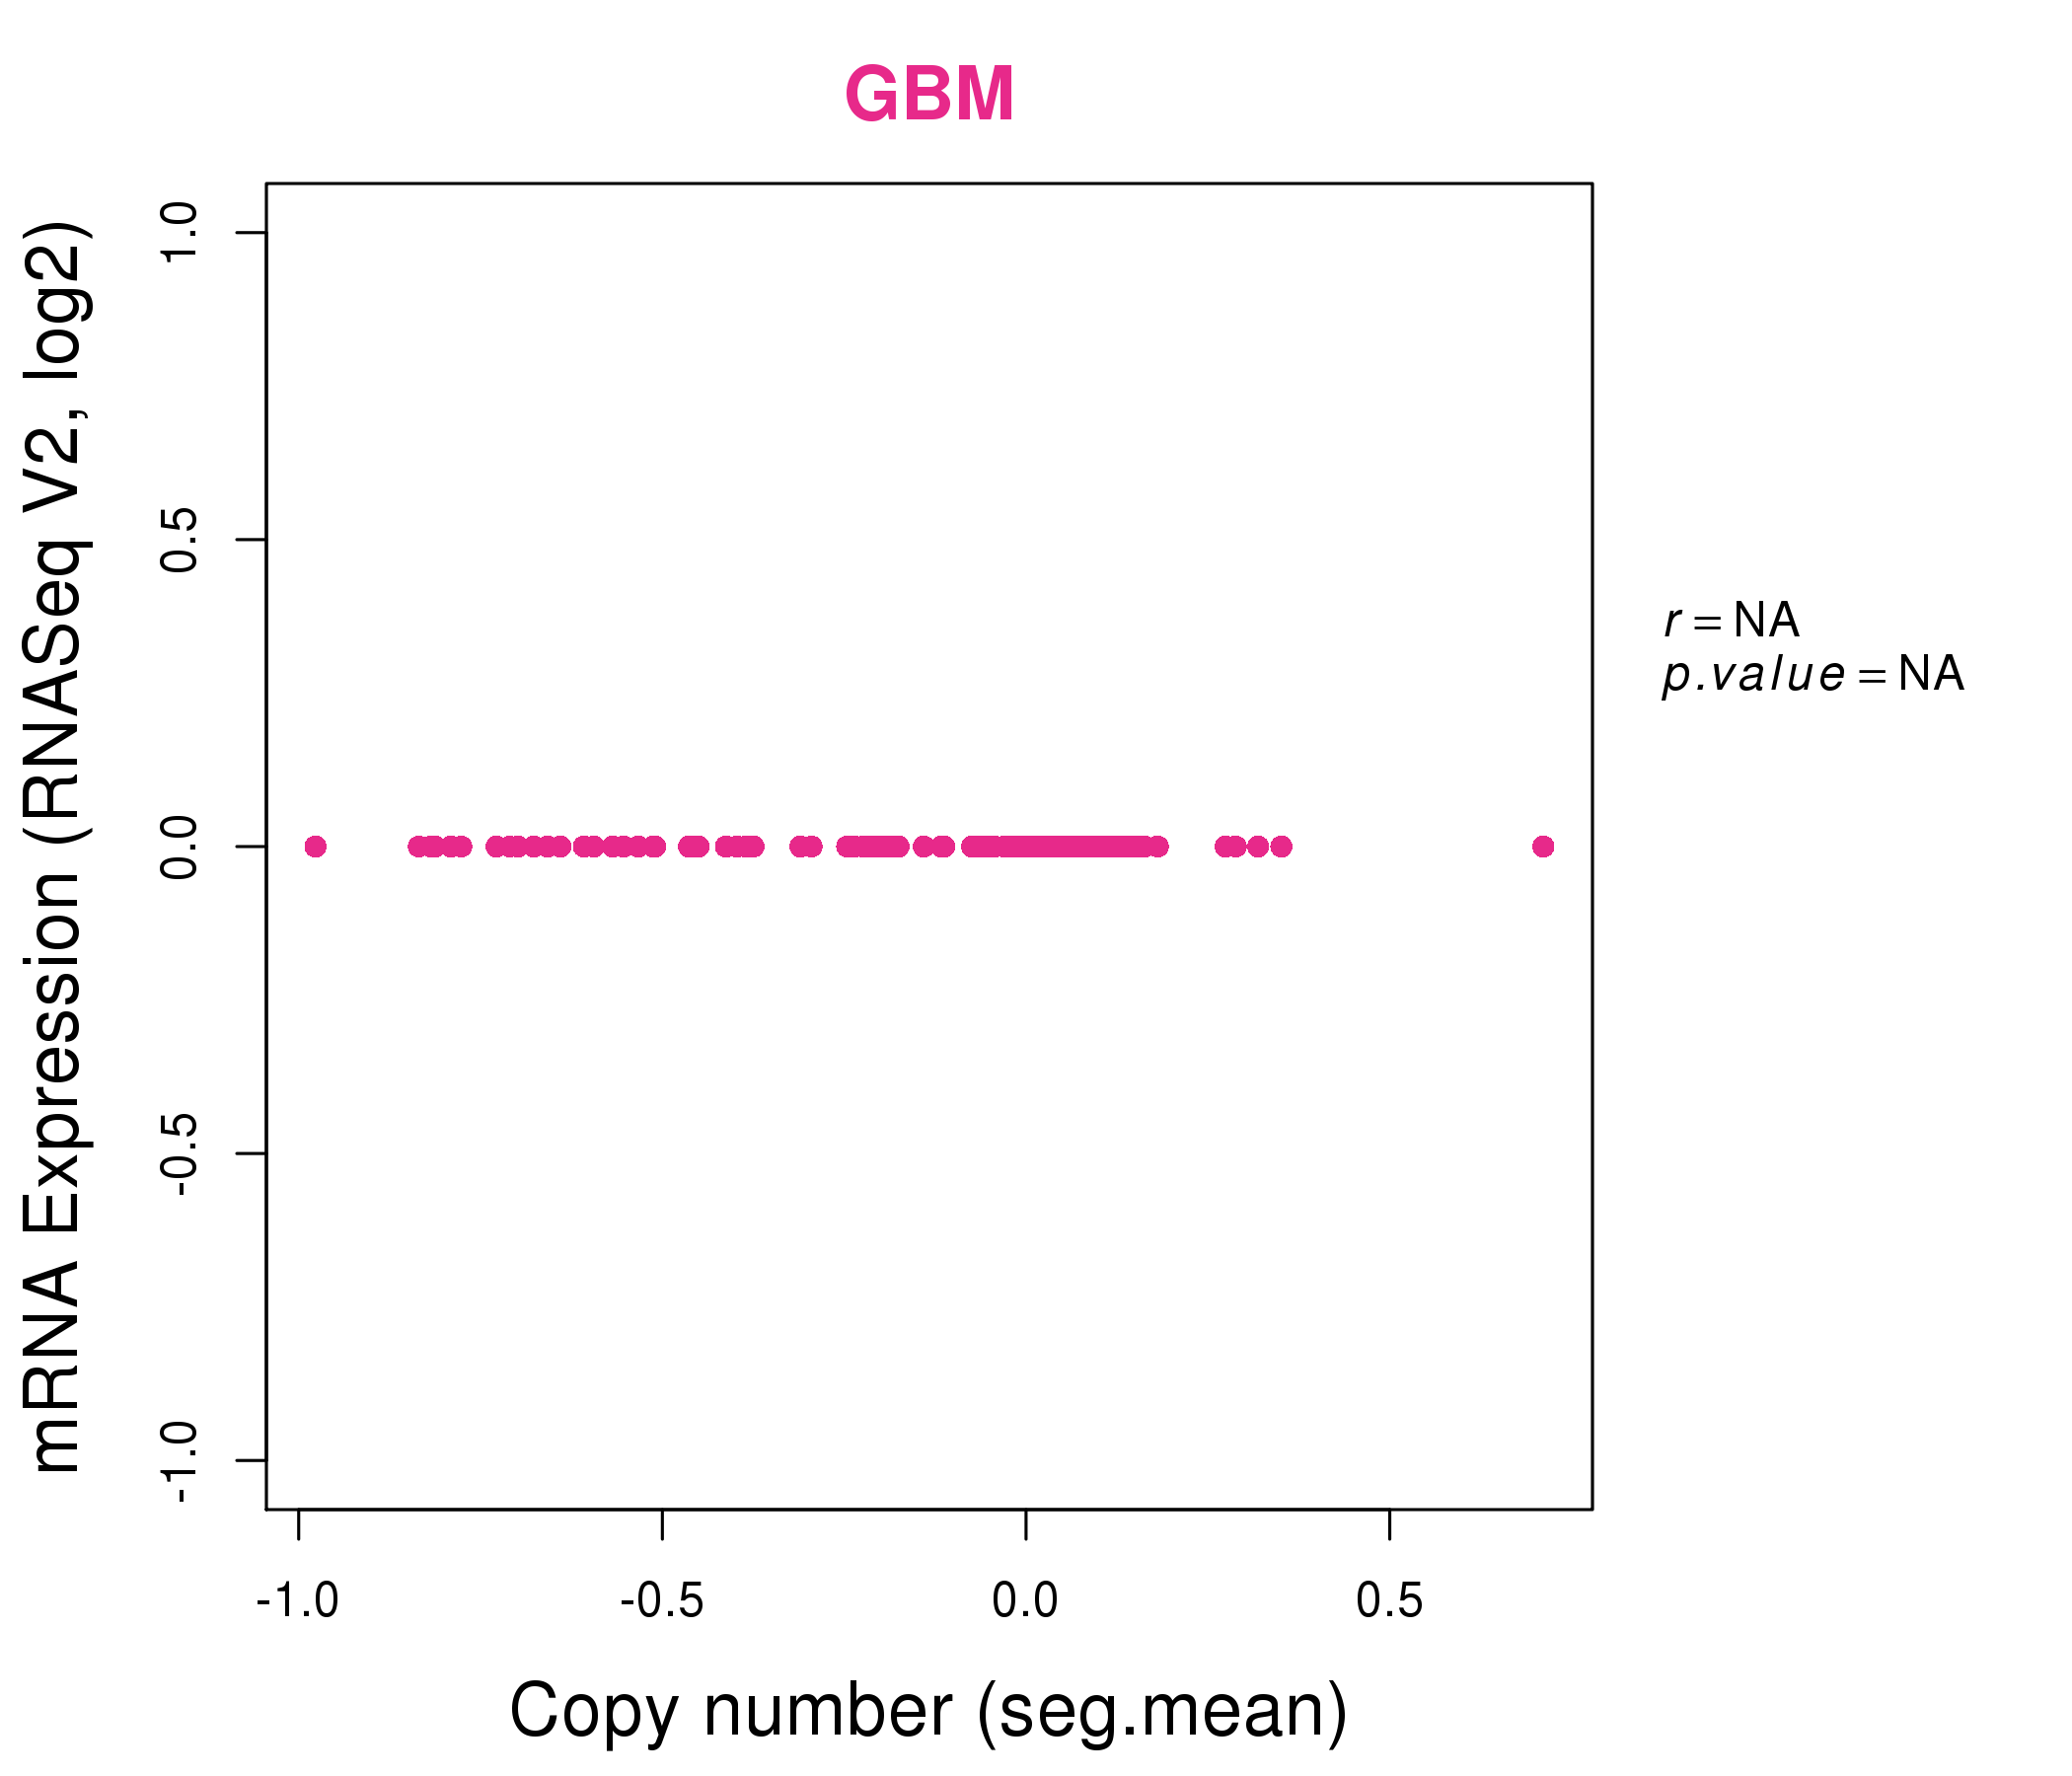
| * Normalized gene expression data of RNASeqV2 was extracted from TCGA using R package TCGA-Assembler. The URLs of all public data files on TCGA DCC data server were gathered at Jan-05-2015. Only eight cancer types have enough normal control samples for differential expression analysis. (t test, adjusted p<0.05 (using Benjamini-Hochberg FDR)) |
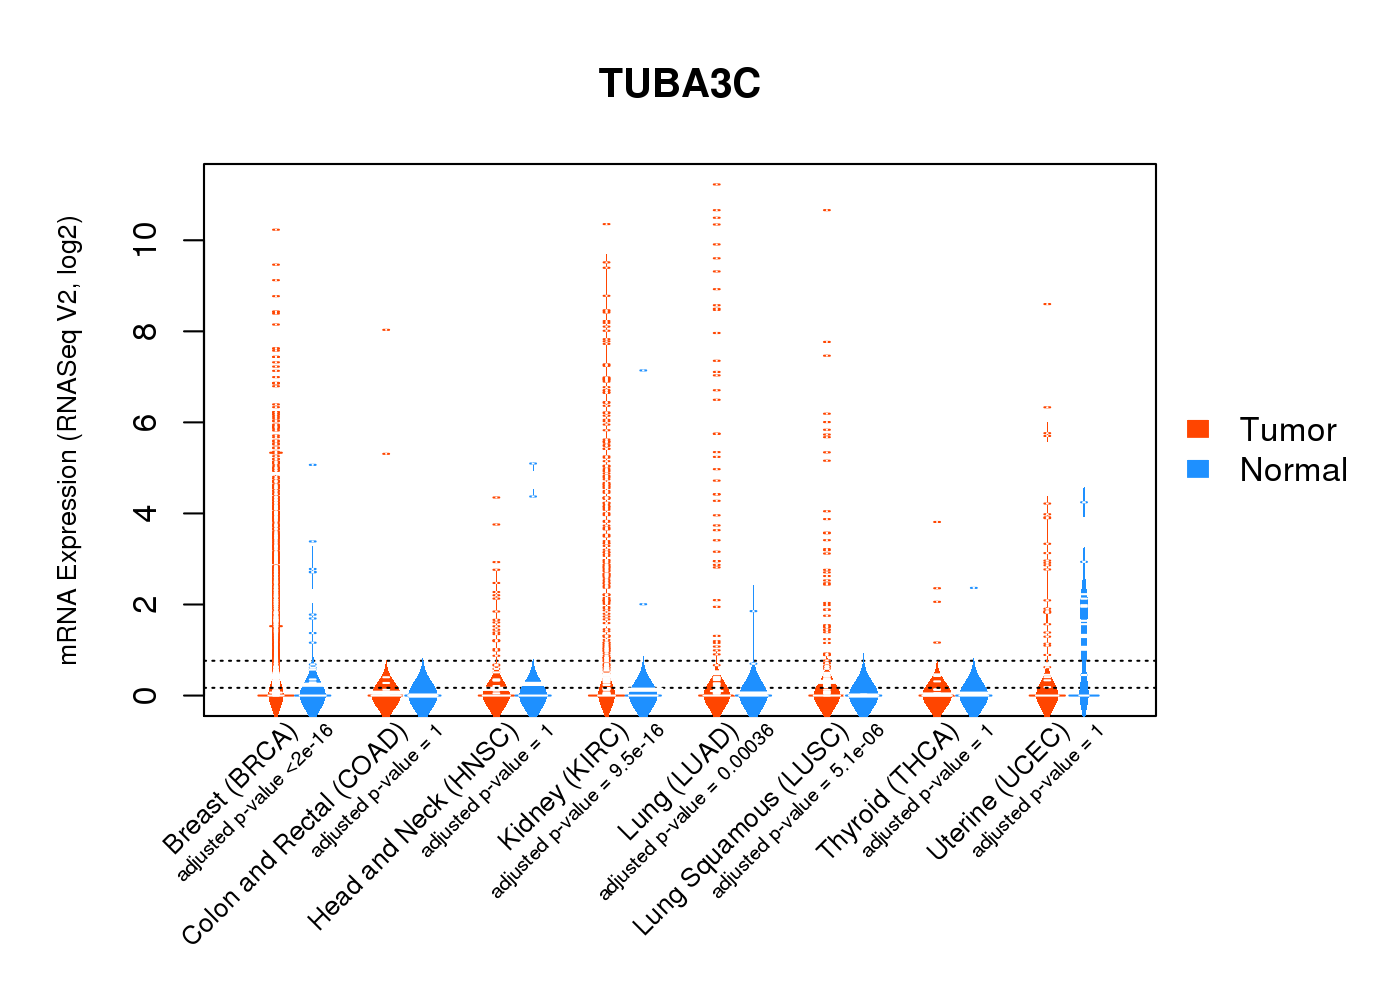 |
| Top |
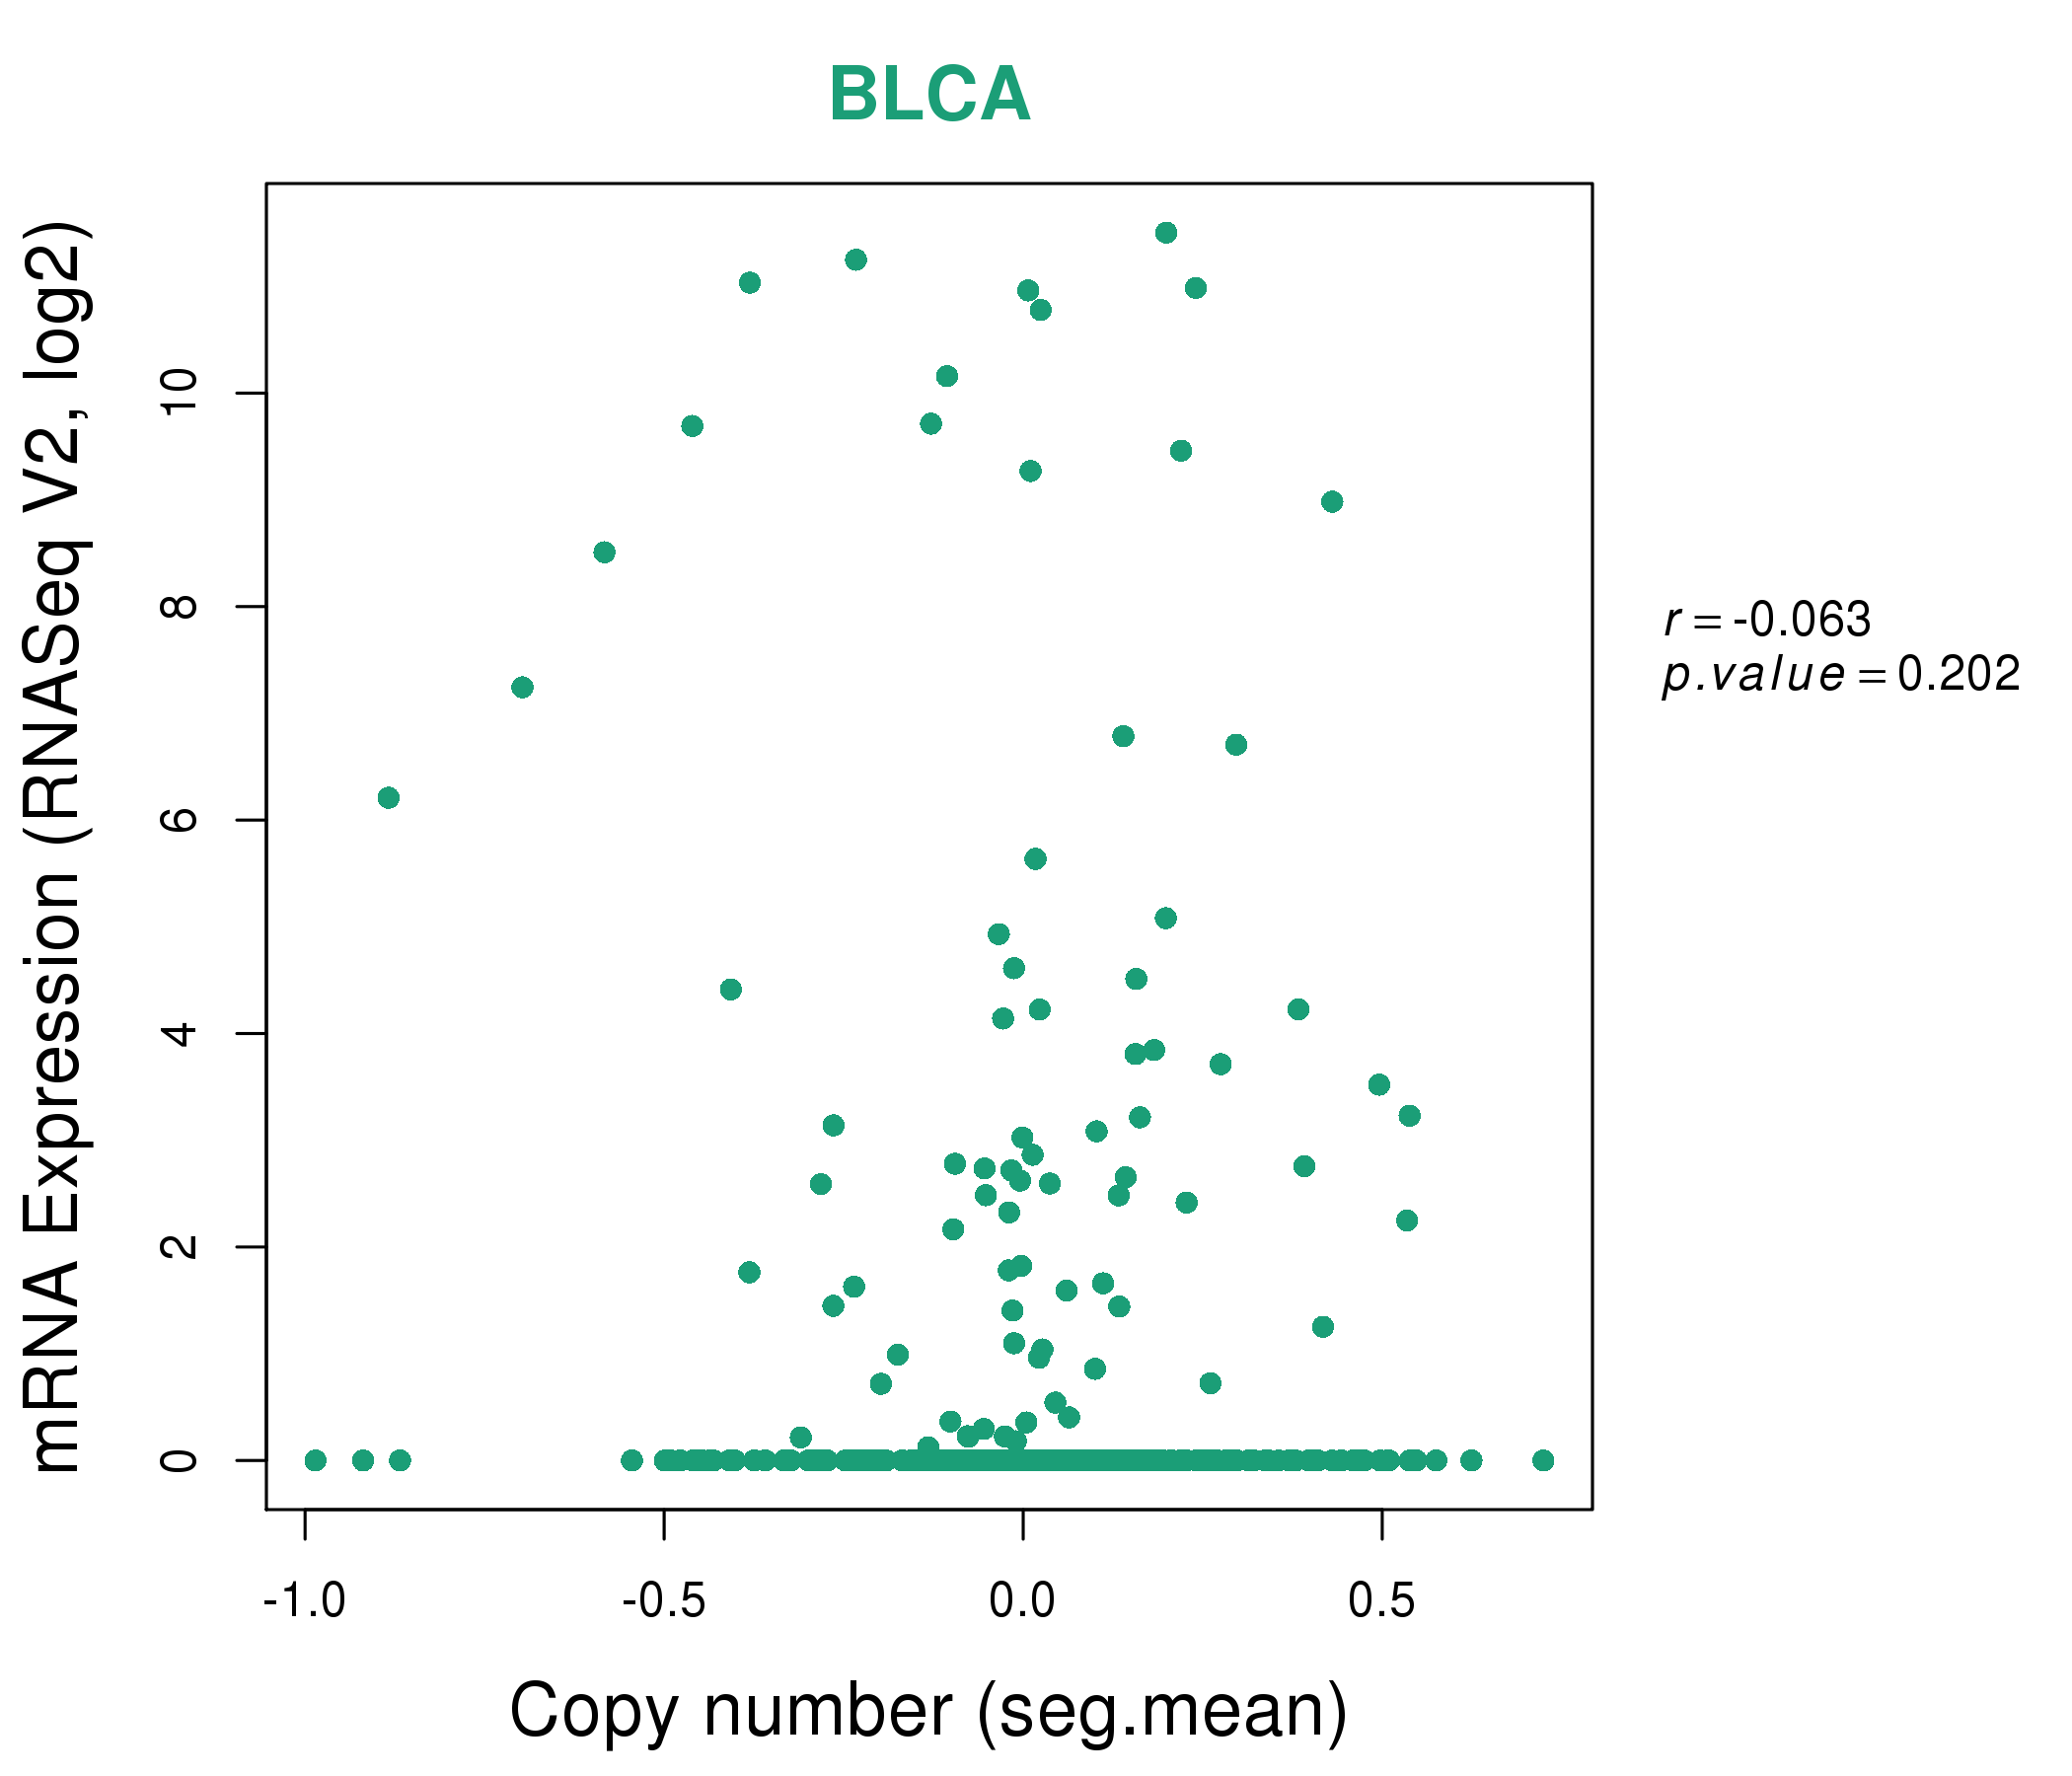
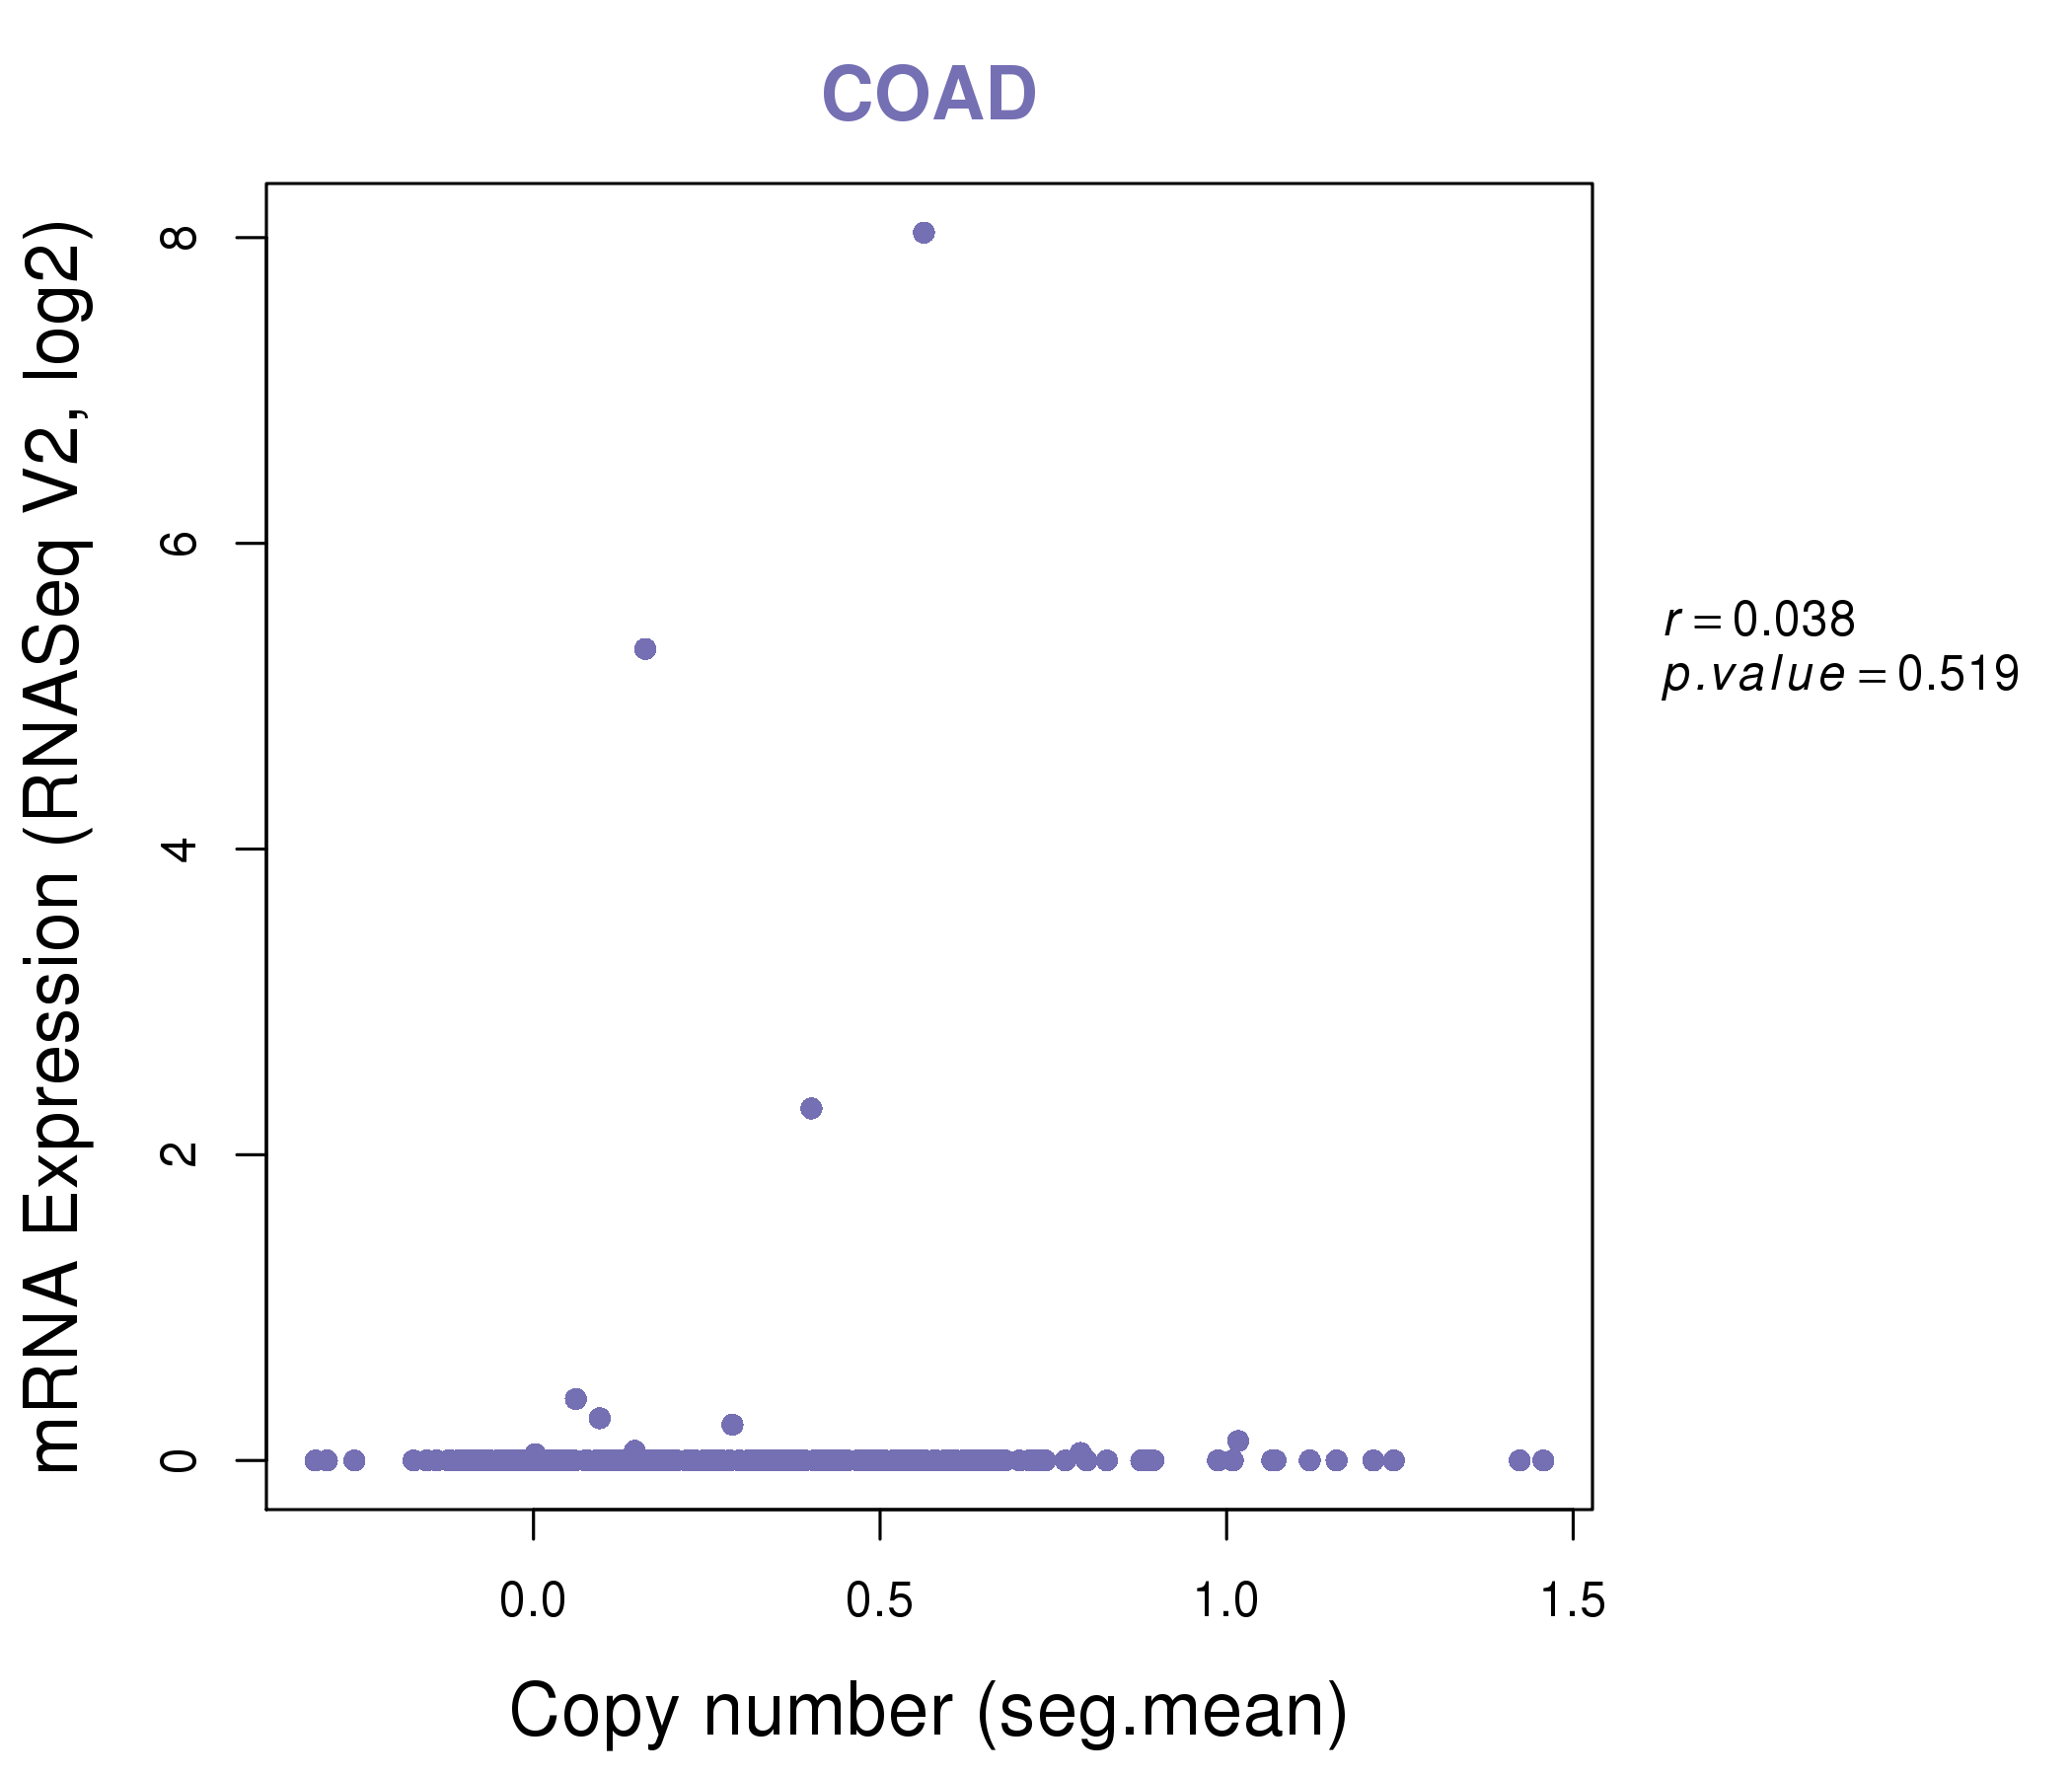
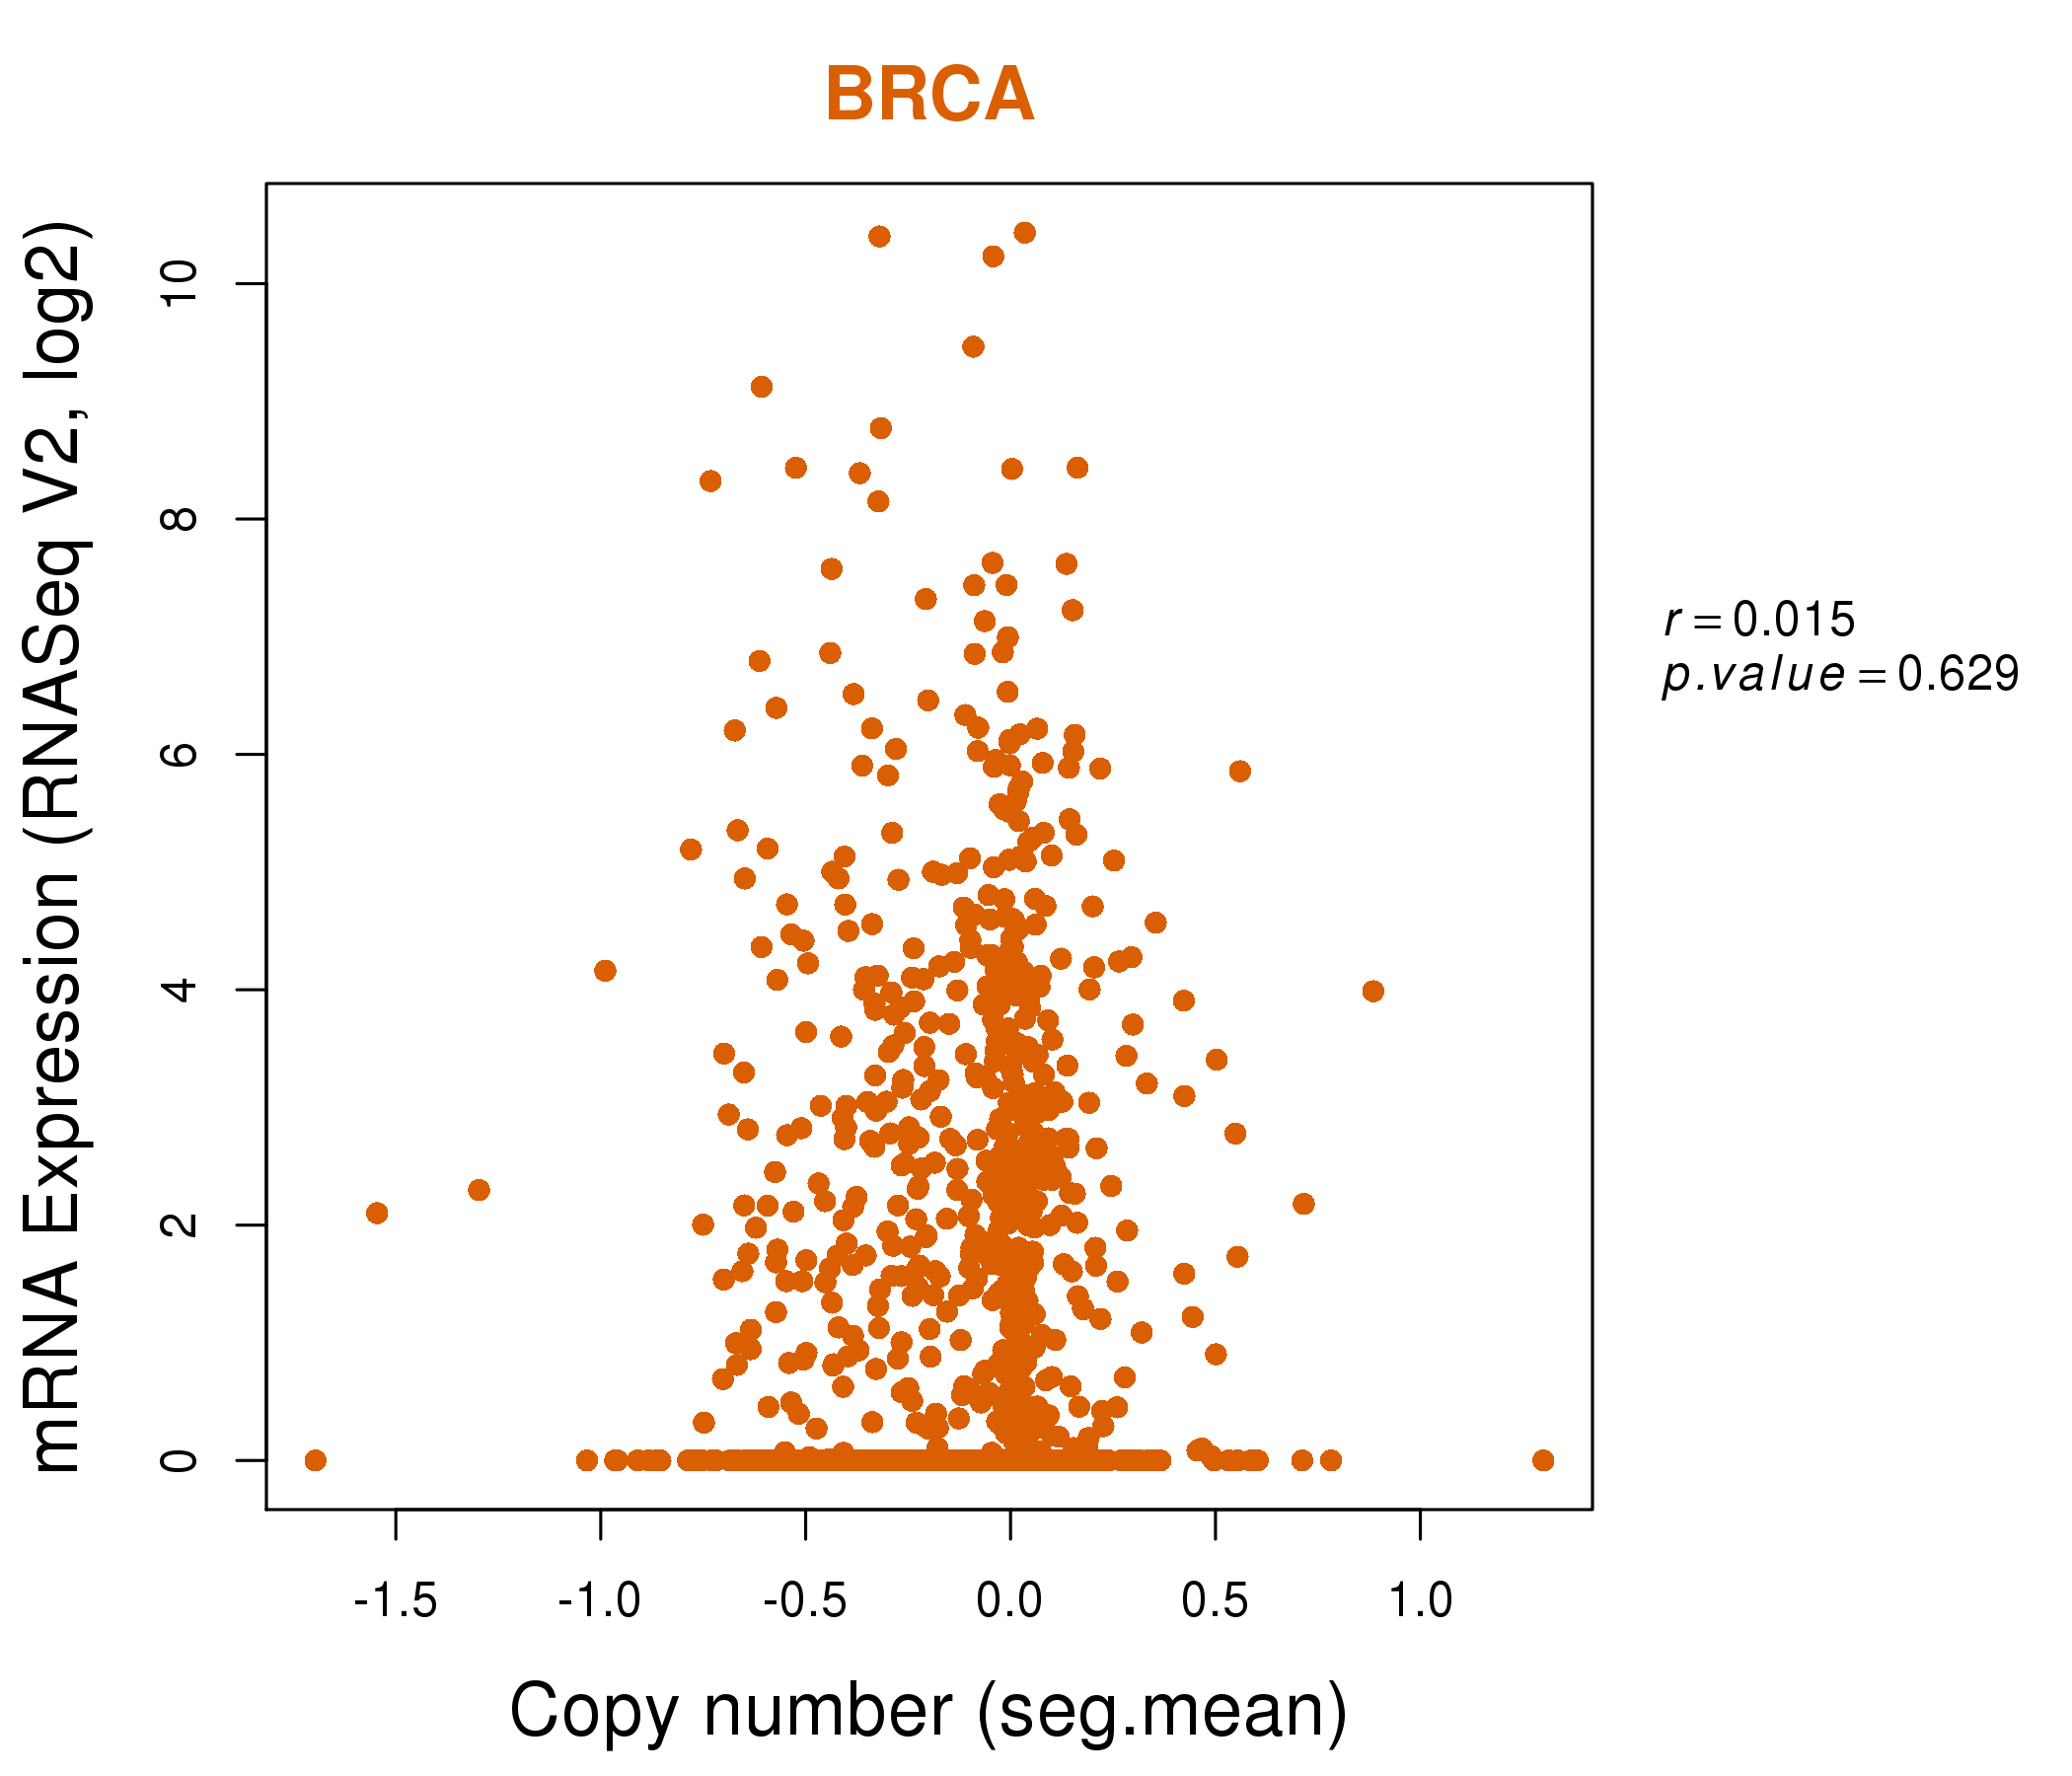
| * This plots show the correlation between CNV and gene expression. |
: Open all plots for all cancer types
 |
|
 |
|
| Top |
| Gene-Gene Network Information |
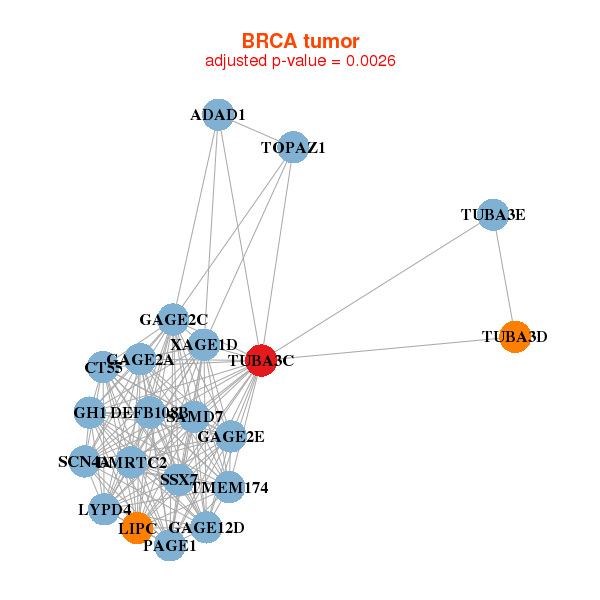
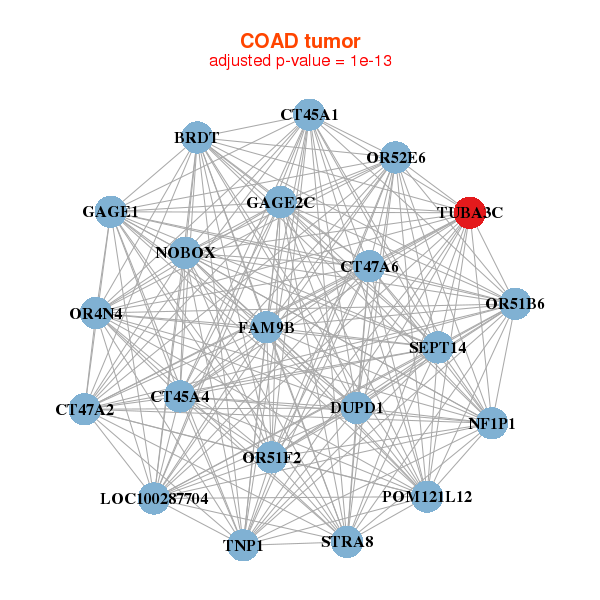
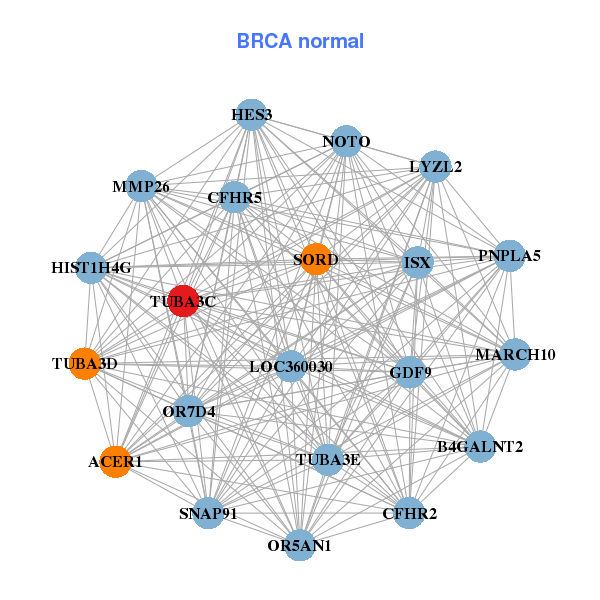
| * Co-Expression network figures were drawn using R package igraph. Only the top 20 genes with the highest correlations were shown. Red circle: input gene, orange circle: cell metabolism gene, sky circle: other gene |
: Open all plots for all cancer types
 |
| ||||
| ADAD1,TOPAZ1,CT55,DEFB108B,DMRTC2,GAGE12D,GAGE2A, GAGE2C,GAGE2E,GH1,LIPC,LYPD4,PAGE1,SAMD7, SCN4A,SSX7,TMEM174,TUBA3C,TUBA3D,TUBA3E,XAGE1D | ACER1,B4GALNT2,CFHR2,CFHR5,GDF9,HES3,HIST1H4G, ISX,LOC360030,LYZL2,MARCH10,MMP26,NOTO,OR5AN1, OR7D4,PNPLA5,SNAP91,SORD,TUBA3C,TUBA3D,TUBA3E | ||||
 |
| ||||
| BRDT,CT45A1,CT45A4,CT47A2,CT47A6,DUPD1,FAM9B, GAGE1,GAGE2C,LOC100287704,NF1P1,NOBOX,OR4N4,OR51B6, OR51F2,OR52E6,POM121L12,SEPT14,STRA8,TNP1,TUBA3C | AHSP,ALOX15,APOBEC2,METTL21C,MIR1-1HG,C5orf46,CER1, CPNE6,CRYGC,EMILIN3,FAM166B,KCTD3,LOC284900,PLEKHG4B, RPA1,SCX,SMYD1,SMYD4,TUBA3C,VPS37D,ZACN |

| * Co-Expression network figures were drawn using R package igraph. Only the top 20 genes with the highest correlations were shown. Red circle: input gene, orange circle: cell metabolism gene, sky circle: other gene |
: Open all plots for all cancer types
| Top |
: Open all interacting genes' information including KEGG pathway for all interacting genes from DAVID
| Top |
| Pharmacological Information for TUBA3C |
| DB Category | DB Name | DB's ID and Url link |
| * Gene Centered Interaction Network. |
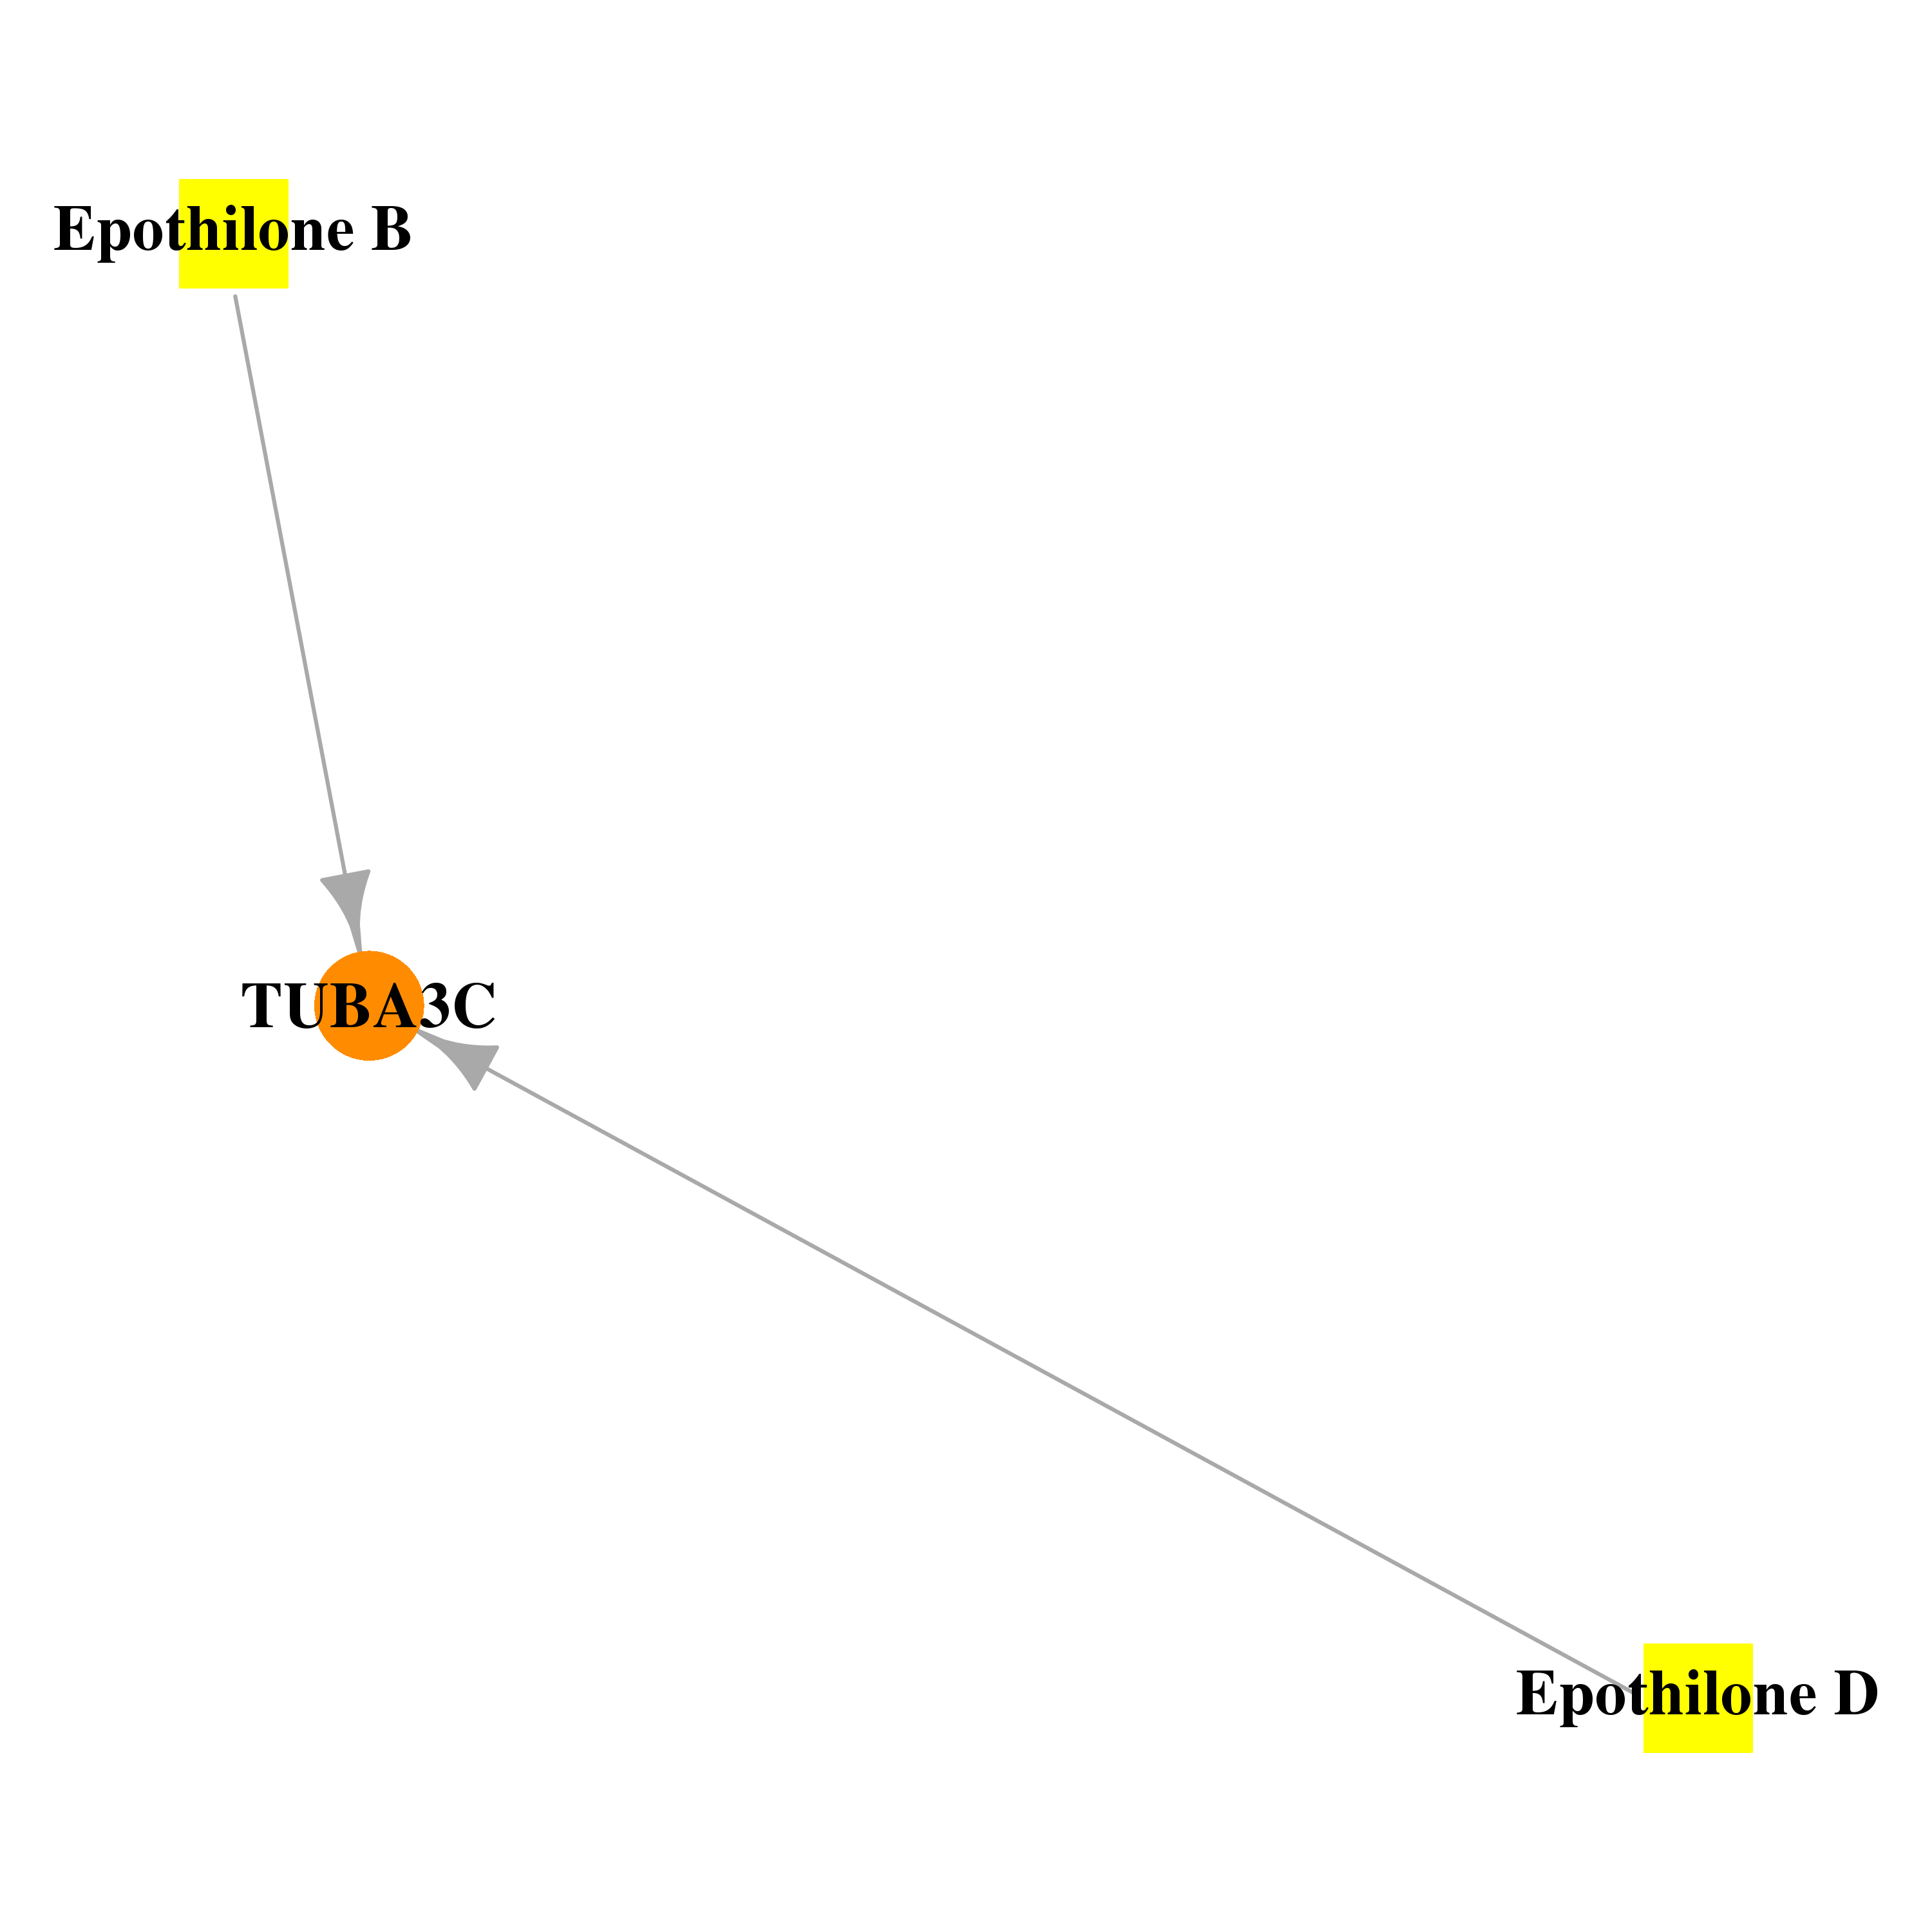 |
| * Drug Centered Interaction Network. |
| DrugBank ID | Target Name | Drug Groups | Generic Name | Drug Centered Network | Drug Structure |
| DB01873 | tubulin, alpha 3c | experimental; investigational | Epothilone D |  | 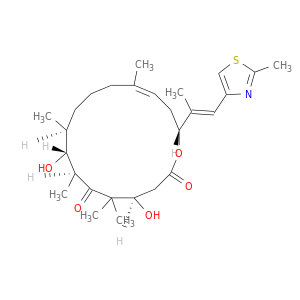 |
| DB03010 | tubulin, alpha 3c | experimental; investigational | Epothilone B | 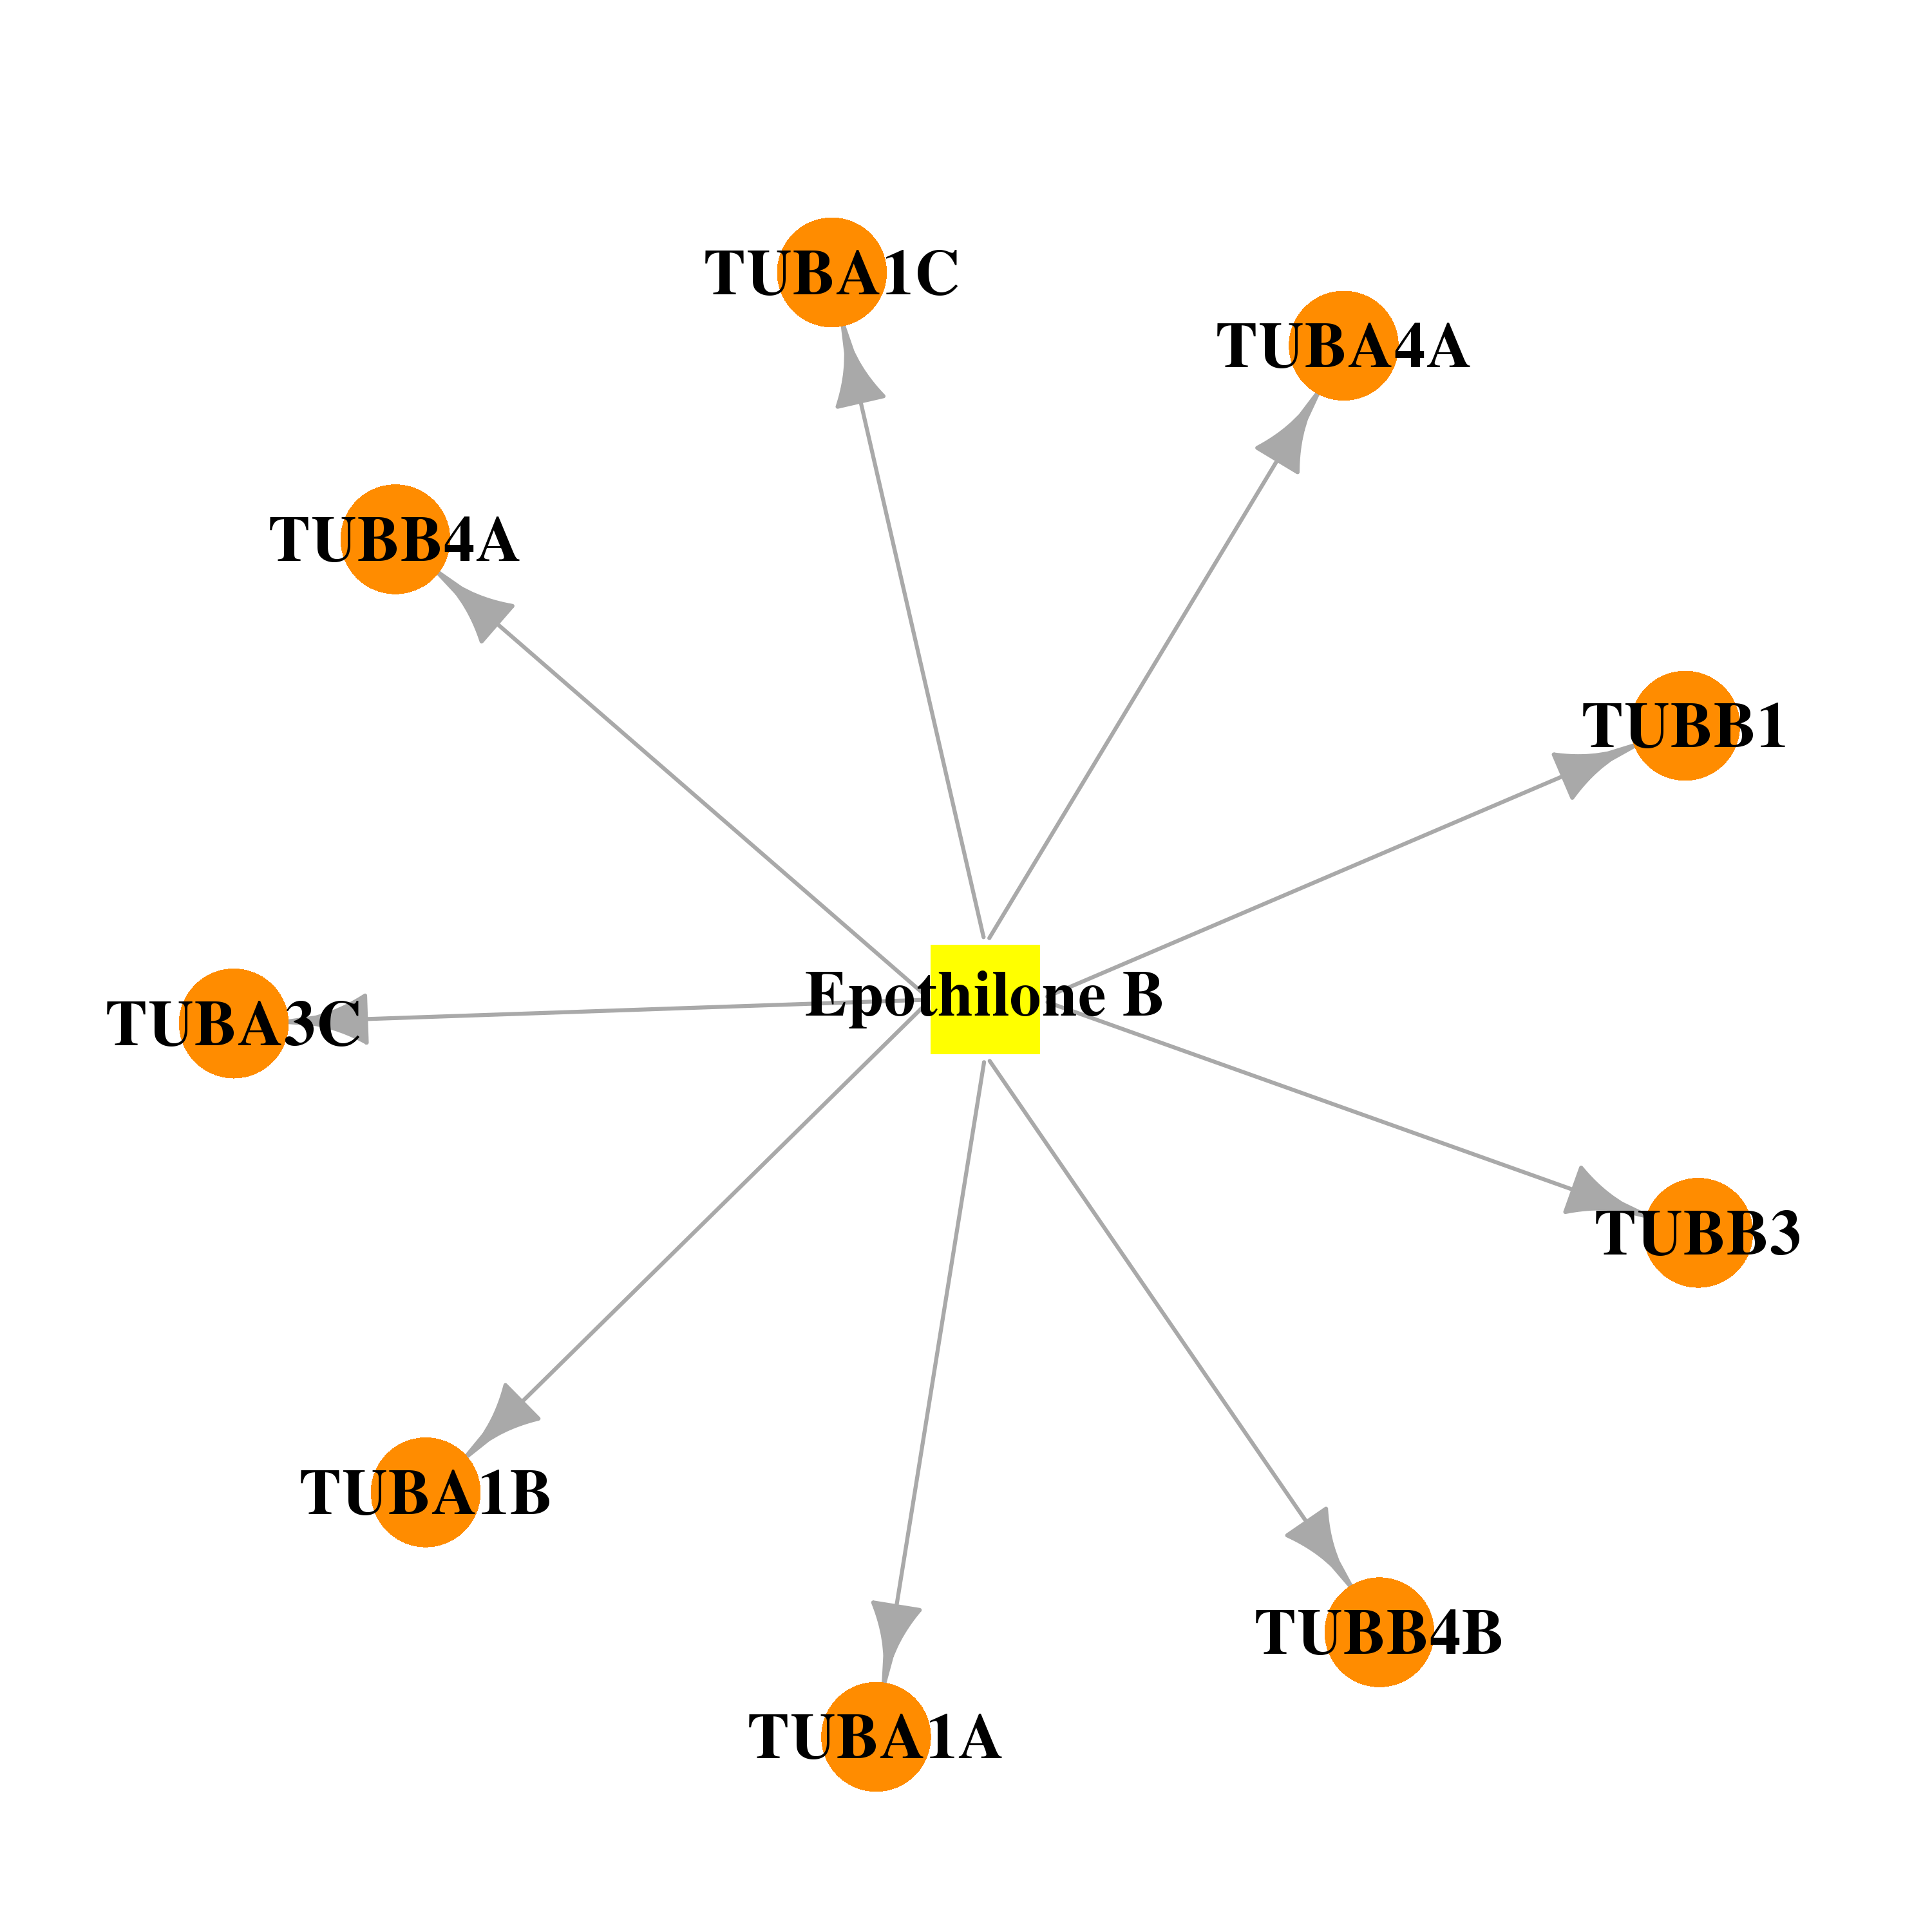 | 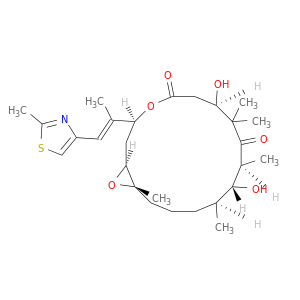 |
| Top |
| Cross referenced IDs for TUBA3C |
| * We obtained these cross-references from Uniprot database. It covers 150 different DBs, 18 categories. http://www.uniprot.org/help/cross_references_section |
: Open all cross reference information
|
Copyright © 2016-Present - The Univsersity of Texas Health Science Center at Houston @ |