|
||||||||||||||||||||||||||||||||||||||||||||||||||||||||||||||||||||||||||||||||||||||||||||||||||||||||||||||||||||||||||||||||||||||||||||||||||||||||||||||||||||||||||||||||||||||||||||||||||||||||||||||||||||||||||||||||||||||||||||||||||||||||||||||||||||||||||||||||||||||||||||||||||||||||||||||||||||||||||
| |
| Phenotypic Information (metabolism pathway, cancer, disease, phenome) |
| |
| |
| Gene-Gene Network Information: Co-Expression Network, Interacting Genes & KEGG |
| |
|


| Gene Summary for GXYLT2 |
| Basic gene info. | Gene symbol | GXYLT2 |
| Gene name | glucoside xylosyltransferase 2 | |
| Synonyms | GLT8D4 | |
| Cytomap | UCSC genome browser: 3p13 | |
| Genomic location | chr3 :72937384-73024522 | |
| Type of gene | protein-coding | |
| RefGenes | NM_001080393.1, | |
| Ensembl id | ENSG00000172986 | |
| Description | glycosyltransferase 8 domain containing 4glycosyltransferase 8 domain-containing protein 4 | |
| Modification date | 20141207 | |
| dbXrefs | MIM : 613322 | |
| HGNC : HGNC | ||
| Protein | UniProt: go to UniProt's Cross Reference DB Table | |
| Expression | CleanEX: HS_GXYLT2 | |
| BioGPS: 727936 | ||
| Gene Expression Atlas: ENSG00000172986 | ||
| The Human Protein Atlas: ENSG00000172986 | ||
| Pathway | NCI Pathway Interaction Database: GXYLT2 | |
| KEGG: GXYLT2 | ||
| REACTOME: GXYLT2 | ||
| ConsensusPathDB | ||
| Pathway Commons: GXYLT2 | ||
| Metabolism | MetaCyc: GXYLT2 | |
| HUMANCyc: GXYLT2 | ||
| Regulation | Ensembl's Regulation: ENSG00000172986 | |
| miRBase: chr3 :72,937,384-73,024,522 | ||
| TargetScan: NM_001080393 | ||
| cisRED: ENSG00000172986 | ||
| Context | iHOP: GXYLT2 | |
| cancer metabolism search in PubMed: GXYLT2 | ||
| UCL Cancer Institute: GXYLT2 | ||
| Assigned class in ccmGDB | C | |
| Top |
| Phenotypic Information for GXYLT2(metabolism pathway, cancer, disease, phenome) |
| Cancer | CGAP: GXYLT2 |
| Familial Cancer Database: GXYLT2 | |
| * This gene is included in those cancer gene databases. |
|
|
|
|
|
|
| ||||||||||||||||||||||||||||||||||||||||||||||||||||||||||||||||||||||||||||||||||||||||||||||||||||||||||||||||||||||||||||||||||||||||||||||||||||||||||||||||||||||||||||||||||||||||||||||||||||||||||||||||||||||||||||||||||||||||||||||||||||||||||||||||||||||||||||||||||||||||||||||||||||||||||||||||||||
Oncogene 1 | Significant driver gene in | |||||||||||||||||||||||||||||||||||||||||||||||||||||||||||||||||||||||||||||||||||||||||||||||||||||||||||||||||||||||||||||||||||||||||||||||||||||||||||||||||||||||||||||||||||||||||||||||||||||||||||||||||||||||||||||||||||||||||||||||||||||||||||||||||||||||||||||||||||||||||||||||||||||||||||||||||||||||||
| cf) number; DB name 1 Oncogene; http://nar.oxfordjournals.org/content/35/suppl_1/D721.long, 2 Tumor Suppressor gene; https://bioinfo.uth.edu/TSGene/, 3 Cancer Gene Census; http://www.nature.com/nrc/journal/v4/n3/abs/nrc1299.html, 4 CancerGenes; http://nar.oxfordjournals.org/content/35/suppl_1/D721.long, 5 Network of Cancer Gene; http://ncg.kcl.ac.uk/index.php, 1Therapeutic Vulnerabilities in Cancer; http://cbio.mskcc.org/cancergenomics/statius/ |
| REACTOME_METABOLISM_OF_CARBOHYDRATES | |
| OMIM | |
| Orphanet | |
| Disease | KEGG Disease: GXYLT2 |
| MedGen: GXYLT2 (Human Medical Genetics with Condition) | |
| ClinVar: GXYLT2 | |
| Phenotype | MGI: GXYLT2 (International Mouse Phenotyping Consortium) |
| PhenomicDB: GXYLT2 | |
| Mutations for GXYLT2 |
| * Under tables are showing count per each tissue to give us broad intuition about tissue specific mutation patterns.You can go to the detailed page for each mutation database's web site. |
| There's no structural variation information in COSMIC data for this gene. |
| * From mRNA Sanger sequences, Chitars2.0 arranged chimeric transcripts. This table shows GXYLT2 related fusion information. |
| ID | Head Gene | Tail Gene | Accession | Gene_a | qStart_a | qEnd_a | Chromosome_a | tStart_a | tEnd_a | Gene_a | qStart_a | qEnd_a | Chromosome_a | tStart_a | tEnd_a |
| Top |
| Mutation type/ Tissue ID | brca | cns | cerv | endome | haematopo | kidn | Lintest | liver | lung | ns | ovary | pancre | prost | skin | stoma | thyro | urina | |||
| Total # sample | 1 | 1 | 1 | |||||||||||||||||
| GAIN (# sample) | 1 | 1 | ||||||||||||||||||
| LOSS (# sample) | 1 |
| cf) Tissue ID; Tissue type (1; Breast, 2; Central_nervous_system, 3; Cervix, 4; Endometrium, 5; Haematopoietic_and_lymphoid_tissue, 6; Kidney, 7; Large_intestine, 8; Liver, 9; Lung, 10; NS, 11; Ovary, 12; Pancreas, 13; Prostate, 14; Skin, 15; Stomach, 16; Thyroid, 17; Urinary_tract) |
| Top |
|
 |
| Top |
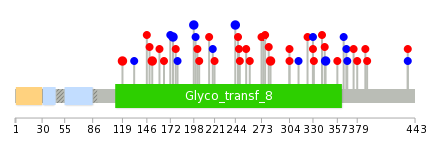
| Stat. for Non-Synonymous SNVs (# total SNVs=33) | (# total SNVs=15) |
 |  |
(# total SNVs=0) | (# total SNVs=0) |
| Top |
| * When you move the cursor on each content, you can see more deailed mutation information on the Tooltip. Those are primary_site,primary_histology,mutation(aa),pubmedID. |
| GRCh37 position | Mutation(aa) | Unique sampleID count |
| chr3:73004380-73004380 | p.H244H | 2 |
| chr3:73004496-73004496 | p.F283S | 2 |
| chr3:73016753-73016753 | p.Y344Y | 2 |
| chr3:72971411-72971411 | p.I175I | 2 |
| chr3:73006438-73006438 | p.K304R | 2 |
| chr3:72957598-72957598 | p.N119S | 2 |
| chr3:72971480-72971480 | p.F198F | 2 |
| chr3:72957696-72957696 | p.E152K | 2 |
| chr3:73024146-73024146 | p.L390I | 1 |
| chr3:73024212-73024212 | p.R412* | 1 |
| Top |
|
 |
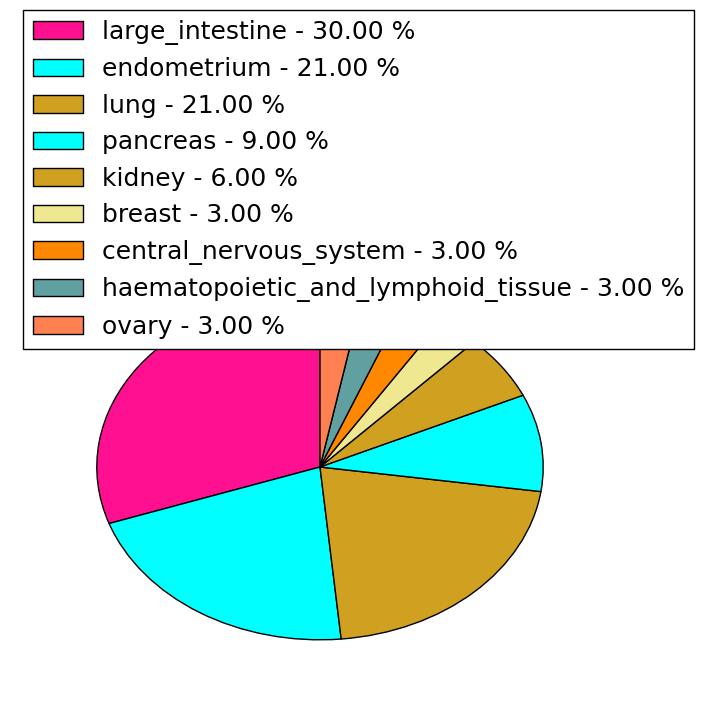
| Point Mutation/ Tissue ID | 1 | 2 | 3 | 4 | 5 | 6 | 7 | 8 | 9 | 10 | 11 | 12 | 13 | 14 | 15 | 16 | 17 | 18 | 19 | 20 |
| # sample | 3 | 1 | 8 | 3 | 1 | 1 | 1 | 4 | 5 | 2 | 7 | |||||||||
| # mutation | 4 | 1 | 8 | 3 | 1 | 1 | 1 | 4 | 5 | 2 | 8 | |||||||||
| nonsynonymous SNV | 4 | 4 | 2 | 1 | 1 | 1 | 3 | 3 | 1 | 6 | ||||||||||
| synonymous SNV | 1 | 4 | 1 | 1 | 2 | 1 | 2 |
| cf) Tissue ID; Tissue type (1; BLCA[Bladder Urothelial Carcinoma], 2; BRCA[Breast invasive carcinoma], 3; CESC[Cervical squamous cell carcinoma and endocervical adenocarcinoma], 4; COAD[Colon adenocarcinoma], 5; GBM[Glioblastoma multiforme], 6; Glioma Low Grade, 7; HNSC[Head and Neck squamous cell carcinoma], 8; KICH[Kidney Chromophobe], 9; KIRC[Kidney renal clear cell carcinoma], 10; KIRP[Kidney renal papillary cell carcinoma], 11; LAML[Acute Myeloid Leukemia], 12; LUAD[Lung adenocarcinoma], 13; LUSC[Lung squamous cell carcinoma], 14; OV[Ovarian serous cystadenocarcinoma ], 15; PAAD[Pancreatic adenocarcinoma], 16; PRAD[Prostate adenocarcinoma], 17; SKCM[Skin Cutaneous Melanoma], 18:STAD[Stomach adenocarcinoma], 19:THCA[Thyroid carcinoma], 20:UCEC[Uterine Corpus Endometrial Carcinoma]) |
| Top |
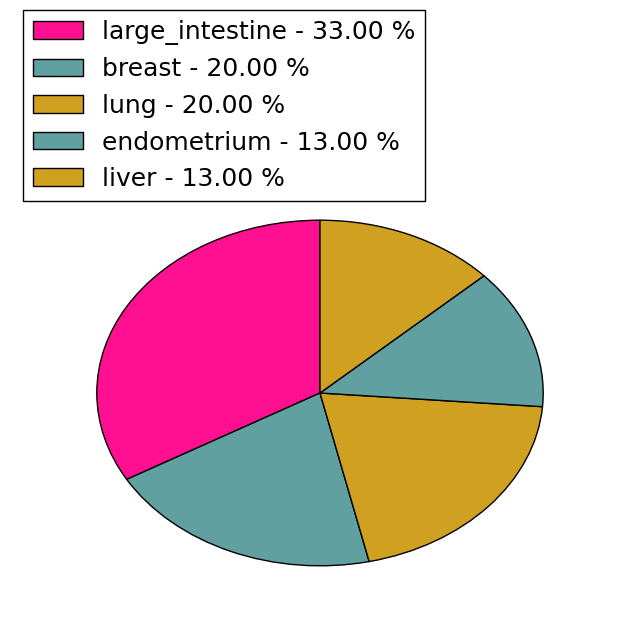
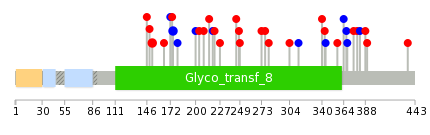
| * We represented just top 10 SNVs. When you move the cursor on each content, you can see more deailed mutation information on the Tooltip. Those are primary_site, primary_histology, mutation(aa), pubmedID. |
| Genomic Position | Mutation(aa) | Unique sampleID count |
| chr3:72957696 | p.E152K | 2 |
| chr3:72971411 | p.I175I | 2 |
| chr3:73004467 | p.G364G | 1 |
| chr3:73016825 | p.D215N | 1 |
| chr3:72971486 | p.H367H | 1 |
| chr3:73004477 | p.L219L | 1 |
| chr3:73016845 | p.D368D | 1 |
| chr3:73004260 | p.P221H | 1 |
| chr3:73004489 | p.R375I | 1 |
| chr3:73016856 | p.K227T | 1 |
| * Copy number data were extracted from TCGA using R package TCGA-Assembler. The URLs of all public data files on TCGA DCC data server were gathered on Jan-05-2015. Function ProcessCNAData in TCGA-Assembler package was used to obtain gene-level copy number value which is calculated as the average copy number of the genomic region of a gene. |
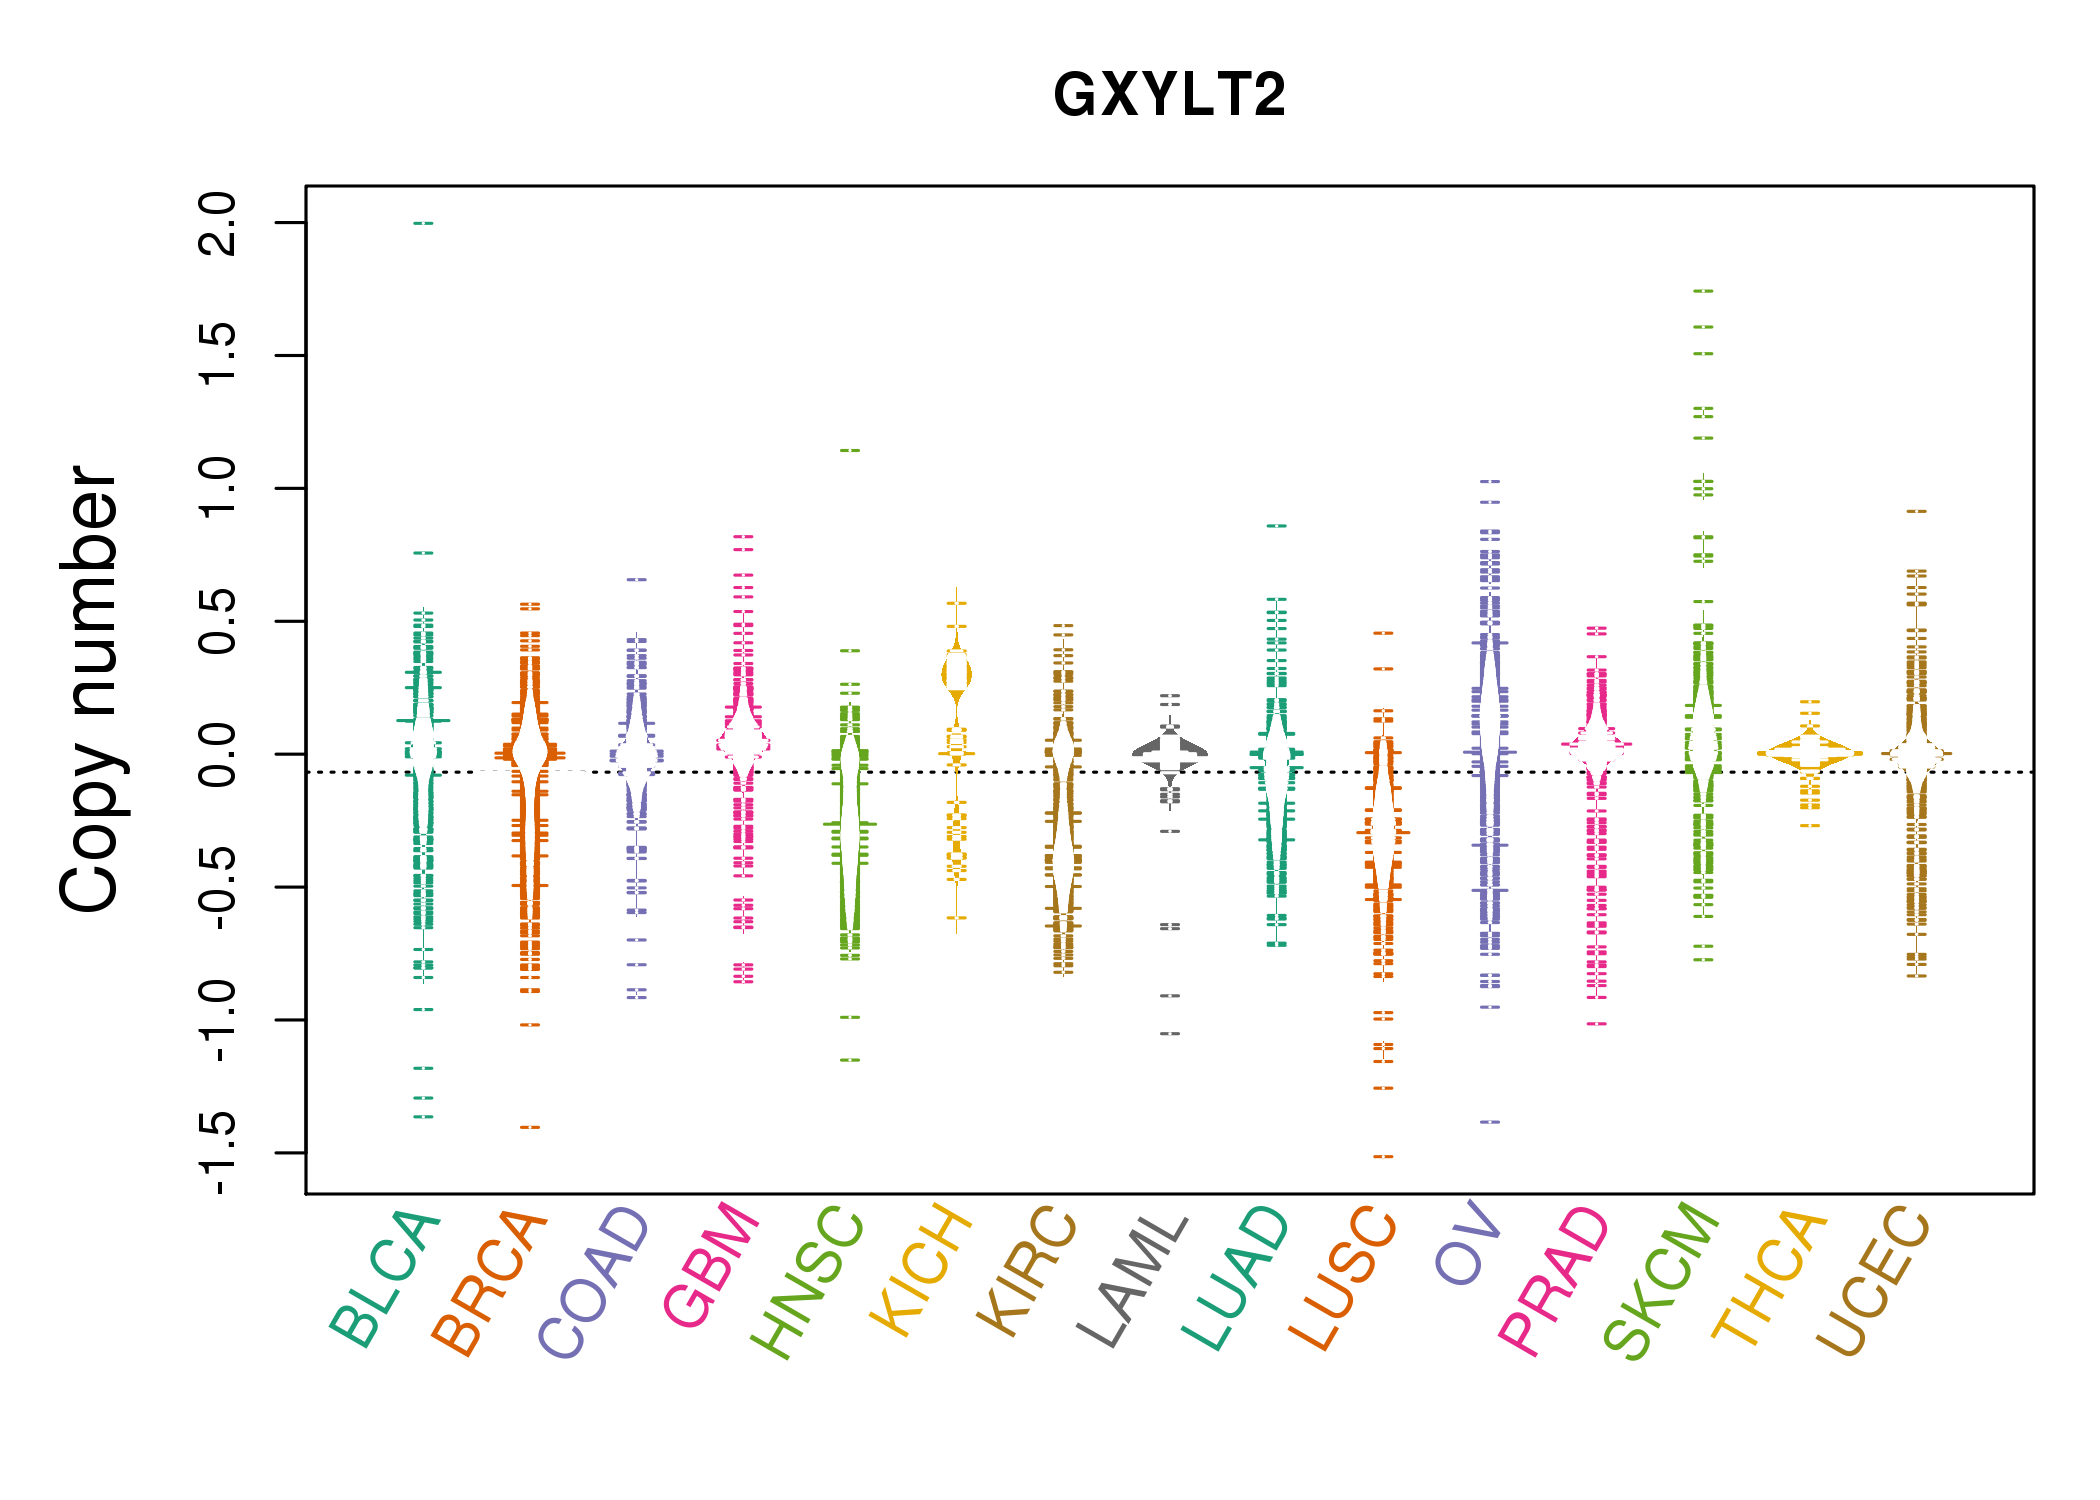 |
| cf) Tissue ID[Tissue type]: BLCA[Bladder Urothelial Carcinoma], BRCA[Breast invasive carcinoma], CESC[Cervical squamous cell carcinoma and endocervical adenocarcinoma], COAD[Colon adenocarcinoma], GBM[Glioblastoma multiforme], Glioma Low Grade, HNSC[Head and Neck squamous cell carcinoma], KICH[Kidney Chromophobe], KIRC[Kidney renal clear cell carcinoma], KIRP[Kidney renal papillary cell carcinoma], LAML[Acute Myeloid Leukemia], LUAD[Lung adenocarcinoma], LUSC[Lung squamous cell carcinoma], OV[Ovarian serous cystadenocarcinoma ], PAAD[Pancreatic adenocarcinoma], PRAD[Prostate adenocarcinoma], SKCM[Skin Cutaneous Melanoma], STAD[Stomach adenocarcinoma], THCA[Thyroid carcinoma], UCEC[Uterine Corpus Endometrial Carcinoma] |
| Top |
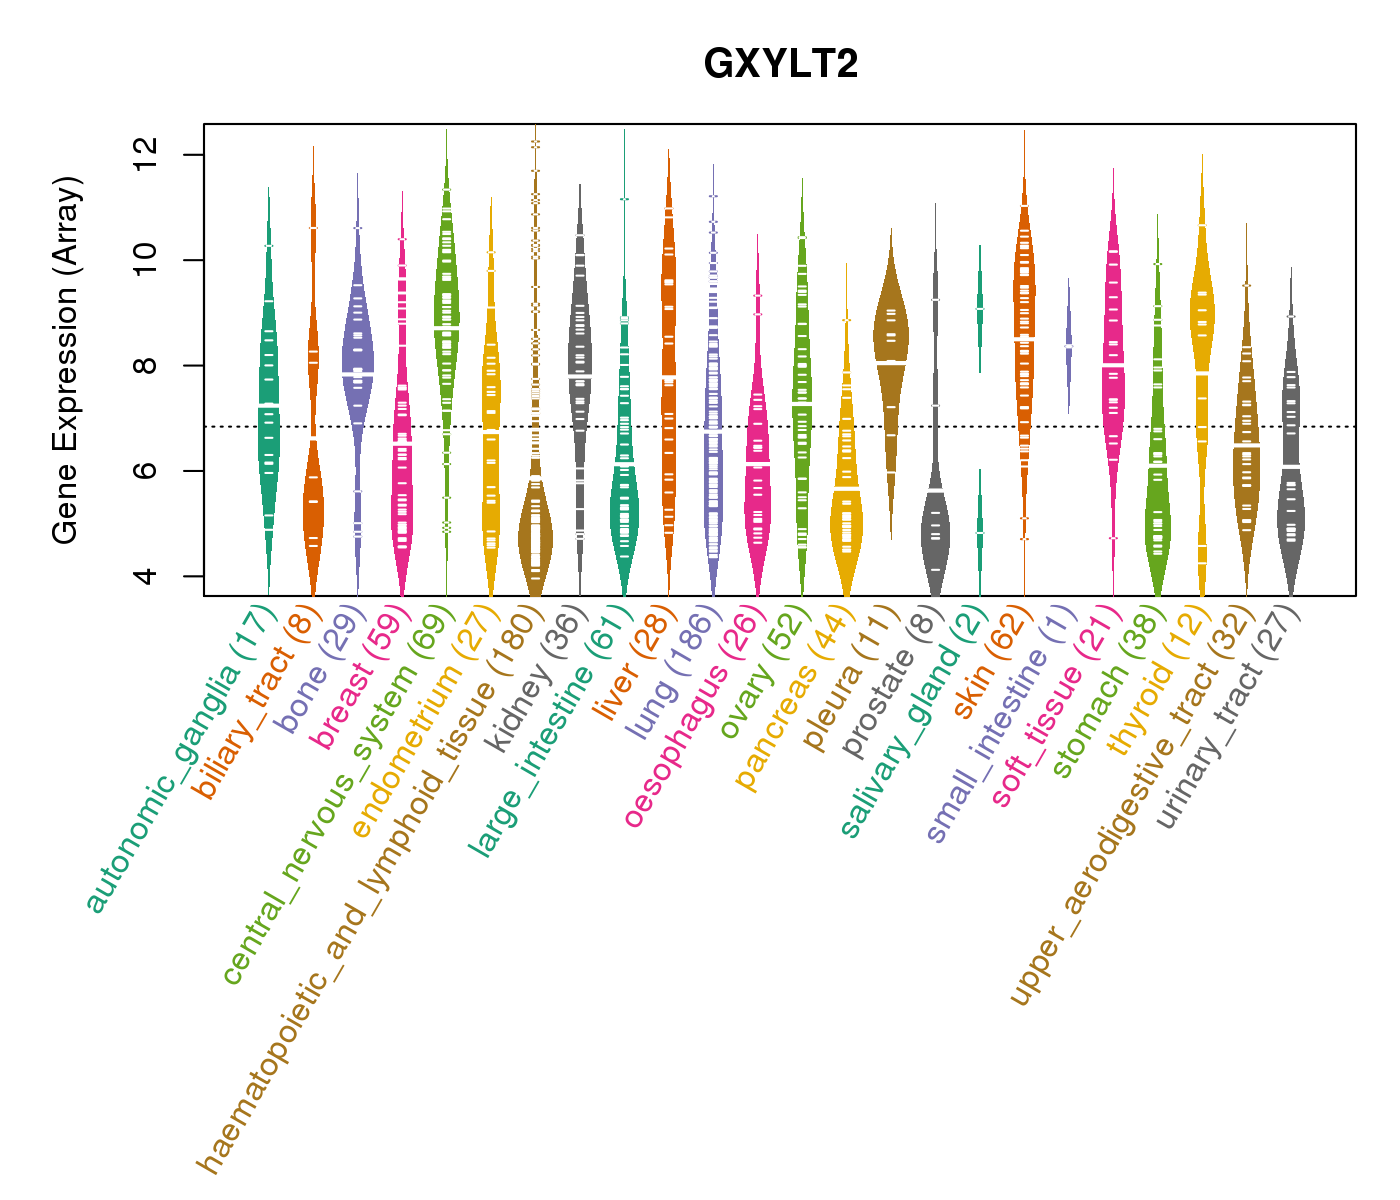
| Gene Expression for GXYLT2 |
| * CCLE gene expression data were extracted from CCLE_Expression_Entrez_2012-10-18.res: Gene-centric RMA-normalized mRNA expression data. |
 |
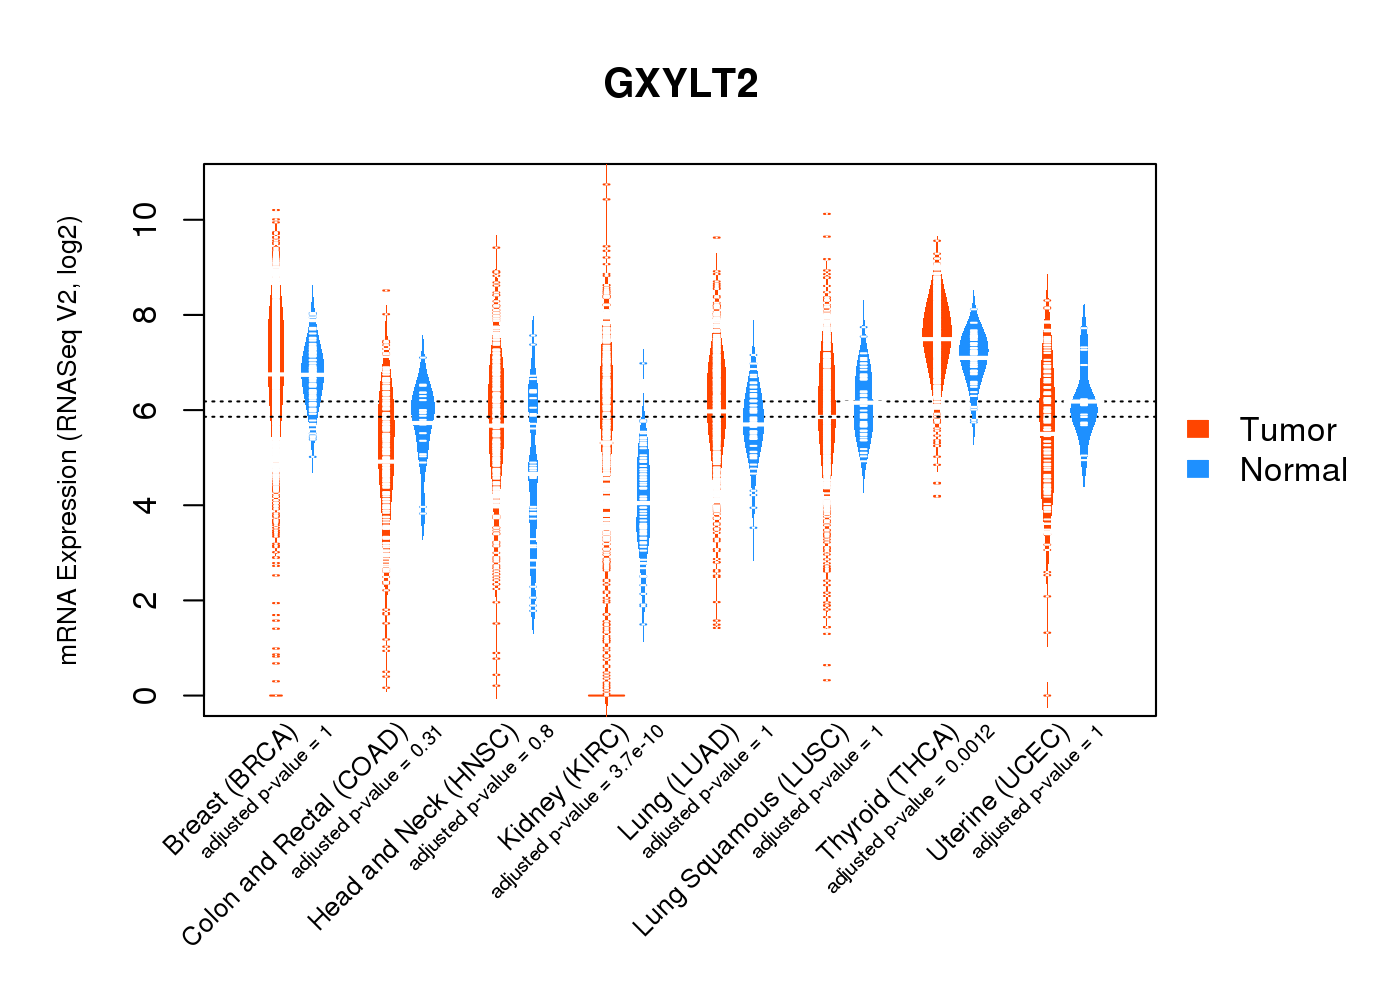
| * Normalized gene expression data of RNASeqV2 was extracted from TCGA using R package TCGA-Assembler. The URLs of all public data files on TCGA DCC data server were gathered at Jan-05-2015. Only eight cancer types have enough normal control samples for differential expression analysis. (t test, adjusted p<0.05 (using Benjamini-Hochberg FDR)) |
 |
| Top |
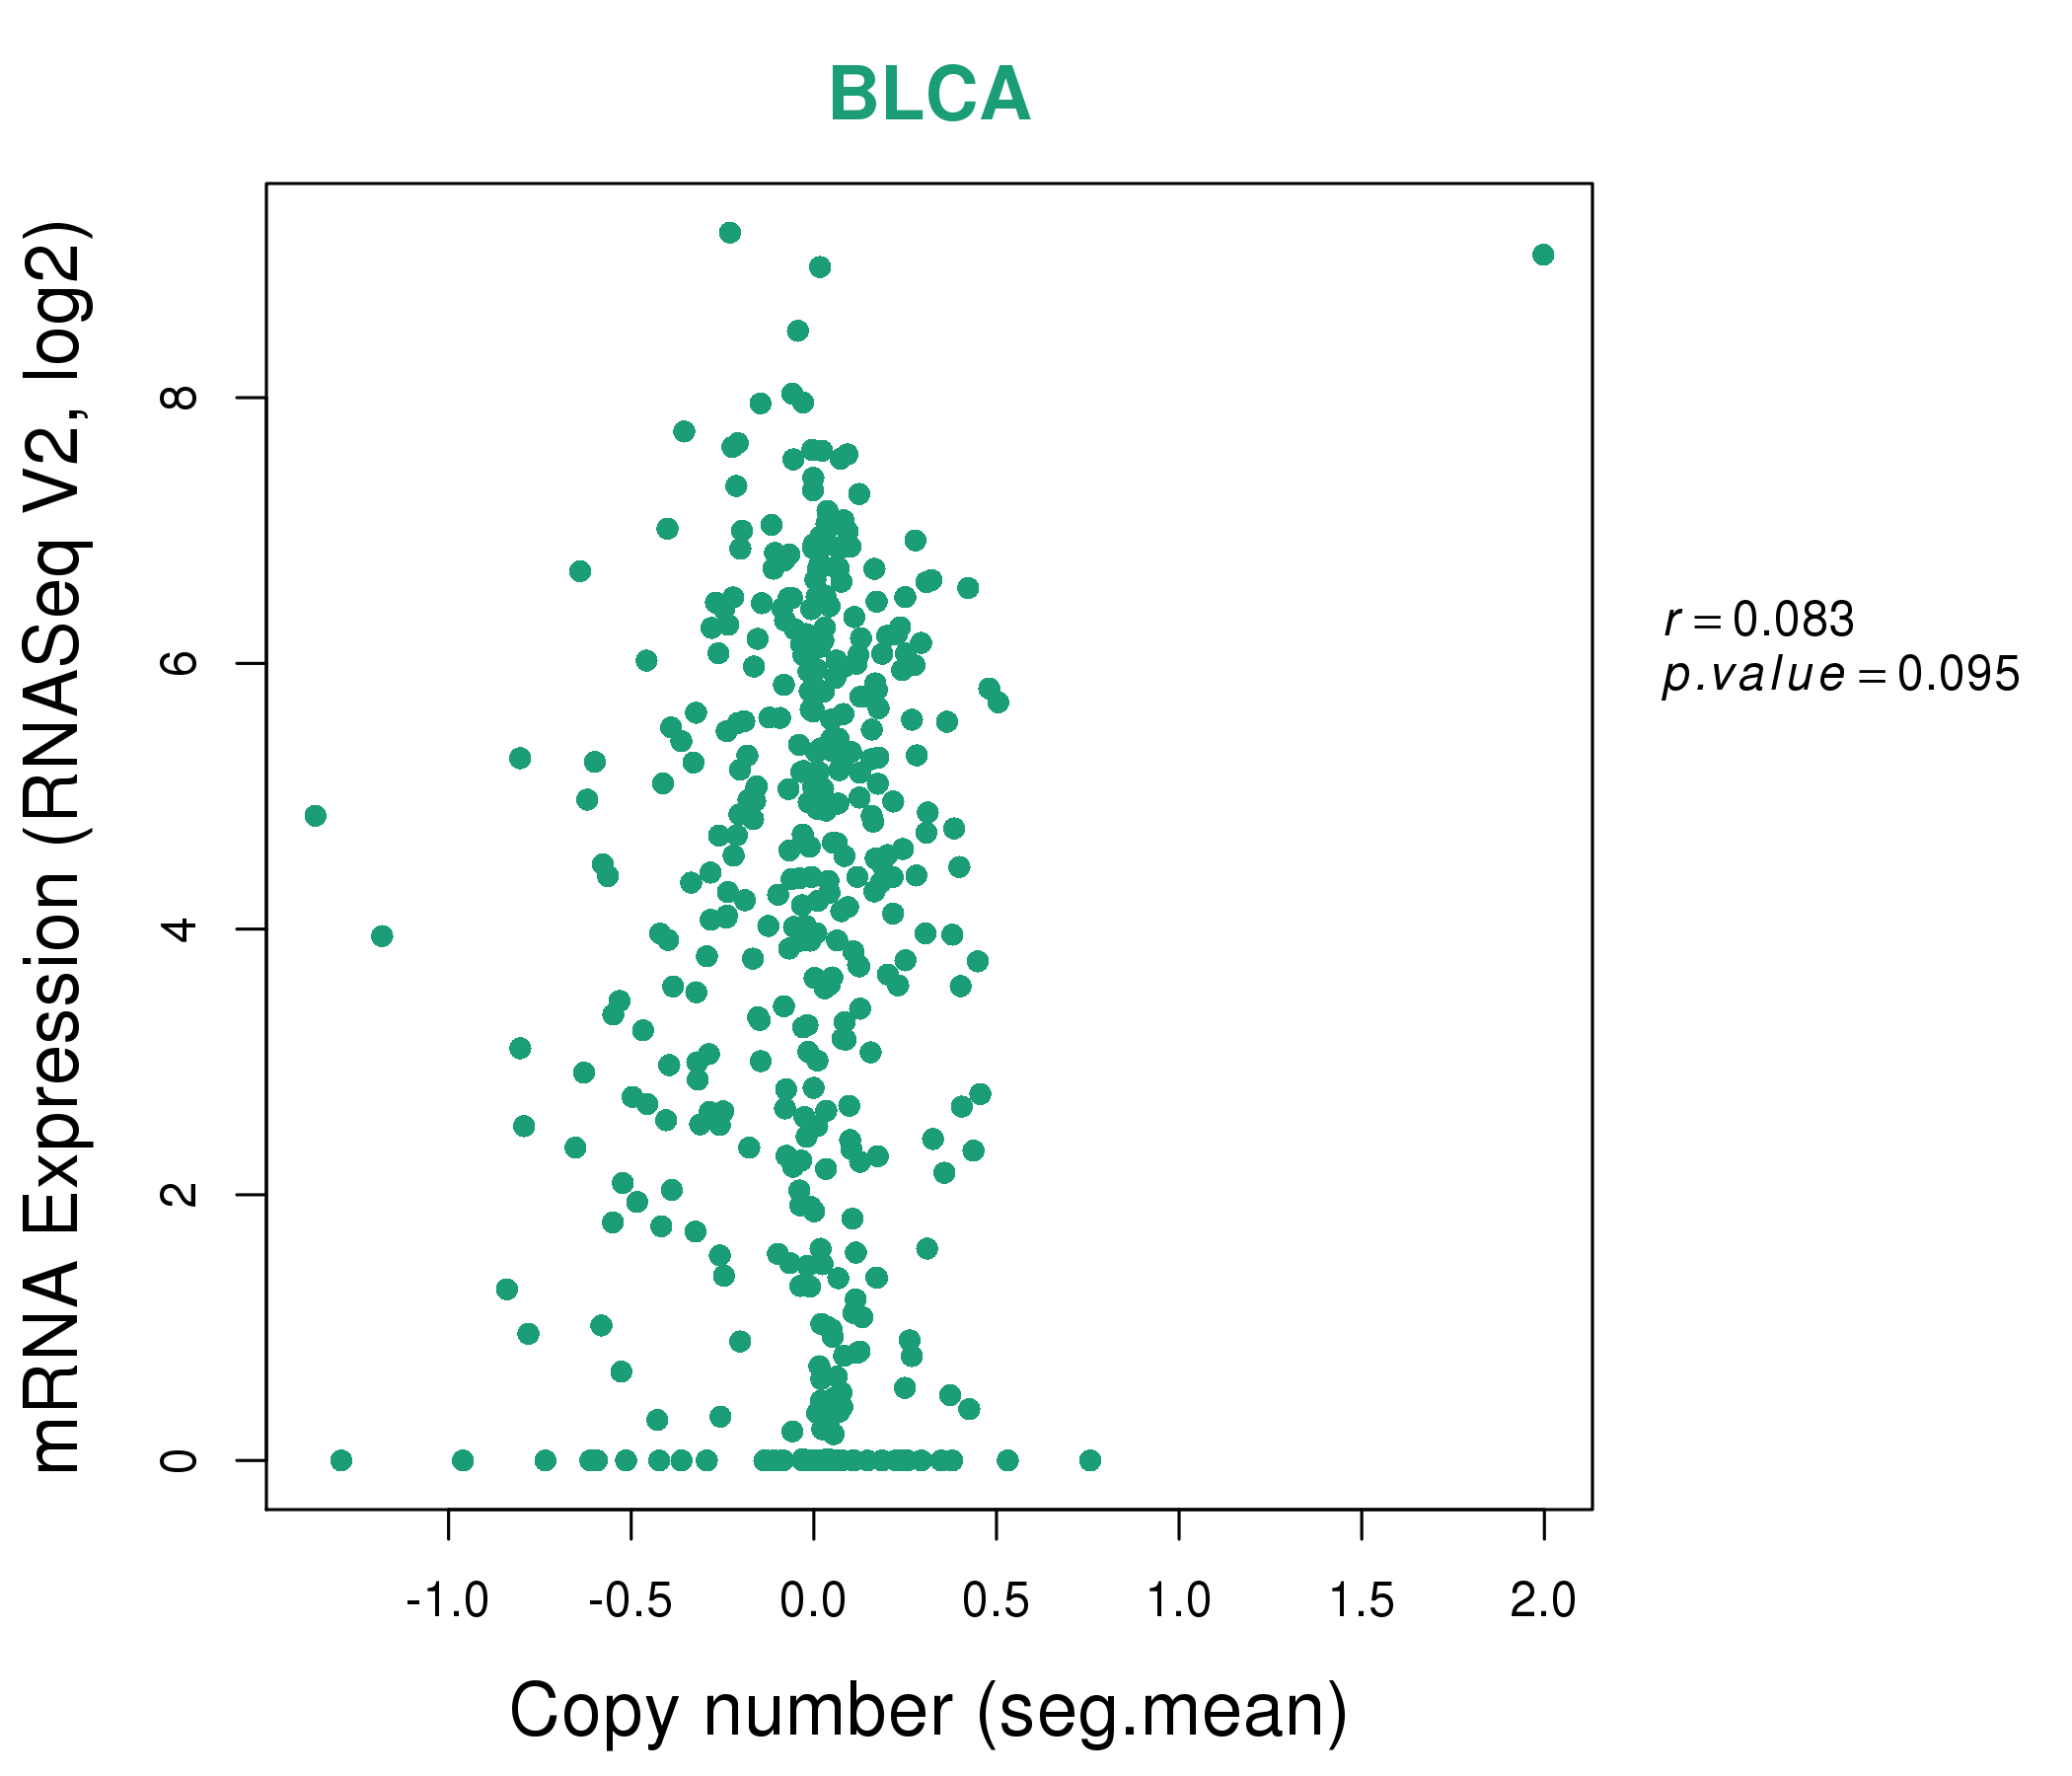
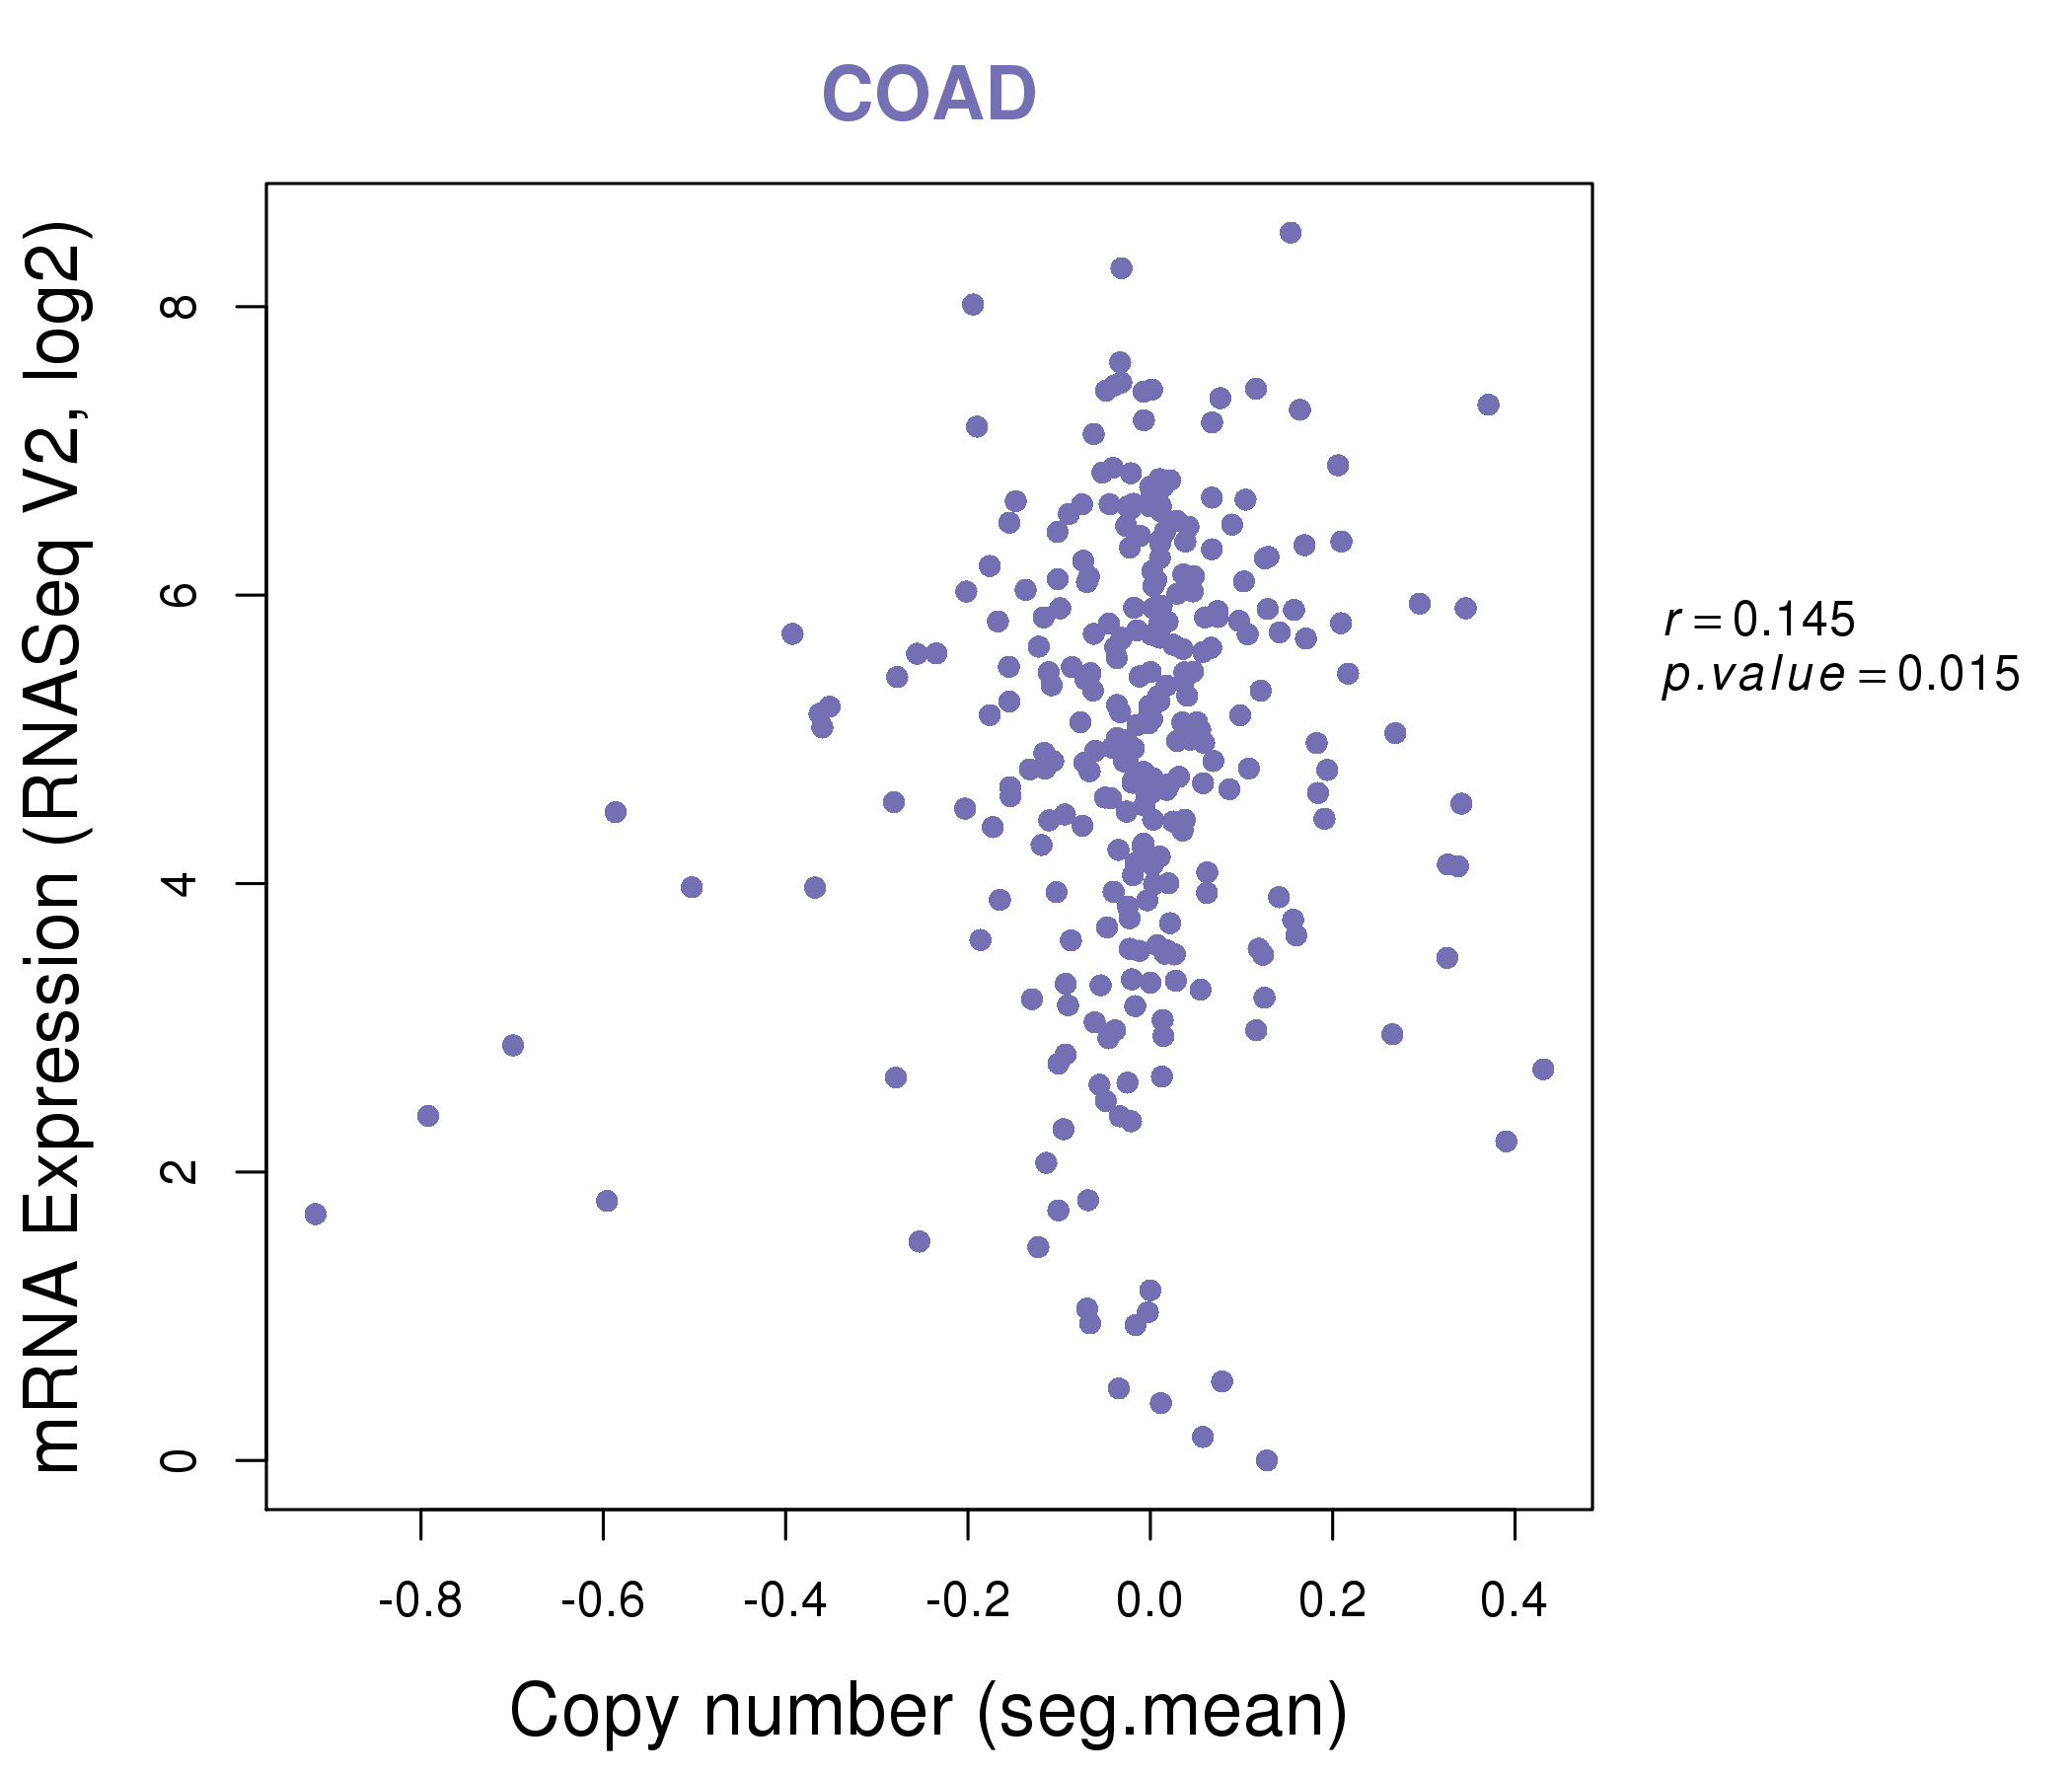
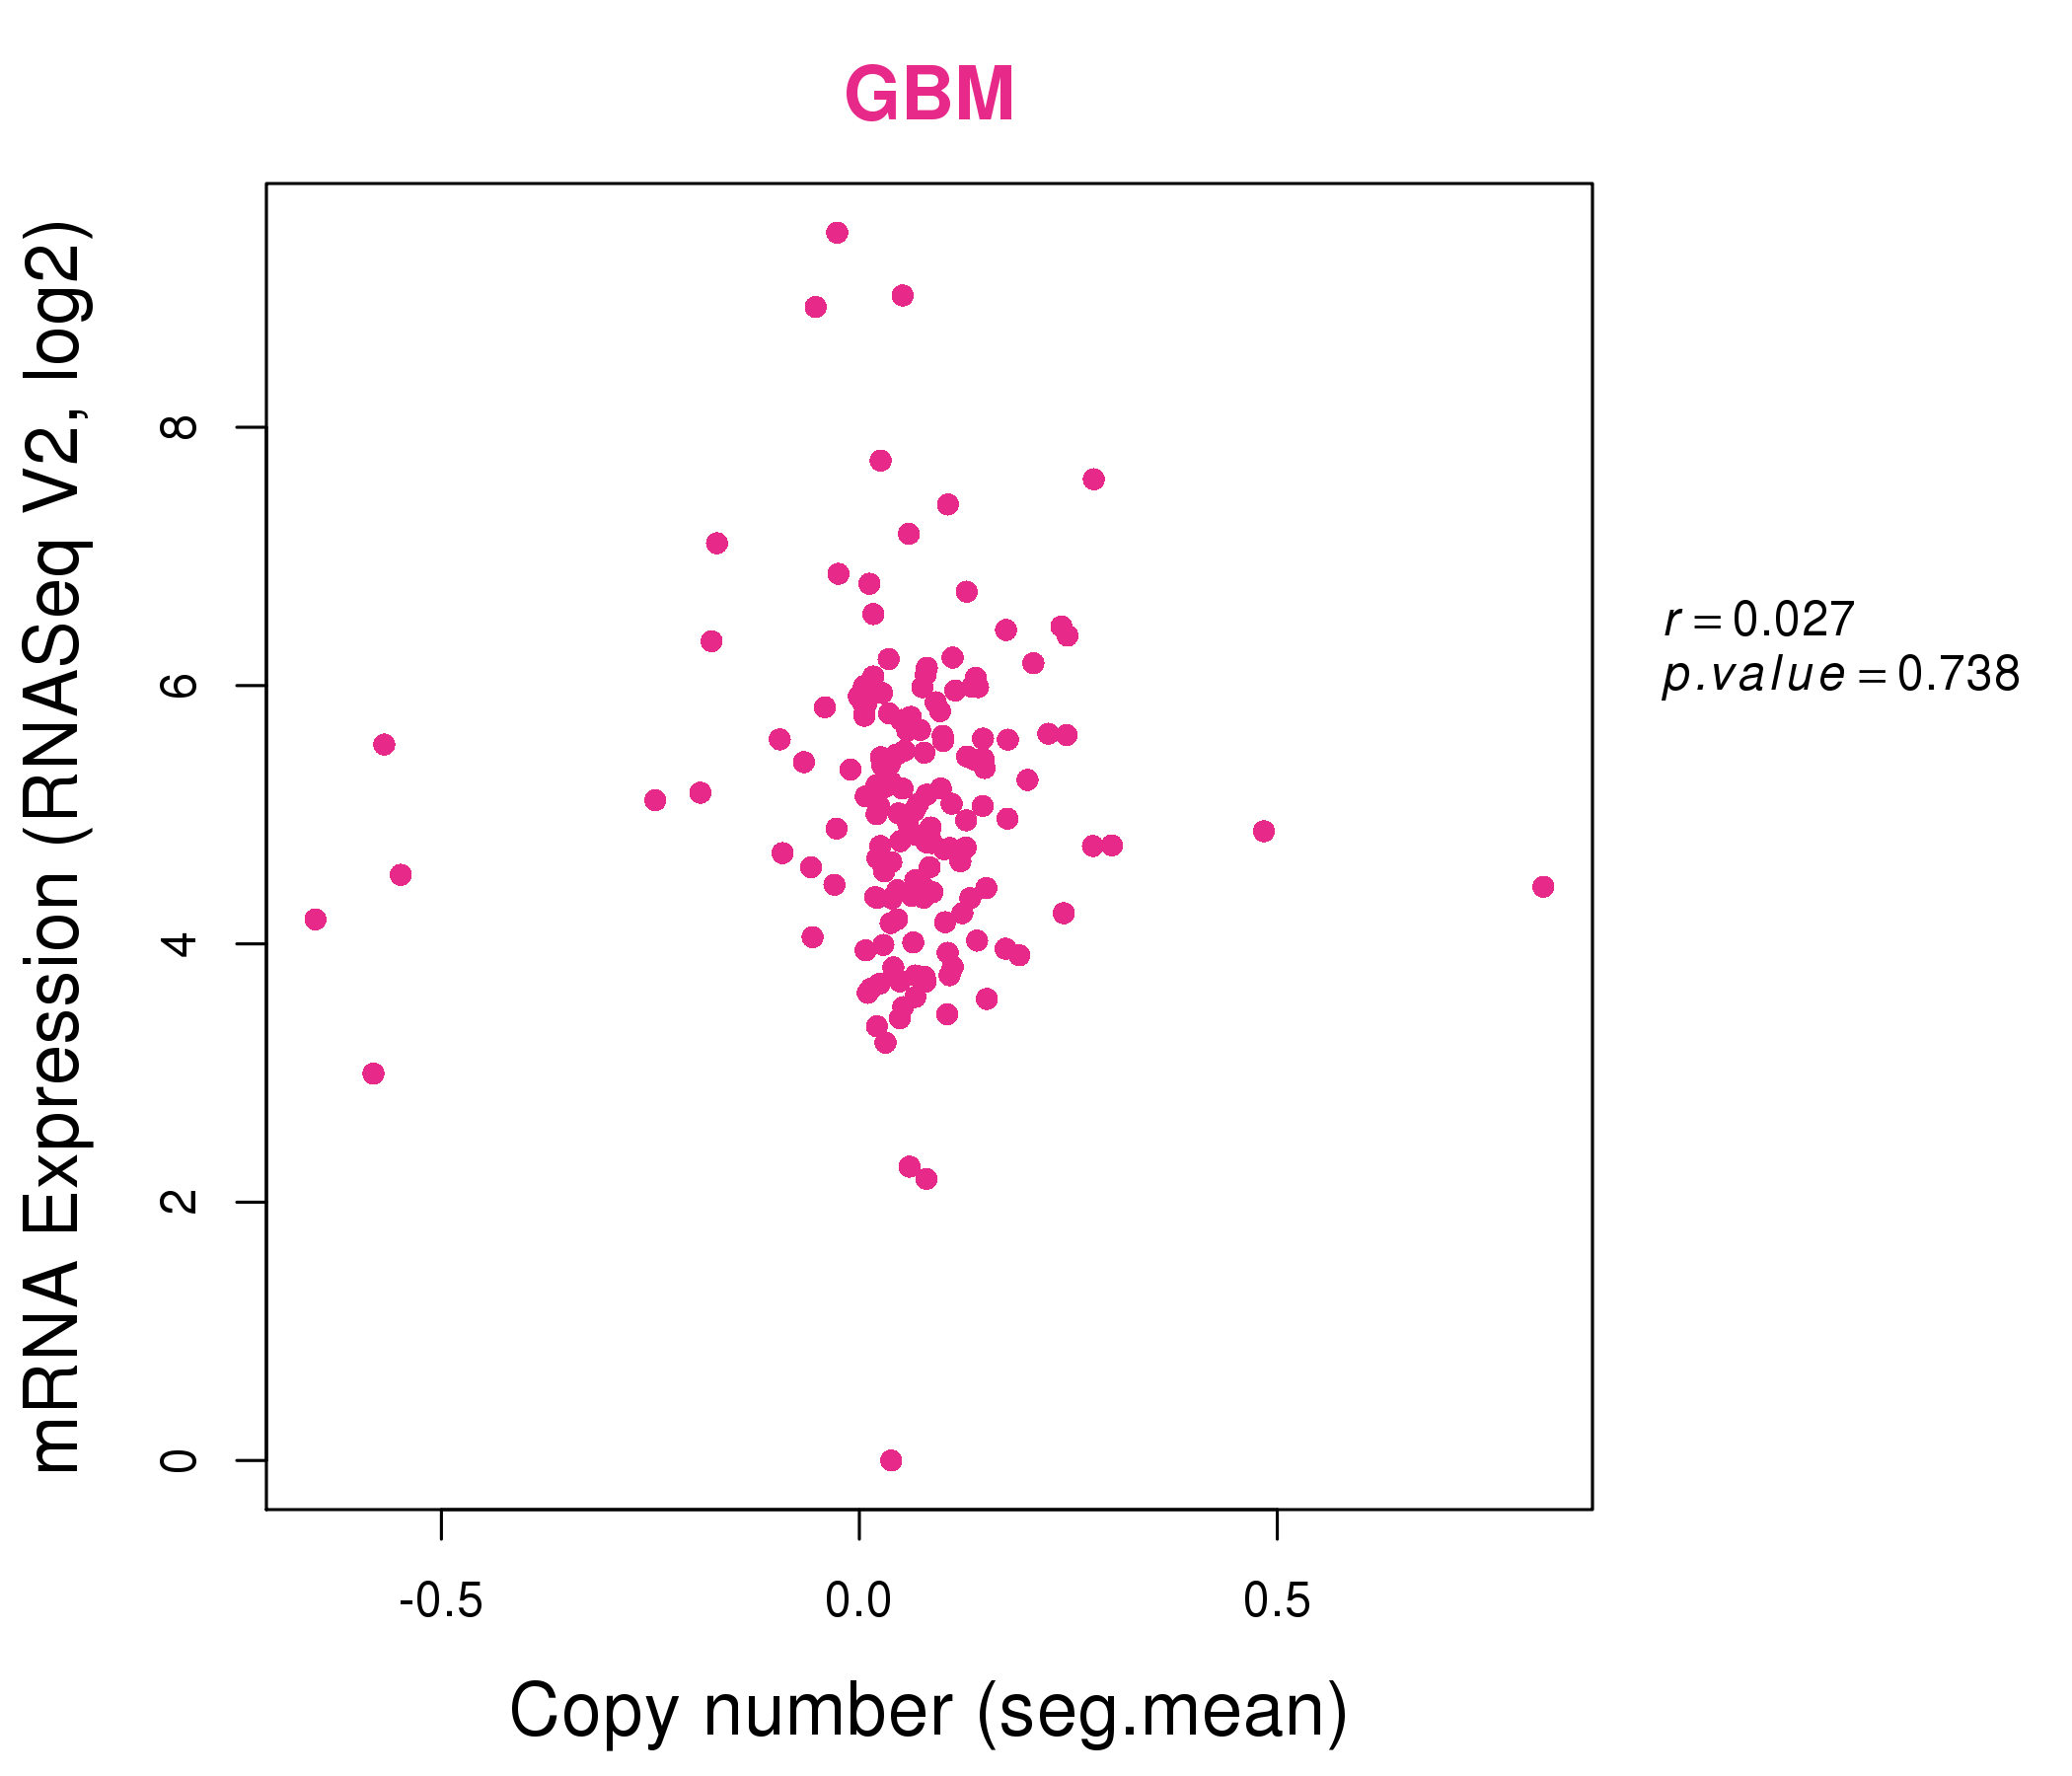
| * This plots show the correlation between CNV and gene expression. |
: Open all plots for all cancer types
 |
|
 |
|

| Top |
| Gene-Gene Network Information |
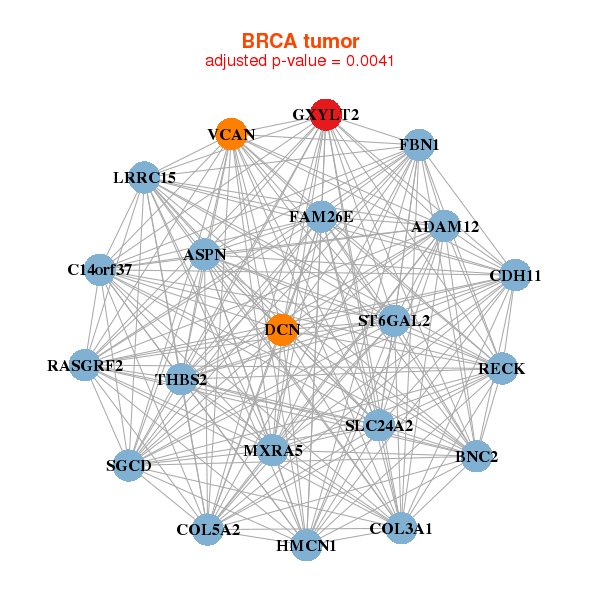
| * Co-Expression network figures were drawn using R package igraph. Only the top 20 genes with the highest correlations were shown. Red circle: input gene, orange circle: cell metabolism gene, sky circle: other gene |
: Open all plots for all cancer types
 |
|
| ADAM12,ASPN,BNC2,C14orf37,CDH11,COL3A1,COL5A2, DCN,FAM26E,FBN1,GXYLT2,HMCN1,LRRC15,MXRA5, RASGRF2,RECK,SGCD,SLC24A2,ST6GAL2,THBS2,VCAN | ADAMTSL1,BNC2,C14orf37,CDON,COL6A3,CORO2B,DCLK1, ENPEP,FAT4,GXYLT2,HMCN1,KDELC2,LPAR1,NID1, OLFML1,PCDH18,PDGFRB,RECK,RFTN2,RNF144A,TPST1 |
 |
|
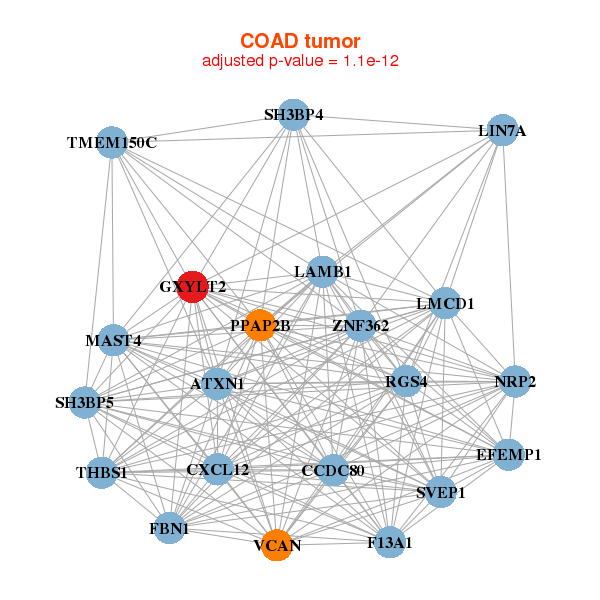
| ATXN1,CCDC80,CXCL12,EFEMP1,F13A1,FBN1,GXYLT2, LAMB1,LIN7A,LMCD1,MAST4,NRP2,PPAP2B,RGS4, SH3BP4,SH3BP5,SVEP1,THBS1,TMEM150C,VCAN,ZNF362 | ASAP3,B4GALNT2,COLCA2,APMAP,CCNJL,EDA,EHHADH, EPB41L1,GXYLT2,HMGCS2,HOXB6,HOXB8,KCNE2,KCNV1, KREMEN1,LRPPRC,NAALADL2,PKHD1,SCUBE2,TBC1D4,VGLL4 |

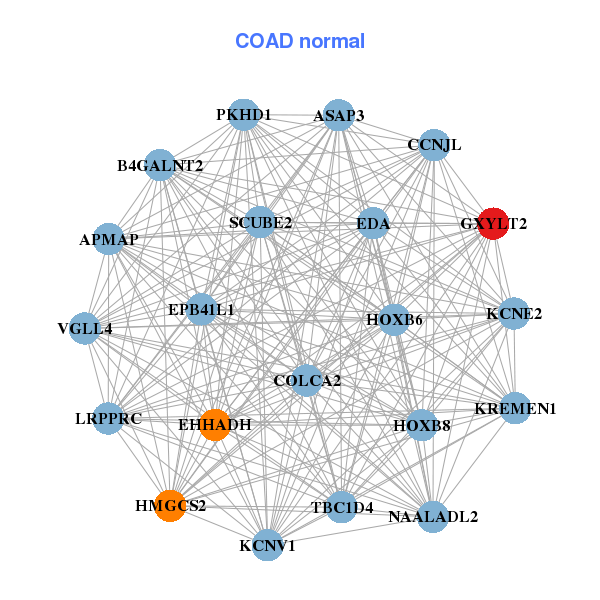
| * Co-Expression network figures were drawn using R package igraph. Only the top 20 genes with the highest correlations were shown. Red circle: input gene, orange circle: cell metabolism gene, sky circle: other gene |
: Open all plots for all cancer types
| Top |
: Open all interacting genes' information including KEGG pathway for all interacting genes from DAVID
| Top |
| Pharmacological Information for GXYLT2 |
| There's no related Drug. |
| Top |
| Cross referenced IDs for GXYLT2 |
| * We obtained these cross-references from Uniprot database. It covers 150 different DBs, 18 categories. http://www.uniprot.org/help/cross_references_section |
: Open all cross reference information
|
Copyright © 2016-Present - The Univsersity of Texas Health Science Center at Houston @ |