|
||||||||||||||||||||||||||||||||||||||||||||||||||||||||||||||||||||||||||||||||||||||||||||||||||||||||||||||||||||||||||||||||||||||||||||||||||||||||||||||||||||||||||||||||||||||||||||||||||||||||||||||||||||||||||||||||||||||||||||||||||||||||||||||||||||||||||||||||||||||||||||||||||||||||||||||||||||||||||
| |
| Phenotypic Information (metabolism pathway, cancer, disease, phenome) |
| |
| |
| Gene-Gene Network Information: Co-Expression Network, Interacting Genes & KEGG |
| |
|


| Gene Summary for D2HGDH |
| Top |
| Phenotypic Information for D2HGDH(metabolism pathway, cancer, disease, phenome) |
| Cancer | CGAP: D2HGDH |
| Familial Cancer Database: D2HGDH | |
| * This gene is included in those cancer gene databases. |
|
|
|
|
|
| . | ||||||||||||||||||||||||||||||||||||||||||||||||||||||||||||||||||||||||||||||||||||||||||||||||||||||||||||||||||||||||||||||||||||||||||||||||||||||||||||||||||||||||||||||||||||||||||||||||||||||||||||||||||||||||||||||||||||||||||||||||||||||||||||||||||||||||||||||||||||||||||||||||||||||||||||||||||||
Oncogene 1 | Significant driver gene in | |||||||||||||||||||||||||||||||||||||||||||||||||||||||||||||||||||||||||||||||||||||||||||||||||||||||||||||||||||||||||||||||||||||||||||||||||||||||||||||||||||||||||||||||||||||||||||||||||||||||||||||||||||||||||||||||||||||||||||||||||||||||||||||||||||||||||||||||||||||||||||||||||||||||||||||||||||||||||
| cf) number; DB name 1 Oncogene; http://nar.oxfordjournals.org/content/35/suppl_1/D721.long, 2 Tumor Suppressor gene; https://bioinfo.uth.edu/TSGene/, 3 Cancer Gene Census; http://www.nature.com/nrc/journal/v4/n3/abs/nrc1299.html, 4 CancerGenes; http://nar.oxfordjournals.org/content/35/suppl_1/D721.long, 5 Network of Cancer Gene; http://ncg.kcl.ac.uk/index.php, 1Therapeutic Vulnerabilities in Cancer; http://cbio.mskcc.org/cancergenomics/statius/ |
| REACTOME_PYRUVATE_METABOLISM_AND_CITRIC_ACID_TCA_CYCLE | |
| OMIM | |
| Orphanet | |
| Disease | KEGG Disease: D2HGDH |
| MedGen: D2HGDH (Human Medical Genetics with Condition) | |
| ClinVar: D2HGDH | |
| Phenotype | MGI: D2HGDH (International Mouse Phenotyping Consortium) |
| PhenomicDB: D2HGDH | |
| Mutations for D2HGDH |
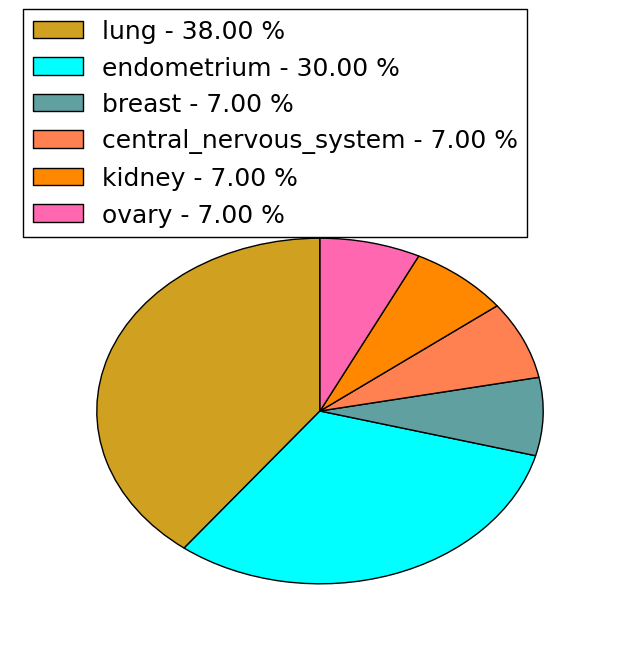
| * Under tables are showing count per each tissue to give us broad intuition about tissue specific mutation patterns.You can go to the detailed page for each mutation database's web site. |
| There's no structural variation information in COSMIC data for this gene. |
| * From mRNA Sanger sequences, Chitars2.0 arranged chimeric transcripts. This table shows D2HGDH related fusion information. |
| ID | Head Gene | Tail Gene | Accession | Gene_a | qStart_a | qEnd_a | Chromosome_a | tStart_a | tEnd_a | Gene_a | qStart_a | qEnd_a | Chromosome_a | tStart_a | tEnd_a |
| BF920776 | D2HGDH | 33 | 331 | 2 | 242690672 | 242695430 | HDGFRP2 | 328 | 348 | 19 | 4500224 | 4500244 | |
| Top |
| Mutation type/ Tissue ID | brca | cns | cerv | endome | haematopo | kidn | Lintest | liver | lung | ns | ovary | pancre | prost | skin | stoma | thyro | urina | |||
| Total # sample | 1 | |||||||||||||||||||
| GAIN (# sample) | 1 | |||||||||||||||||||
| LOSS (# sample) |
| cf) Tissue ID; Tissue type (1; Breast, 2; Central_nervous_system, 3; Cervix, 4; Endometrium, 5; Haematopoietic_and_lymphoid_tissue, 6; Kidney, 7; Large_intestine, 8; Liver, 9; Lung, 10; NS, 11; Ovary, 12; Pancreas, 13; Prostate, 14; Skin, 15; Stomach, 16; Thyroid, 17; Urinary_tract) |
| Top |
|
 |
| Top |
| Stat. for Non-Synonymous SNVs (# total SNVs=40) | (# total SNVs=13) |
 |  |
(# total SNVs=0) | (# total SNVs=0) |
| Top |
| * When you move the cursor on each content, you can see more deailed mutation information on the Tooltip. Those are primary_site,primary_histology,mutation(aa),pubmedID. |
| GRCh37 position | Mutation(aa) | Unique sampleID count |
| chr2:242674803-242674803 | p.R55Q | 5 |
| chr2:242695381-242695381 | p.A420T | 2 |
| chr2:242681891-242681891 | p.G131V | 2 |
| chr2:242689687-242689687 | p.L325L | 2 |
| chr2:242681982-242681982 | p.S161S | 1 |
| chr2:242695360-242695360 | p.D413N | 1 |
| chr2:242684183-242684183 | p.G248G | 1 |
| chr2:242707181-242707181 | p.A455T | 1 |
| chr2:242680475-242680475 | p.R107Q | 1 |
| chr2:242690691-242690691 | p.S343L | 1 |
| Top |
|
 |
| Point Mutation/ Tissue ID | 1 | 2 | 3 | 4 | 5 | 6 | 7 | 8 | 9 | 10 | 11 | 12 | 13 | 14 | 15 | 16 | 17 | 18 | 19 | 20 |
| # sample | 1 | 2 | 1 | 3 | 2 | 6 | 2 | 4 | 4 | 1 | 9 | |||||||||
| # mutation | 1 | 2 | 1 | 3 | 2 | 6 | 2 | 4 | 4 | 1 | 9 | |||||||||
| nonsynonymous SNV | 1 | 1 | 1 | 2 | 1 | 3 | 1 | 2 | 4 | 5 | ||||||||||
| synonymous SNV | 1 | 1 | 1 | 3 | 1 | 2 | 1 | 4 |
| cf) Tissue ID; Tissue type (1; BLCA[Bladder Urothelial Carcinoma], 2; BRCA[Breast invasive carcinoma], 3; CESC[Cervical squamous cell carcinoma and endocervical adenocarcinoma], 4; COAD[Colon adenocarcinoma], 5; GBM[Glioblastoma multiforme], 6; Glioma Low Grade, 7; HNSC[Head and Neck squamous cell carcinoma], 8; KICH[Kidney Chromophobe], 9; KIRC[Kidney renal clear cell carcinoma], 10; KIRP[Kidney renal papillary cell carcinoma], 11; LAML[Acute Myeloid Leukemia], 12; LUAD[Lung adenocarcinoma], 13; LUSC[Lung squamous cell carcinoma], 14; OV[Ovarian serous cystadenocarcinoma ], 15; PAAD[Pancreatic adenocarcinoma], 16; PRAD[Prostate adenocarcinoma], 17; SKCM[Skin Cutaneous Melanoma], 18:STAD[Stomach adenocarcinoma], 19:THCA[Thyroid carcinoma], 20:UCEC[Uterine Corpus Endometrial Carcinoma]) |
| Top |
| * We represented just top 10 SNVs. When you move the cursor on each content, you can see more deailed mutation information on the Tooltip. Those are primary_site, primary_histology, mutation(aa), pubmedID. |
| Genomic Position | Mutation(aa) | Unique sampleID count |
| chr2:242695381 | p.A286T,D2HGDH | 2 |
| chr2:242689645 | p.V28M,D2HGDH | 1 |
| chr2:242695407 | p.A239T,D2HGDH | 1 |
| chr2:242681957 | p.A36V,D2HGDH | 1 |
| chr2:242689675 | p.T256K,D2HGDH | 1 |
| chr2:242707130 | p.S44G,D2HGDH | 1 |
| chr2:242681983 | p.D279N,D2HGDH | 1 |
| chr2:242689687 | p.G59R,D2HGDH | 1 |
| chr2:242707146 | p.N73N,D2HGDH | 1 |
| chr2:242683055 | p.H294H,D2HGDH | 1 |
| * Copy number data were extracted from TCGA using R package TCGA-Assembler. The URLs of all public data files on TCGA DCC data server were gathered on Jan-05-2015. Function ProcessCNAData in TCGA-Assembler package was used to obtain gene-level copy number value which is calculated as the average copy number of the genomic region of a gene. |
 |
| cf) Tissue ID[Tissue type]: BLCA[Bladder Urothelial Carcinoma], BRCA[Breast invasive carcinoma], CESC[Cervical squamous cell carcinoma and endocervical adenocarcinoma], COAD[Colon adenocarcinoma], GBM[Glioblastoma multiforme], Glioma Low Grade, HNSC[Head and Neck squamous cell carcinoma], KICH[Kidney Chromophobe], KIRC[Kidney renal clear cell carcinoma], KIRP[Kidney renal papillary cell carcinoma], LAML[Acute Myeloid Leukemia], LUAD[Lung adenocarcinoma], LUSC[Lung squamous cell carcinoma], OV[Ovarian serous cystadenocarcinoma ], PAAD[Pancreatic adenocarcinoma], PRAD[Prostate adenocarcinoma], SKCM[Skin Cutaneous Melanoma], STAD[Stomach adenocarcinoma], THCA[Thyroid carcinoma], UCEC[Uterine Corpus Endometrial Carcinoma] |
| Top |
| Gene Expression for D2HGDH |
| * CCLE gene expression data were extracted from CCLE_Expression_Entrez_2012-10-18.res: Gene-centric RMA-normalized mRNA expression data. |
 |
| * Normalized gene expression data of RNASeqV2 was extracted from TCGA using R package TCGA-Assembler. The URLs of all public data files on TCGA DCC data server were gathered at Jan-05-2015. Only eight cancer types have enough normal control samples for differential expression analysis. (t test, adjusted p<0.05 (using Benjamini-Hochberg FDR)) |
 |
| Top |
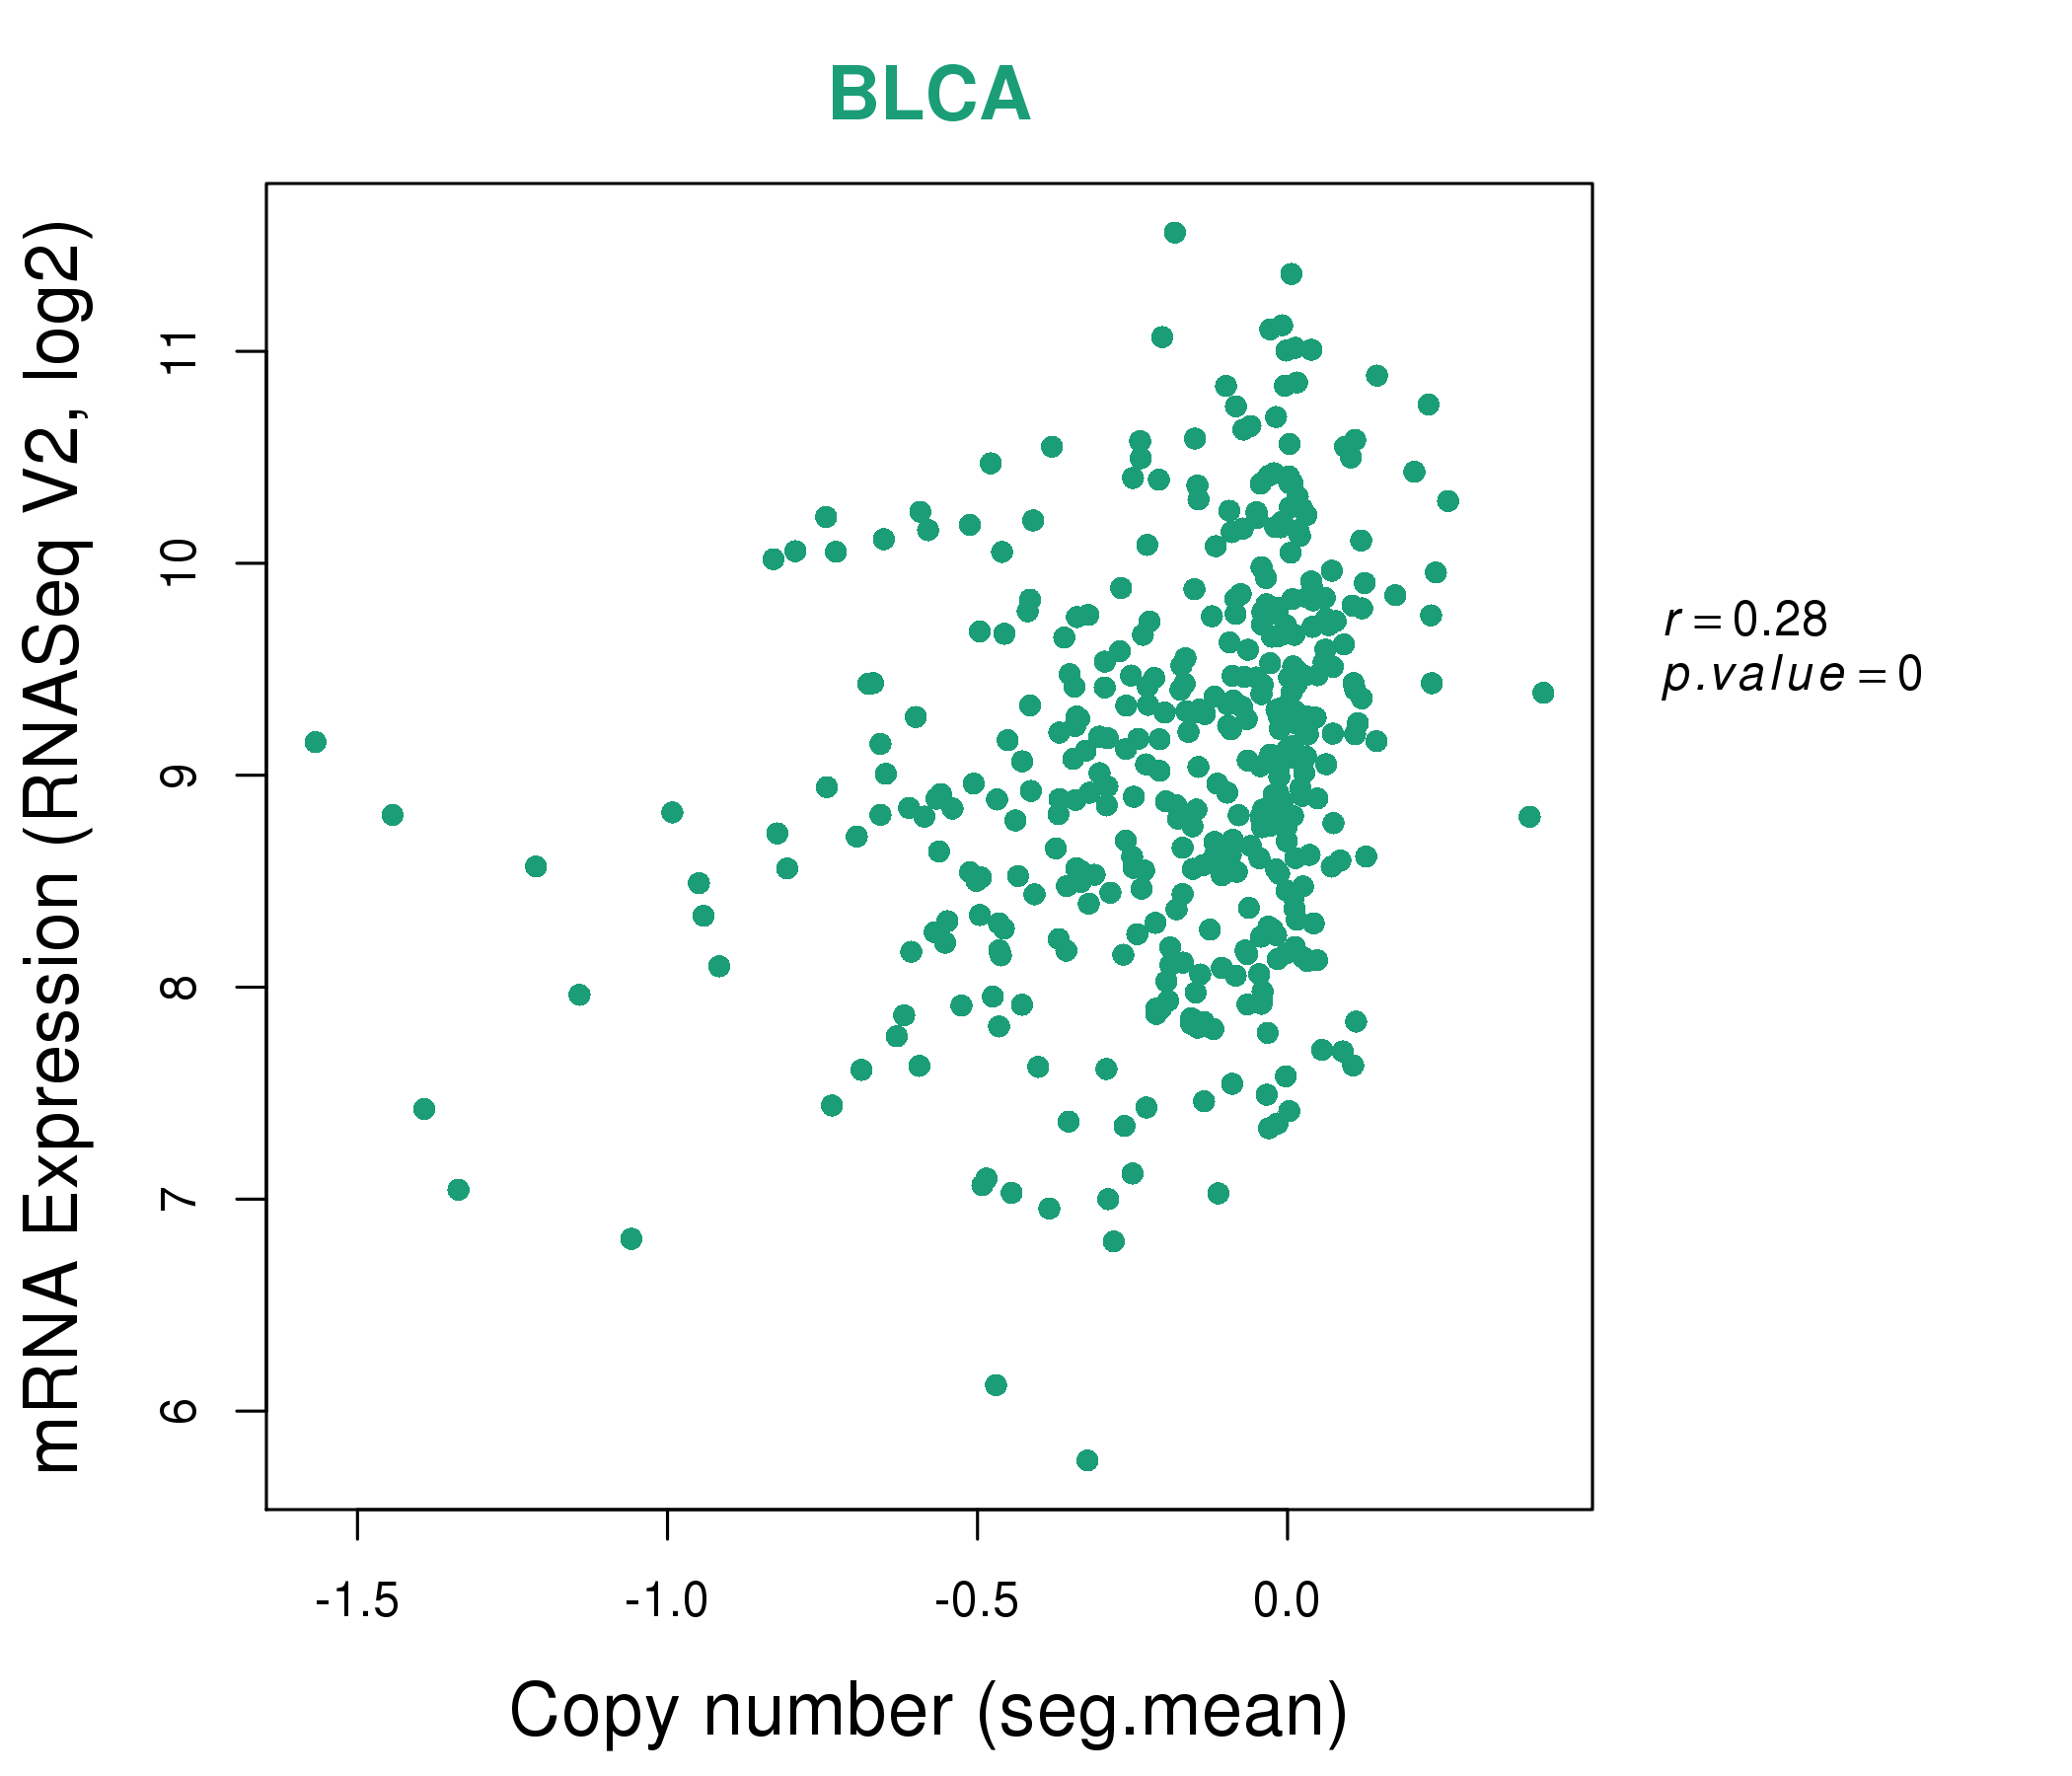
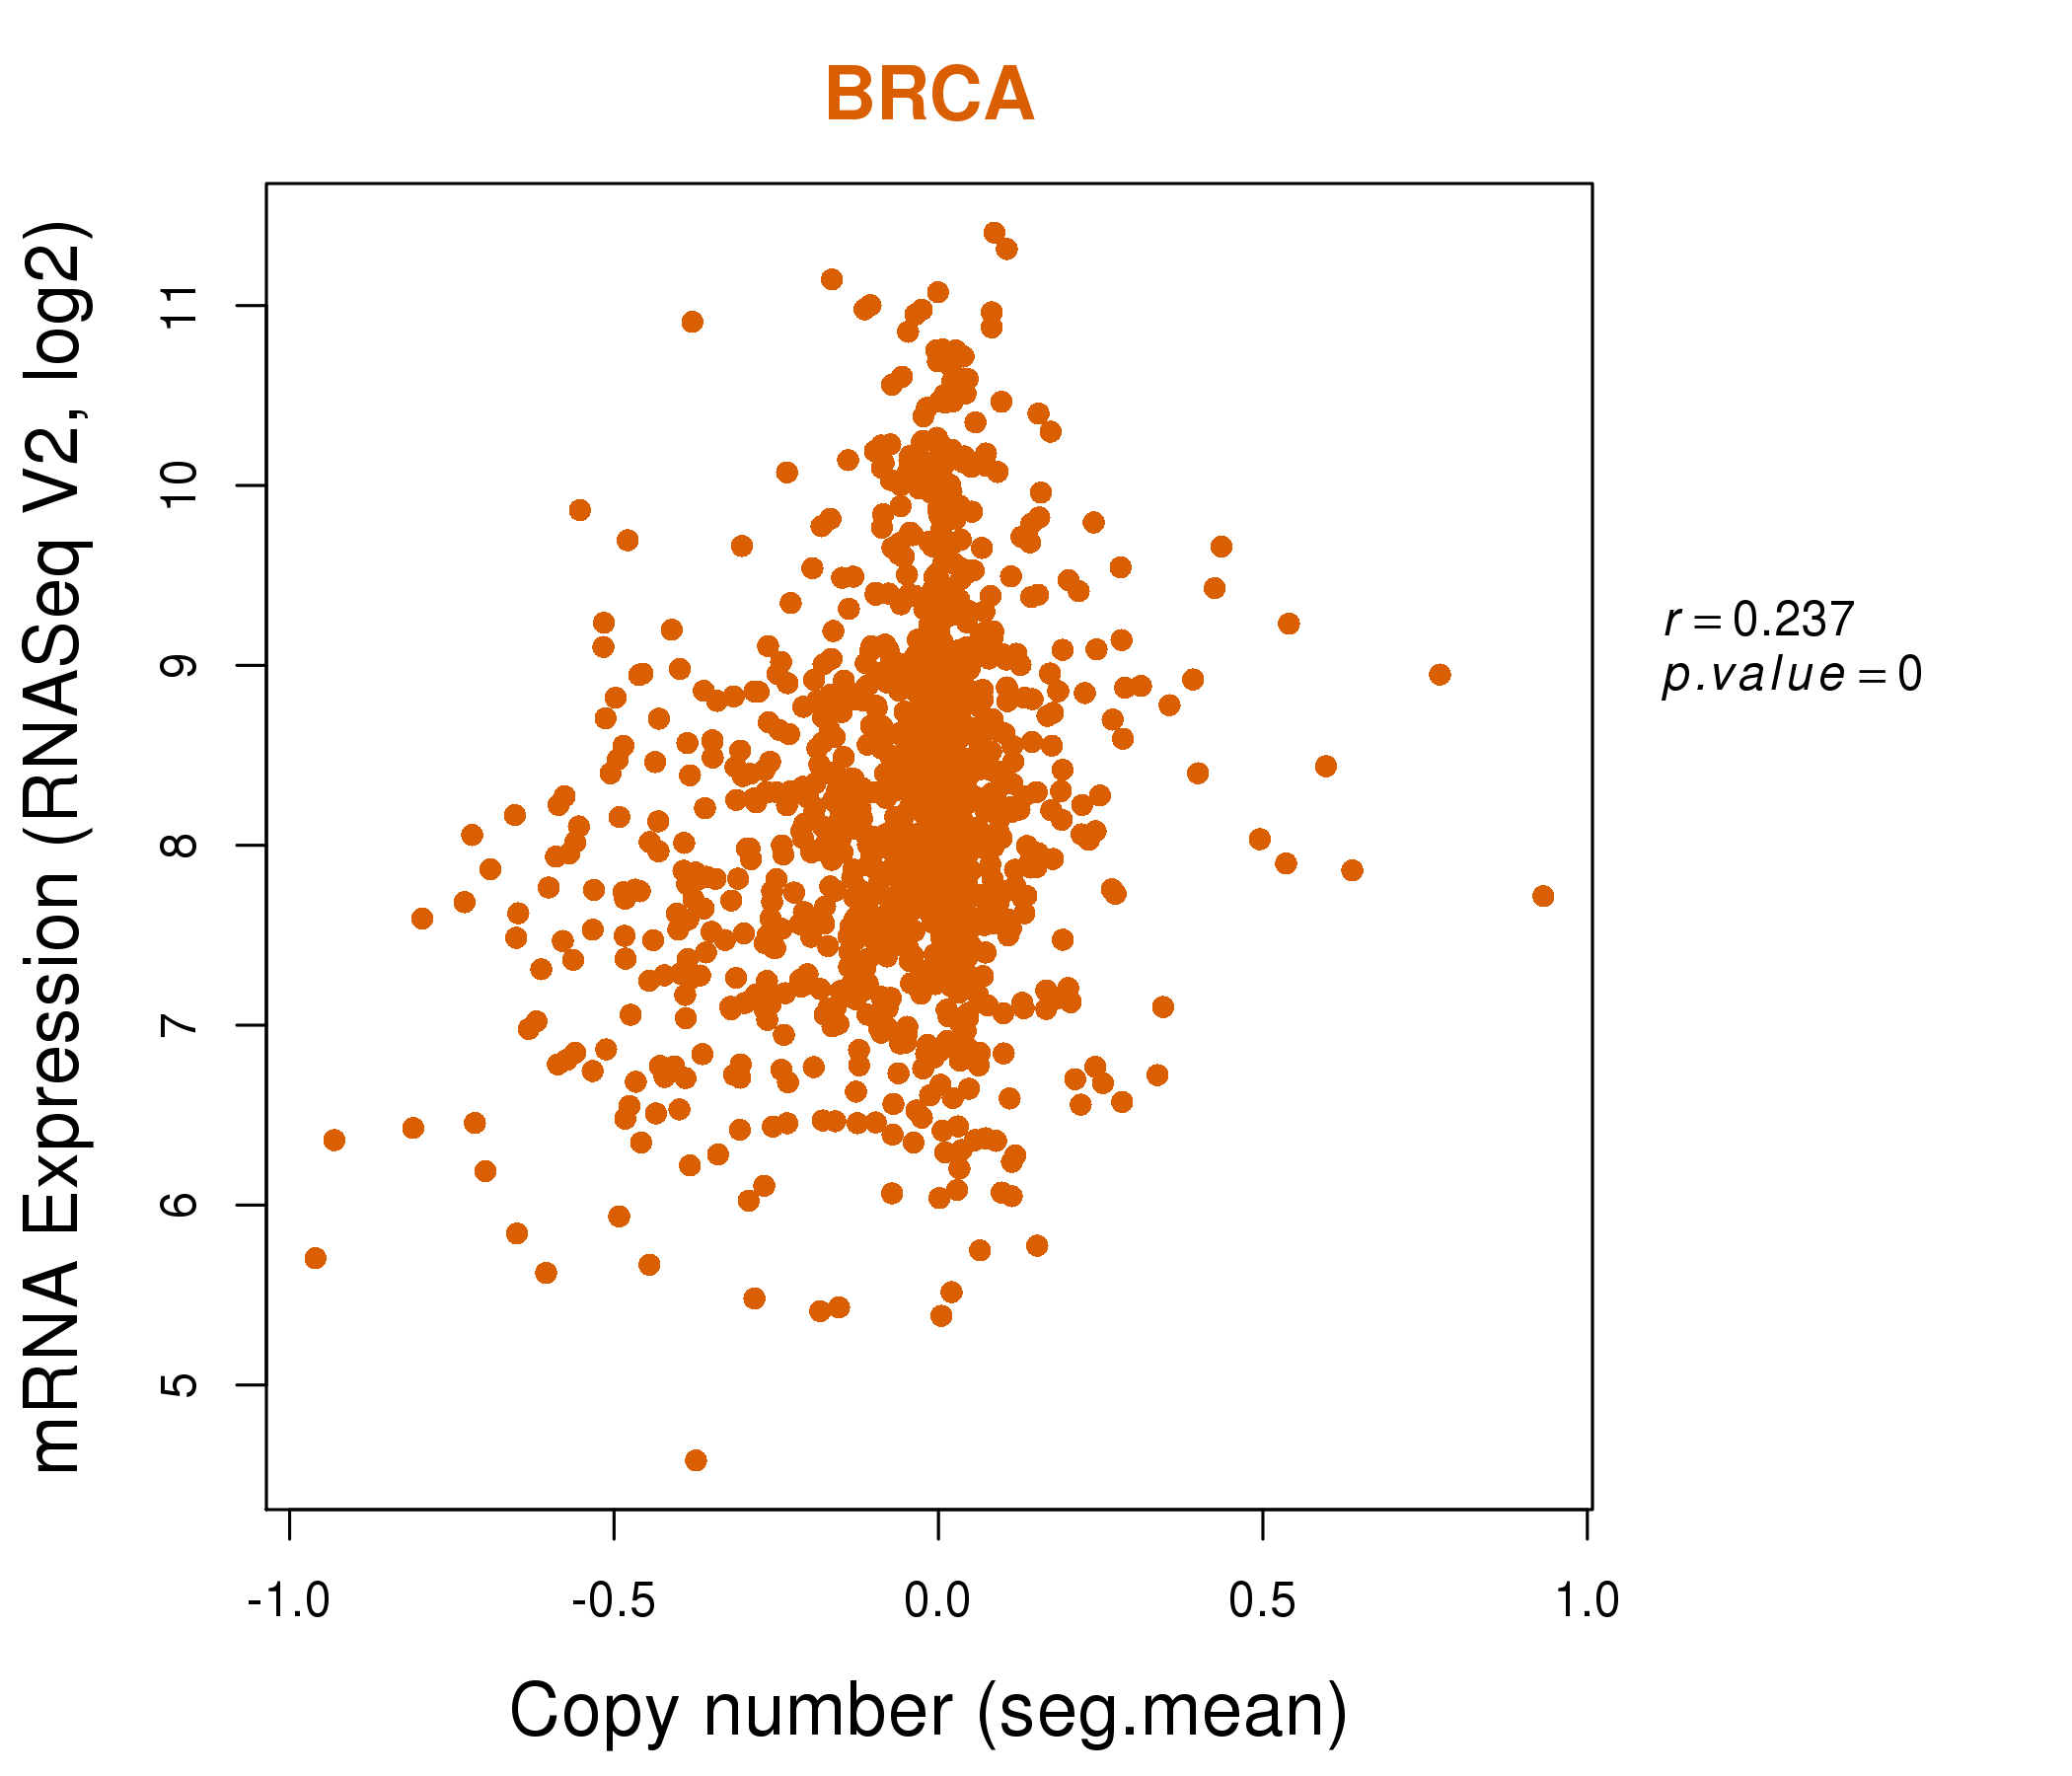
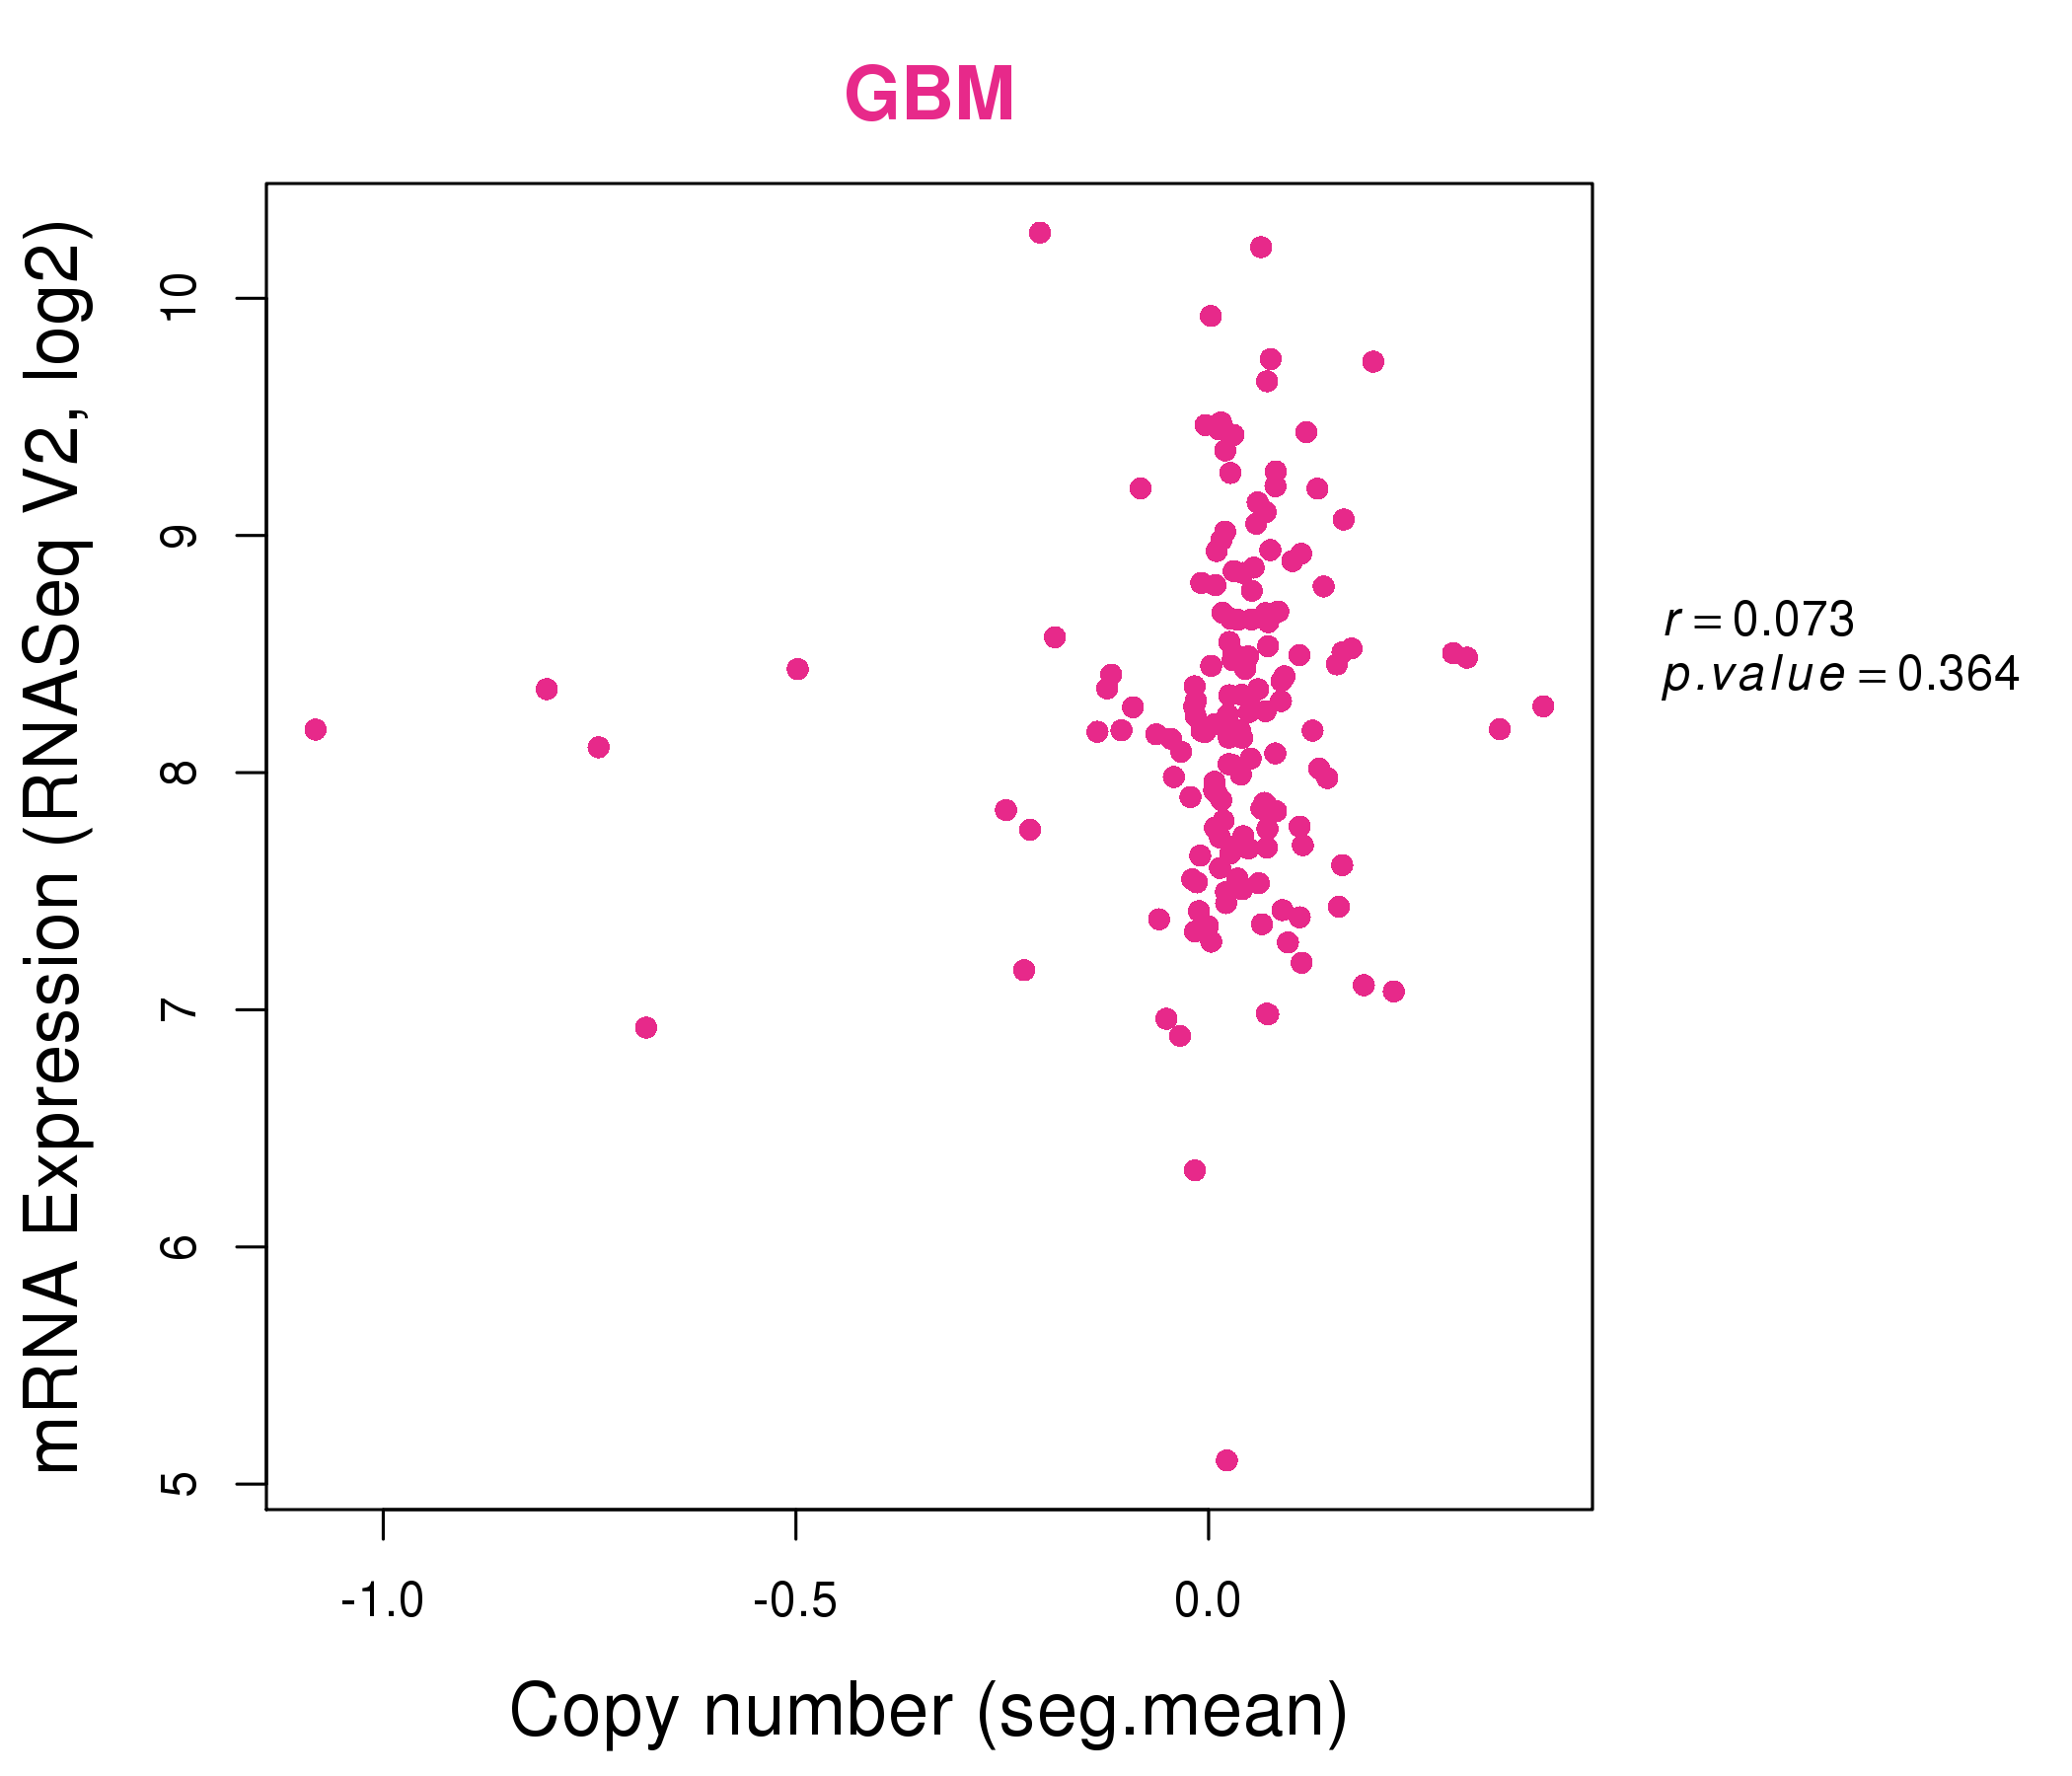
| * This plots show the correlation between CNV and gene expression. |
: Open all plots for all cancer types
 |
|
 |
|
| Top |
| Gene-Gene Network Information |
| * Co-Expression network figures were drawn using R package igraph. Only the top 20 genes with the highest correlations were shown. Red circle: input gene, orange circle: cell metabolism gene, sky circle: other gene |
: Open all plots for all cancer types
 |
|
| ANKS3,LMNTD2,CAPN10,D2HGDH,CRACR2B,EGFL8,FAM193B, IDUA,JMJD7-PLA2G4B,LOC338799,PIDD1,NOXA1,PCSK4,RHOT2, CLASRP,SNRNP70,SPSB3,TELO2,UBXN11,WASH7P,ZNF692 | ANAPC2,CCDC130,CENPT,CPSF3L,D2HGDH,GGA1,GIGYF1, HEXDC,HSF4,PIDD1,MUS81,NEURL4,OBSL1,OGFOD2, RHOT2,SH2B1,SNRNP70,SYMPK,TOP3B,TRMT1,TRMT2A |
 |
|
| AGAP4,AHSA2,ANKMY1,ATG4B,CCNL2,CDK10,CYP2D7, D2HGDH,ECHDC2,HSF4,ING5,JMJD7-PLA2G4B,LOC100130015,MSH5, NSUN5P1,NSUN5P2,PILRB,TAF1C,ZNF276,ZNF692,ZNF767P | ADAMTS13,ADCY6,ARHGAP39,ARHGEF10L,ATG16L2,CAPN3,D2HGDH, DDX26B,DLL1,ENGASE,ESRP2,HDAC6,ING5,MSH5, PLEKHH1,REXO1,SH2B1,TFCP2L1,TLN2,TRIM41,ZNF276 |

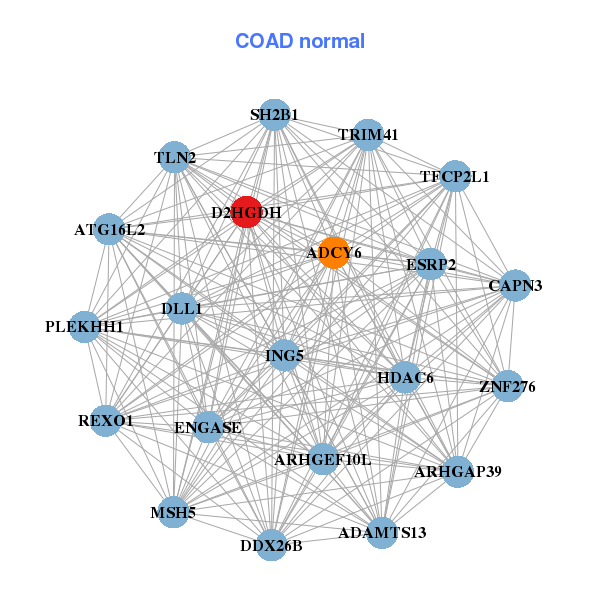
| * Co-Expression network figures were drawn using R package igraph. Only the top 20 genes with the highest correlations were shown. Red circle: input gene, orange circle: cell metabolism gene, sky circle: other gene |
: Open all plots for all cancer types
| Top |
: Open all interacting genes' information including KEGG pathway for all interacting genes from DAVID
| Top |
| Pharmacological Information for D2HGDH |
| There's no related Drug. |
| Top |
| Cross referenced IDs for D2HGDH |
| * We obtained these cross-references from Uniprot database. It covers 150 different DBs, 18 categories. http://www.uniprot.org/help/cross_references_section |
: Open all cross reference information
|
Copyright © 2016-Present - The Univsersity of Texas Health Science Center at Houston @ |