|
|||||||||||||||||||||||||||||||||||||||||||||||||||||||||||||||||||||||||||||||||||||||||||||||||||||||||||||||||||||||||||||||||||||||||||||||||||||||||||||||||||||||||||||||||||||||||||||||||||||||||||||||||||||||||||||||||||||||||||||||||||||||||||||||||||||||||||||||||||||||||||||||||||||||||||||||||||||||||||||||||||||||||||||||||||||||||||||||
| |
| Phenotypic Information (metabolism pathway, cancer, disease, phenome) |
| |
| |
| Gene-Gene Network Information: Co-Expression Network, Interacting Genes & KEGG |
| |
|


| Gene Summary for TYR |
| Top |
| Phenotypic Information for TYR(metabolism pathway, cancer, disease, phenome) |
| Cancer | CGAP: TYR |
| Familial Cancer Database: TYR | |
| * This gene is included in those cancer gene databases. |
|
|
|
|
|
| . | |||||||||||||||||||||||||||||||||||||||||||||||||||||||||||||||||||||||||||||||||||||||||||||||||||||||||||||||||||||||||||||||||||||||||||||||||||||||||||||||||||||||||||||||||||||||||||||||||||||||||||||||||||||||||||||||||||||||||||||||||||||||||||||||||||||||||||||||||||||||||||||||||||||||||||||||||||||||||||||||||||||||||||||||||||||||||
Oncogene 1 | Significant driver gene in | ||||||||||||||||||||||||||||||||||||||||||||||||||||||||||||||||||||||||||||||||||||||||||||||||||||||||||||||||||||||||||||||||||||||||||||||||||||||||||||||||||||||||||||||||||||||||||||||||||||||||||||||||||||||||||||||||||||||||||||||||||||||||||||||||||||||||||||||||||||||||||||||||||||||||||||||||||||||||||||||||||||||||||||||||||||||||||||||
| cf) number; DB name 1 Oncogene; http://nar.oxfordjournals.org/content/35/suppl_1/D721.long, 2 Tumor Suppressor gene; https://bioinfo.uth.edu/TSGene/, 3 Cancer Gene Census; http://www.nature.com/nrc/journal/v4/n3/abs/nrc1299.html, 4 CancerGenes; http://nar.oxfordjournals.org/content/35/suppl_1/D721.long, 5 Network of Cancer Gene; http://ncg.kcl.ac.uk/index.php, 1Therapeutic Vulnerabilities in Cancer; http://cbio.mskcc.org/cancergenomics/statius/ |
| KEGG_TYROSINE_METABOLISM KEGG_RIBOFLAVIN_METABOLISM | |
| OMIM | |
| Orphanet | |
| Disease | KEGG Disease: TYR |
| MedGen: TYR (Human Medical Genetics with Condition) | |
| ClinVar: TYR | |
| Phenotype | MGI: TYR (International Mouse Phenotyping Consortium) |
| PhenomicDB: TYR | |
| Mutations for TYR |
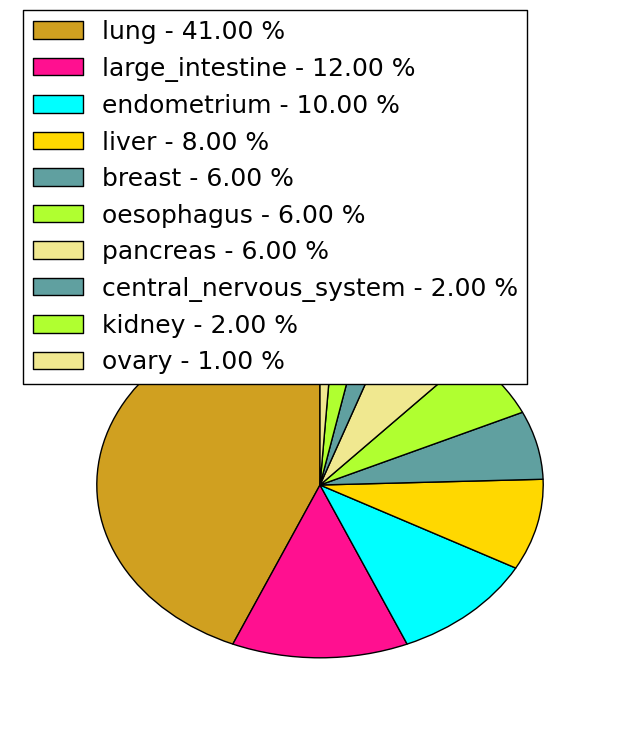
| * Under tables are showing count per each tissue to give us broad intuition about tissue specific mutation patterns.You can go to the detailed page for each mutation database's web site. |
| There's no structural variation information in COSMIC data for this gene. |
| * From mRNA Sanger sequences, Chitars2.0 arranged chimeric transcripts. This table shows TYR related fusion information. |
| ID | Head Gene | Tail Gene | Accession | Gene_a | qStart_a | qEnd_a | Chromosome_a | tStart_a | tEnd_a | Gene_a | qStart_a | qEnd_a | Chromosome_a | tStart_a | tEnd_a |
| Top |
| Mutation type/ Tissue ID | brca | cns | cerv | endome | haematopo | kidn | Lintest | liver | lung | ns | ovary | pancre | prost | skin | stoma | thyro | urina | |||
| Total # sample | 1 | 1 | ||||||||||||||||||
| GAIN (# sample) | 1 | 1 | ||||||||||||||||||
| LOSS (# sample) |
| cf) Tissue ID; Tissue type (1; Breast, 2; Central_nervous_system, 3; Cervix, 4; Endometrium, 5; Haematopoietic_and_lymphoid_tissue, 6; Kidney, 7; Large_intestine, 8; Liver, 9; Lung, 10; NS, 11; Ovary, 12; Pancreas, 13; Prostate, 14; Skin, 15; Stomach, 16; Thyroid, 17; Urinary_tract) |
| Top |
|
 |
| Top |
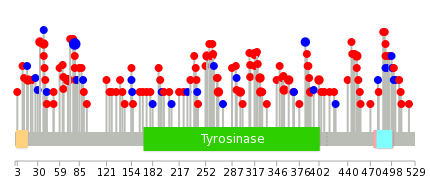
| Stat. for Non-Synonymous SNVs (# total SNVs=116) | (# total SNVs=25) |
 |  |
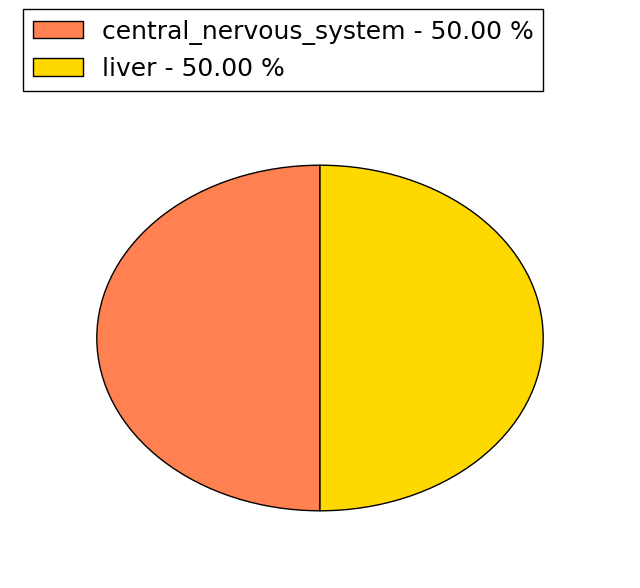
(# total SNVs=2) | (# total SNVs=0) |
 |
| Top |
| * When you move the cursor on each content, you can see more deailed mutation information on the Tooltip. Those are primary_site,primary_histology,mutation(aa),pubmedID. |
| GRCh37 position | Mutation(aa) | Unique sampleID count |
| chr11:88911358-88911358 | p.S79S | 6 |
| chr11:88924500-88924500 | p.D317G | 4 |
| chr11:88911234-88911234 | p.P38L | 3 |
| chr11:88911329-88911329 | p.P70S | 3 |
| chr11:88911170-88911170 | p.A17T | 2 |
| chr11:88911926-88911926 | p.F269V | 2 |
| chr11:88911881-88911881 | p.G254S | 2 |
| chr11:88961126-88961126 | p.A391E | 2 |
| chr11:88961022-88961022 | p.D356E | 2 |
| chr11:88961040-88961040 | p.M362I | 2 |
| Top |
|
 |
| Point Mutation/ Tissue ID | 1 | 2 | 3 | 4 | 5 | 6 | 7 | 8 | 9 | 10 | 11 | 12 | 13 | 14 | 15 | 16 | 17 | 18 | 19 | 20 |
| # sample | 3 | 8 | 1 | 16 | 1 | 4 | 1 | 20 | 9 | 3 | 4 | 12 | 1 | 10 | ||||||
| # mutation | 3 | 8 | 1 | 13 | 1 | 4 | 1 | 22 | 9 | 3 | 4 | 12 | 1 | 14 | ||||||
| nonsynonymous SNV | 3 | 6 | 8 | 1 | 2 | 1 | 20 | 9 | 1 | 4 | 9 | 11 | ||||||||
| synonymous SNV | 2 | 1 | 5 | 2 | 2 | 2 | 3 | 1 | 3 |
| cf) Tissue ID; Tissue type (1; BLCA[Bladder Urothelial Carcinoma], 2; BRCA[Breast invasive carcinoma], 3; CESC[Cervical squamous cell carcinoma and endocervical adenocarcinoma], 4; COAD[Colon adenocarcinoma], 5; GBM[Glioblastoma multiforme], 6; Glioma Low Grade, 7; HNSC[Head and Neck squamous cell carcinoma], 8; KICH[Kidney Chromophobe], 9; KIRC[Kidney renal clear cell carcinoma], 10; KIRP[Kidney renal papillary cell carcinoma], 11; LAML[Acute Myeloid Leukemia], 12; LUAD[Lung adenocarcinoma], 13; LUSC[Lung squamous cell carcinoma], 14; OV[Ovarian serous cystadenocarcinoma ], 15; PAAD[Pancreatic adenocarcinoma], 16; PRAD[Prostate adenocarcinoma], 17; SKCM[Skin Cutaneous Melanoma], 18:STAD[Stomach adenocarcinoma], 19:THCA[Thyroid carcinoma], 20:UCEC[Uterine Corpus Endometrial Carcinoma]) |
| Top |
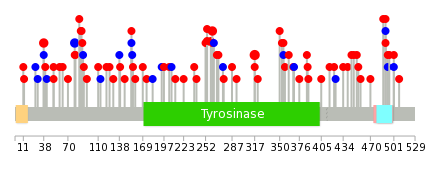
| * We represented just top 10 SNVs. When you move the cursor on each content, you can see more deailed mutation information on the Tooltip. Those are primary_site, primary_histology, mutation(aa), pubmedID. |
| Genomic Position | Mutation(aa) | Unique sampleID count |
| chr11:88924500 | p.D317G | 4 |
| chr11:88911234 | p.S79S | 2 |
| chr11:88911881 | p.G254R | 2 |
| chr11:88911904 | p.N261K | 2 |
| chr11:88911358 | p.P38L | 2 |
| chr11:88911626 | p.Q470H | 1 |
| chr11:88961057 | p.P38P | 1 |
| chr11:88911360 | p.C91F | 1 |
| chr11:88911877 | p.D174N | 1 |
| chr11:89018075 | p.S267T | 1 |
| * Copy number data were extracted from TCGA using R package TCGA-Assembler. The URLs of all public data files on TCGA DCC data server were gathered on Jan-05-2015. Function ProcessCNAData in TCGA-Assembler package was used to obtain gene-level copy number value which is calculated as the average copy number of the genomic region of a gene. |
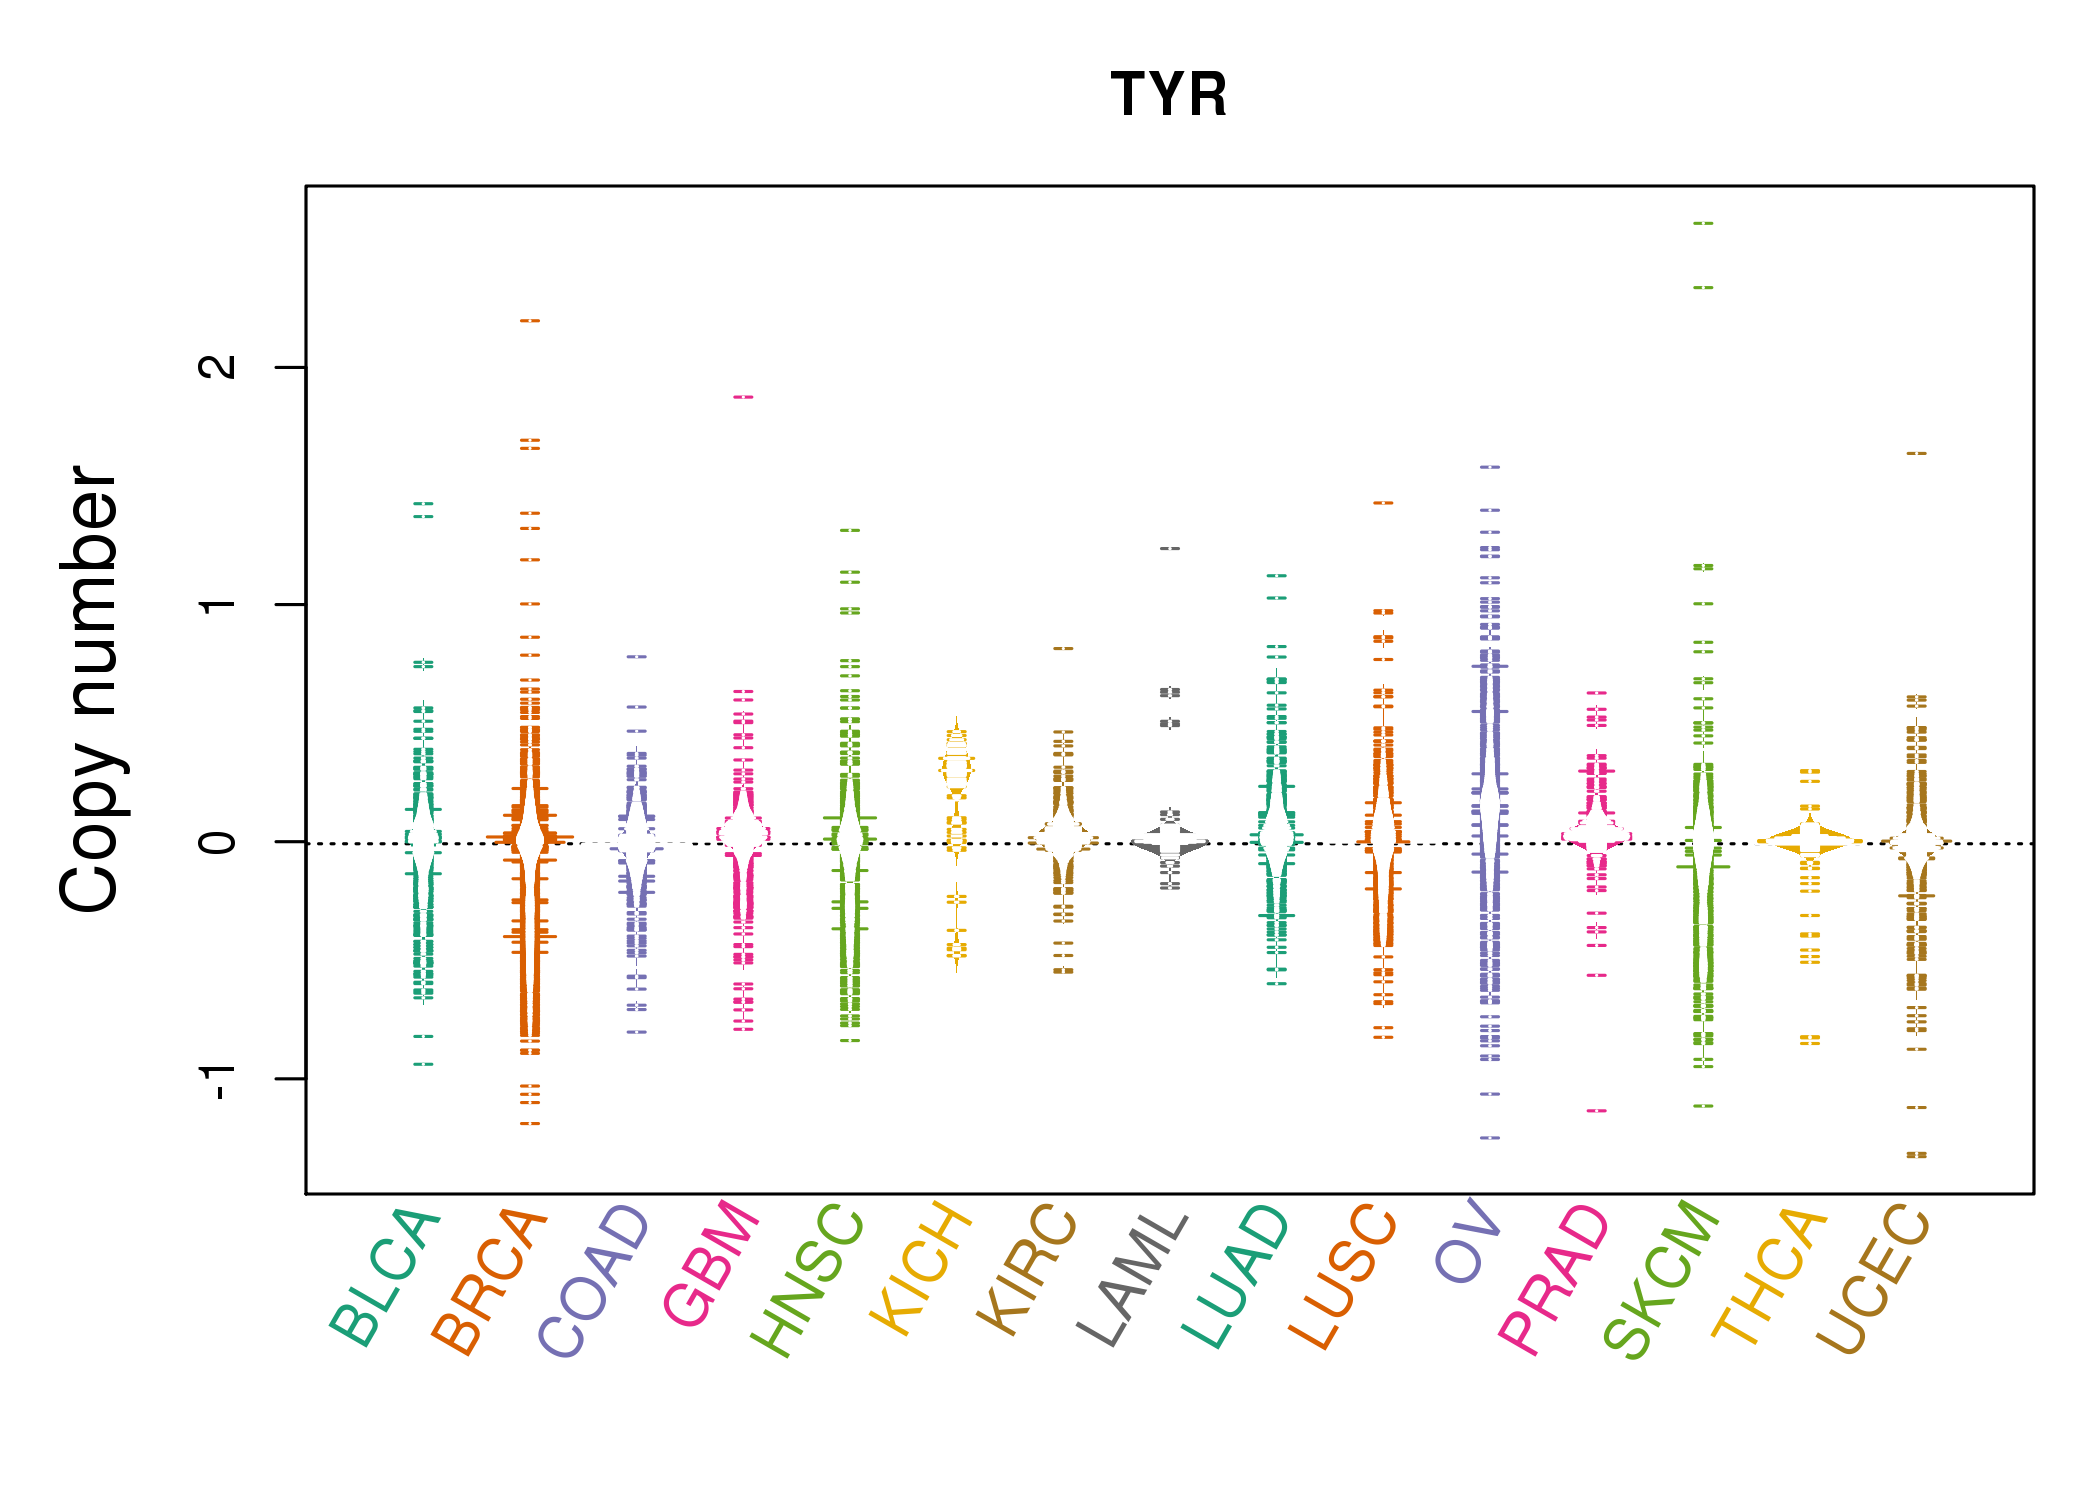 |
| cf) Tissue ID[Tissue type]: BLCA[Bladder Urothelial Carcinoma], BRCA[Breast invasive carcinoma], CESC[Cervical squamous cell carcinoma and endocervical adenocarcinoma], COAD[Colon adenocarcinoma], GBM[Glioblastoma multiforme], Glioma Low Grade, HNSC[Head and Neck squamous cell carcinoma], KICH[Kidney Chromophobe], KIRC[Kidney renal clear cell carcinoma], KIRP[Kidney renal papillary cell carcinoma], LAML[Acute Myeloid Leukemia], LUAD[Lung adenocarcinoma], LUSC[Lung squamous cell carcinoma], OV[Ovarian serous cystadenocarcinoma ], PAAD[Pancreatic adenocarcinoma], PRAD[Prostate adenocarcinoma], SKCM[Skin Cutaneous Melanoma], STAD[Stomach adenocarcinoma], THCA[Thyroid carcinoma], UCEC[Uterine Corpus Endometrial Carcinoma] |
| Top |
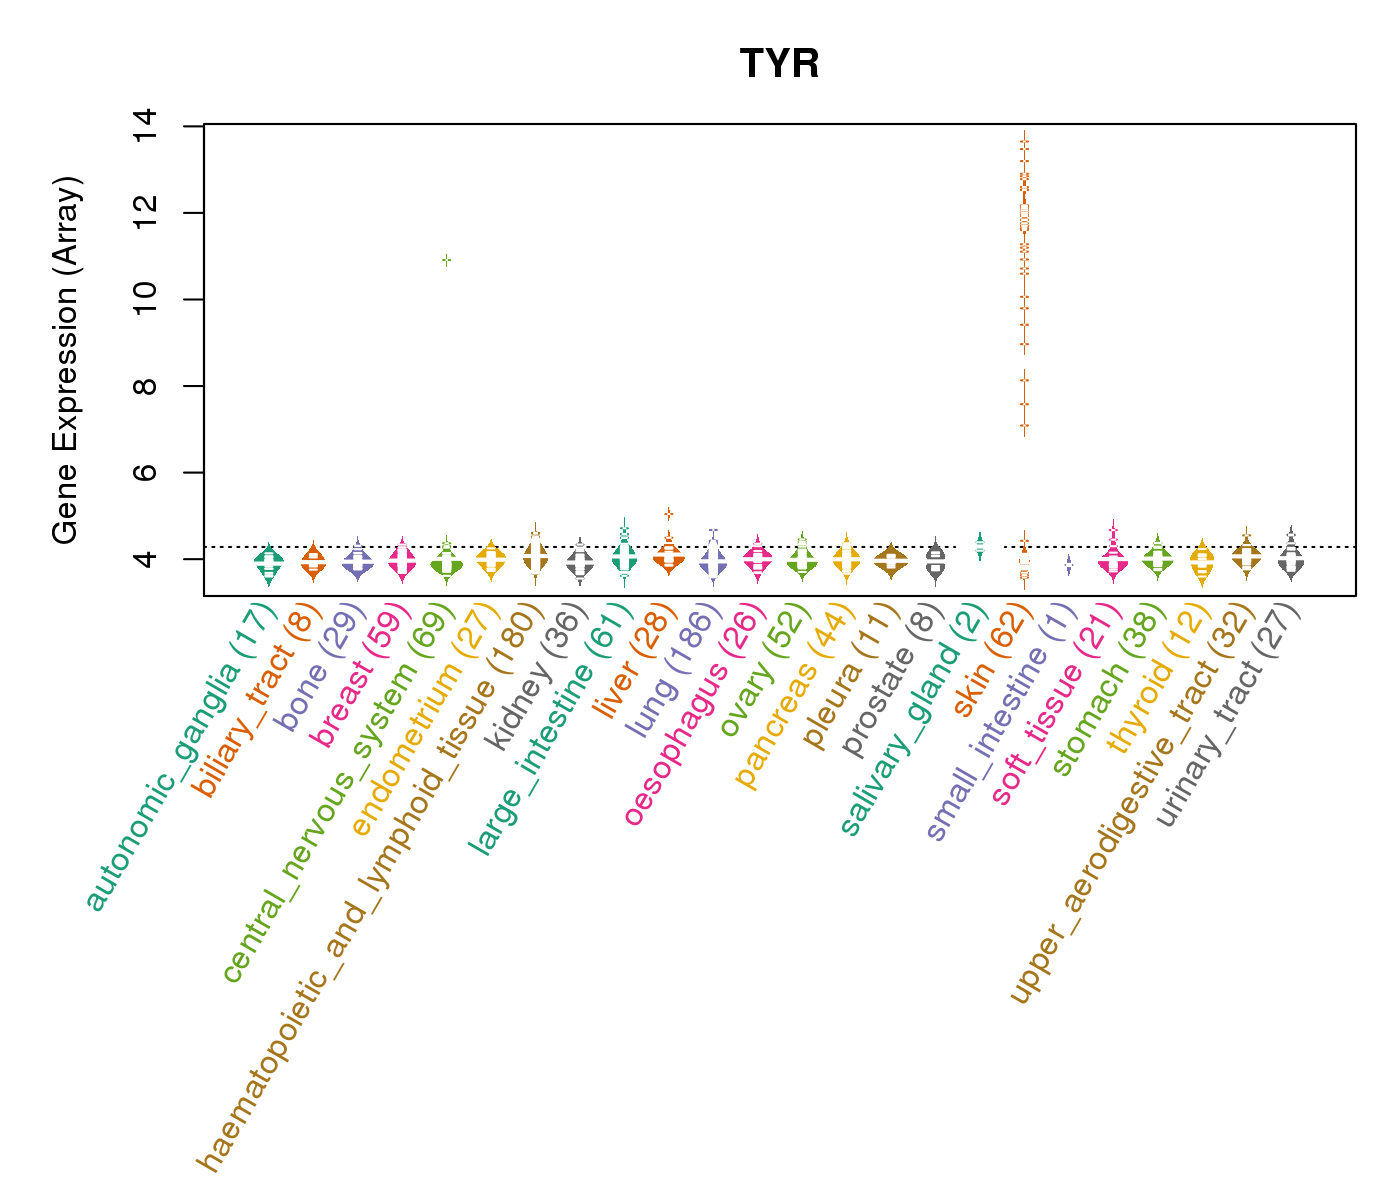
| Gene Expression for TYR |
| * CCLE gene expression data were extracted from CCLE_Expression_Entrez_2012-10-18.res: Gene-centric RMA-normalized mRNA expression data. |
 |
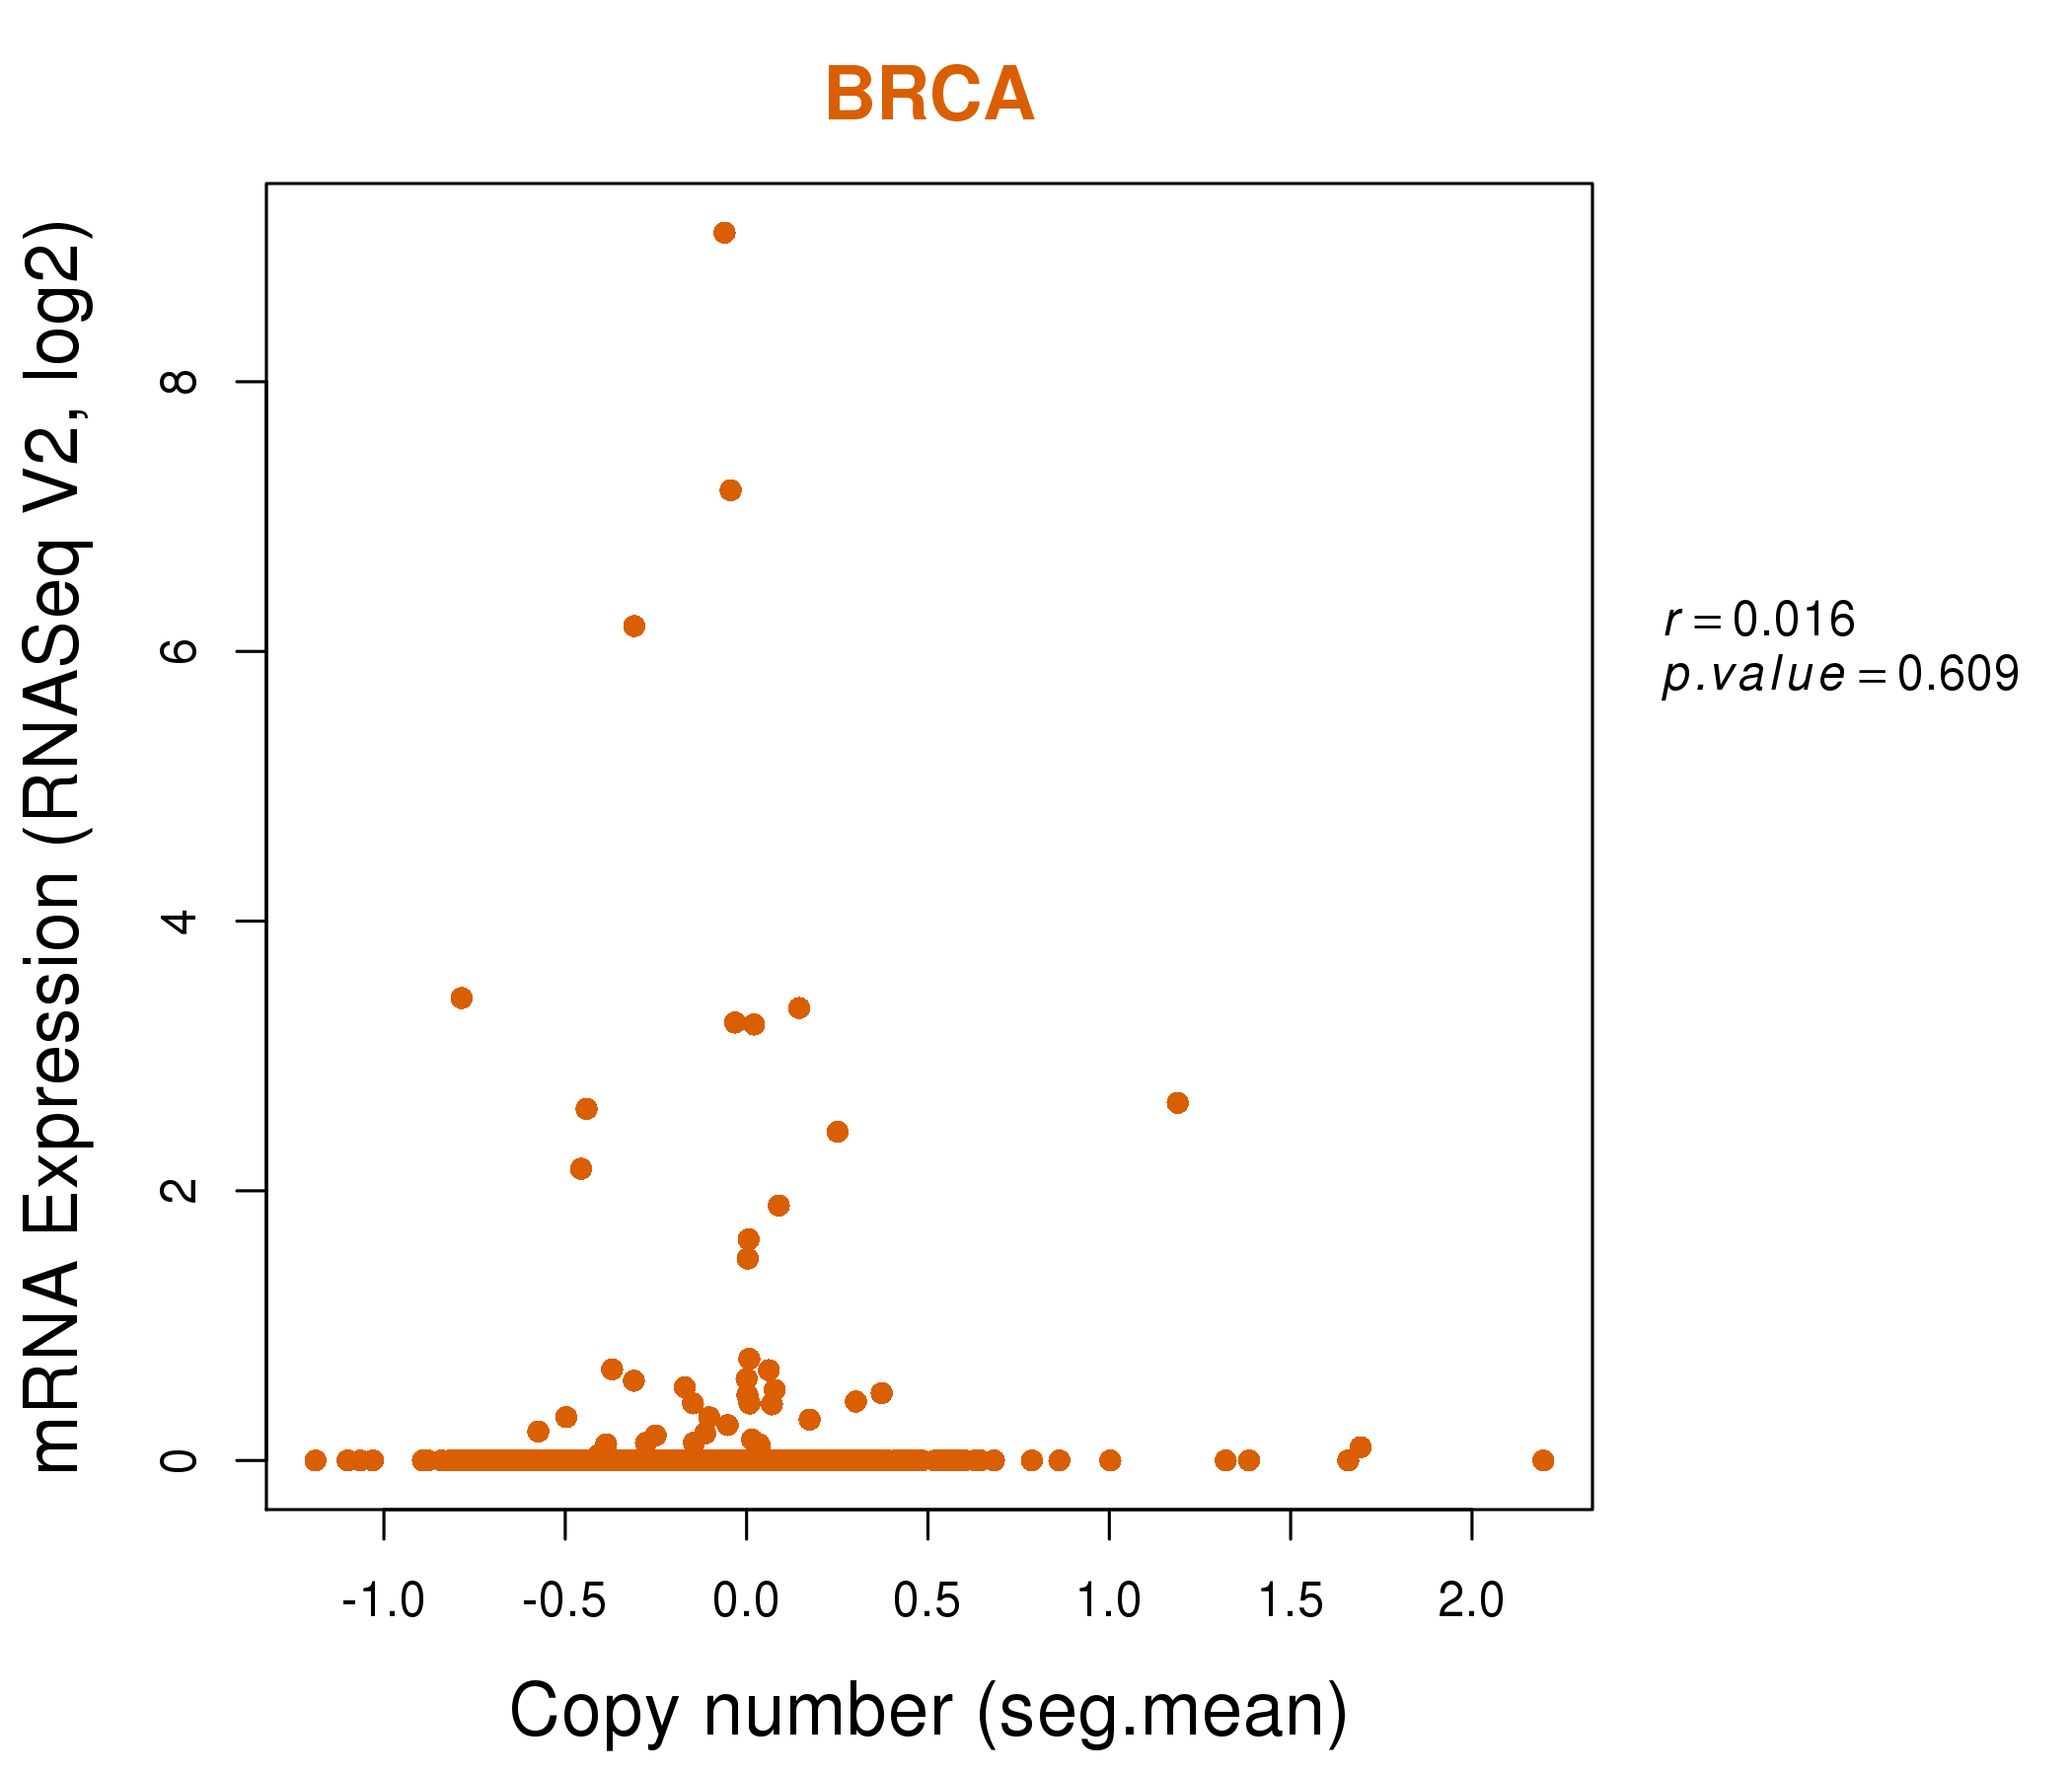
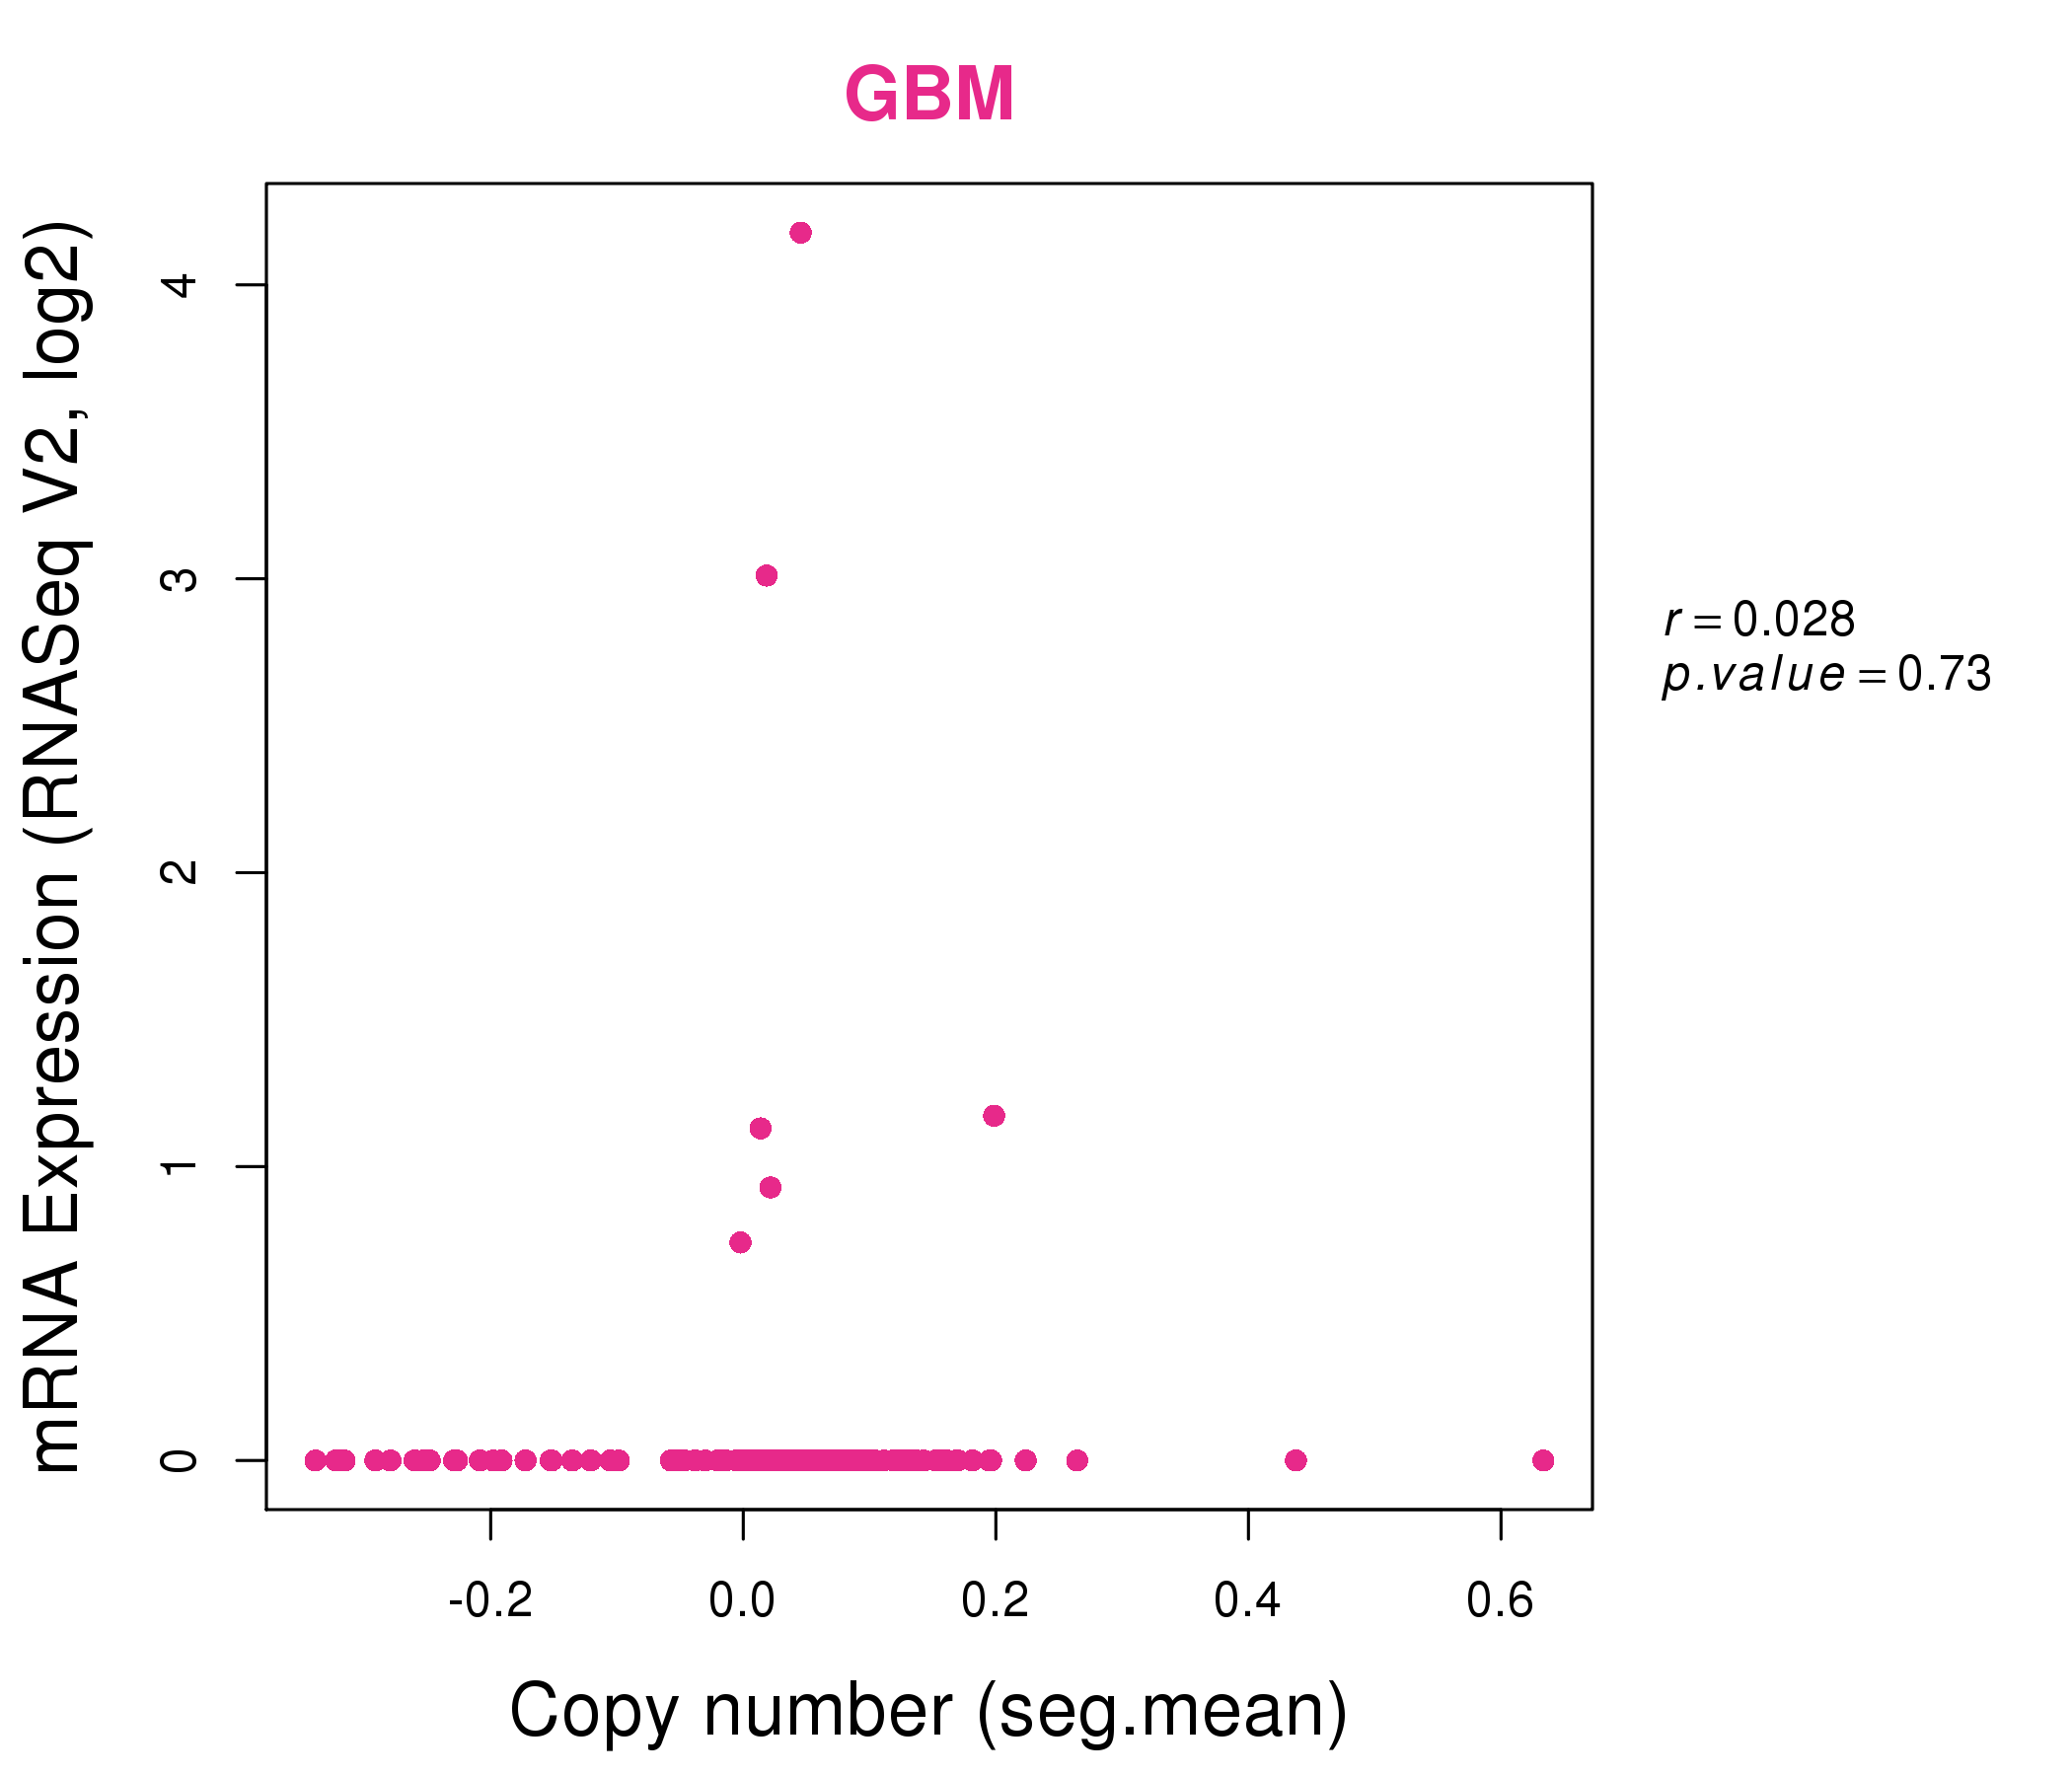
| * Normalized gene expression data of RNASeqV2 was extracted from TCGA using R package TCGA-Assembler. The URLs of all public data files on TCGA DCC data server were gathered at Jan-05-2015. Only eight cancer types have enough normal control samples for differential expression analysis. (t test, adjusted p<0.05 (using Benjamini-Hochberg FDR)) |
 |
| Top |
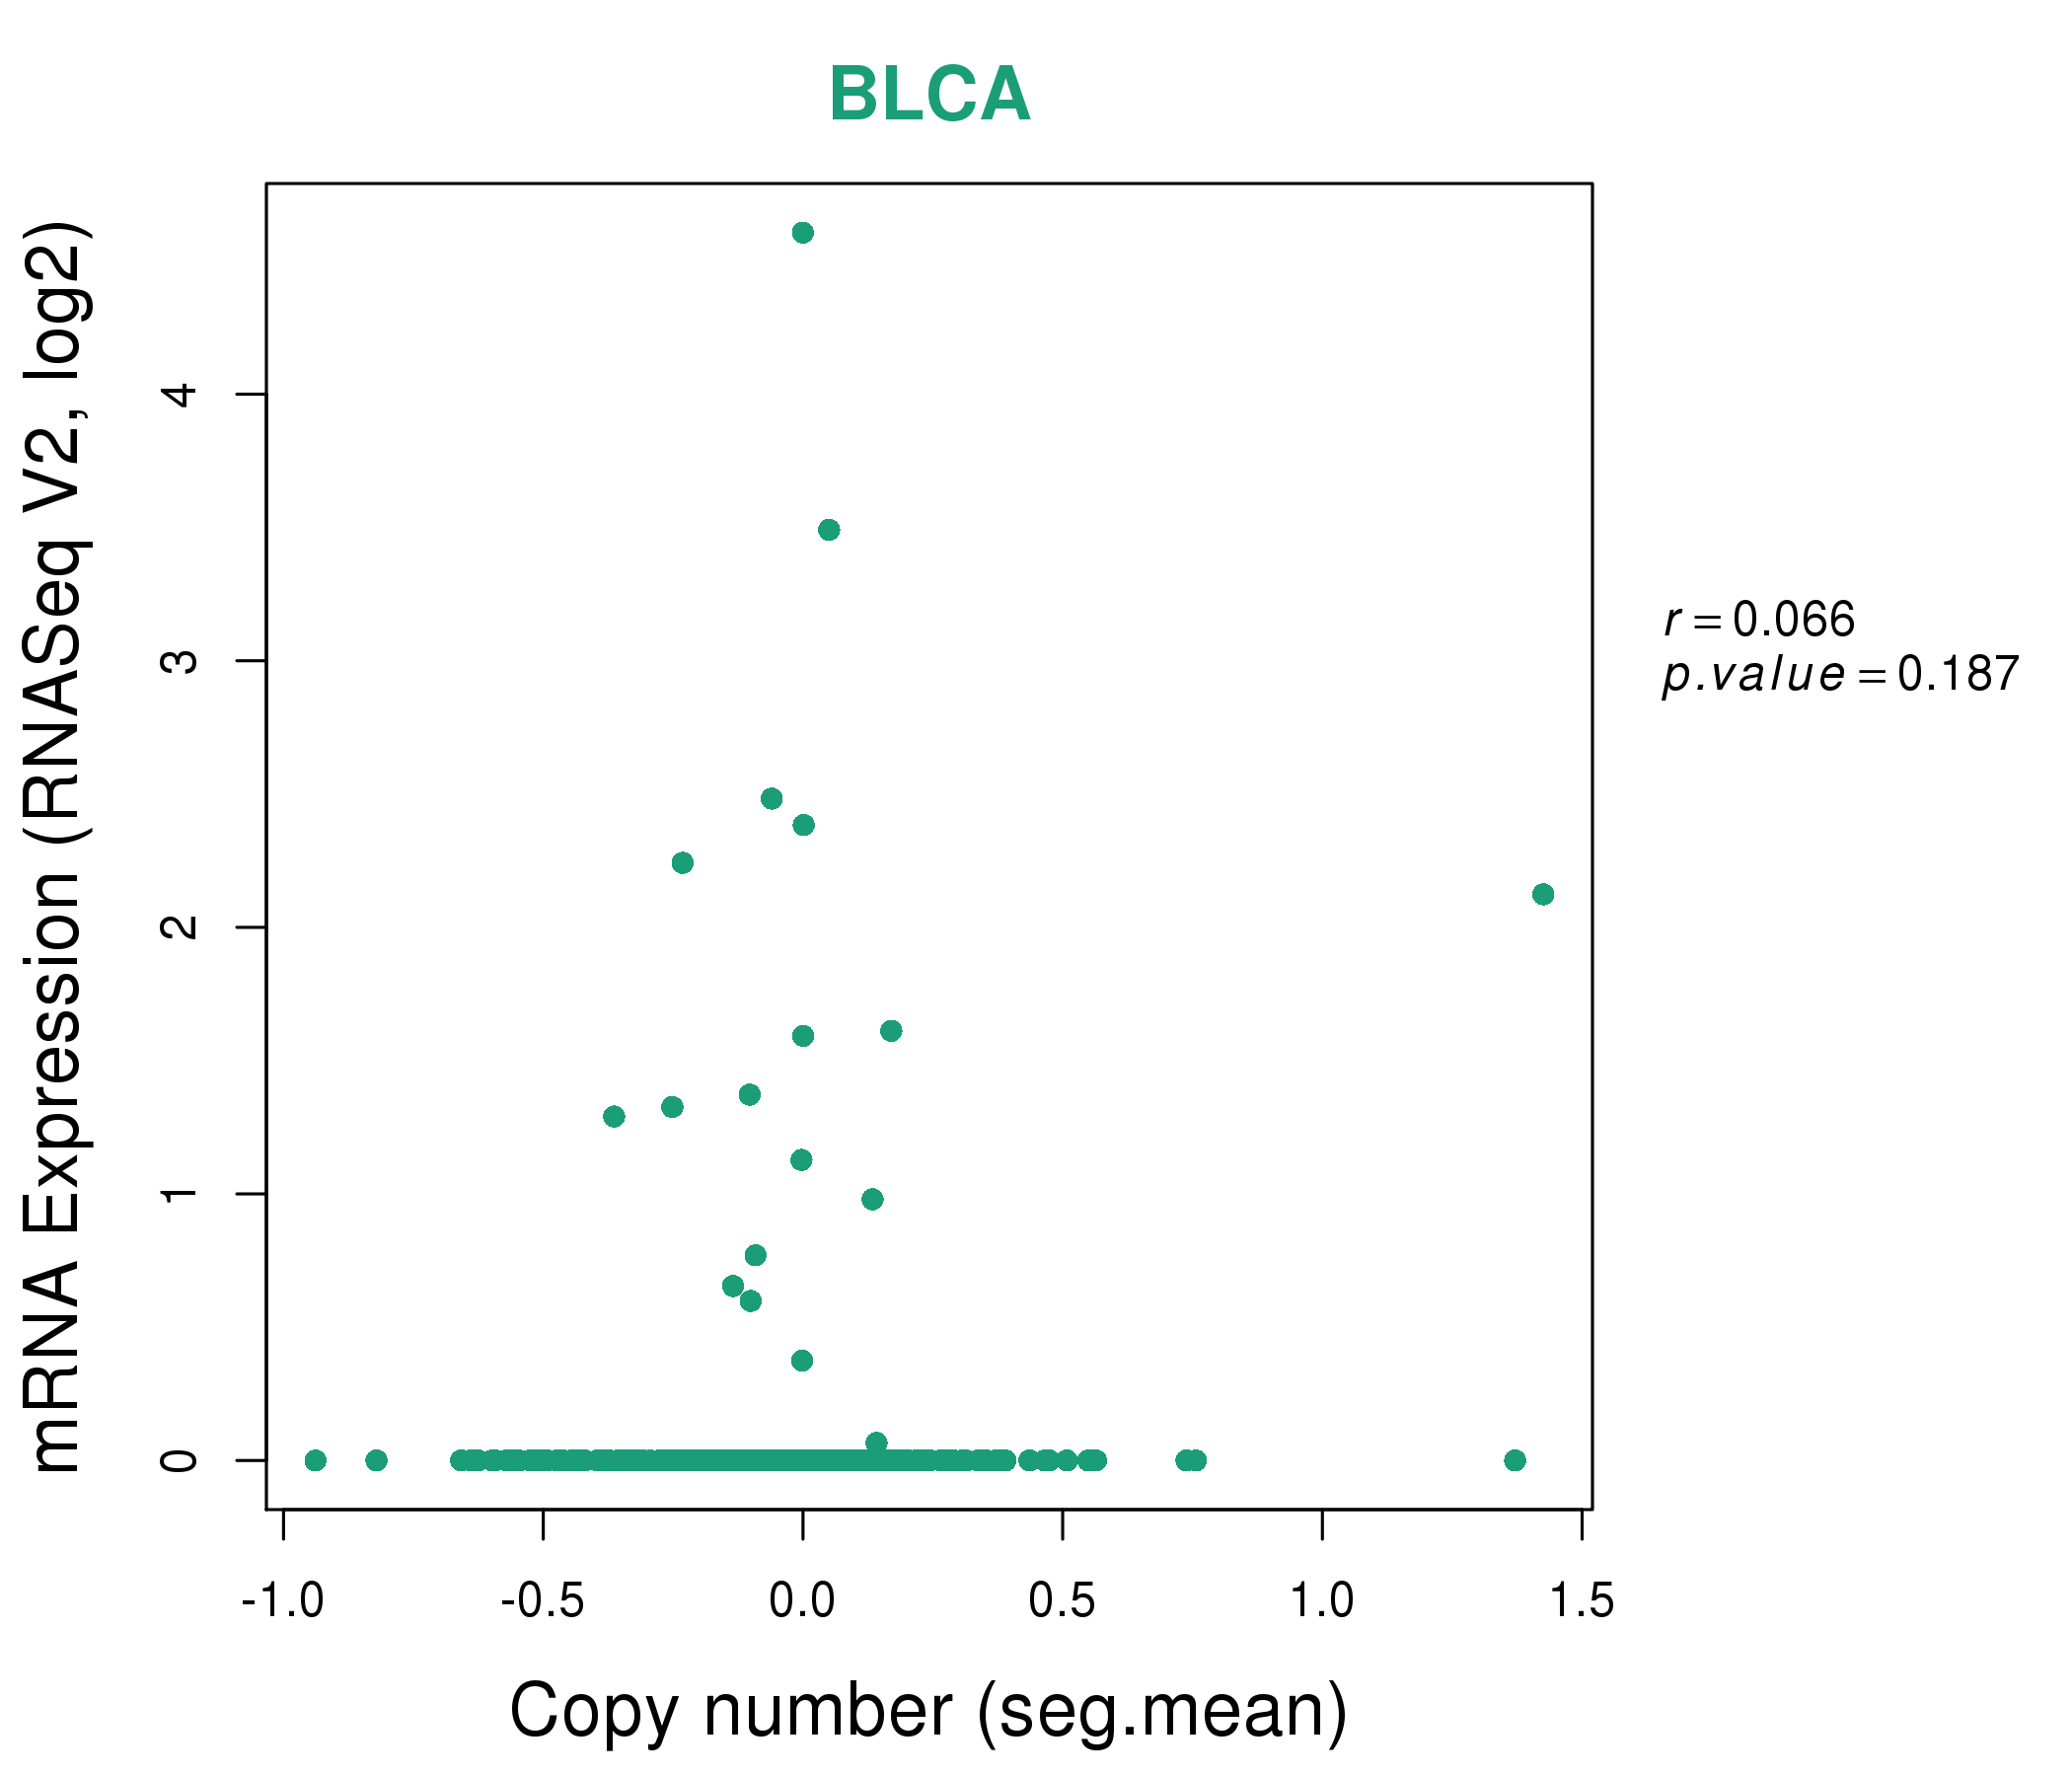
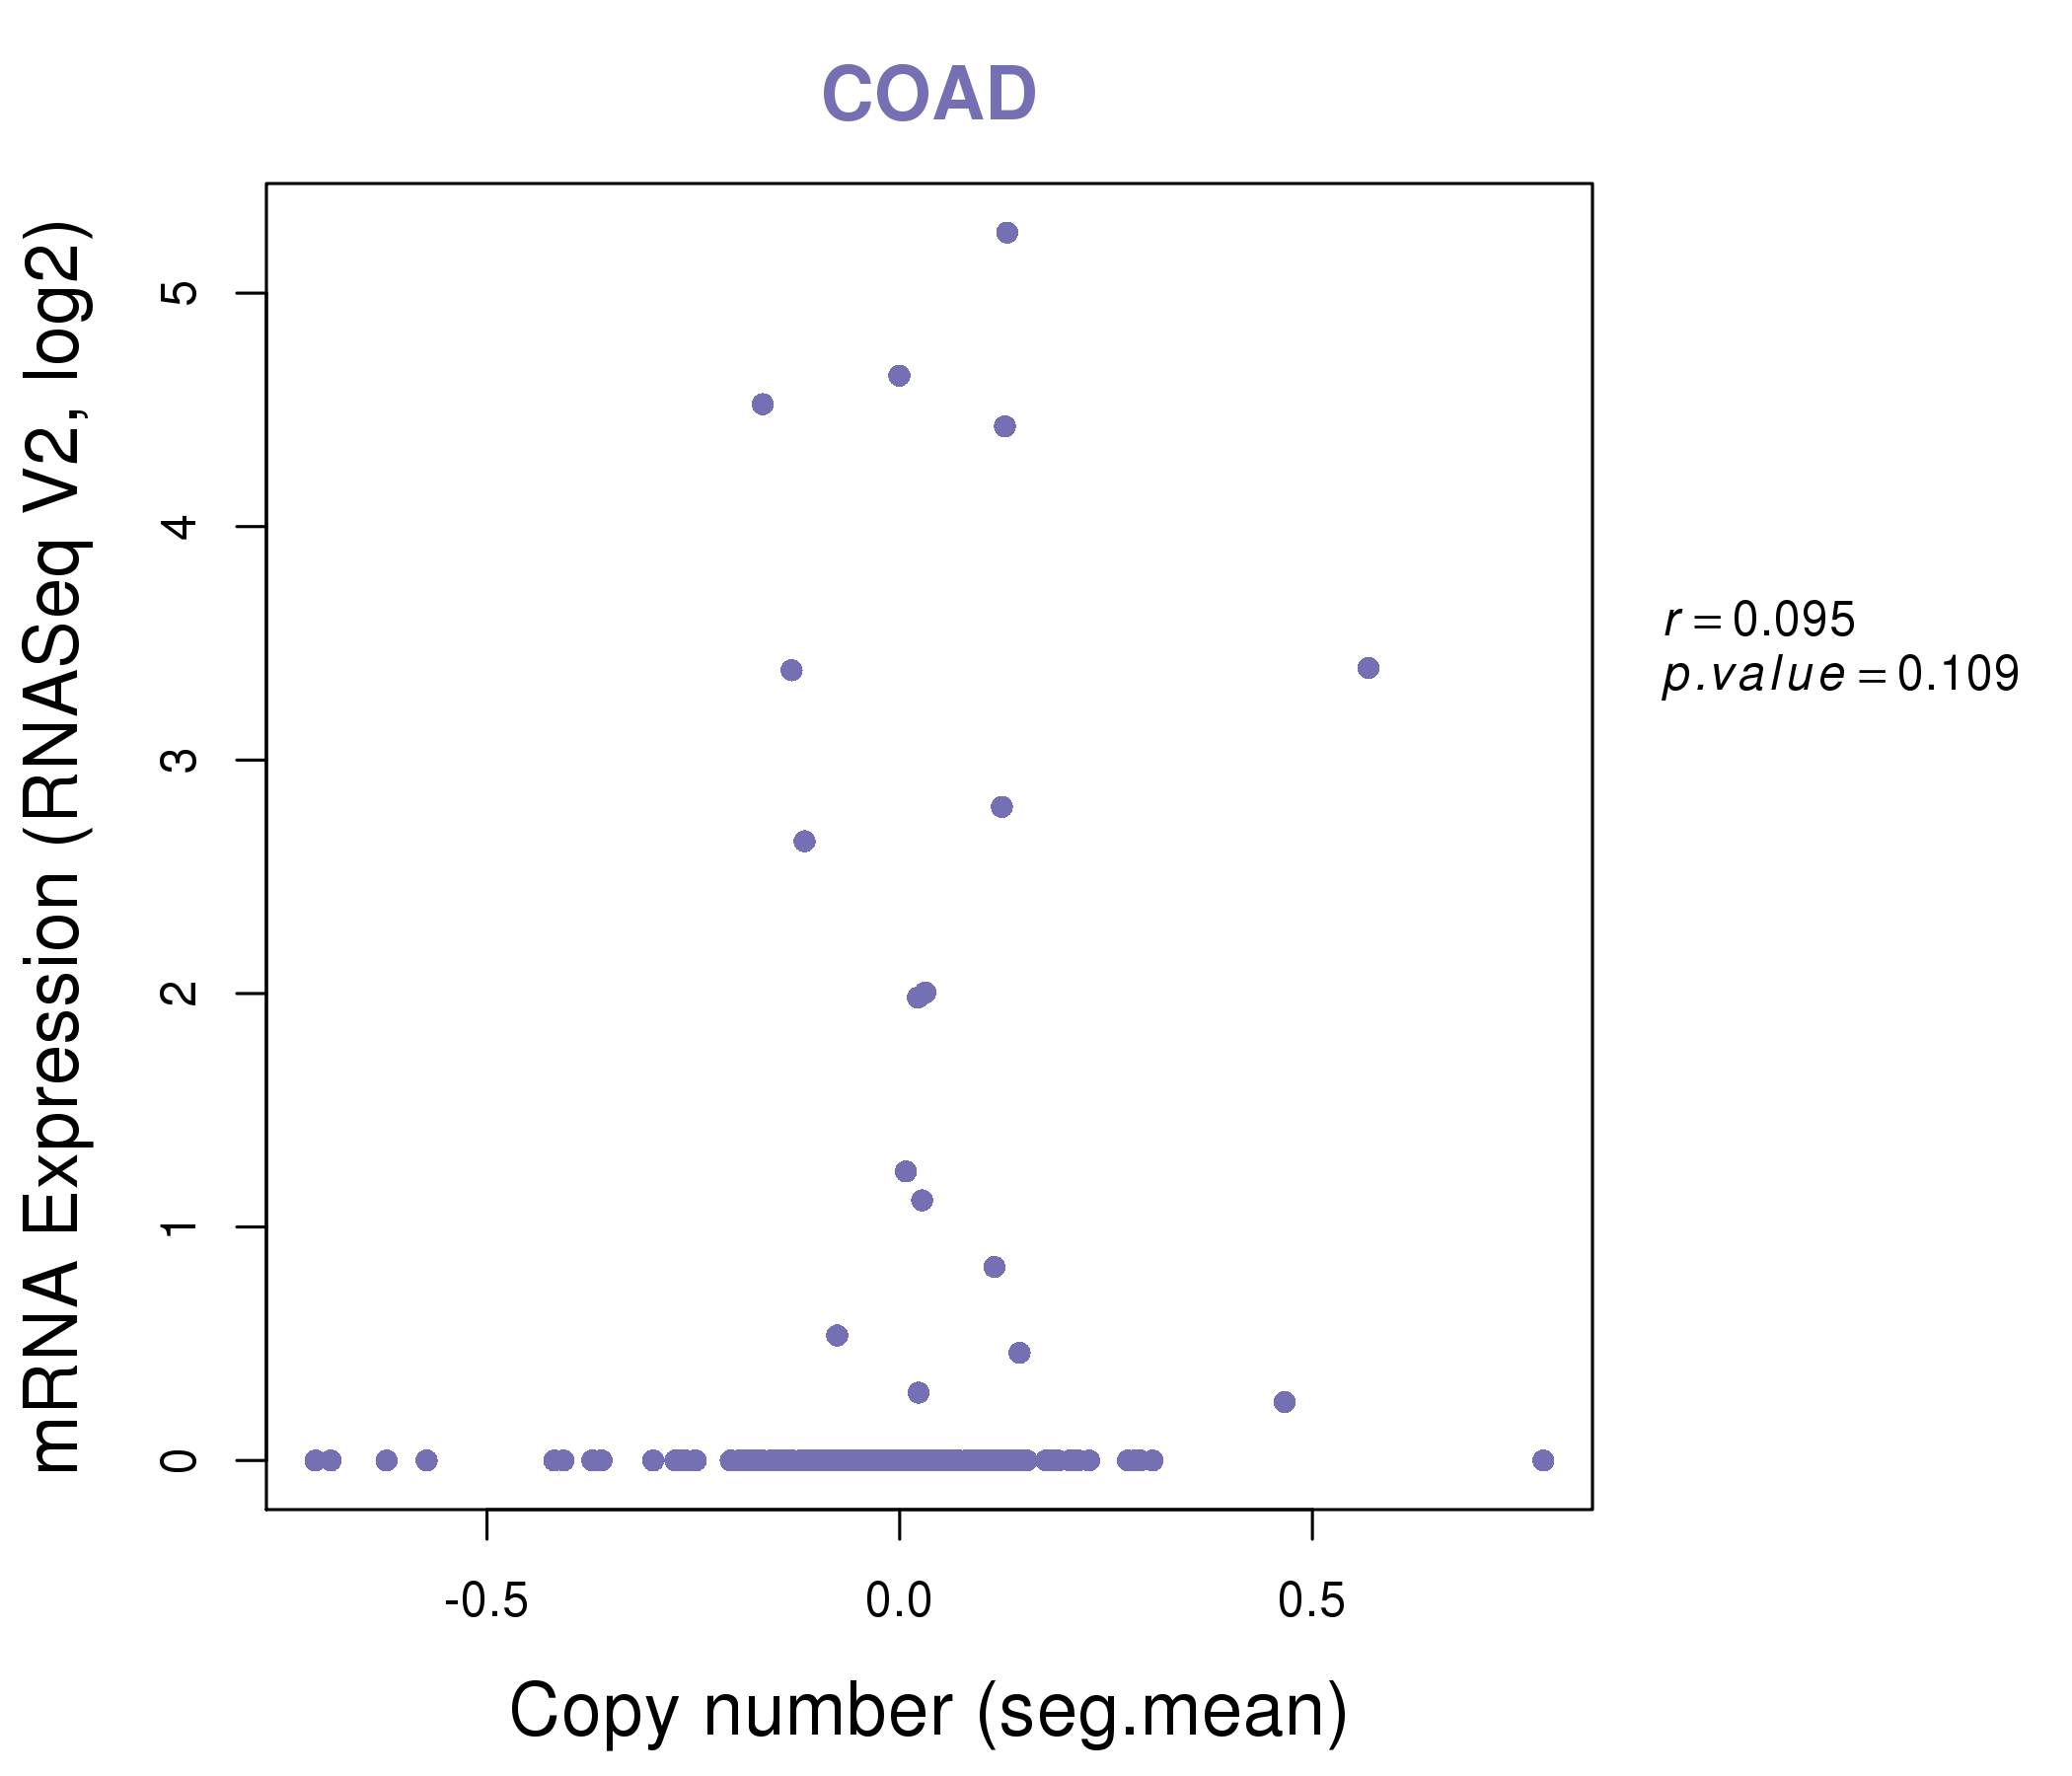
| * This plots show the correlation between CNV and gene expression. |
: Open all plots for all cancer types
 |
|
 |
|
| Top |
| Gene-Gene Network Information |
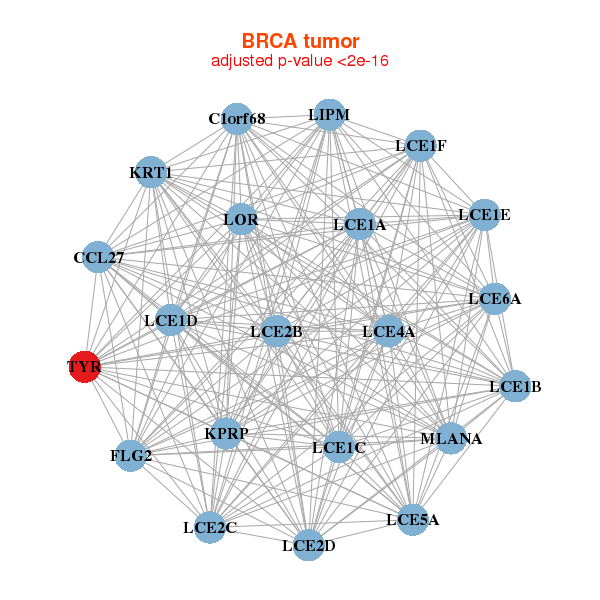
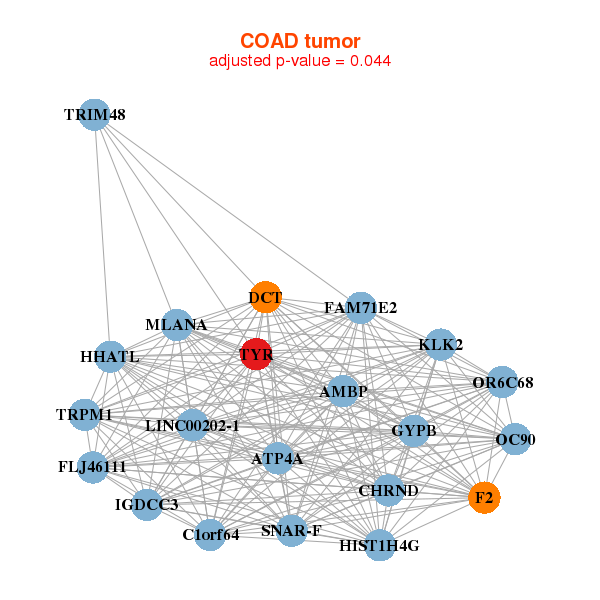
| * Co-Expression network figures were drawn using R package igraph. Only the top 20 genes with the highest correlations were shown. Red circle: input gene, orange circle: cell metabolism gene, sky circle: other gene |
: Open all plots for all cancer types
 |
| ||||
| LURAP1L,CT45A1,CT45A3,DHRS2,FRG2B,GABPB1,HGC6.3, LOC643008,MAGEA8,MAGEB18,NAP1L6,RGS5,RPL3L,SPPL2A, SUMO2,TYRP1,UGT2B10,UGT2B15,USP29,USP8,ZIM3 | ACTC1,ALDH1B1,C20orf166-AS1,CAMK2G,CASQ2,FYCO1,INPP5A, ITIH4,LGI1,LOC401093,LRRC7,MN1,MUSTN1,PDE4C, PDE4D,PLN,SGCD,SRRM4,SYNPO2,TYRP1,UNC13C | ||||
 |
| ||||
| ADCY2,NREP,CST5,DAAM2,ELN,FOXF1,GJD2, GPBAR1,LRRC10,LSAMP,LTBP1,MFAP2,NKX2-3,OSBPL6, PCDH18,RCAN2,RGMA,RIMS1,SLC24A3,TCF21,TYRP1 | ABCC12,AMBN,ANO4,CALML5,CAPNS2,CCDC63,CLDN19, LOC100133920,MUCL1,NKX6-1,OR4A16,OR6B2,OR7E24,OR8D2, PGK2,SCGB2A2,SNORA13,SNORA58,TCF23,TYRP1,WFDC8 |
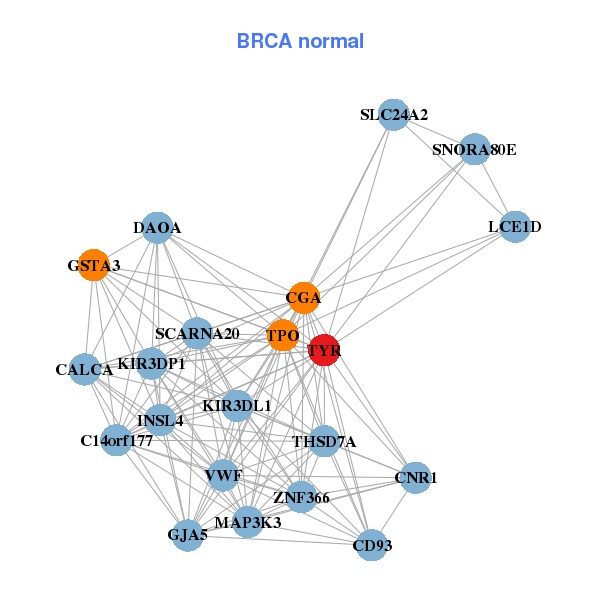
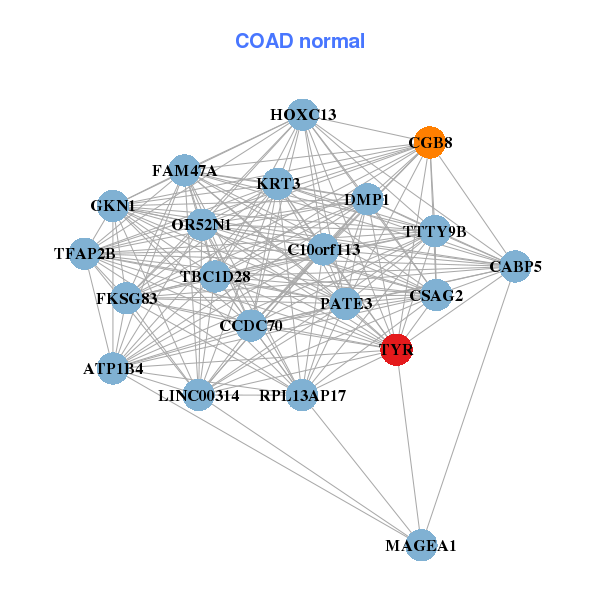
| * Co-Expression network figures were drawn using R package igraph. Only the top 20 genes with the highest correlations were shown. Red circle: input gene, orange circle: cell metabolism gene, sky circle: other gene |
: Open all plots for all cancer types
| Top |
: Open all interacting genes' information including KEGG pathway for all interacting genes from DAVID
| Top |
| Pharmacological Information for TYR |
| DB Category | DB Name | DB's ID and Url link |
| * Gene Centered Interaction Network. |
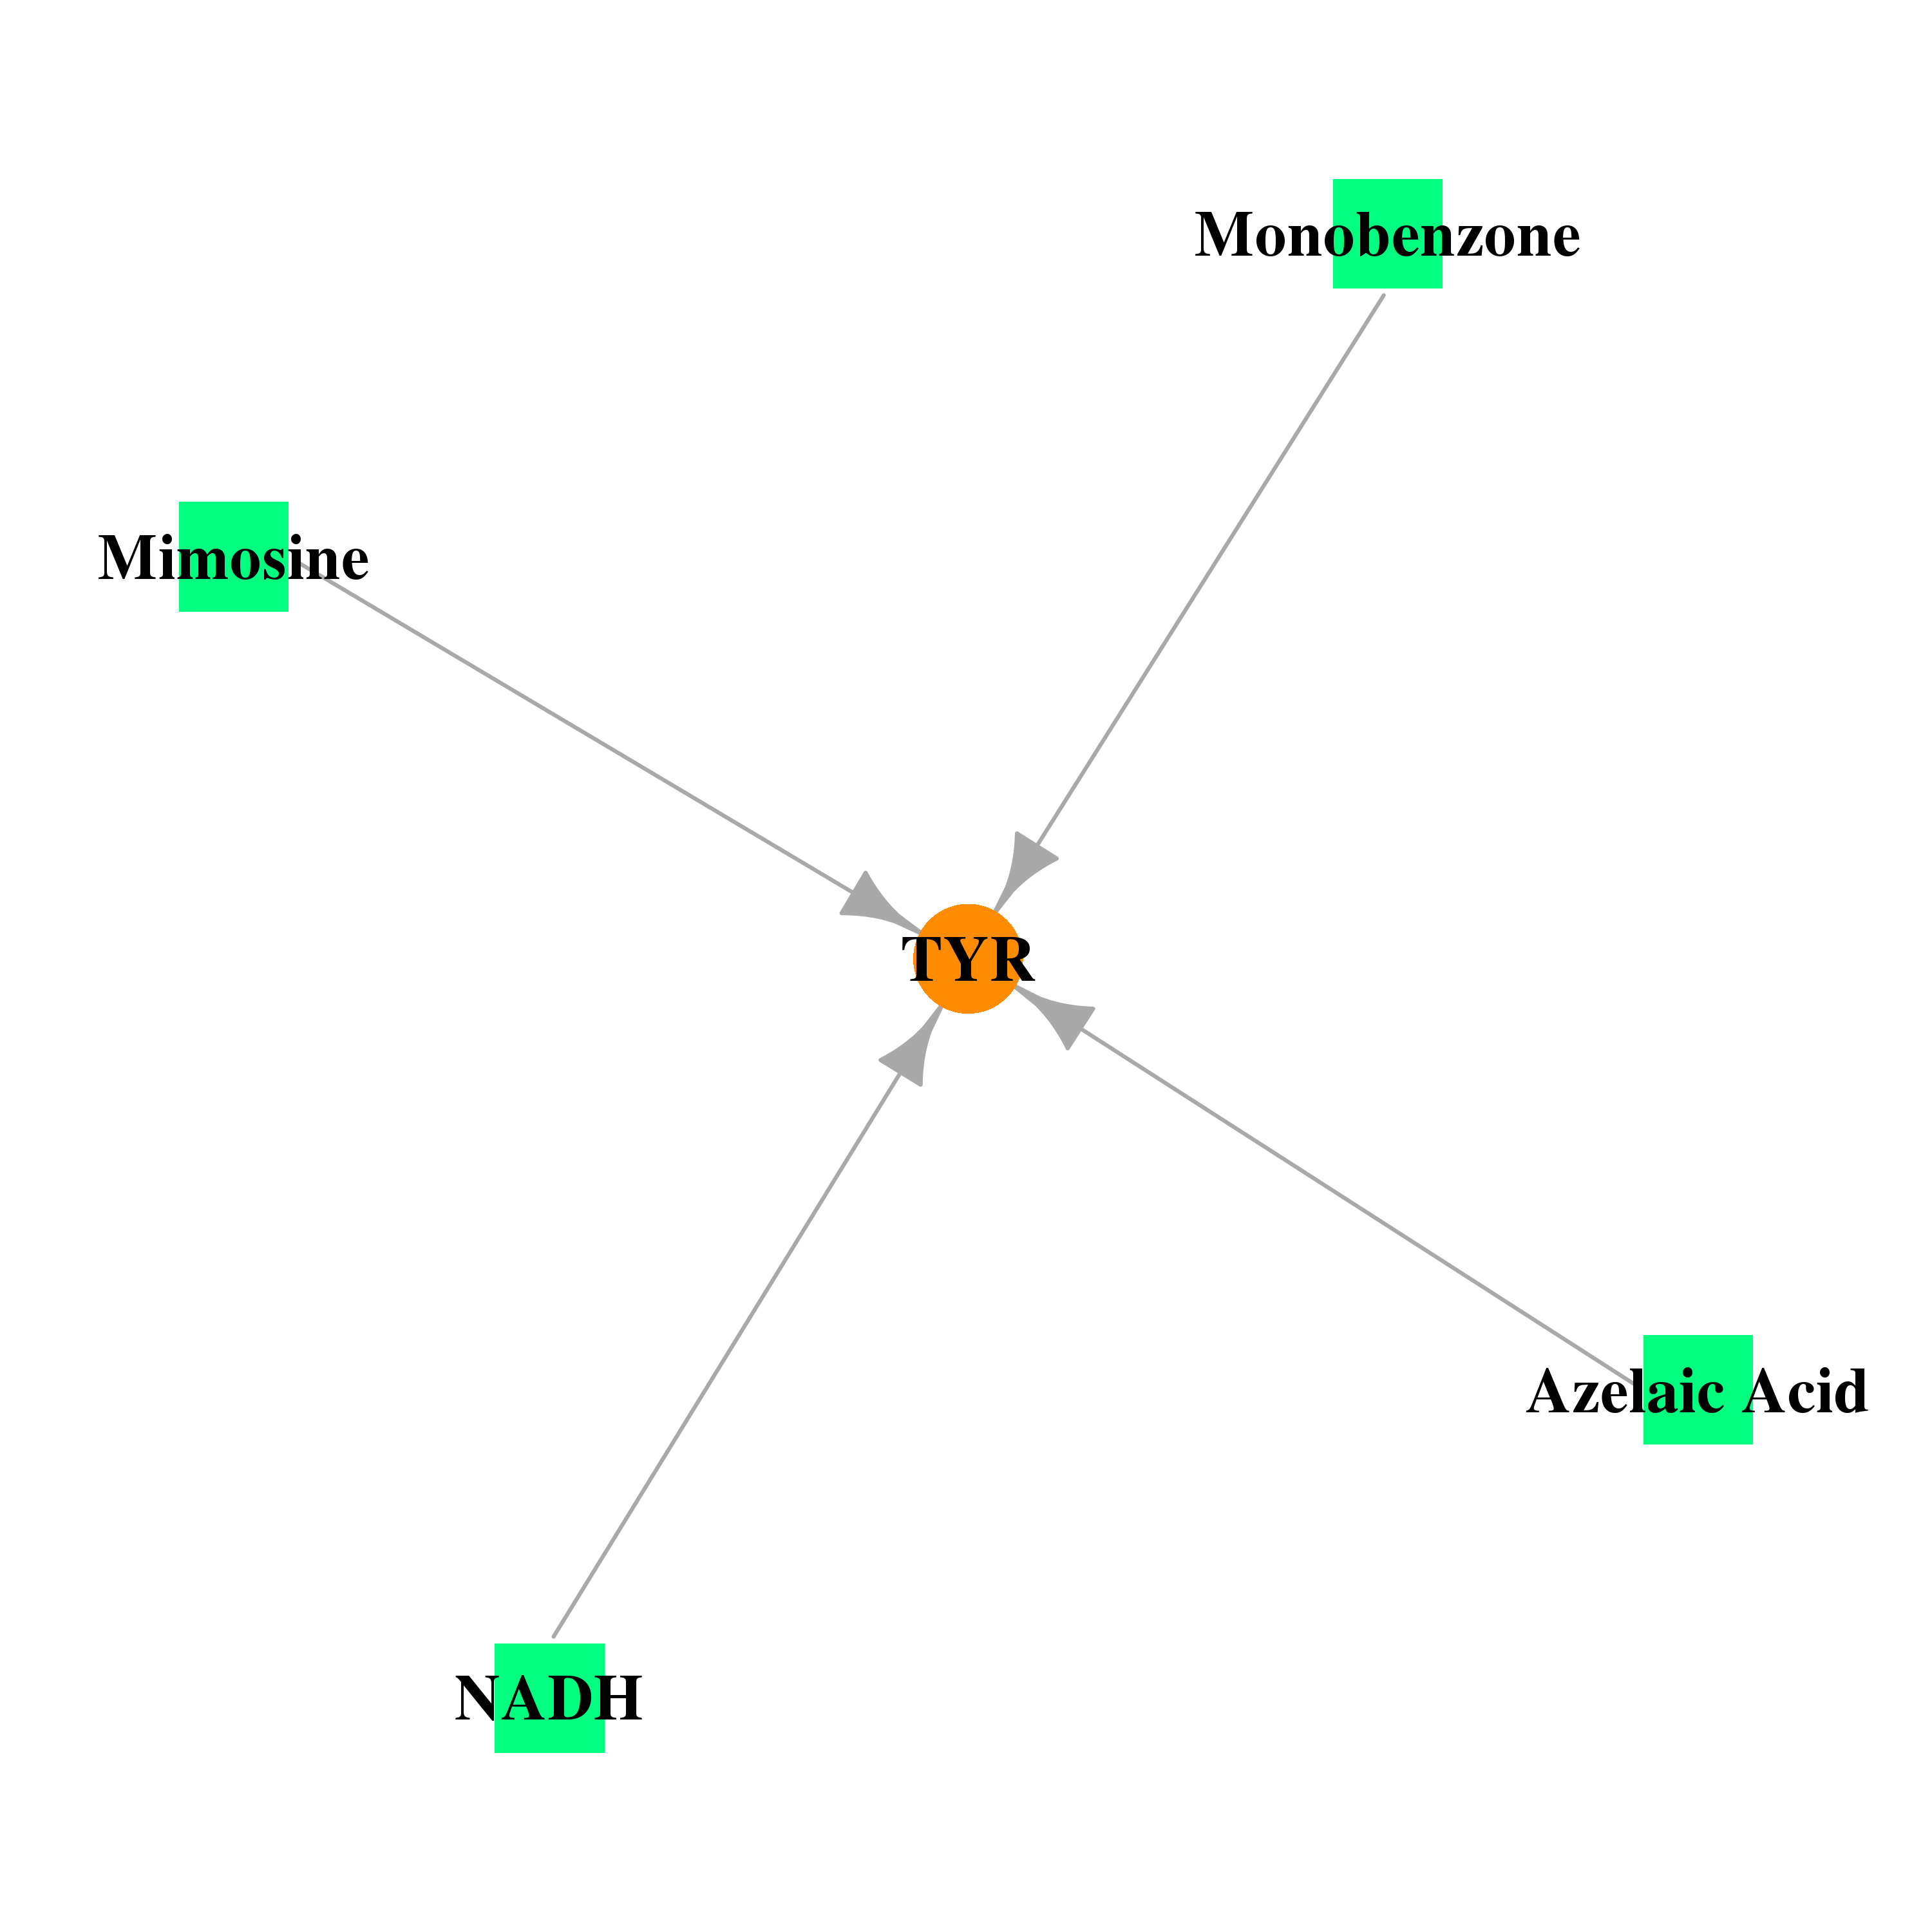 |
| * Drug Centered Interaction Network. |
| DrugBank ID | Target Name | Drug Groups | Generic Name | Drug Centered Network | Drug Structure |
| DB00157 | tyrosinase | approved; nutraceutical | NADH |  |  |
| DB00548 | tyrosinase | approved | Azelaic Acid | 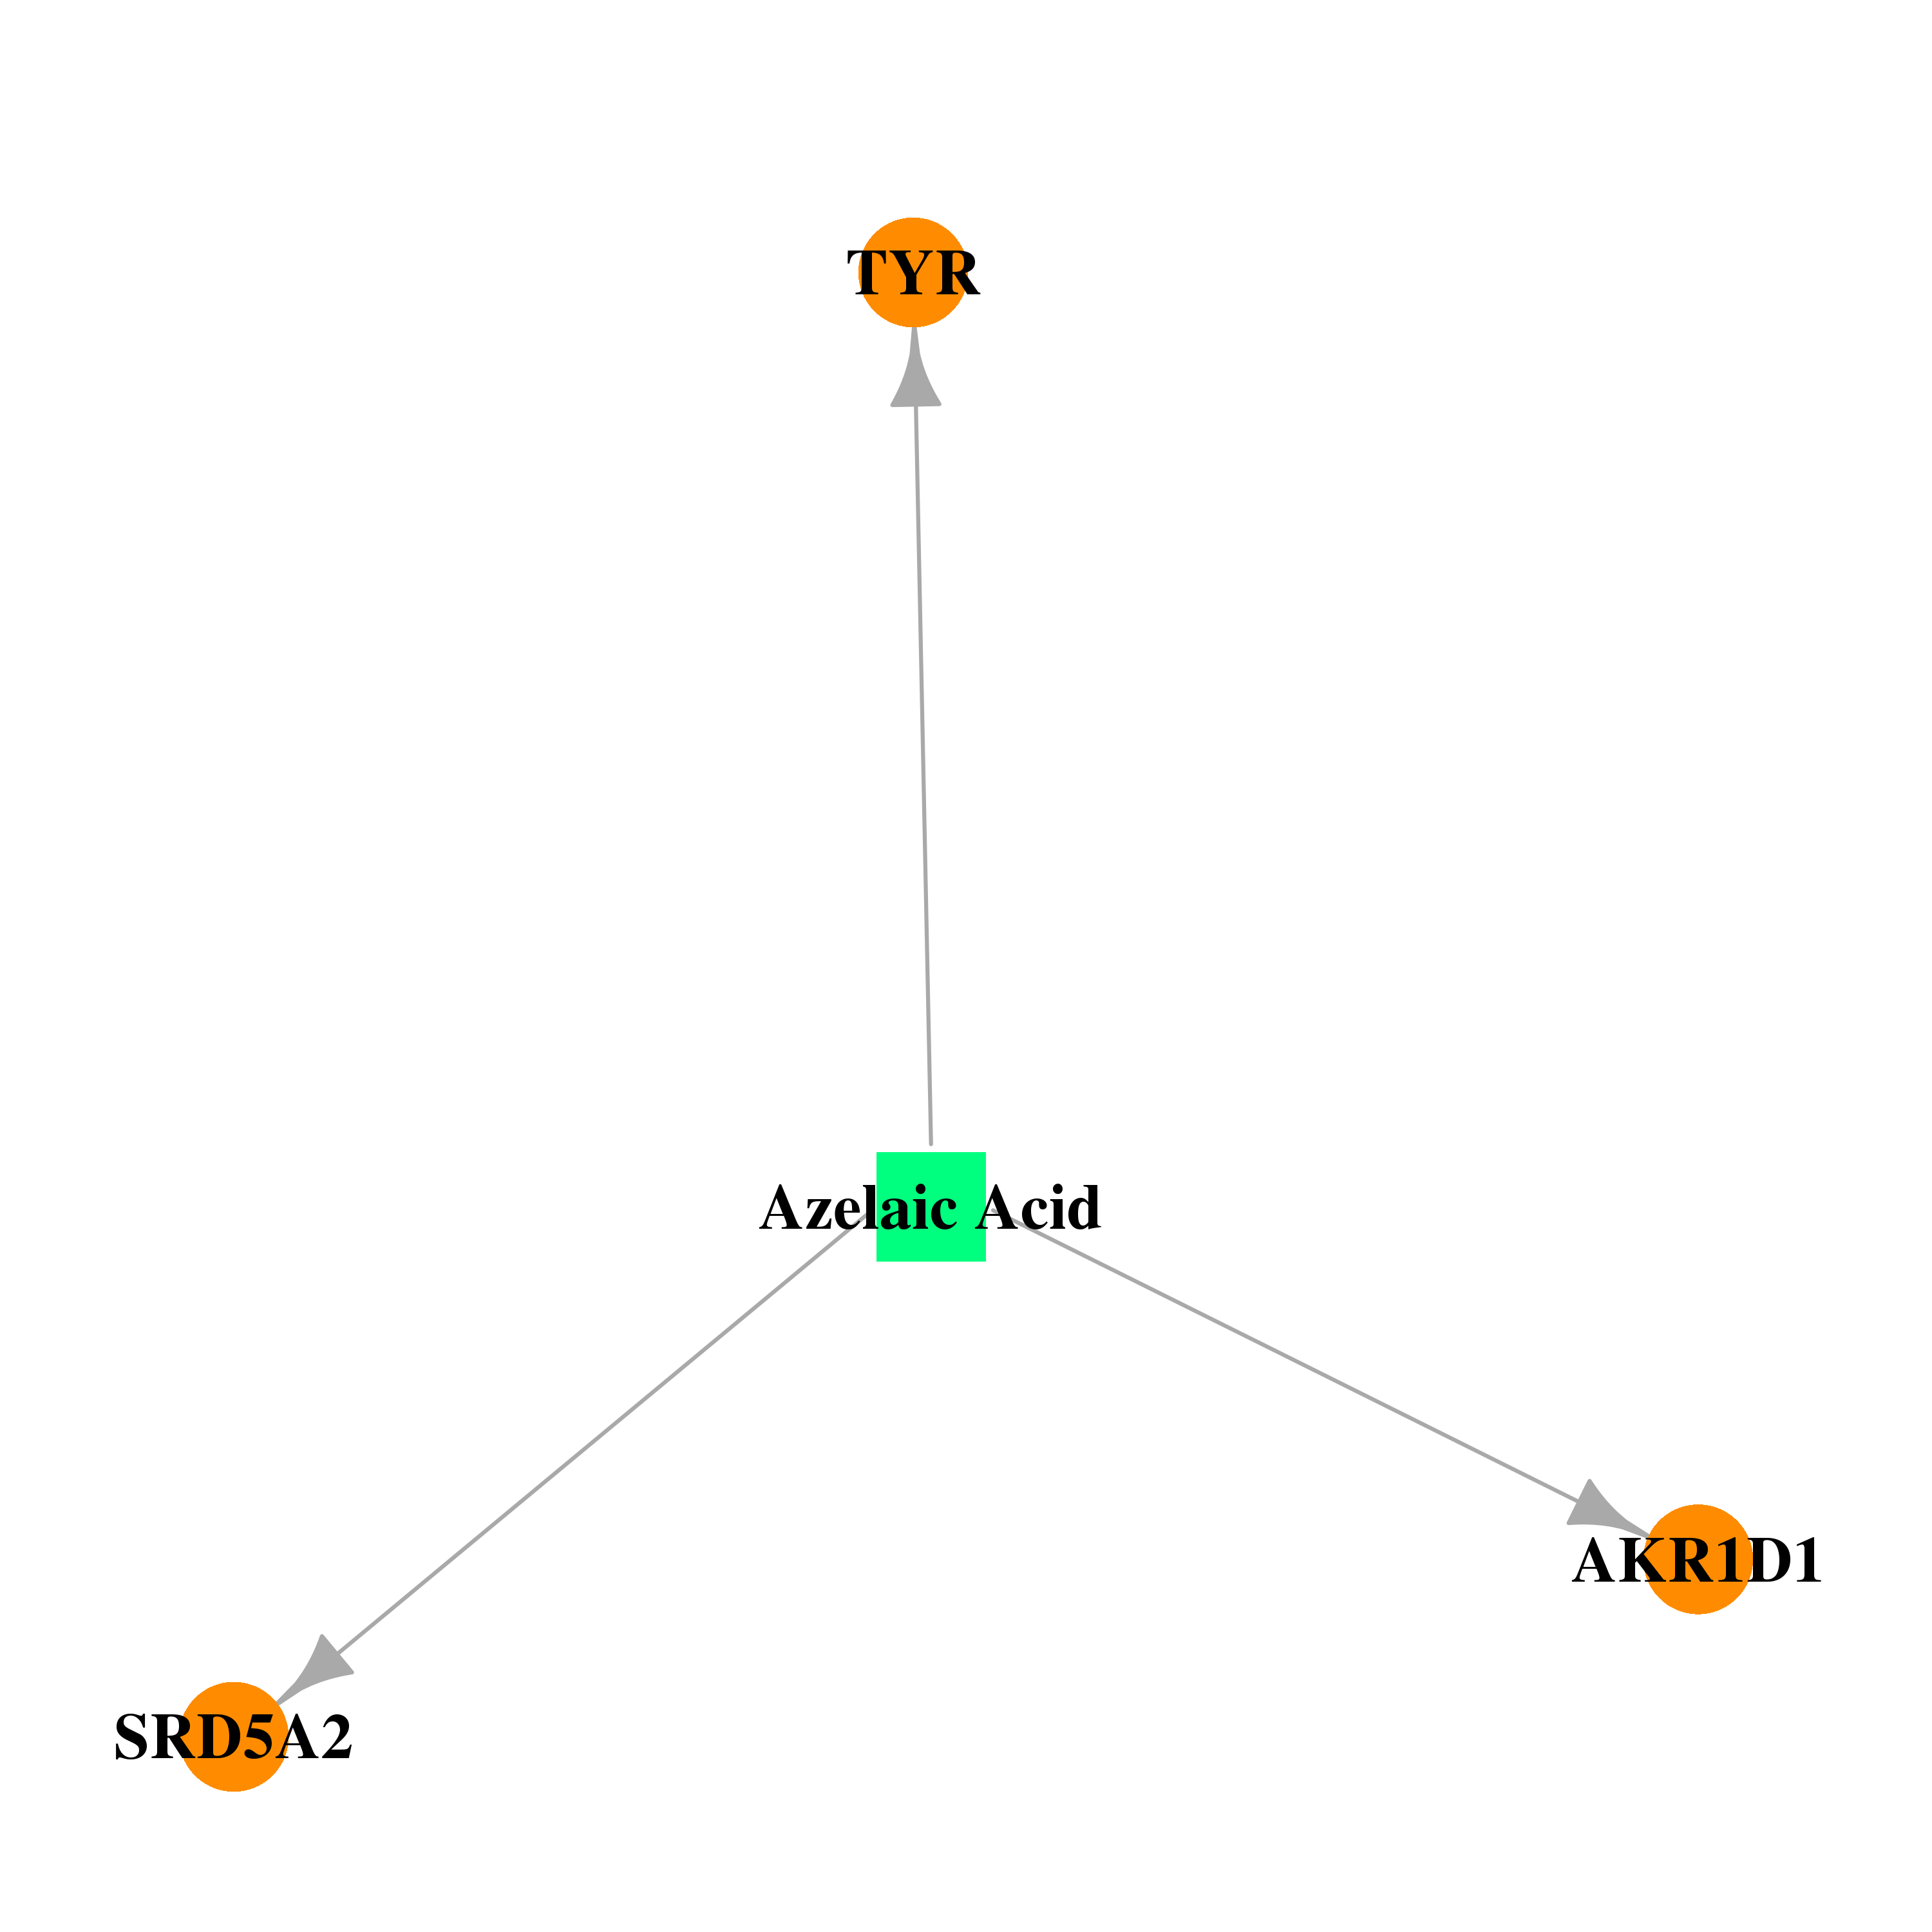 |  |
| DB00600 | tyrosinase | approved | Monobenzone | 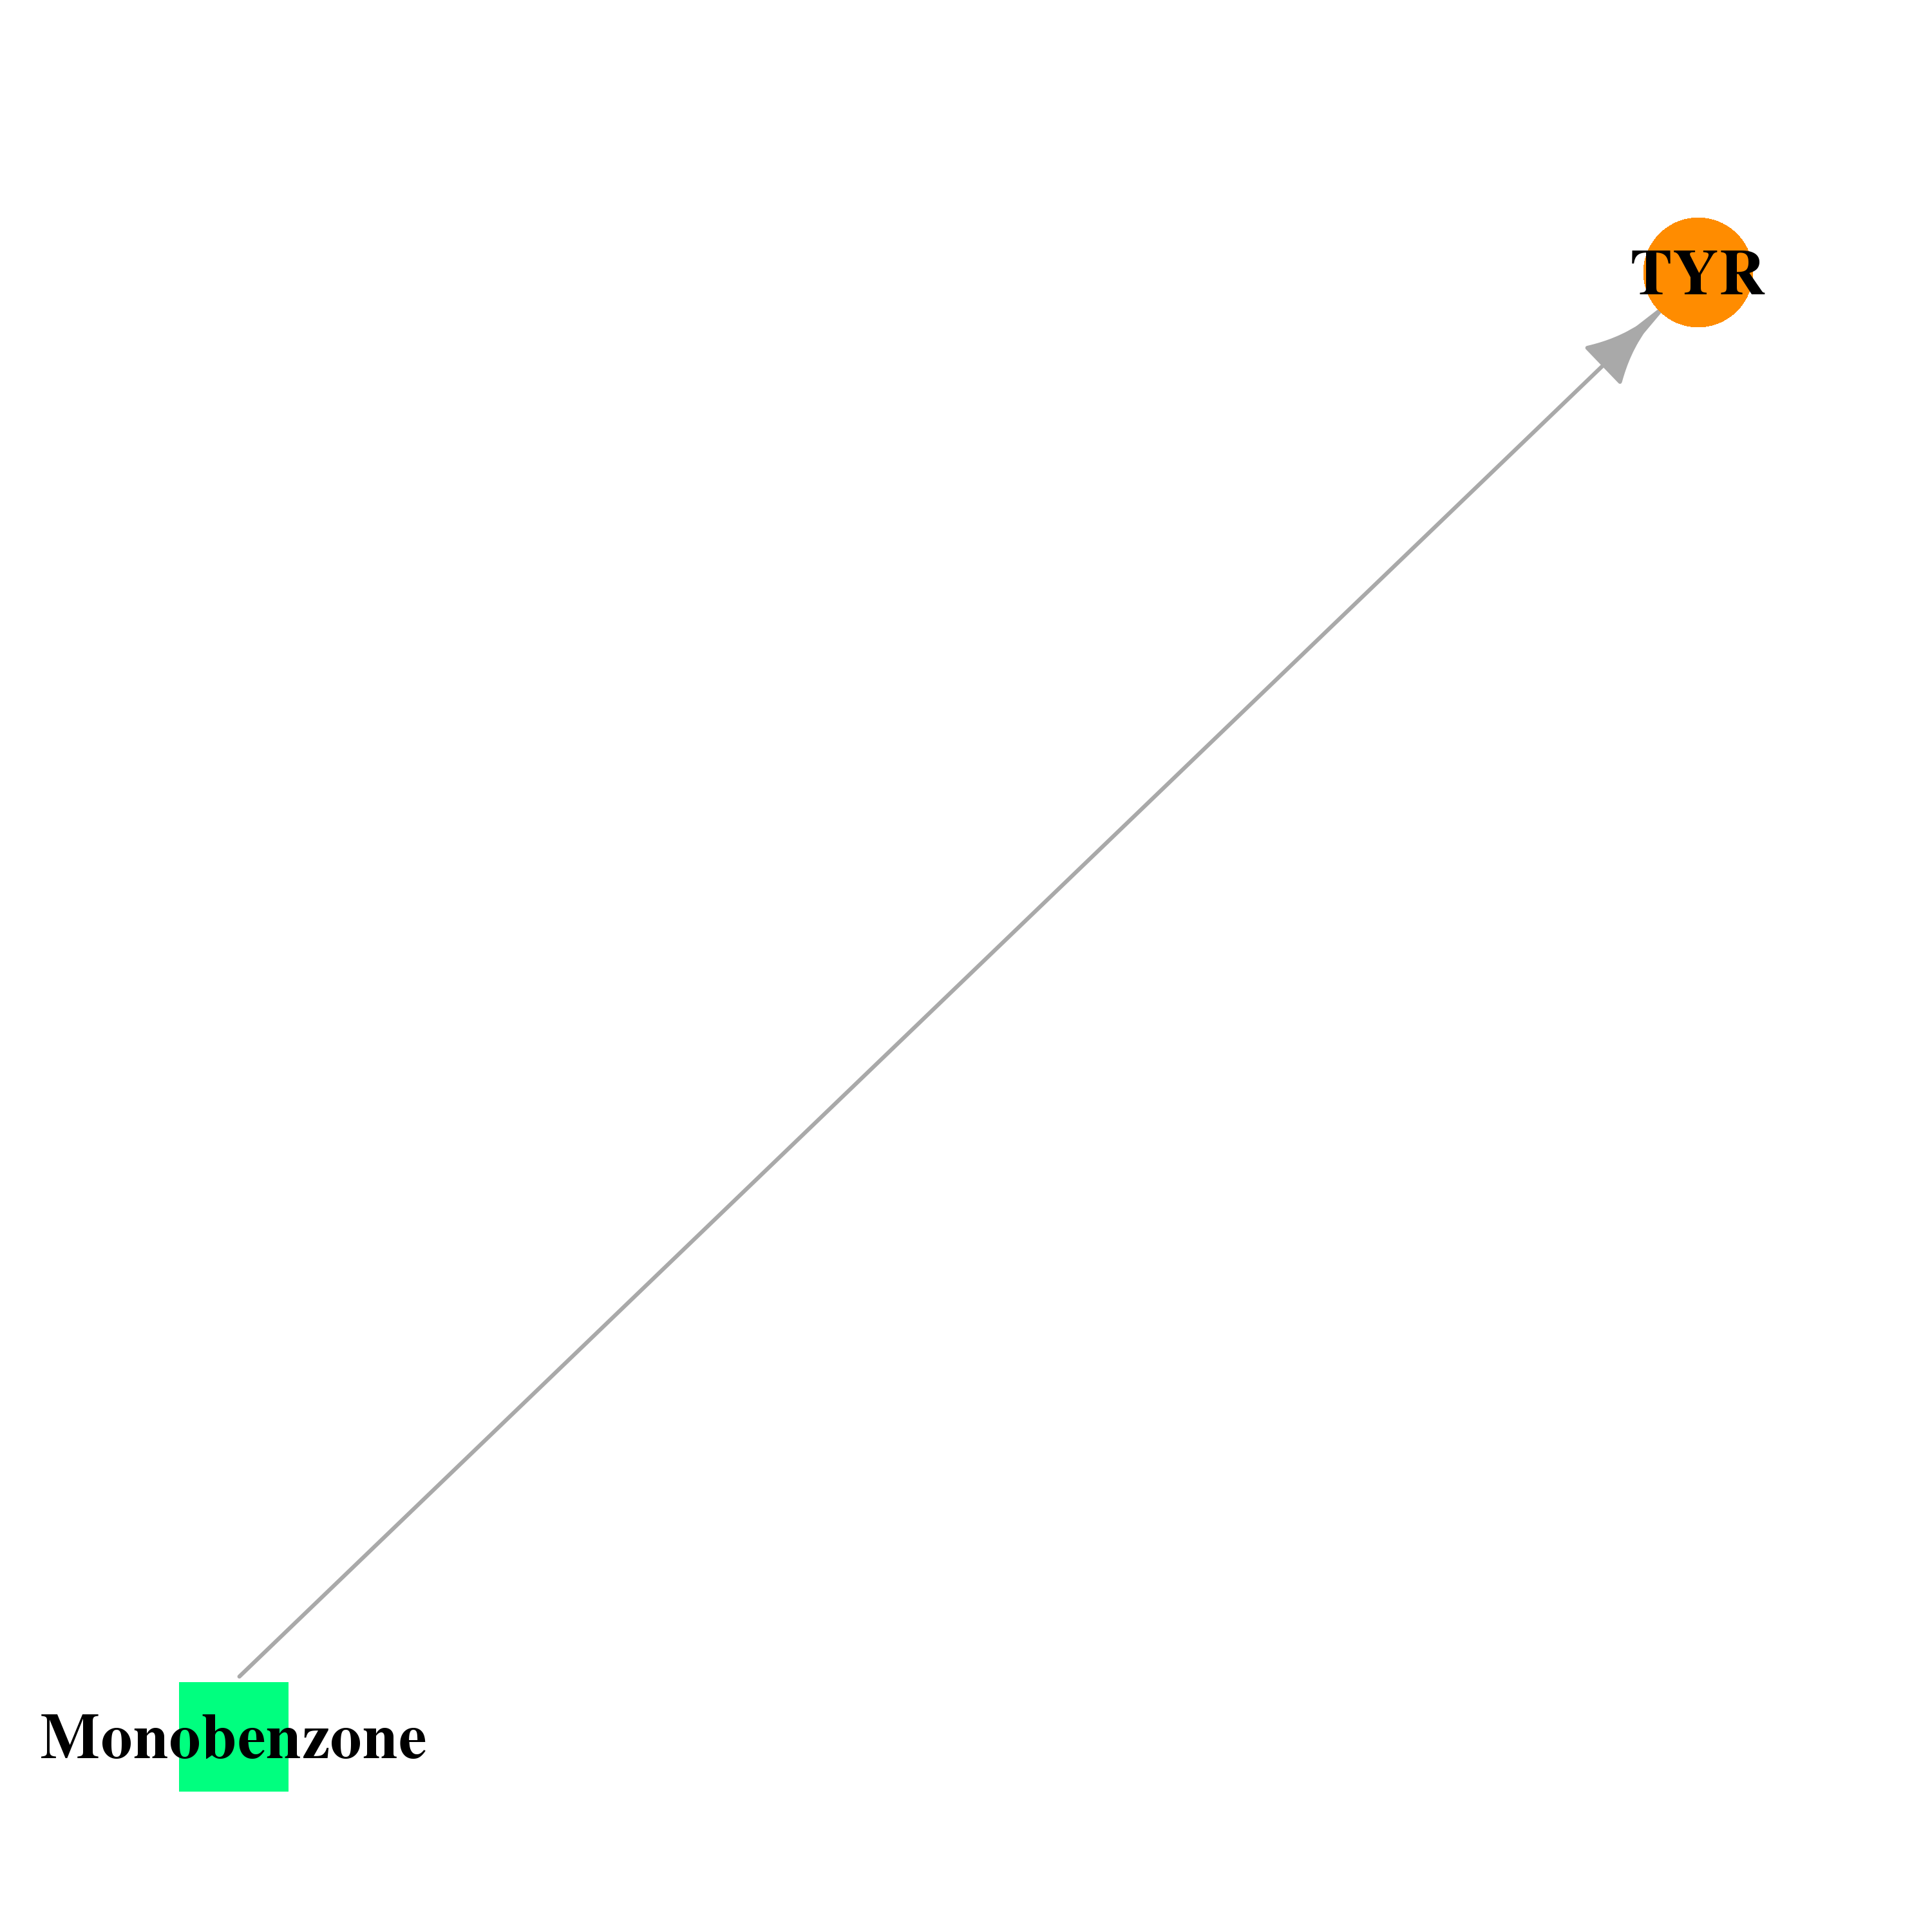 |  |
| DB01055 | tyrosinase | approved | Mimosine |  |  |
| Top |
| Cross referenced IDs for TYR |
| * We obtained these cross-references from Uniprot database. It covers 150 different DBs, 18 categories. http://www.uniprot.org/help/cross_references_section |
: Open all cross reference information
|
Copyright © 2016-Present - The Univsersity of Texas Health Science Center at Houston @ |