|
||||||||||||||||||||
| |
| Phenotypic Information (metabolism pathway, cancer, disease, phenome) |
| |
| |
| Gene-Gene Network Information: Co-Expression Network, Interacting Genes & KEGG |
| |
|


| Gene Summary for UGCG |
| Basic gene info. | Gene symbol | UGCG |
| Gene name | UDP-glucose ceramide glucosyltransferase | |
| Synonyms | GCS|GLCT1 | |
| Cytomap | UCSC genome browser: 9q31 | |
| Genomic location | chr9 :114659205-114695433 | |
| Type of gene | protein-coding | |
| RefGenes | NM_003358.2, | |
| Ensembl id | ENSG00000148154 | |
| Description | UDP-glucose:N-acylsphingosine D-glucosyltransferaseceramide glucosyltransferaseglucosylceramide synthase | |
| Modification date | 20141217 | |
| dbXrefs | MIM : 602874 | |
| HGNC : HGNC | ||
| HPRD : 04190 | ||
| Protein | UniProt: go to UniProt's Cross Reference DB Table | |
| Expression | CleanEX: HS_UGCG | |
| BioGPS: 7357 | ||
| Gene Expression Atlas: ENSG00000148154 | ||
| The Human Protein Atlas: ENSG00000148154 | ||
| Pathway | NCI Pathway Interaction Database: UGCG | |
| KEGG: UGCG | ||
| REACTOME: UGCG | ||
| ConsensusPathDB | ||
| Pathway Commons: UGCG | ||
| Metabolism | MetaCyc: UGCG | |
| HUMANCyc: UGCG | ||
| Regulation | Ensembl's Regulation: ENSG00000148154 | |
| miRBase: chr9 :114,659,205-114,695,433 | ||
| TargetScan: NM_003358 | ||
| cisRED: ENSG00000148154 | ||
| Context | iHOP: UGCG | |
| cancer metabolism search in PubMed: UGCG | ||
| UCL Cancer Institute: UGCG | ||
| Assigned class in ccmGDB | C | |
| Top |
| Phenotypic Information for UGCG(metabolism pathway, cancer, disease, phenome) |
| Cancer | CGAP: UGCG |
| Familial Cancer Database: UGCG | |
| * This gene is included in those cancer gene databases. |
|
|
|
|
|
| . | ||||||||||||||
Oncogene 1 | Significant driver gene in | |||||||||||||||||||
| cf) number; DB name 1 Oncogene; http://nar.oxfordjournals.org/content/35/suppl_1/D721.long, 2 Tumor Suppressor gene; https://bioinfo.uth.edu/TSGene/, 3 Cancer Gene Census; http://www.nature.com/nrc/journal/v4/n3/abs/nrc1299.html, 4 CancerGenes; http://nar.oxfordjournals.org/content/35/suppl_1/D721.long, 5 Network of Cancer Gene; http://ncg.kcl.ac.uk/index.php, 1Therapeutic Vulnerabilities in Cancer; http://cbio.mskcc.org/cancergenomics/statius/ |
| KEGG_SPHINGOLIPID_METABOLISM REACTOME_GLYCOSPHINGOLIPID_METABOLISM REACTOME_PHOSPHOLIPID_METABOLISM REACTOME_SPHINGOLIPID_METABOLISM REACTOME_METABOLISM_OF_LIPIDS_AND_LIPOPROTEINS | |
| OMIM | |
| Orphanet | |
| Disease | KEGG Disease: UGCG |
| MedGen: UGCG (Human Medical Genetics with Condition) | |
| ClinVar: UGCG | |
| Phenotype | MGI: UGCG (International Mouse Phenotyping Consortium) |
| PhenomicDB: UGCG | |
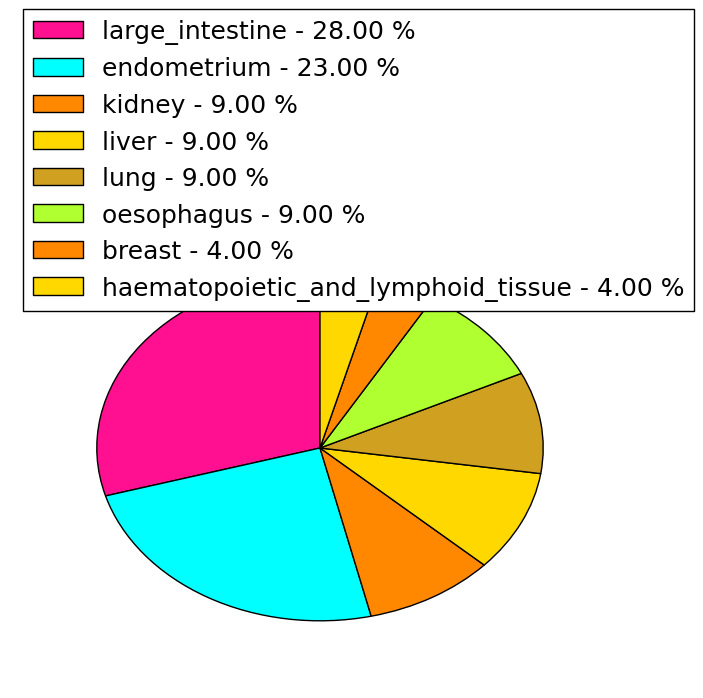
| Mutations for UGCG |
| * Under tables are showing count per each tissue to give us broad intuition about tissue specific mutation patterns.You can go to the detailed page for each mutation database's web site. |
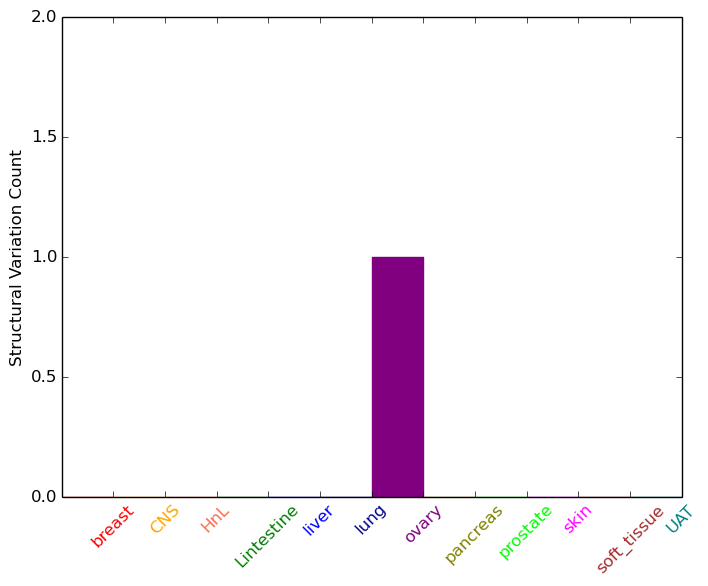
| - Statistics for Tissue and Mutation type | Top |
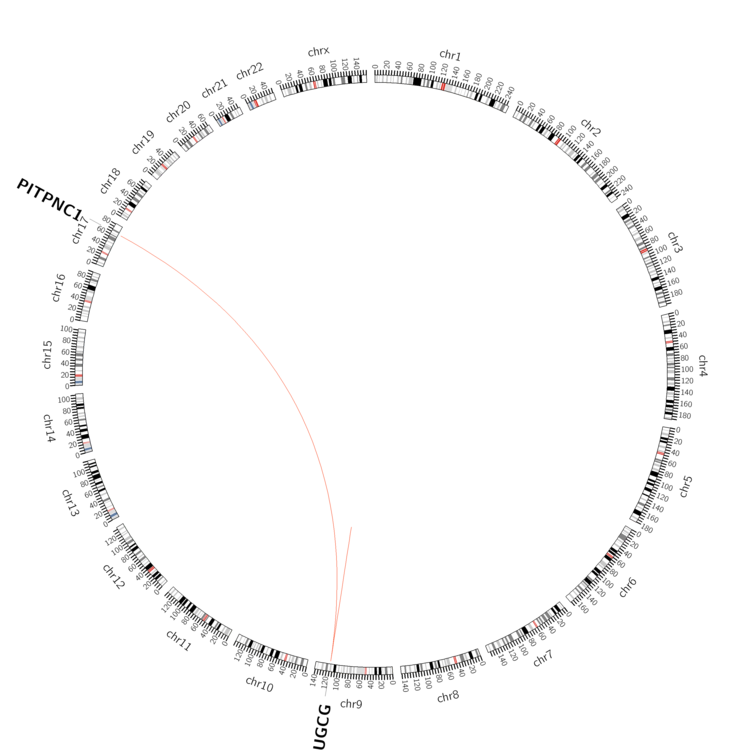 |
| - For Inter-chromosomal Variations |
| * Inter-chromosomal variantions includes 'interchromosomal amplicon to amplicon', 'interchromosomal amplicon to non-amplified dna', 'interchromosomal insertion', 'Interchromosomal unknown type'. |
 |
| - For Intra-chromosomal Variations |
| * Intra-chromosomal variantions includes 'intrachromosomal amplicon to amplicon', 'intrachromosomal amplicon to non-amplified dna', 'intrachromosomal deletion', 'intrachromosomal fold-back inversion', 'intrachromosomal inversion', 'intrachromosomal tandem duplication', 'Intrachromosomal unknown type', 'intrachromosomal with inverted orientation', 'intrachromosomal with non-inverted orientation'. |
 |
| Sample | Symbol_a | Chr_a | Start_a | End_a | Symbol_b | Chr_b | Start_b | End_b |
| ovary | UGCG | chr9 | 114666422 | 114666442 | PITPNC1 | chr17 | 65601784 | 65601804 |
| ovary | UGCG | chr9 | 114666903 | 114666923 | UGCG | chr9 | 114670920 | 114670940 |
| cf) Tissue number; Tissue name (1;Breast, 2;Central_nervous_system, 3;Haematopoietic_and_lymphoid_tissue, 4;Large_intestine, 5;Liver, 6;Lung, 7;Ovary, 8;Pancreas, 9;Prostate, 10;Skin, 11;Soft_tissue, 12;Upper_aerodigestive_tract) |
| * From mRNA Sanger sequences, Chitars2.0 arranged chimeric transcripts. This table shows UGCG related fusion information. |
| ID | Head Gene | Tail Gene | Accession | Gene_a | qStart_a | qEnd_a | Chromosome_a | tStart_a | tEnd_a | Gene_a | qStart_a | qEnd_a | Chromosome_a | tStart_a | tEnd_a |
| BE185694 | UGCG | 22 | 127 | 9 | 114672701 | 114672806 | UGCG | 123 | 256 | 9 | 114672833 | 114672966 | |
| Top |
| There's no copy number variation information in COSMIC data for this gene. |
| Top |
|
 |
| Top |
| Stat. for Non-Synonymous SNVs (# total SNVs=21) | (# total SNVs=6) |
 |  |
(# total SNVs=4) | (# total SNVs=0) |
 |
| Top |
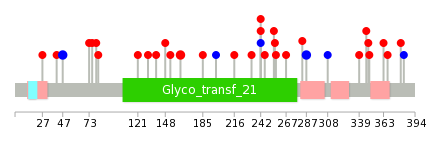
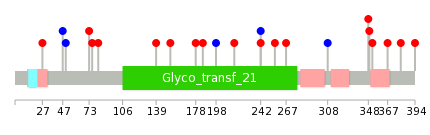
| * When you move the cursor on each content, you can see more deailed mutation information on the Tooltip. Those are primary_site,primary_histology,mutation(aa),pubmedID. |
| GRCh37 position | Mutation(aa) | Unique sampleID count |
| chr9:114695180-114695180 | p.L365fs*9 | 3 |
| chr9:114694486-114694486 | p.T287T | 2 |
| chr9:114691946-114691946 | p.A242V | 2 |
| chr9:114676927-114676927 | p.Y47Y | 2 |
| chr9:114688706-114688706 | p.E163G | 2 |
| chr9:114694472-114694472 | p.M283V | 1 |
| chr9:114677026-114677026 | p.K80N | 1 |
| chr9:114695192-114695192 | p.A367V | 1 |
| chr9:114691849-114691849 | p.G210* | 1 |
| chr9:114685132-114685132 | p.E82Q | 1 |
| Top |
|
 |
| Point Mutation/ Tissue ID | 1 | 2 | 3 | 4 | 5 | 6 | 7 | 8 | 9 | 10 | 11 | 12 | 13 | 14 | 15 | 16 | 17 | 18 | 19 | 20 |
| # sample | 1 | 5 | 2 | 1 | 1 | 1 | 2 | 2 | 5 | |||||||||||
| # mutation | 1 | 5 | 2 | 1 | 1 | 1 | 2 | 3 | 5 | |||||||||||
| nonsynonymous SNV | 1 | 3 | 1 | 1 | 2 | 3 | 5 | |||||||||||||
| synonymous SNV | 2 | 1 | 1 | 1 |
| cf) Tissue ID; Tissue type (1; BLCA[Bladder Urothelial Carcinoma], 2; BRCA[Breast invasive carcinoma], 3; CESC[Cervical squamous cell carcinoma and endocervical adenocarcinoma], 4; COAD[Colon adenocarcinoma], 5; GBM[Glioblastoma multiforme], 6; Glioma Low Grade, 7; HNSC[Head and Neck squamous cell carcinoma], 8; KICH[Kidney Chromophobe], 9; KIRC[Kidney renal clear cell carcinoma], 10; KIRP[Kidney renal papillary cell carcinoma], 11; LAML[Acute Myeloid Leukemia], 12; LUAD[Lung adenocarcinoma], 13; LUSC[Lung squamous cell carcinoma], 14; OV[Ovarian serous cystadenocarcinoma ], 15; PAAD[Pancreatic adenocarcinoma], 16; PRAD[Prostate adenocarcinoma], 17; SKCM[Skin Cutaneous Melanoma], 18:STAD[Stomach adenocarcinoma], 19:THCA[Thyroid carcinoma], 20:UCEC[Uterine Corpus Endometrial Carcinoma]) |
| Top |
| * We represented just top 10 SNVs. When you move the cursor on each content, you can see more deailed mutation information on the Tooltip. Those are primary_site, primary_histology, mutation(aa), pubmedID. |
| Genomic Position | Mutation(aa) | Unique sampleID count |
| chr9:114685132 | p.Q178H | 1 |
| chr9:114694549 | p.E185D | 1 |
| chr9:114687128 | p.I198I | 1 |
| chr9:114695134 | p.R216K | 1 |
| chr9:114688676 | p.A242V | 1 |
| chr9:114695137 | p.A242A | 1 |
| chr9:114688752 | p.V256A | 1 |
| chr9:114695147 | p.S267F | 1 |
| chr9:114688773 | p.F27V | 1 |
| chr9:114695192 | p.H308H | 1 |
| * Copy number data were extracted from TCGA using R package TCGA-Assembler. The URLs of all public data files on TCGA DCC data server were gathered on Jan-05-2015. Function ProcessCNAData in TCGA-Assembler package was used to obtain gene-level copy number value which is calculated as the average copy number of the genomic region of a gene. |
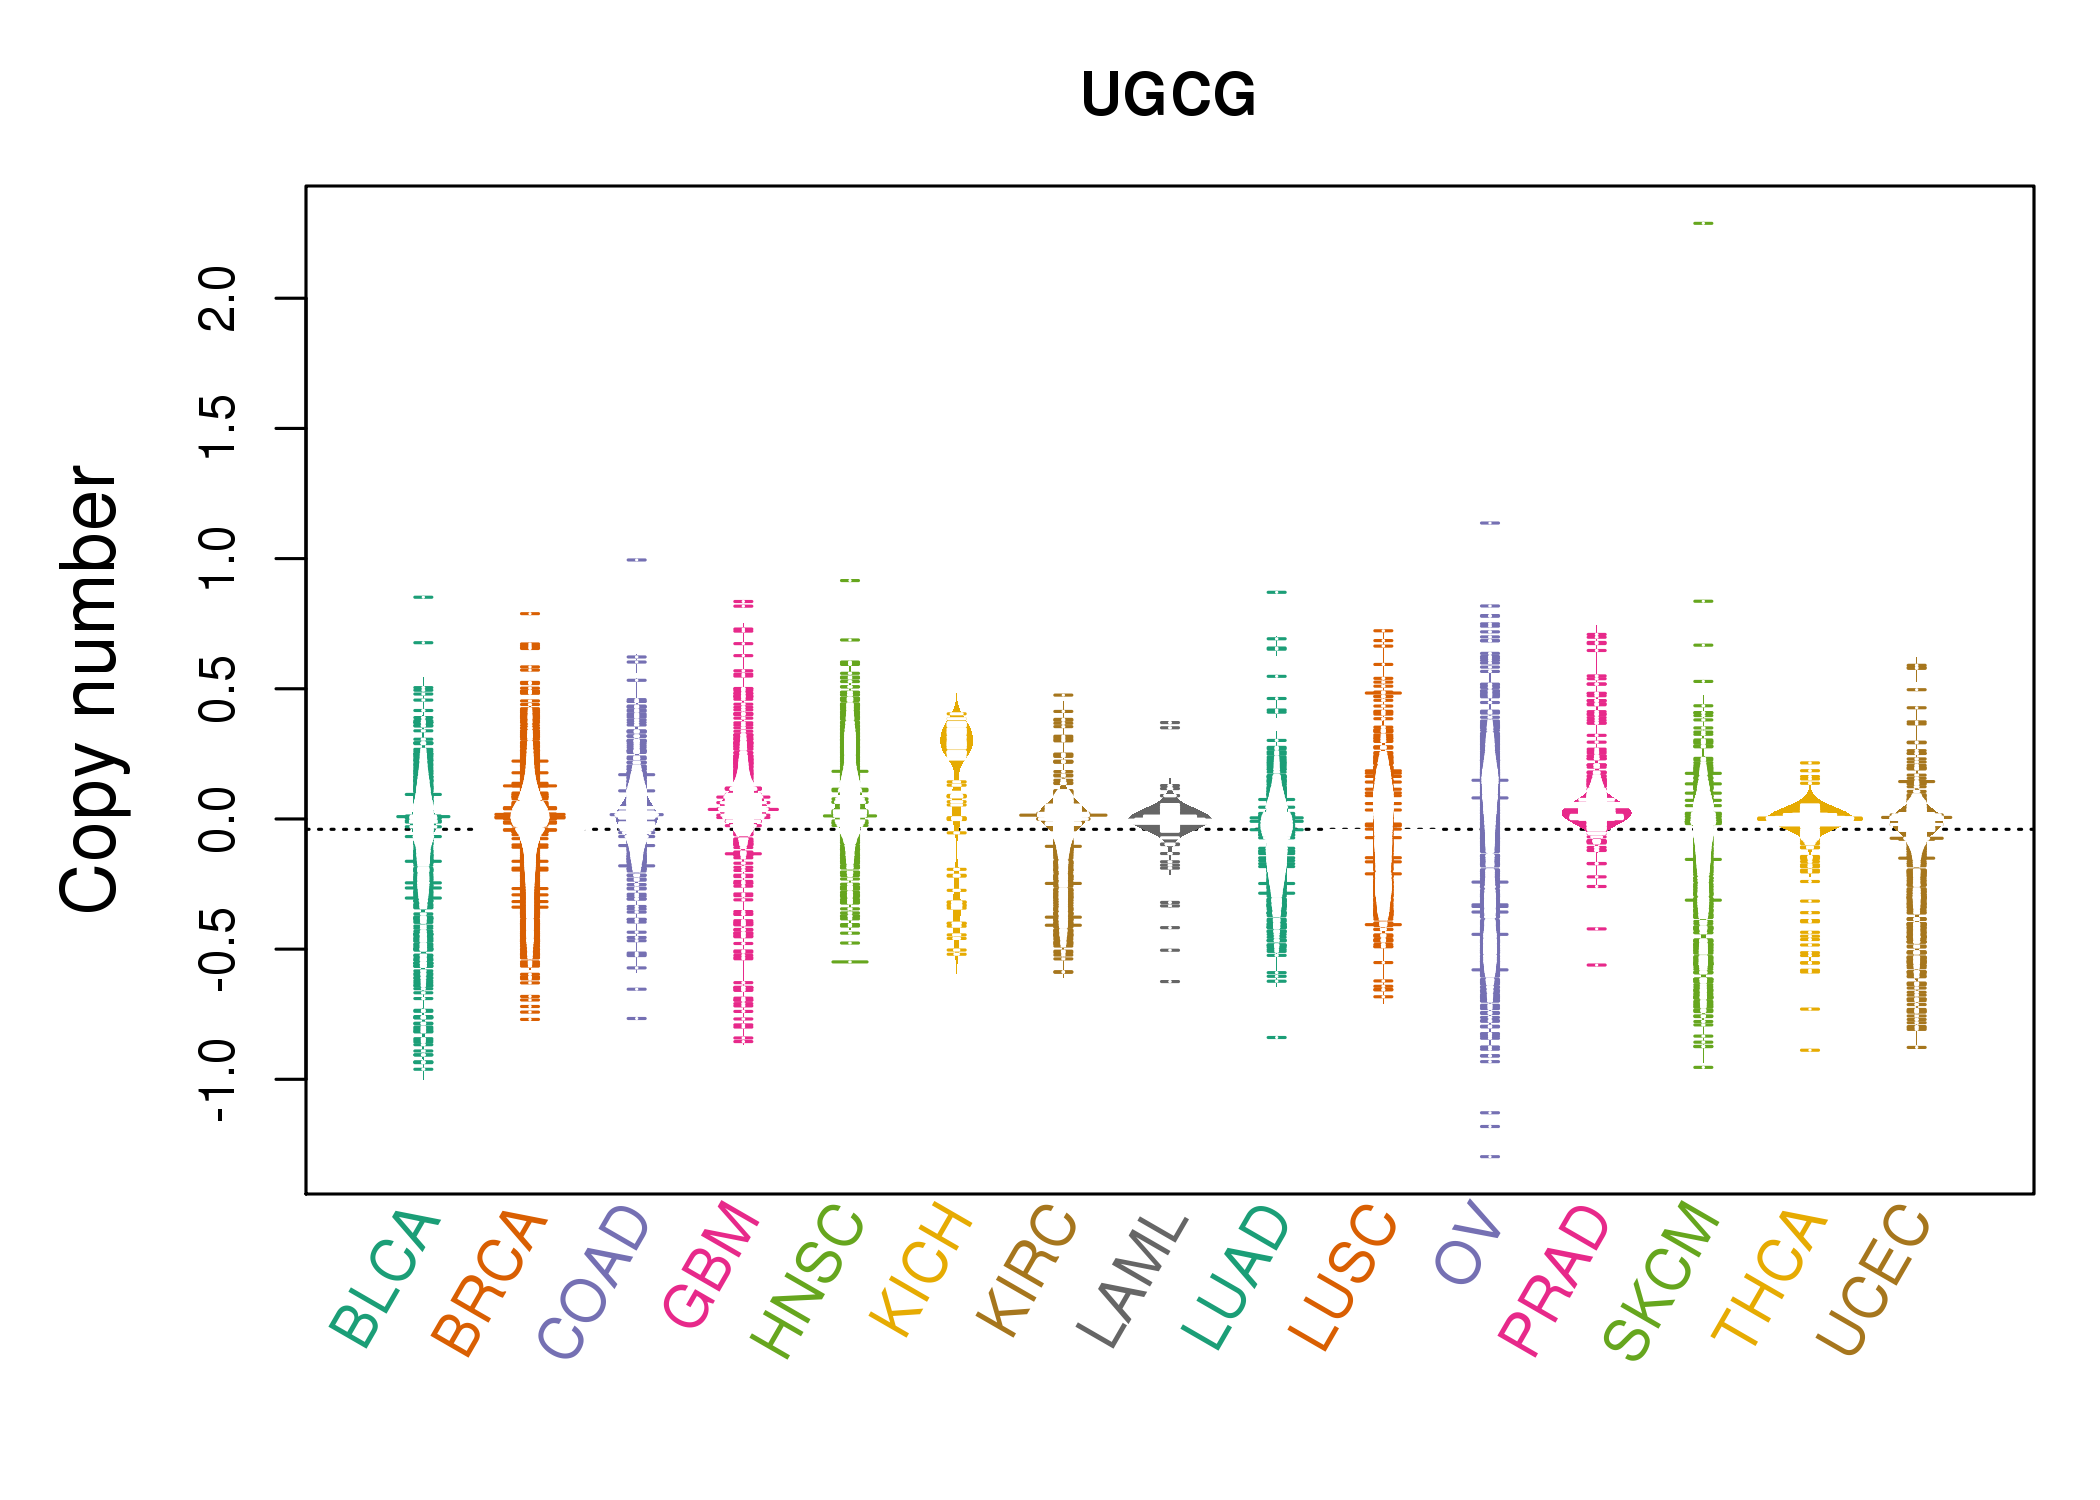 |
| cf) Tissue ID[Tissue type]: BLCA[Bladder Urothelial Carcinoma], BRCA[Breast invasive carcinoma], CESC[Cervical squamous cell carcinoma and endocervical adenocarcinoma], COAD[Colon adenocarcinoma], GBM[Glioblastoma multiforme], Glioma Low Grade, HNSC[Head and Neck squamous cell carcinoma], KICH[Kidney Chromophobe], KIRC[Kidney renal clear cell carcinoma], KIRP[Kidney renal papillary cell carcinoma], LAML[Acute Myeloid Leukemia], LUAD[Lung adenocarcinoma], LUSC[Lung squamous cell carcinoma], OV[Ovarian serous cystadenocarcinoma ], PAAD[Pancreatic adenocarcinoma], PRAD[Prostate adenocarcinoma], SKCM[Skin Cutaneous Melanoma], STAD[Stomach adenocarcinoma], THCA[Thyroid carcinoma], UCEC[Uterine Corpus Endometrial Carcinoma] |
| Top |
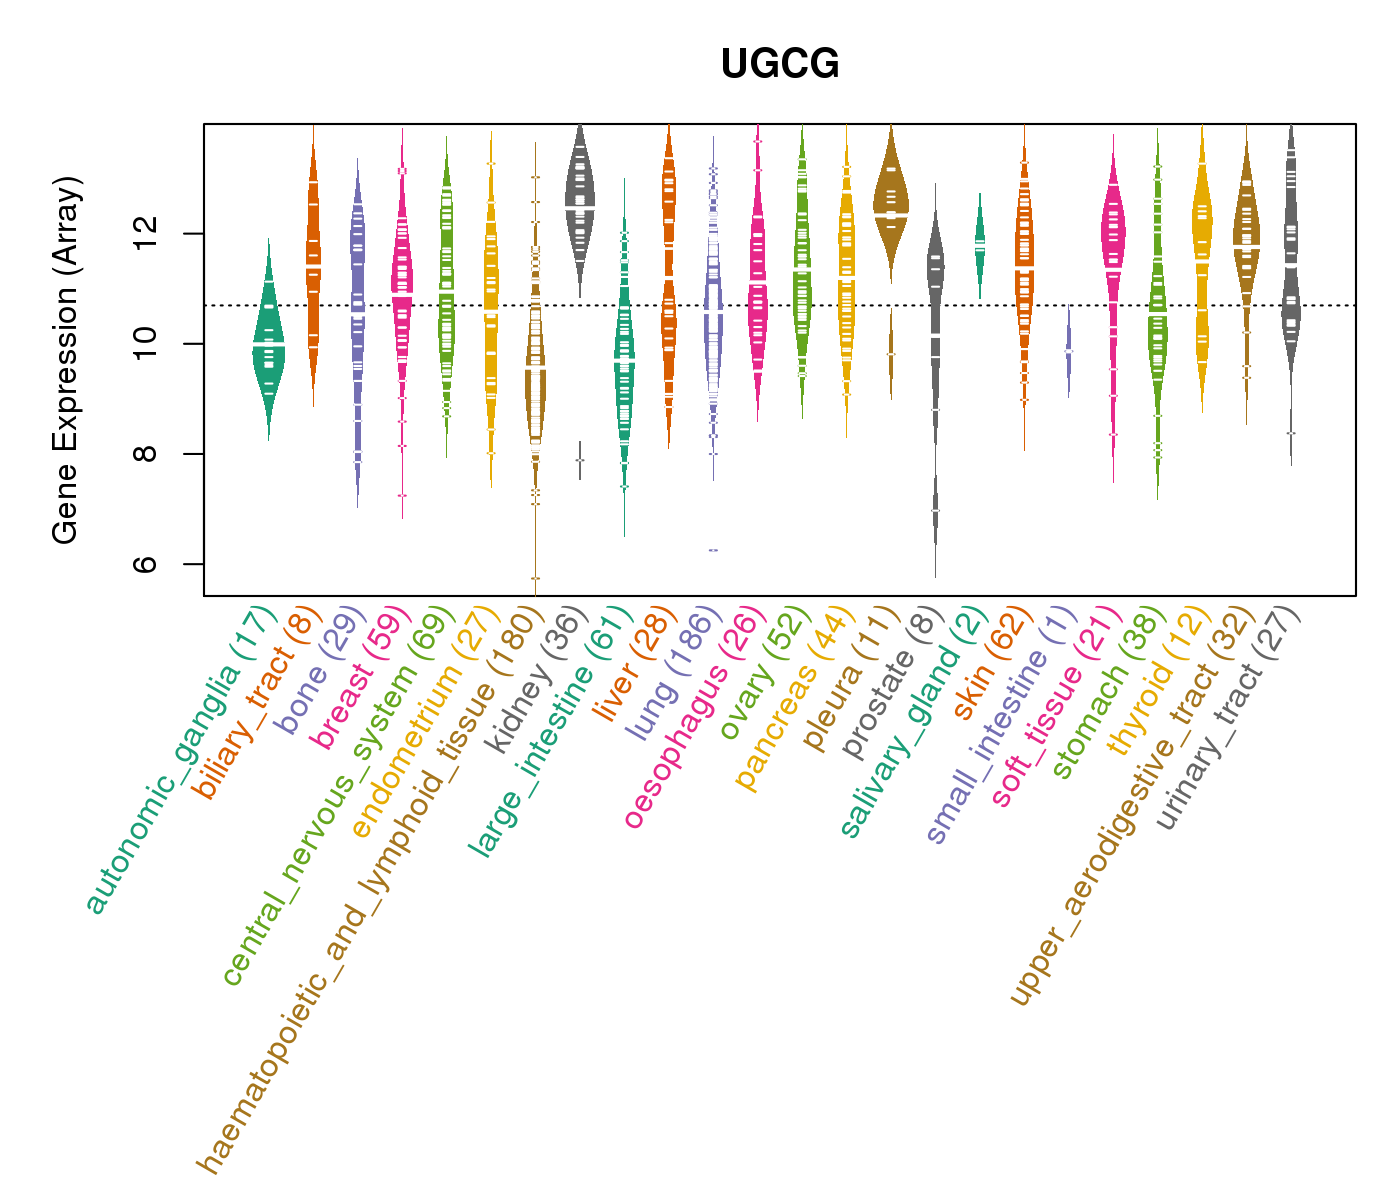
| Gene Expression for UGCG |
| * CCLE gene expression data were extracted from CCLE_Expression_Entrez_2012-10-18.res: Gene-centric RMA-normalized mRNA expression data. |
 |
| * Normalized gene expression data of RNASeqV2 was extracted from TCGA using R package TCGA-Assembler. The URLs of all public data files on TCGA DCC data server were gathered at Jan-05-2015. Only eight cancer types have enough normal control samples for differential expression analysis. (t test, adjusted p<0.05 (using Benjamini-Hochberg FDR)) |
 |
| Top |
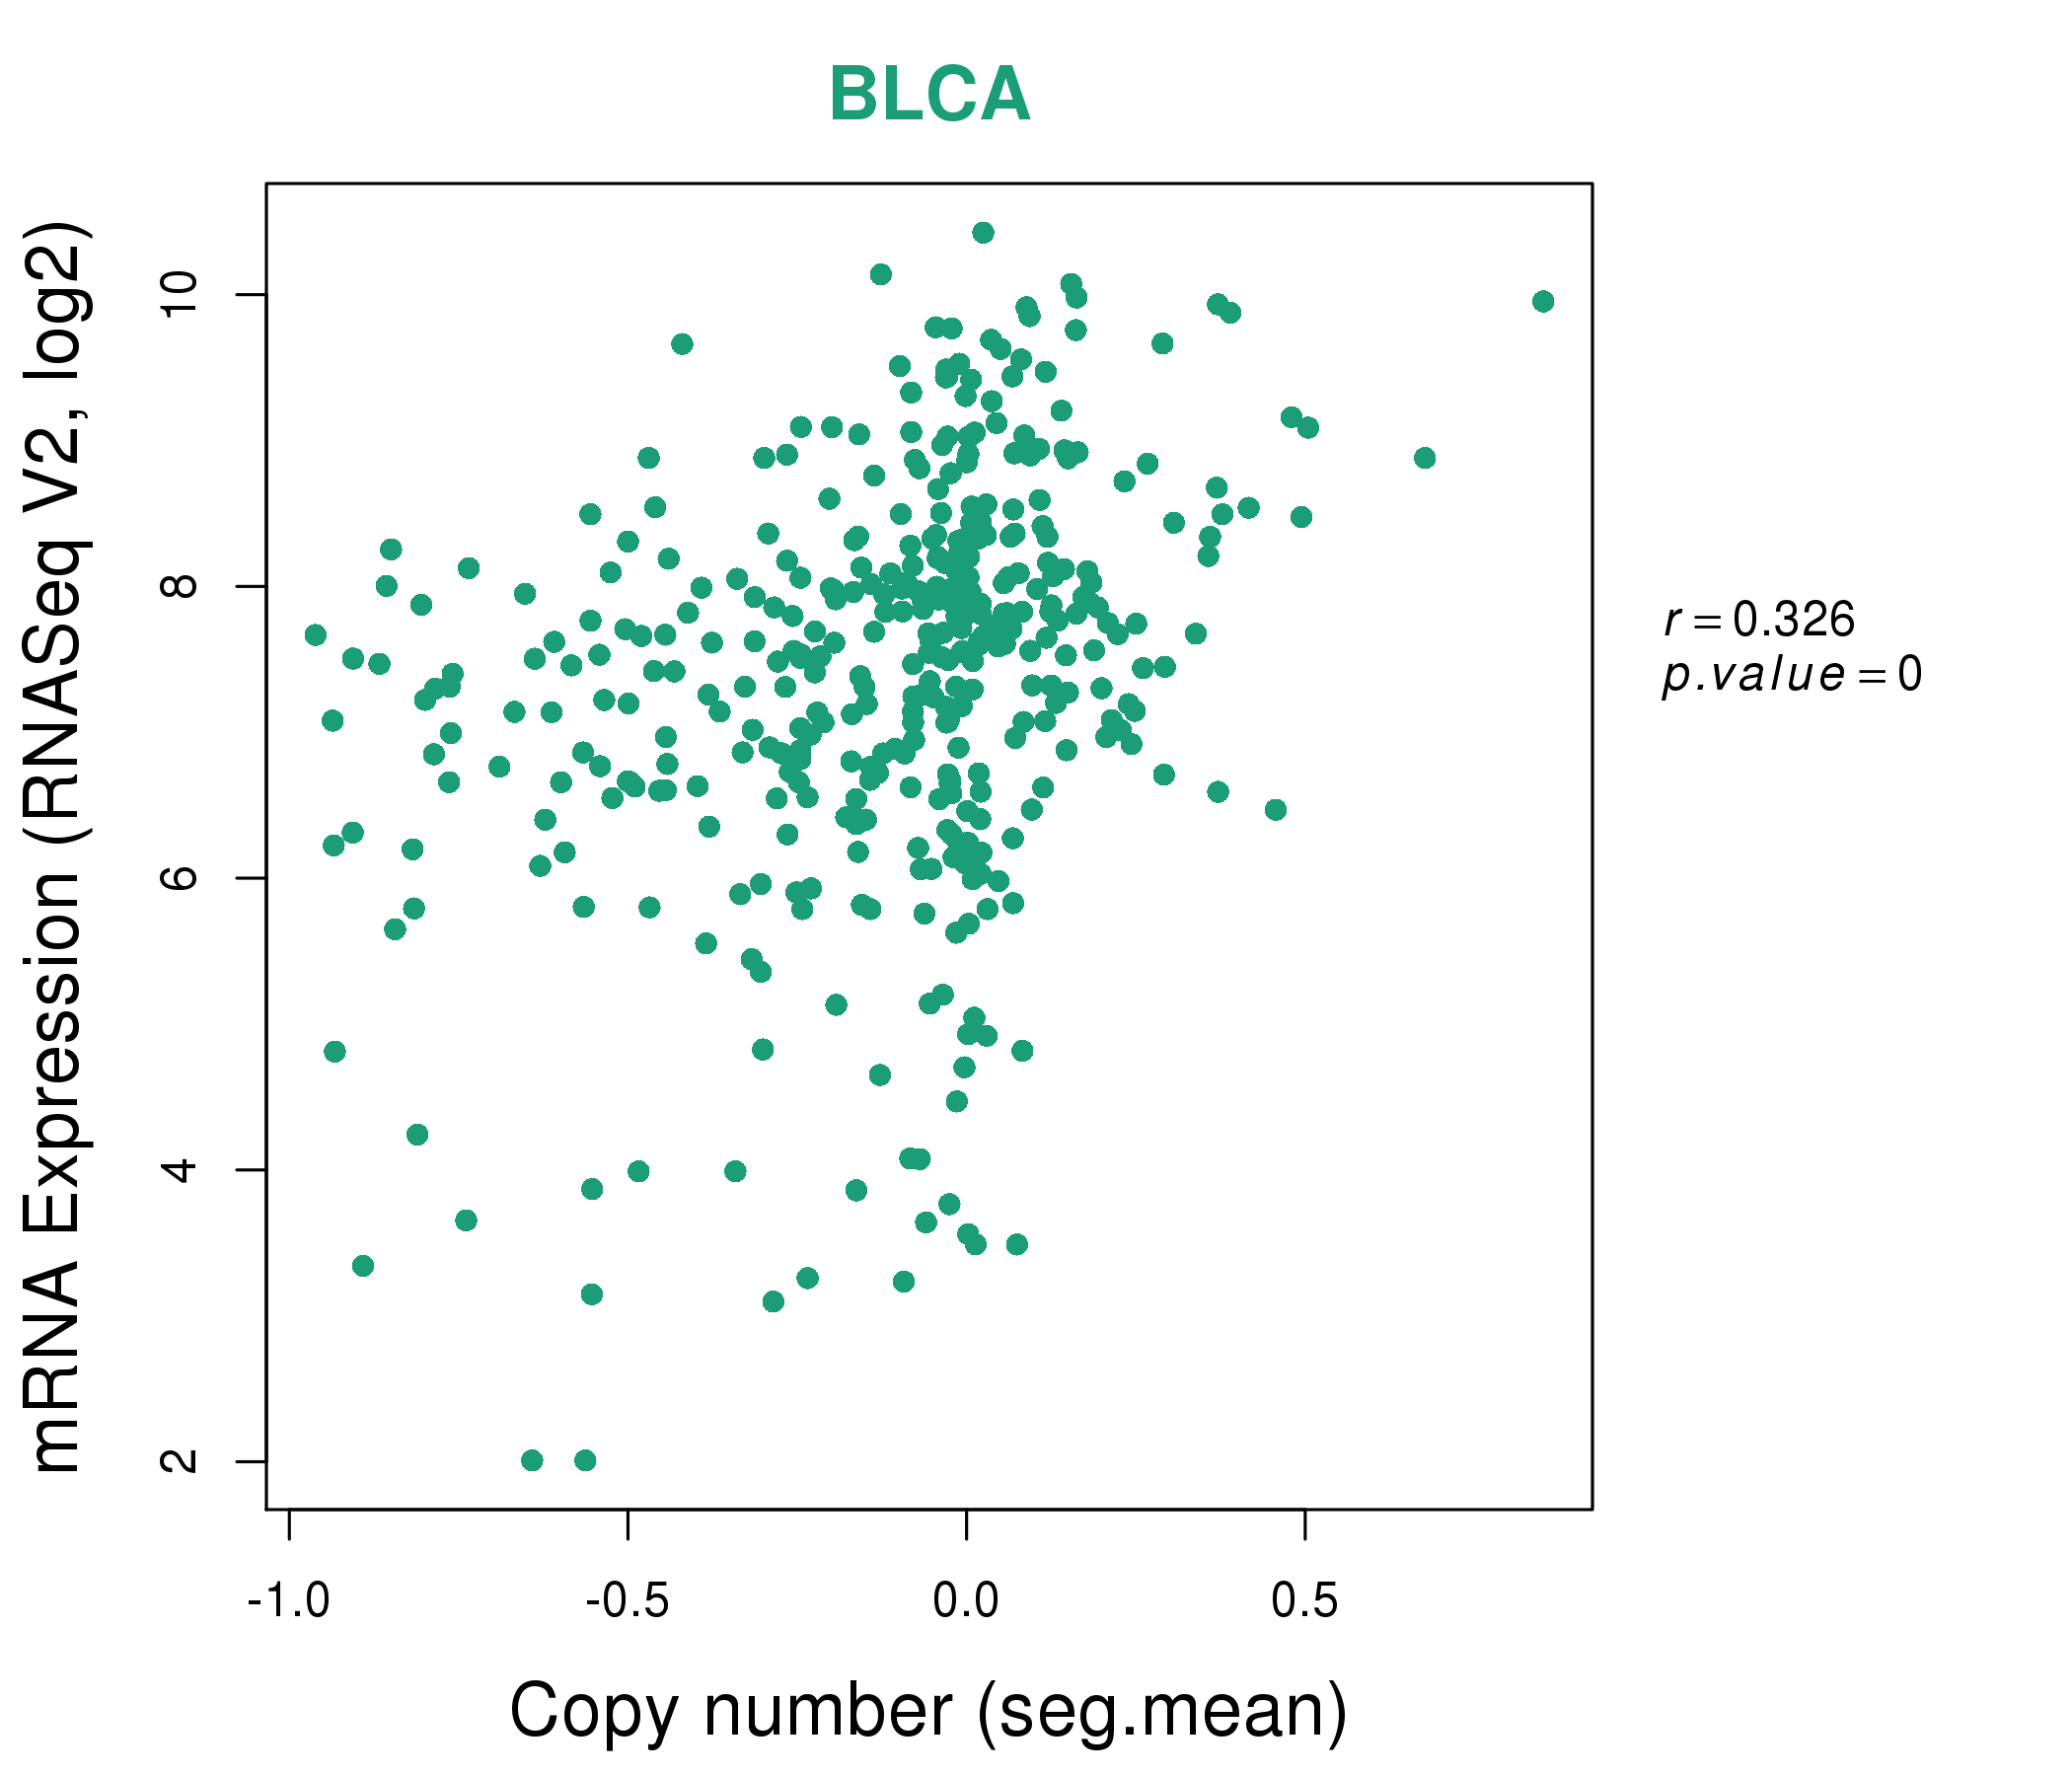
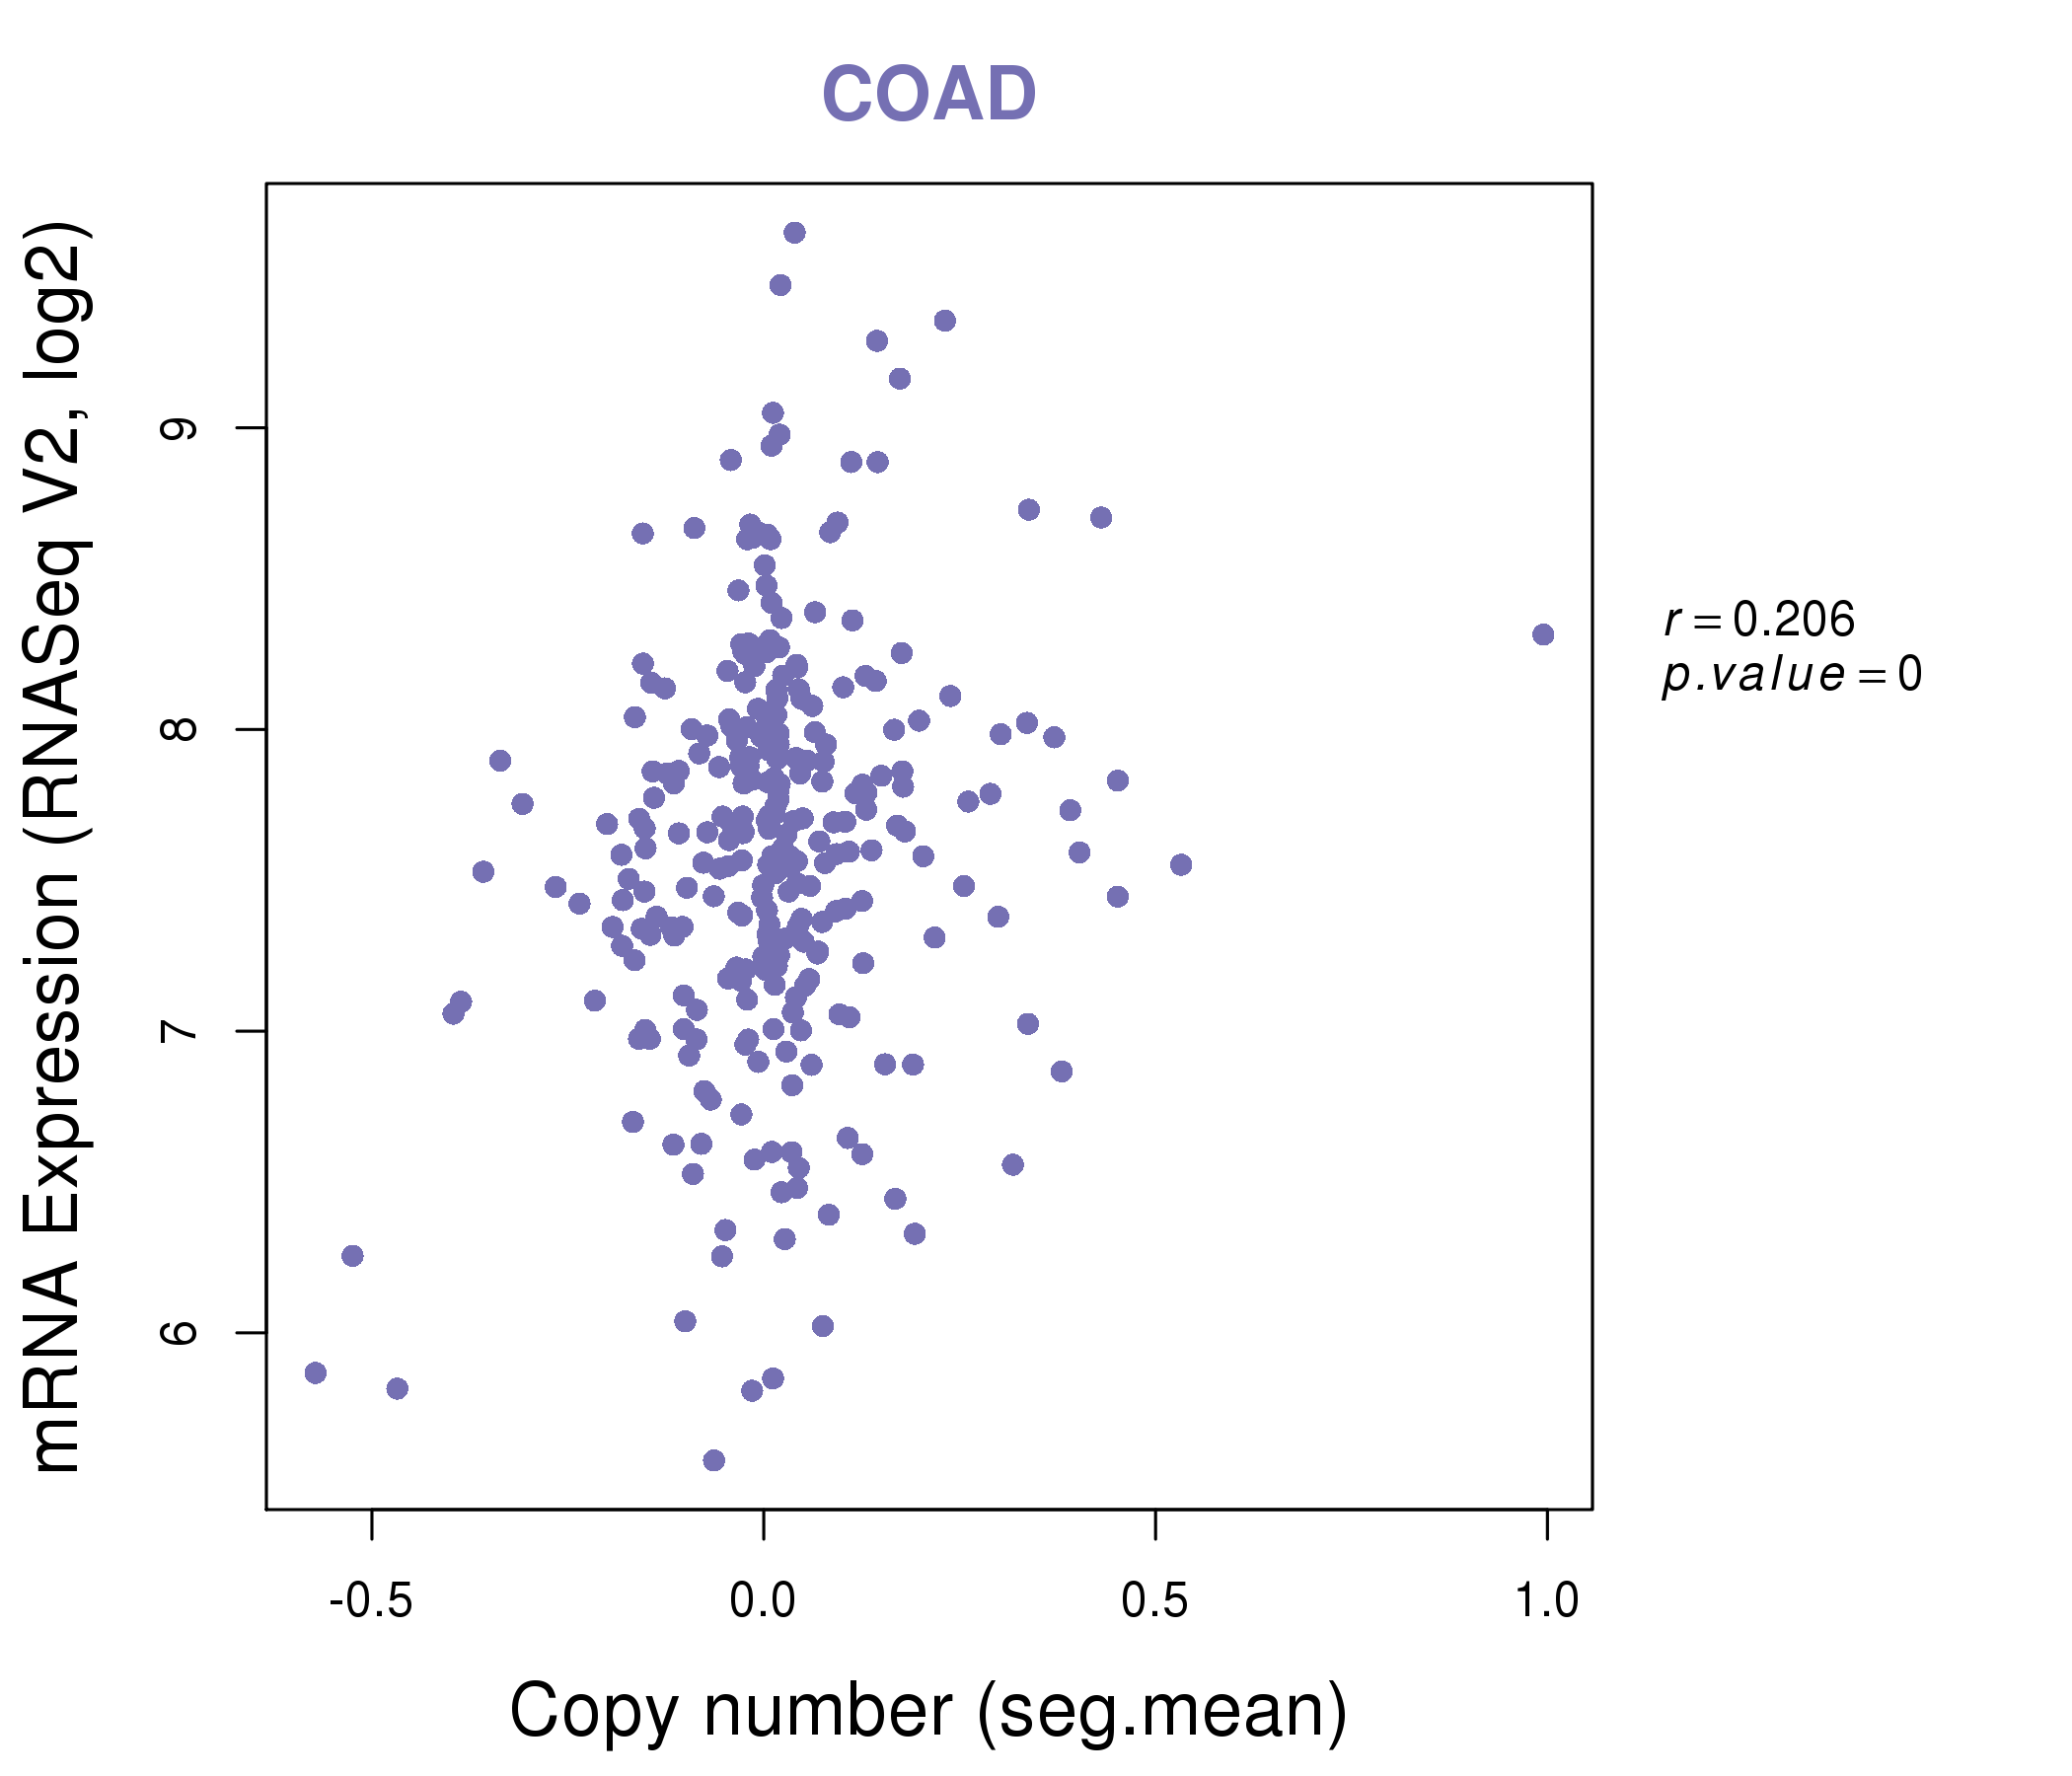
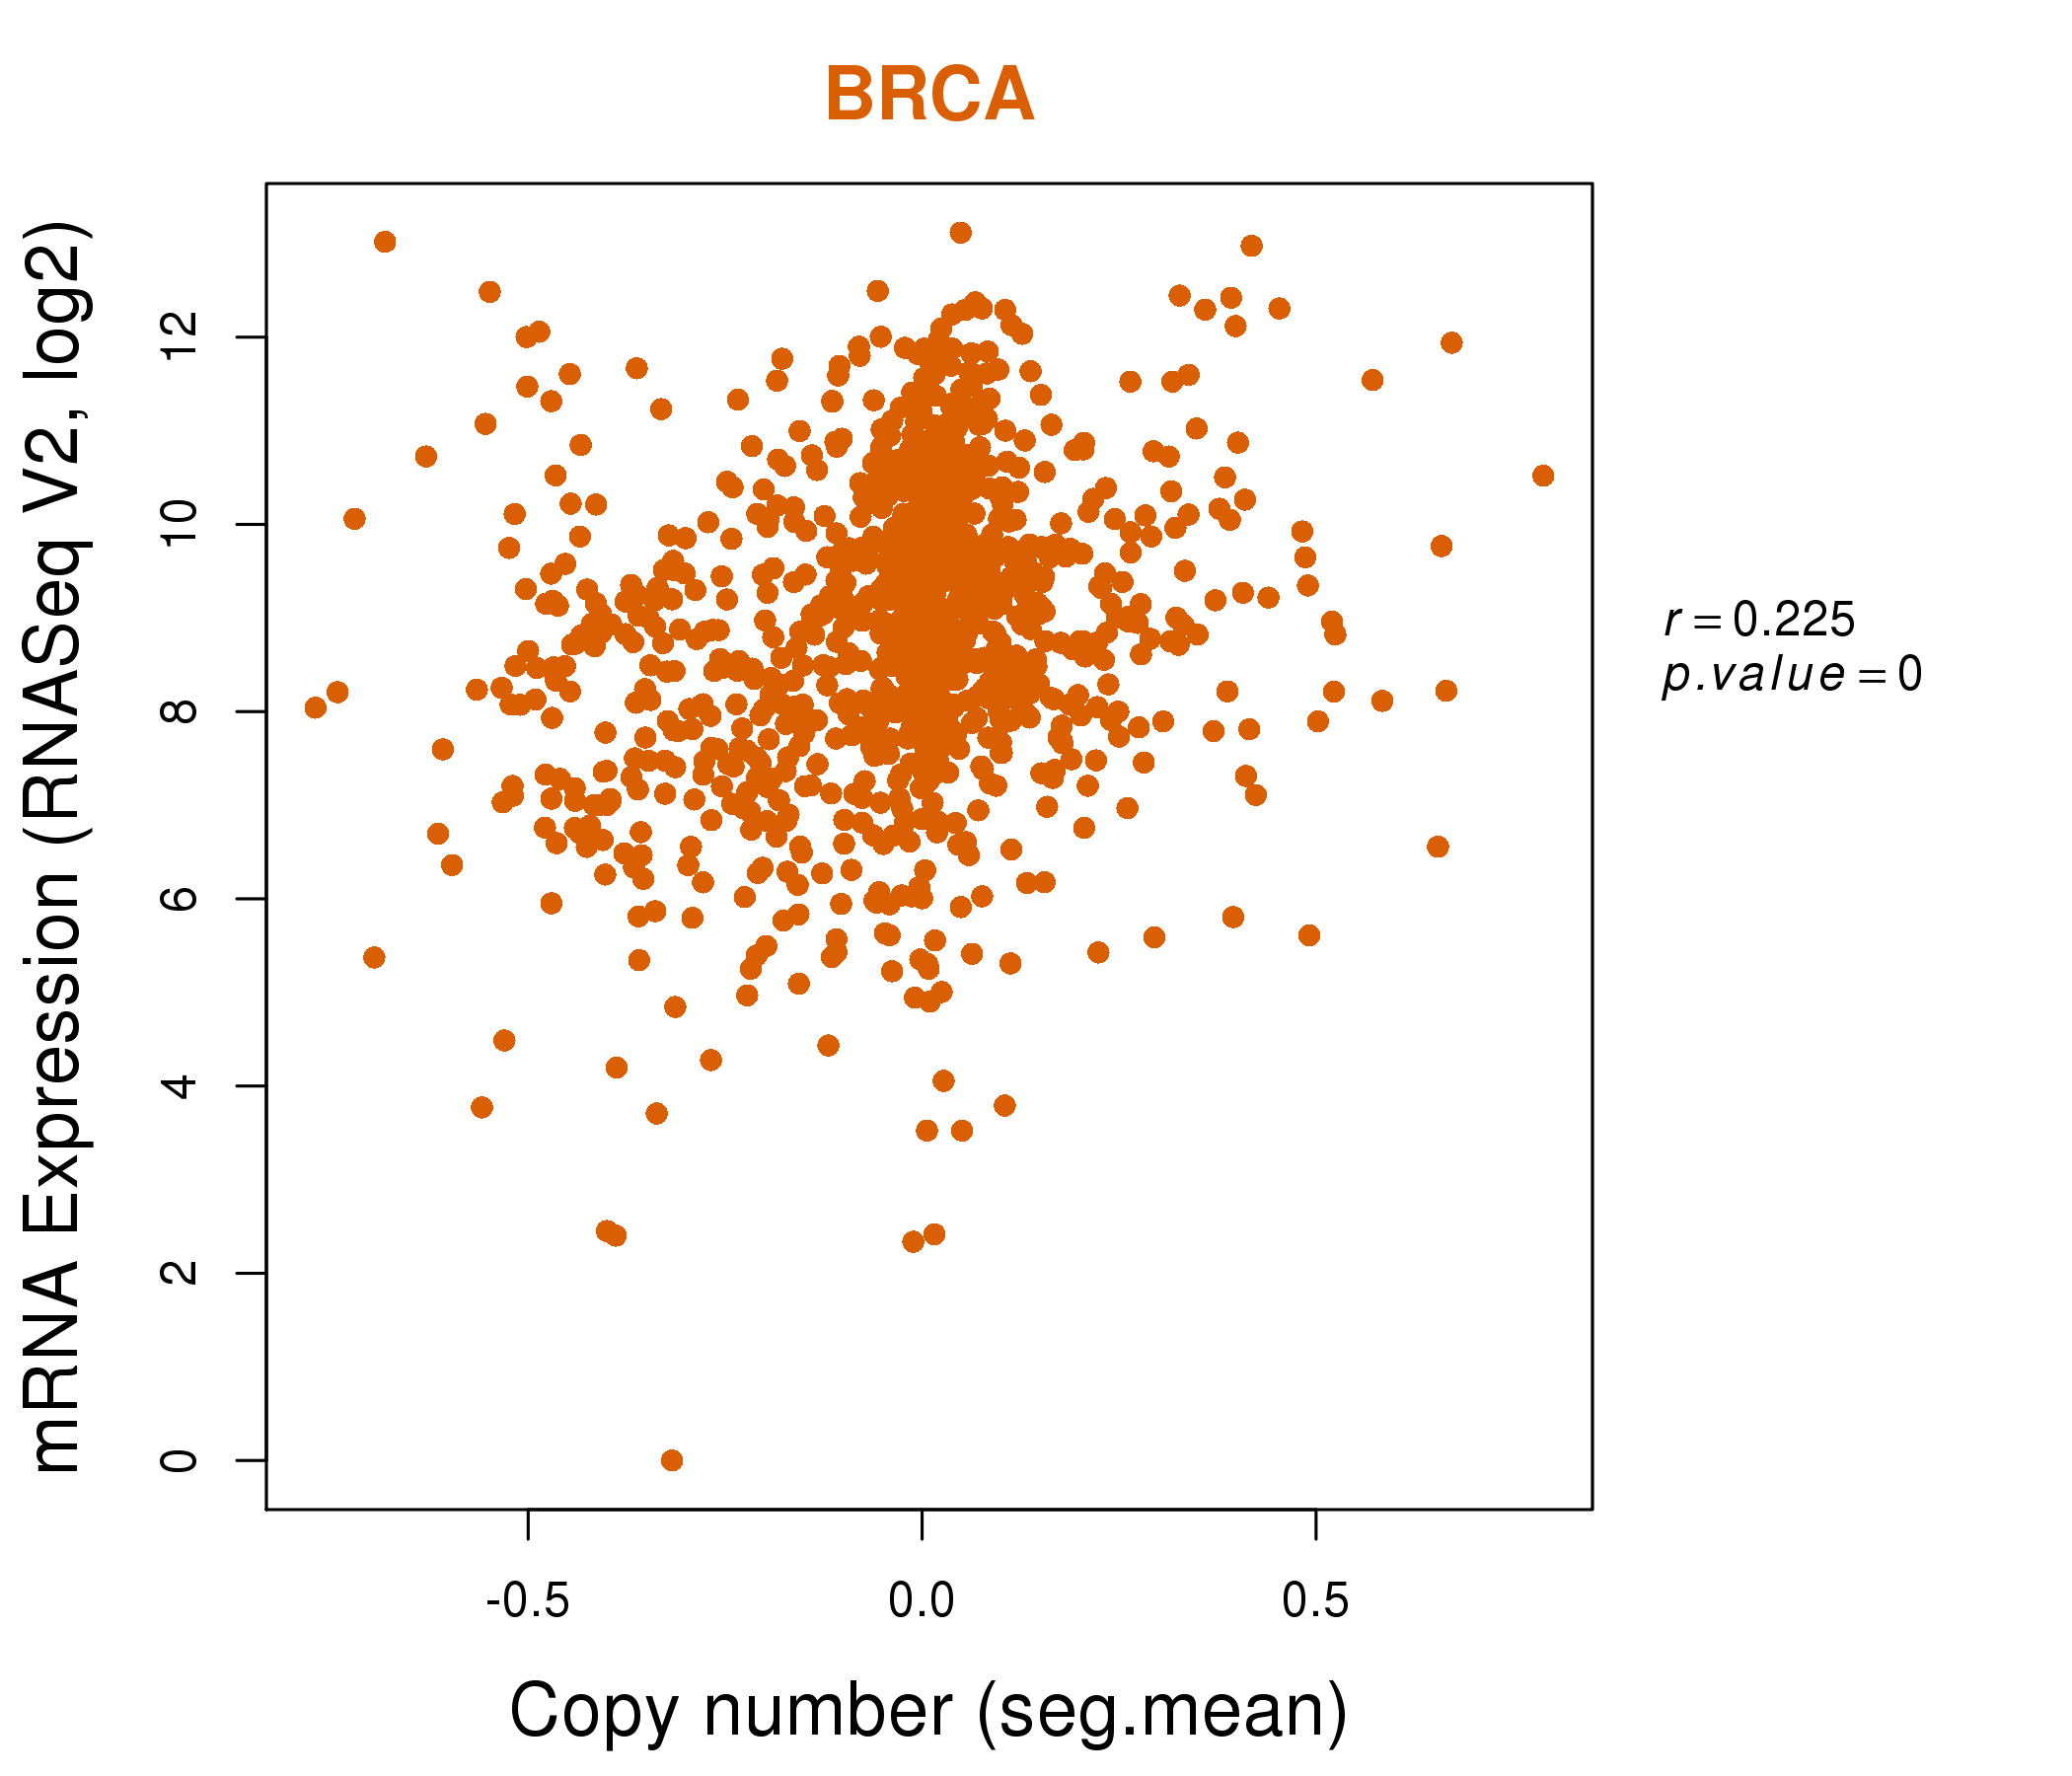
| * This plots show the correlation between CNV and gene expression. |
: Open all plots for all cancer types
 |
|
 |
|

| Top |
| Gene-Gene Network Information |
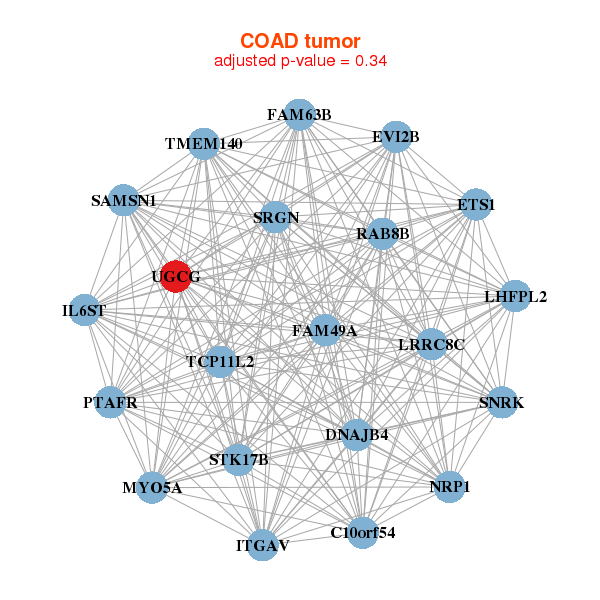
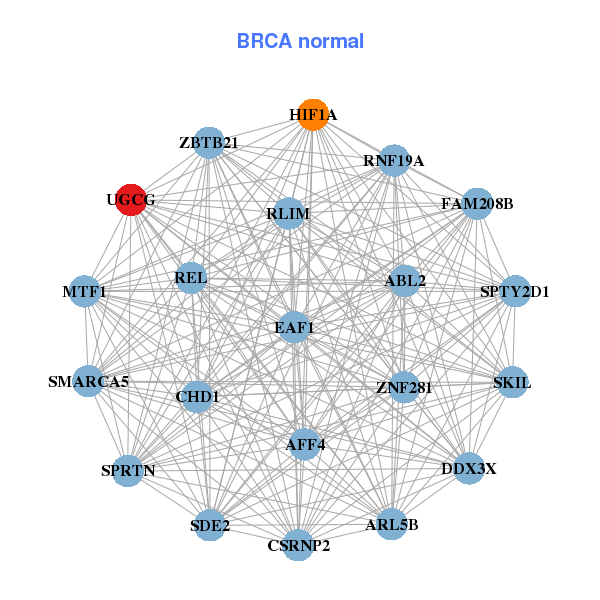
| * Co-Expression network figures were drawn using R package igraph. Only the top 20 genes with the highest correlations were shown. Red circle: input gene, orange circle: cell metabolism gene, sky circle: other gene |
: Open all plots for all cancer types
 |
|
| AFF3,BTBD8,CREBRF,CPEB4,CSNK1G3,FAM73A,FNIP1, KIAA1107,KIAA1109,KLHL11,LRBA,MED13L,MKL2,PRLR, RASEF,SYTL4,TBC1D9,THSD4,TRPS1,UGCG,WDR19 | ABL2,AFF4,ARL5B,FAM208B,SPRTN,SDE2,CHD1, CSRNP2,DDX3X,EAF1,HIF1A,MTF1,REL,RLIM, RNF19A,SKIL,SMARCA5,SPTY2D1,UGCG,ZNF281,ZBTB21 |
 |
|
| C10orf54,DNAJB4,ETS1,EVI2B,FAM49A,FAM63B,IL6ST, ITGAV,LHFPL2,LRRC8C,MYO5A,NRP1,PTAFR,RAB8B, SAMSN1,SNRK,SRGN,STK17B,TCP11L2,TMEM140,UGCG | ADIPOR2,AP1AR,CEBPG,CLRN3,CXADR,ERBB2IP,GCOM1, KALRN,KIAA0247,LNX2,MAP3K2,MAPK6,MPP5,SLC51B, PRR13,RIOK3,SLC2A13,TMEM135,TUBAL3,UGCG,ZDHHC21 |
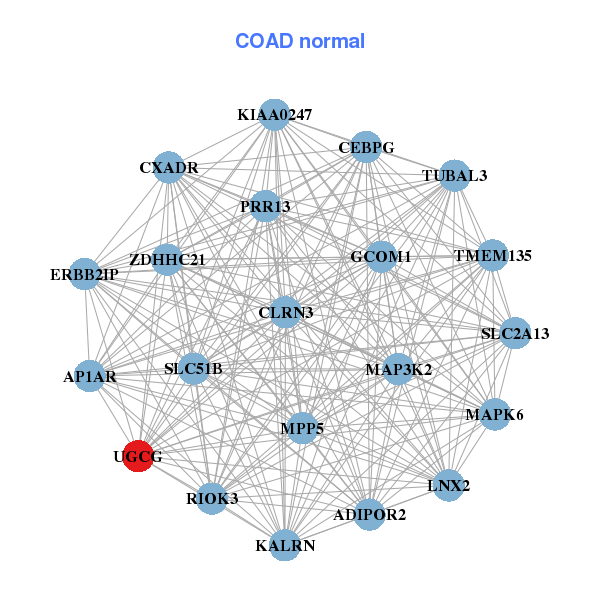
| * Co-Expression network figures were drawn using R package igraph. Only the top 20 genes with the highest correlations were shown. Red circle: input gene, orange circle: cell metabolism gene, sky circle: other gene |
: Open all plots for all cancer types
| Top |
: Open all interacting genes' information including KEGG pathway for all interacting genes from DAVID
| Top |
| Pharmacological Information for UGCG |
| There's no related Drug. |
| Top |
| Cross referenced IDs for UGCG |
| * We obtained these cross-references from Uniprot database. It covers 150 different DBs, 18 categories. http://www.uniprot.org/help/cross_references_section |
: Open all cross reference information
|
Copyright © 2016-Present - The Univsersity of Texas Health Science Center at Houston @ |