|
||||||||||||||||||||||||||||||||||||||||||||||||||||||||||||||||||||||||||||||||||||||||||||||||||||||||||||||||||||||||||||||||||||||||||||||||||||||||||||||||||||||||||||||||||||||||||||||||||||||||||||||||||||||||||||||||||||||||||||||||||||||||||||||||||||||||||||||||||||||||||||||||||||||||||||||||||||||||||
| |
| Phenotypic Information (metabolism pathway, cancer, disease, phenome) |
| |
| |
| Gene-Gene Network Information: Co-Expression Network, Interacting Genes & KEGG |
| |
|


| Gene Summary for UGT8 |
| Basic gene info. | Gene symbol | UGT8 |
| Gene name | UDP glycosyltransferase 8 | |
| Synonyms | CGT|UGT4 | |
| Cytomap | UCSC genome browser: 4q26 | |
| Genomic location | chr4 :115543522-115598202 | |
| Type of gene | protein-coding | |
| RefGenes | NM_001128174.1, NM_003360.3, | |
| Ensembl id | ENSG00000174607 | |
| Description | 2-hydroxyacylsphingosine 1-beta-galactosyltransferaseUDP-galactose ceramide galactosyltransferaseUDP-galactose-ceramide galactosyltransferaseceramide UDP-galactosyltransferasecerebroside synthaseuridine diphosphate glycosyltransferase 8 | |
| Modification date | 20141207 | |
| dbXrefs | MIM : 601291 | |
| HGNC : HGNC | ||
| Ensembl : ENSG00000174607 | ||
| HPRD : 03186 | ||
| Vega : OTTHUMG00000132915 | ||
| Protein | UniProt: go to UniProt's Cross Reference DB Table | |
| Expression | CleanEX: HS_UGT8 | |
| BioGPS: 7368 | ||
| Gene Expression Atlas: ENSG00000174607 | ||
| The Human Protein Atlas: ENSG00000174607 | ||
| Pathway | NCI Pathway Interaction Database: UGT8 | |
| KEGG: UGT8 | ||
| REACTOME: UGT8 | ||
| ConsensusPathDB | ||
| Pathway Commons: UGT8 | ||
| Metabolism | MetaCyc: UGT8 | |
| HUMANCyc: UGT8 | ||
| Regulation | Ensembl's Regulation: ENSG00000174607 | |
| miRBase: chr4 :115,543,522-115,598,202 | ||
| TargetScan: NM_001128174 | ||
| cisRED: ENSG00000174607 | ||
| Context | iHOP: UGT8 | |
| cancer metabolism search in PubMed: UGT8 | ||
| UCL Cancer Institute: UGT8 | ||
| Assigned class in ccmGDB | C | |
| Top |
| Phenotypic Information for UGT8(metabolism pathway, cancer, disease, phenome) |
| Cancer | CGAP: UGT8 |
| Familial Cancer Database: UGT8 | |
| * This gene is included in those cancer gene databases. |
|
|
|
|
|
| . | ||||||||||||||||||||||||||||||||||||||||||||||||||||||||||||||||||||||||||||||||||||||||||||||||||||||||||||||||||||||||||||||||||||||||||||||||||||||||||||||||||||||||||||||||||||||||||||||||||||||||||||||||||||||||||||||||||||||||||||||||||||||||||||||||||||||||||||||||||||||||||||||||||||||||||||||||||||
Oncogene 1 | Significant driver gene in | |||||||||||||||||||||||||||||||||||||||||||||||||||||||||||||||||||||||||||||||||||||||||||||||||||||||||||||||||||||||||||||||||||||||||||||||||||||||||||||||||||||||||||||||||||||||||||||||||||||||||||||||||||||||||||||||||||||||||||||||||||||||||||||||||||||||||||||||||||||||||||||||||||||||||||||||||||||||||
| cf) number; DB name 1 Oncogene; http://nar.oxfordjournals.org/content/35/suppl_1/D721.long, 2 Tumor Suppressor gene; https://bioinfo.uth.edu/TSGene/, 3 Cancer Gene Census; http://www.nature.com/nrc/journal/v4/n3/abs/nrc1299.html, 4 CancerGenes; http://nar.oxfordjournals.org/content/35/suppl_1/D721.long, 5 Network of Cancer Gene; http://ncg.kcl.ac.uk/index.php, 1Therapeutic Vulnerabilities in Cancer; http://cbio.mskcc.org/cancergenomics/statius/ |
| KEGG_SPHINGOLIPID_METABOLISM | |
| OMIM | |
| Orphanet | |
| Disease | KEGG Disease: UGT8 |
| MedGen: UGT8 (Human Medical Genetics with Condition) | |
| ClinVar: UGT8 | |
| Phenotype | MGI: UGT8 (International Mouse Phenotyping Consortium) |
| PhenomicDB: UGT8 | |
| Mutations for UGT8 |
| * Under tables are showing count per each tissue to give us broad intuition about tissue specific mutation patterns.You can go to the detailed page for each mutation database's web site. |
| There's no structural variation information in COSMIC data for this gene. |
| * From mRNA Sanger sequences, Chitars2.0 arranged chimeric transcripts. This table shows UGT8 related fusion information. |
| ID | Head Gene | Tail Gene | Accession | Gene_a | qStart_a | qEnd_a | Chromosome_a | tStart_a | tEnd_a | Gene_a | qStart_a | qEnd_a | Chromosome_a | tStart_a | tEnd_a |
| Top |
| Mutation type/ Tissue ID | brca | cns | cerv | endome | haematopo | kidn | Lintest | liver | lung | ns | ovary | pancre | prost | skin | stoma | thyro | urina | |||
| Total # sample | 1 | 1 | ||||||||||||||||||
| GAIN (# sample) | ||||||||||||||||||||
| LOSS (# sample) | 1 | 1 |
| cf) Tissue ID; Tissue type (1; Breast, 2; Central_nervous_system, 3; Cervix, 4; Endometrium, 5; Haematopoietic_and_lymphoid_tissue, 6; Kidney, 7; Large_intestine, 8; Liver, 9; Lung, 10; NS, 11; Ovary, 12; Pancreas, 13; Prostate, 14; Skin, 15; Stomach, 16; Thyroid, 17; Urinary_tract) |
| Top |
|
 |
| Top |
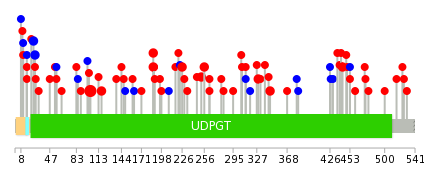
| Stat. for Non-Synonymous SNVs (# total SNVs=66) | (# total SNVs=14) |
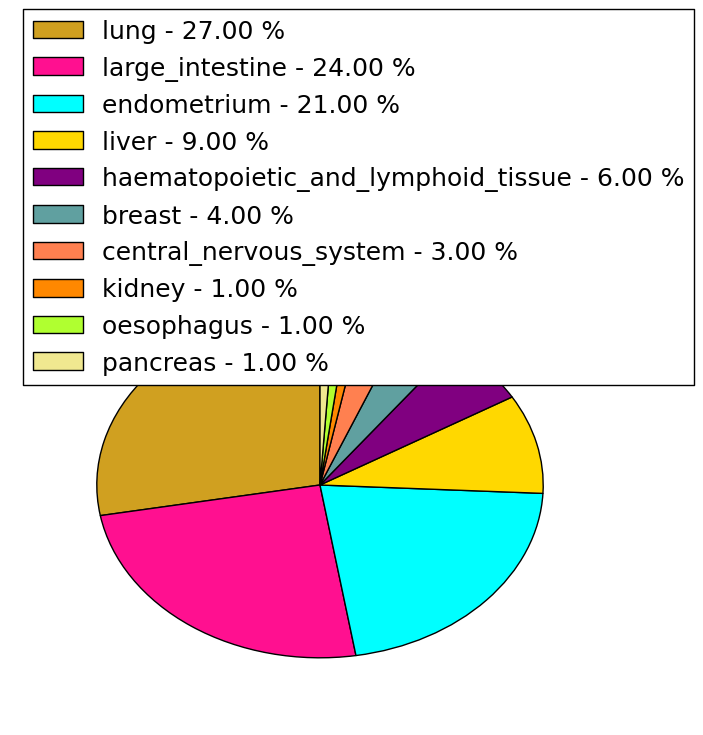 | 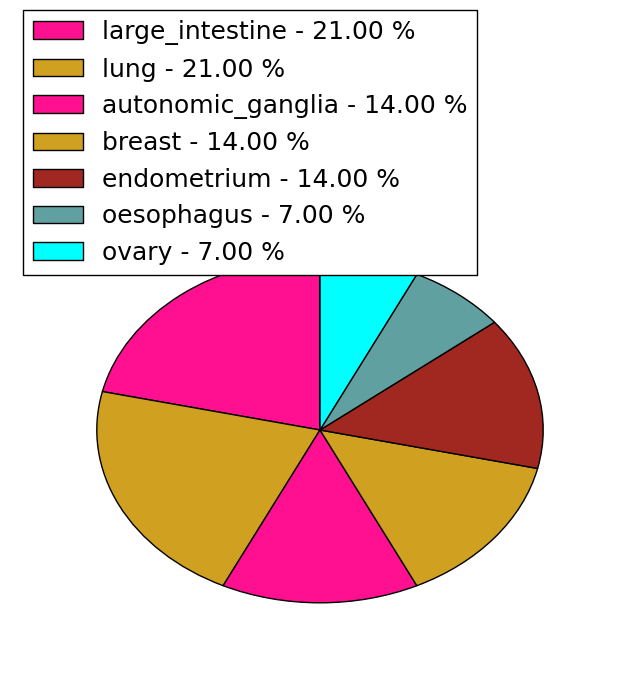 |
(# total SNVs=3) | (# total SNVs=1) |
 | 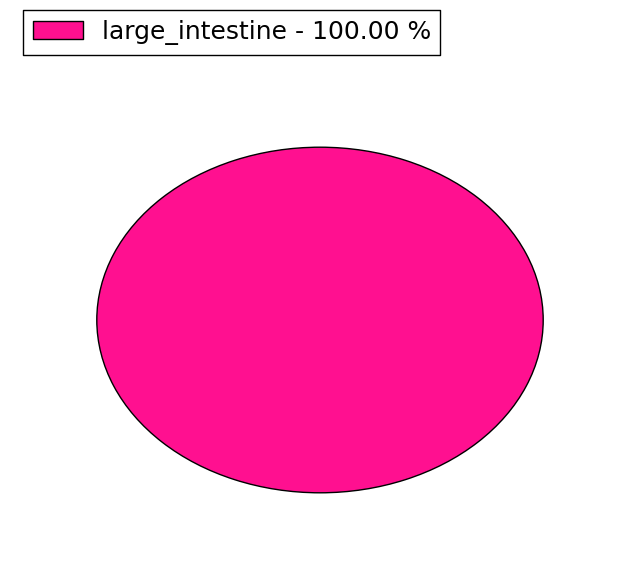 |
| Top |
| * When you move the cursor on each content, you can see more deailed mutation information on the Tooltip. Those are primary_site,primary_histology,mutation(aa),pubmedID. |
| GRCh37 position | Mutation(aa) | Unique sampleID count |
| chr4:115544340-115544340 | p.E102K | 8 |
| chr4:115544117-115544117 | p.P27P | 2 |
| chr4:115544803-115544803 | p.P256R | 2 |
| chr4:115586857-115586857 | p.K329N | 2 |
| chr4:115544387-115544387 | p.M117I | 2 |
| chr4:115586903-115586903 | p.D345N | 2 |
| chr4:115544713-115544713 | p.P226L | 2 |
| chr4:115544595-115544595 | p.R187C | 2 |
| chr4:115544596-115544596 | p.R187H | 2 |
| chr4:115585262-115585262 | p.L312M | 2 |
| Top |
|
 |
| Point Mutation/ Tissue ID | 1 | 2 | 3 | 4 | 5 | 6 | 7 | 8 | 9 | 10 | 11 | 12 | 13 | 14 | 15 | 16 | 17 | 18 | 19 | 20 |
| # sample | 2 | 1 | 11 | 1 | 1 | 1 | 8 | 5 | 1 | 11 | 5 | 11 | ||||||||
| # mutation | 2 | 1 | 10 | 1 | 1 | 1 | 8 | 6 | 1 | 12 | 5 | 11 | ||||||||
| nonsynonymous SNV | 2 | 8 | 1 | 1 | 6 | 6 | 7 | 4 | 9 | |||||||||||
| synonymous SNV | 1 | 3 | 1 | 2 | 1 | 5 | 1 | 2 |
| cf) Tissue ID; Tissue type (1; BLCA[Bladder Urothelial Carcinoma], 2; BRCA[Breast invasive carcinoma], 3; CESC[Cervical squamous cell carcinoma and endocervical adenocarcinoma], 4; COAD[Colon adenocarcinoma], 5; GBM[Glioblastoma multiforme], 6; Glioma Low Grade, 7; HNSC[Head and Neck squamous cell carcinoma], 8; KICH[Kidney Chromophobe], 9; KIRC[Kidney renal clear cell carcinoma], 10; KIRP[Kidney renal papillary cell carcinoma], 11; LAML[Acute Myeloid Leukemia], 12; LUAD[Lung adenocarcinoma], 13; LUSC[Lung squamous cell carcinoma], 14; OV[Ovarian serous cystadenocarcinoma ], 15; PAAD[Pancreatic adenocarcinoma], 16; PRAD[Prostate adenocarcinoma], 17; SKCM[Skin Cutaneous Melanoma], 18:STAD[Stomach adenocarcinoma], 19:THCA[Thyroid carcinoma], 20:UCEC[Uterine Corpus Endometrial Carcinoma]) |
| Top |
| * We represented just top 10 SNVs. When you move the cursor on each content, you can see more deailed mutation information on the Tooltip. Those are primary_site, primary_histology, mutation(aa), pubmedID. |
| Genomic Position | Mutation(aa) | Unique sampleID count |
| chr4:115544340 | p.E102K,UGT8 | 6 |
| chr4:115586857 | p.K329K,UGT8 | 3 |
| chr4:115585262 | p.L312M,UGT8 | 2 |
| chr4:115544596 | p.R187H,UGT8 | 2 |
| chr4:115544302 | p.N113I,UGT8 | 1 |
| chr4:115597108 | p.G263R,UGT8 | 1 |
| chr4:115544547 | p.V441D,UGT8 | 1 |
| chr4:115597395 | p.V137L,UGT8 | 1 |
| chr4:115544067 | p.W279L,UGT8 | 1 |
| chr4:115544334 | p.I448T,UGT8 | 1 |
| * Copy number data were extracted from TCGA using R package TCGA-Assembler. The URLs of all public data files on TCGA DCC data server were gathered on Jan-05-2015. Function ProcessCNAData in TCGA-Assembler package was used to obtain gene-level copy number value which is calculated as the average copy number of the genomic region of a gene. |
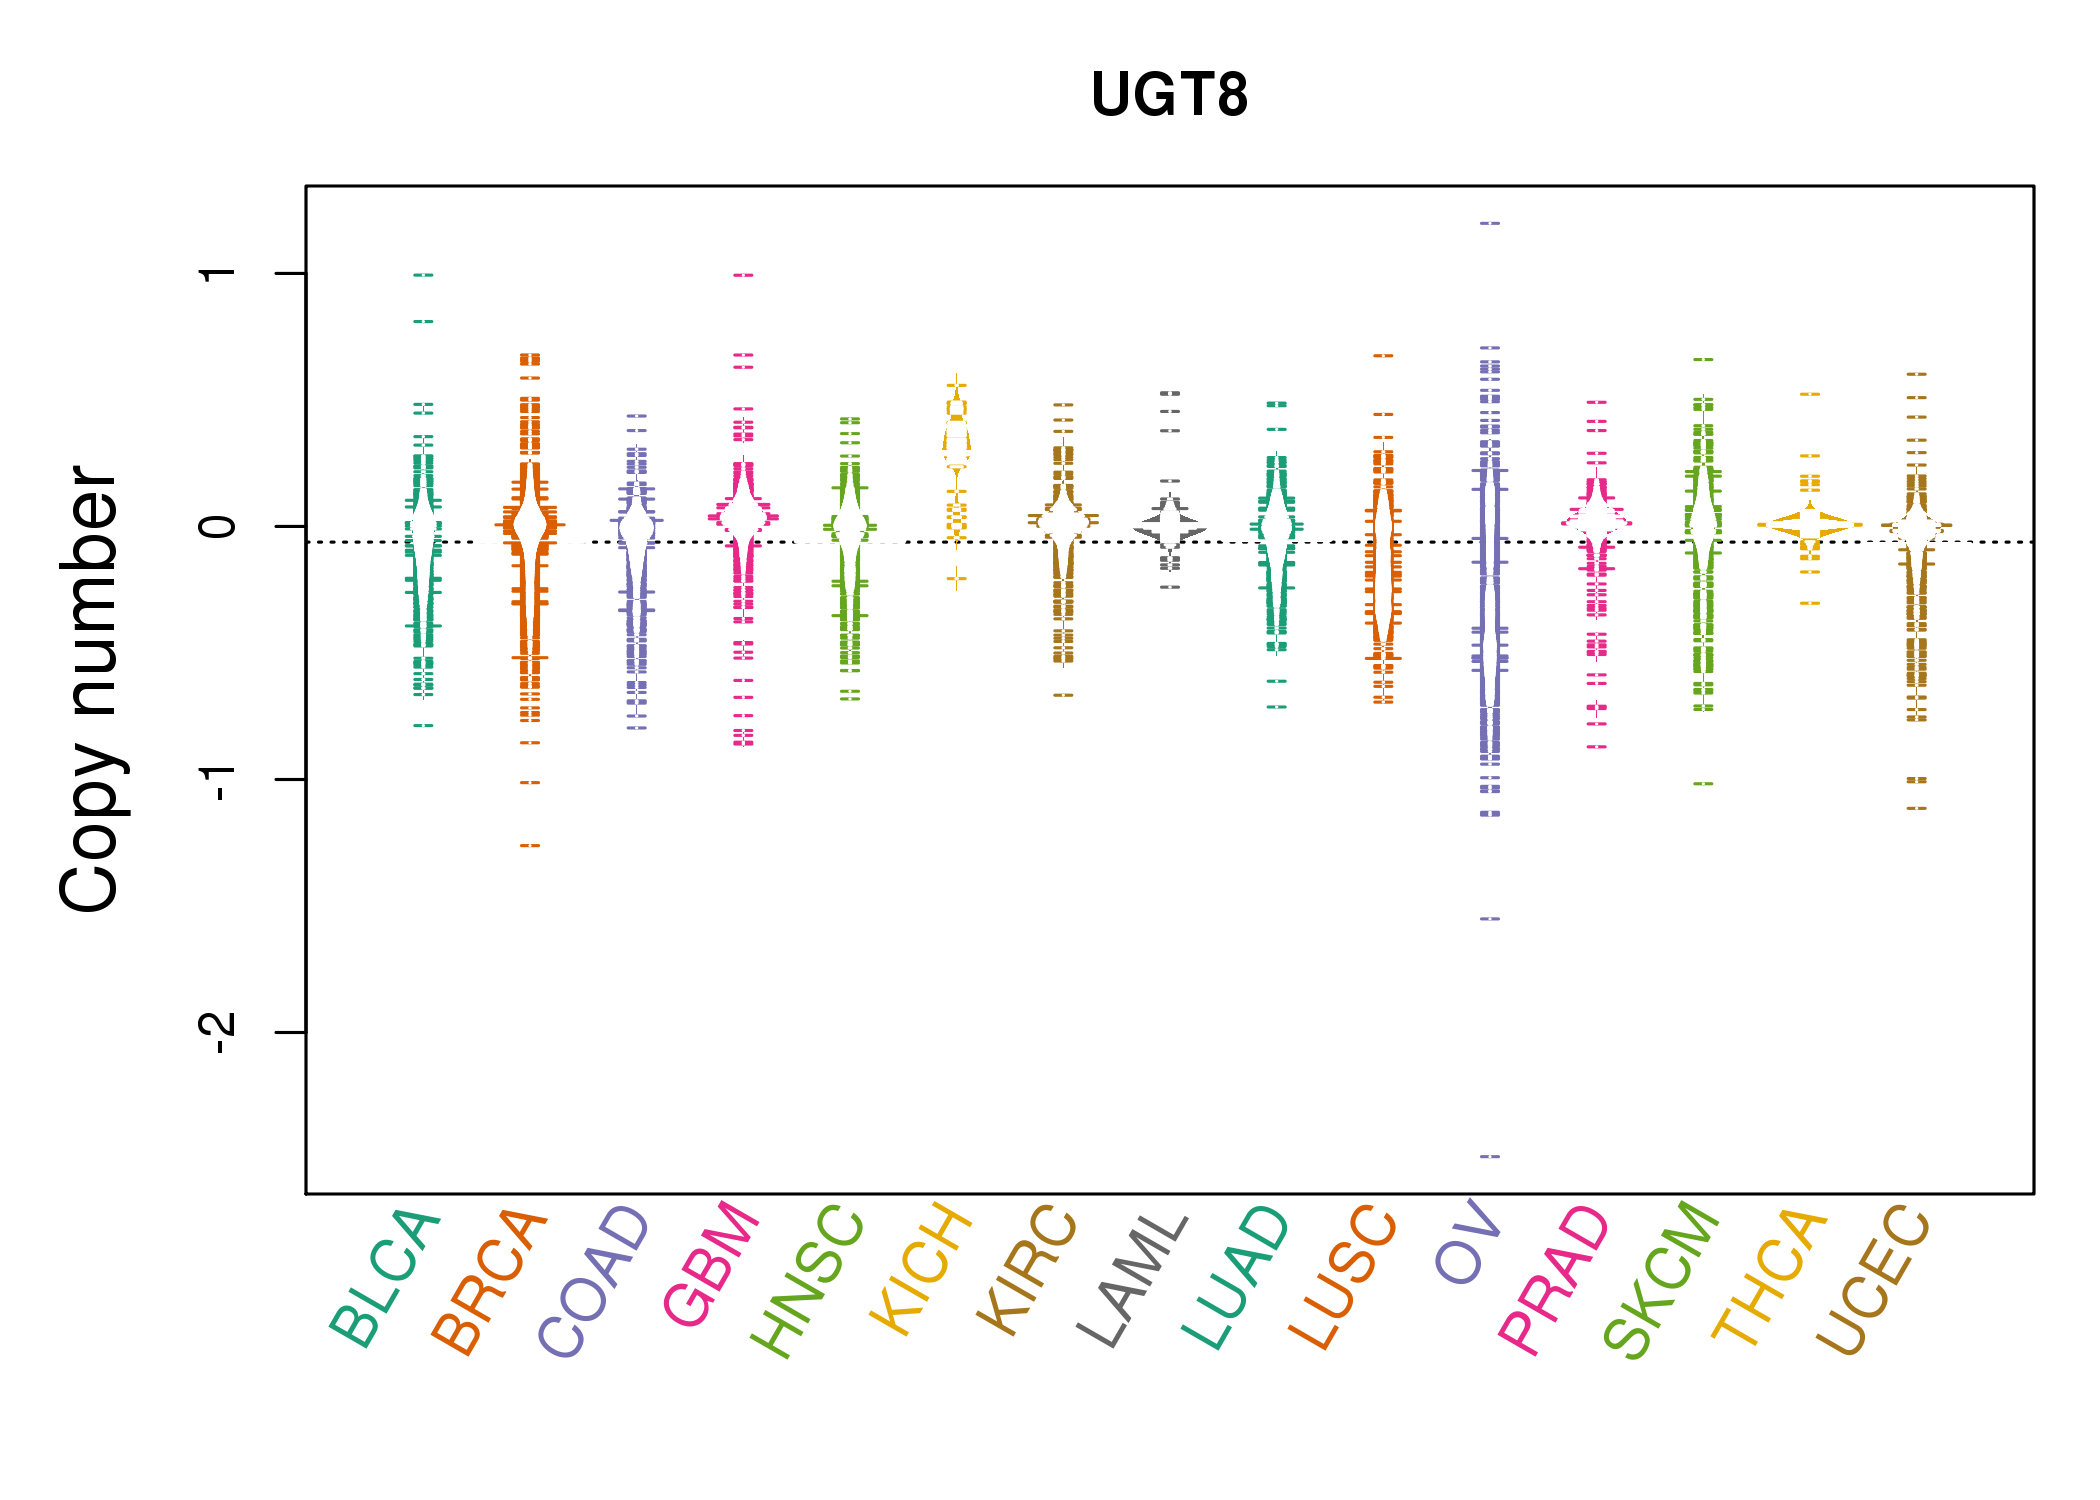 |
| cf) Tissue ID[Tissue type]: BLCA[Bladder Urothelial Carcinoma], BRCA[Breast invasive carcinoma], CESC[Cervical squamous cell carcinoma and endocervical adenocarcinoma], COAD[Colon adenocarcinoma], GBM[Glioblastoma multiforme], Glioma Low Grade, HNSC[Head and Neck squamous cell carcinoma], KICH[Kidney Chromophobe], KIRC[Kidney renal clear cell carcinoma], KIRP[Kidney renal papillary cell carcinoma], LAML[Acute Myeloid Leukemia], LUAD[Lung adenocarcinoma], LUSC[Lung squamous cell carcinoma], OV[Ovarian serous cystadenocarcinoma ], PAAD[Pancreatic adenocarcinoma], PRAD[Prostate adenocarcinoma], SKCM[Skin Cutaneous Melanoma], STAD[Stomach adenocarcinoma], THCA[Thyroid carcinoma], UCEC[Uterine Corpus Endometrial Carcinoma] |
| Top |
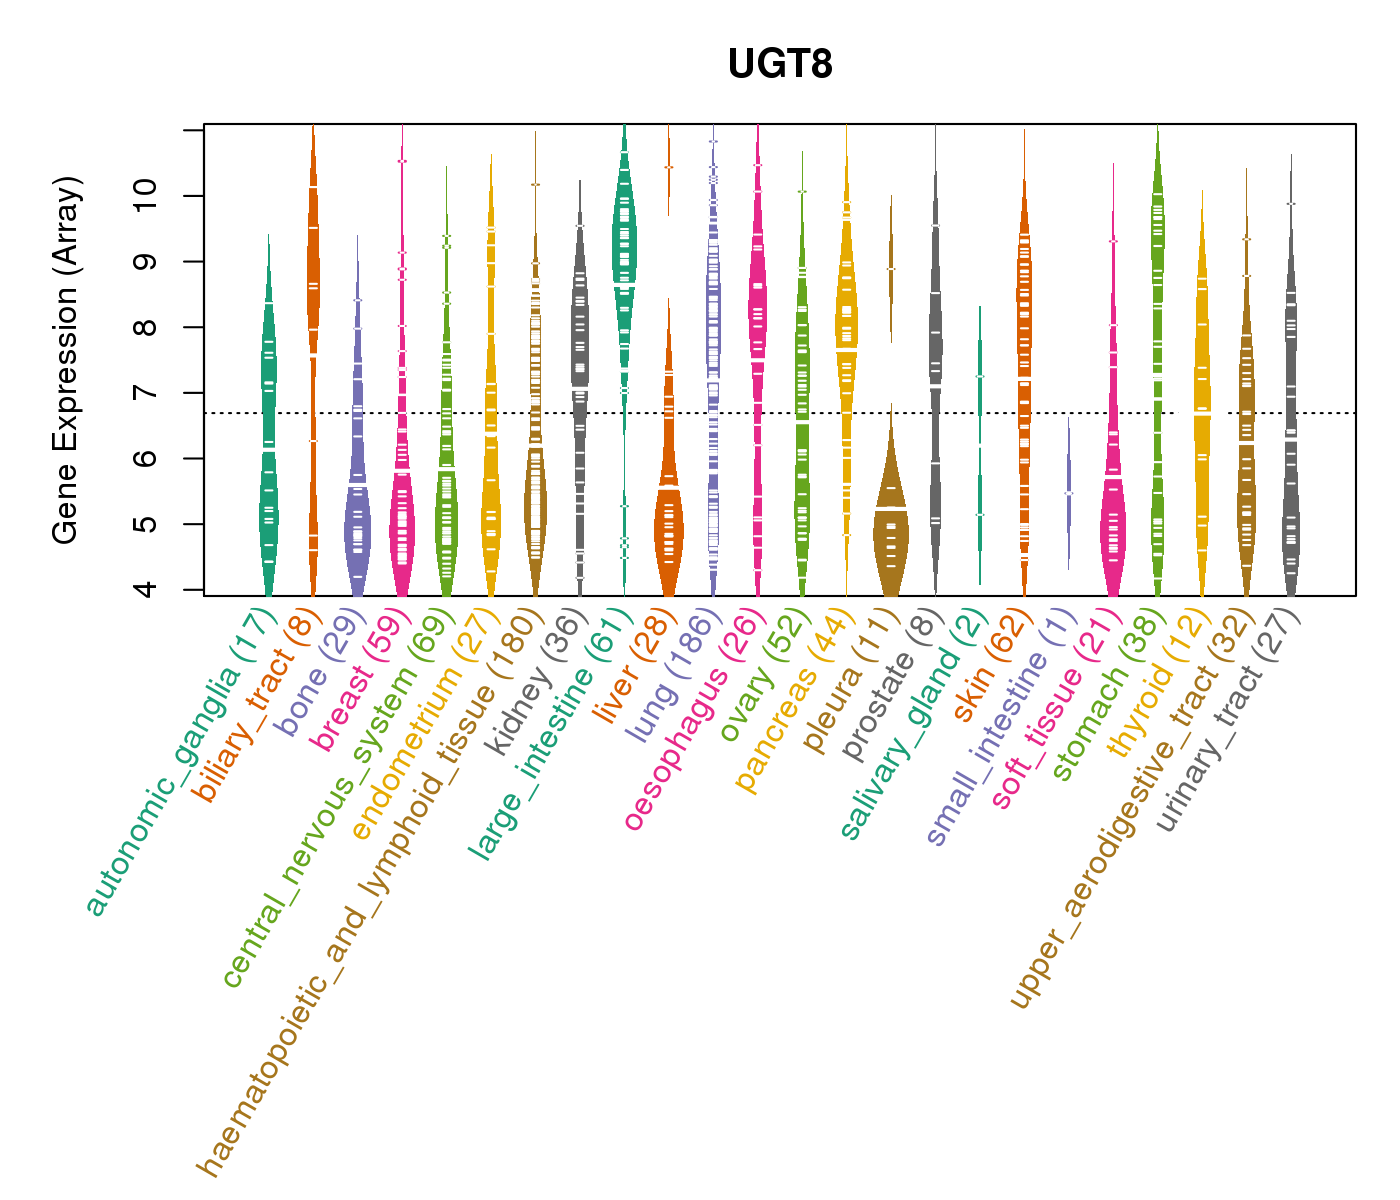
| Gene Expression for UGT8 |
| * CCLE gene expression data were extracted from CCLE_Expression_Entrez_2012-10-18.res: Gene-centric RMA-normalized mRNA expression data. |
 |
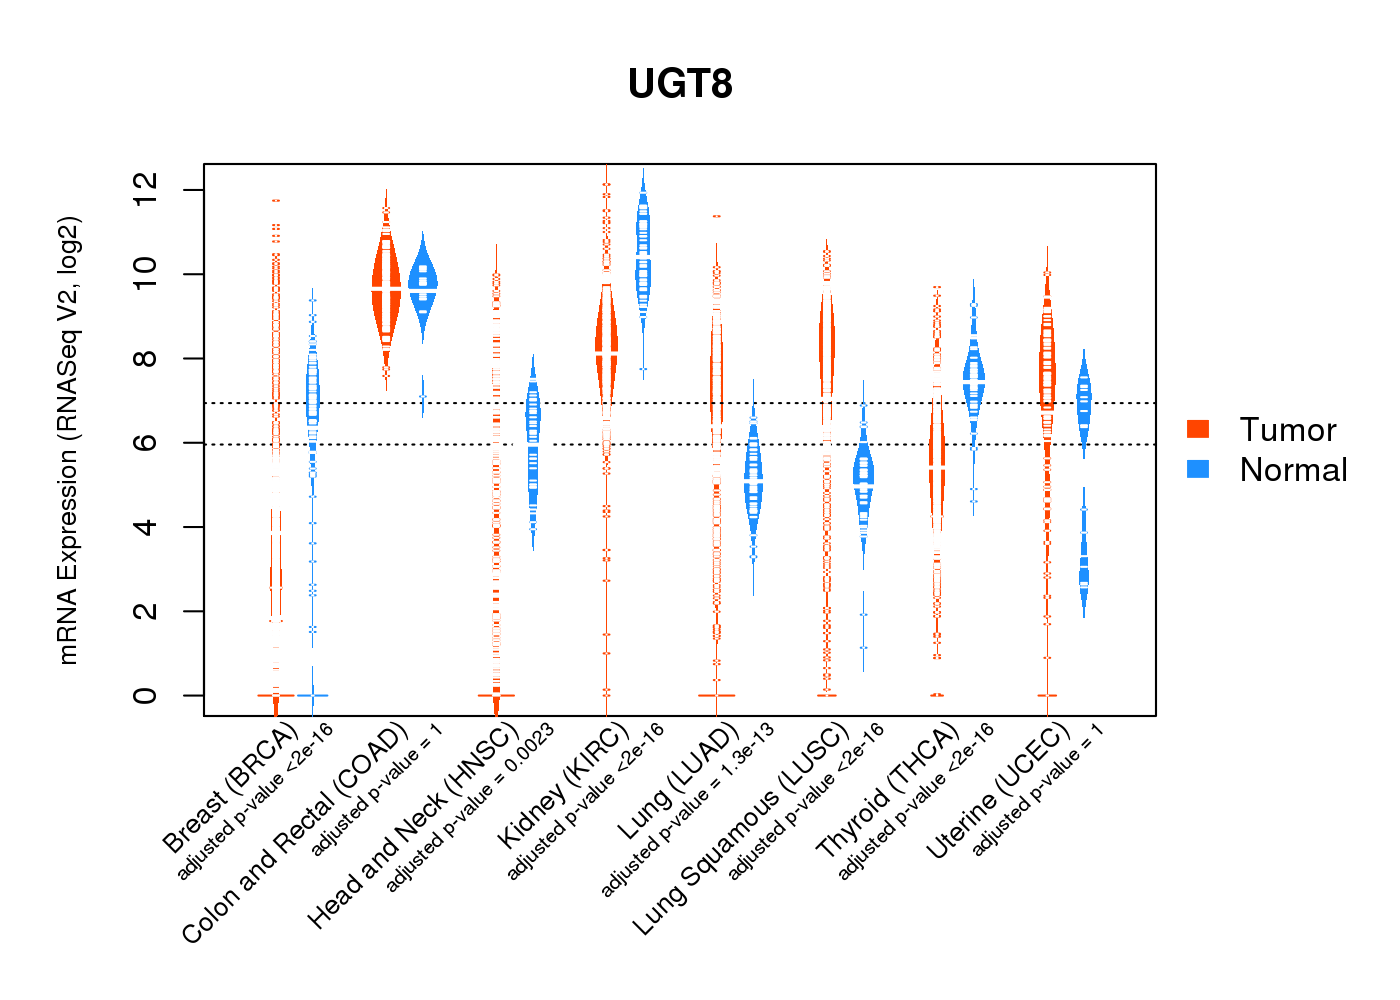
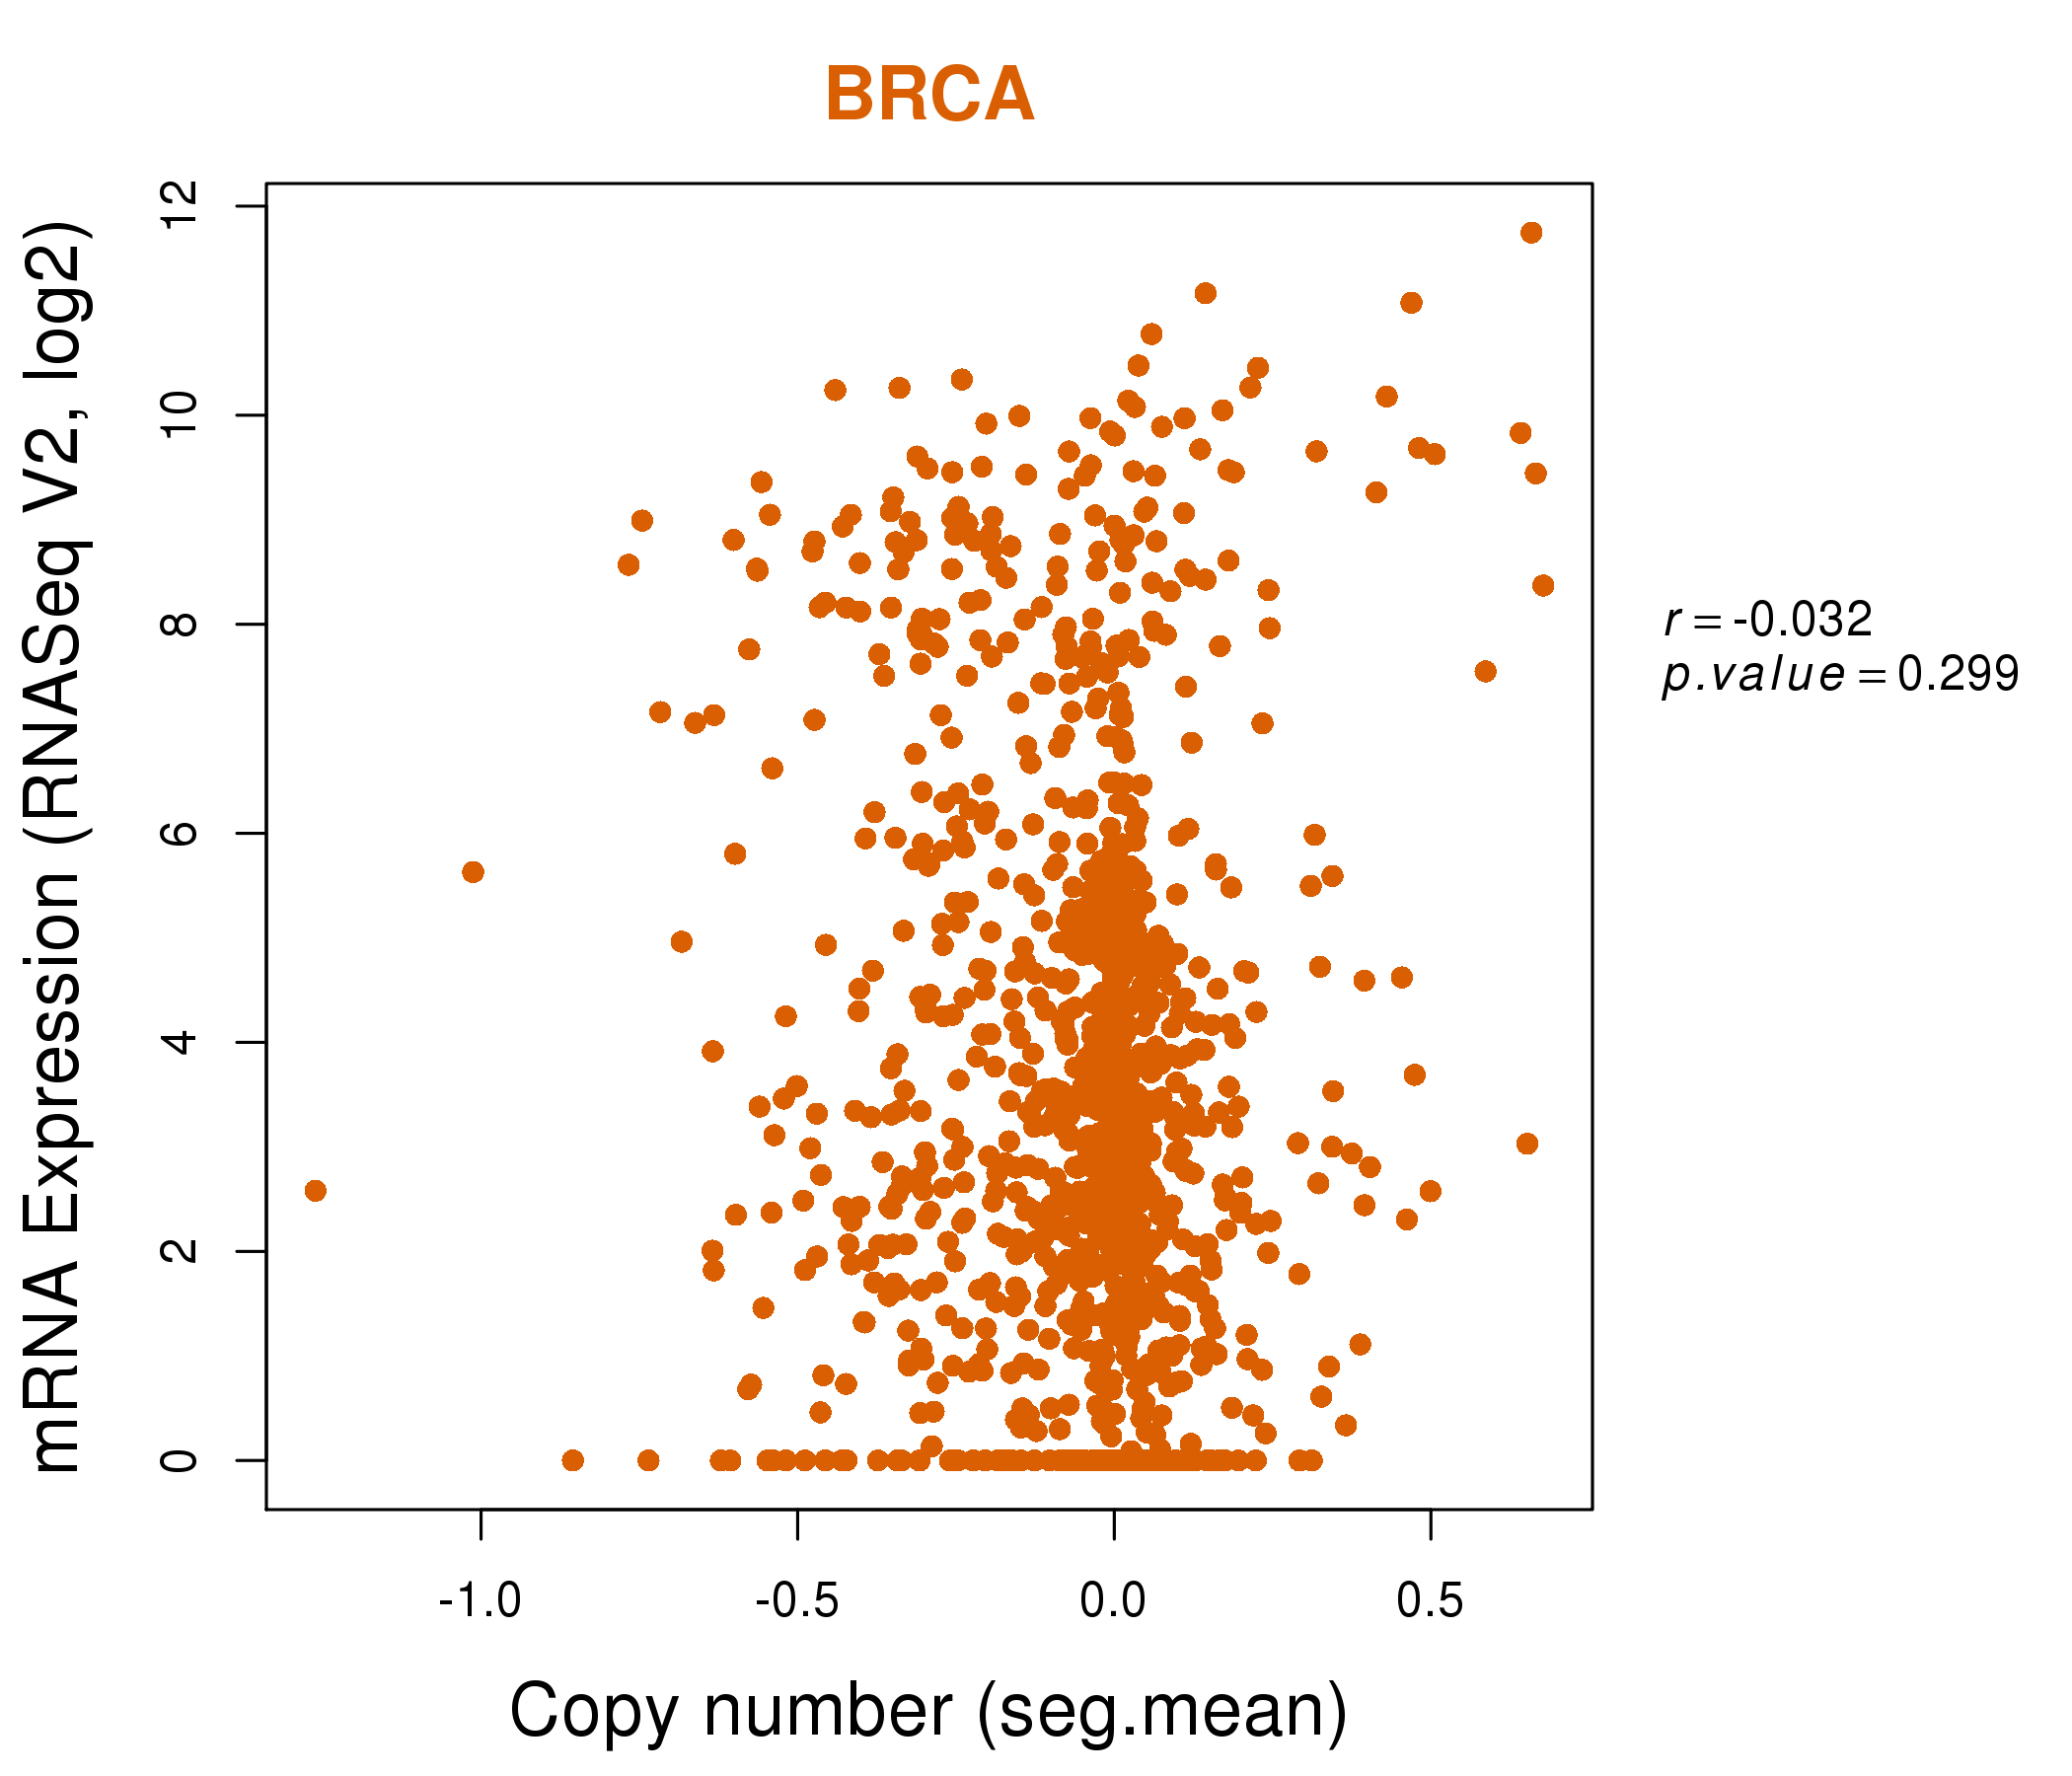
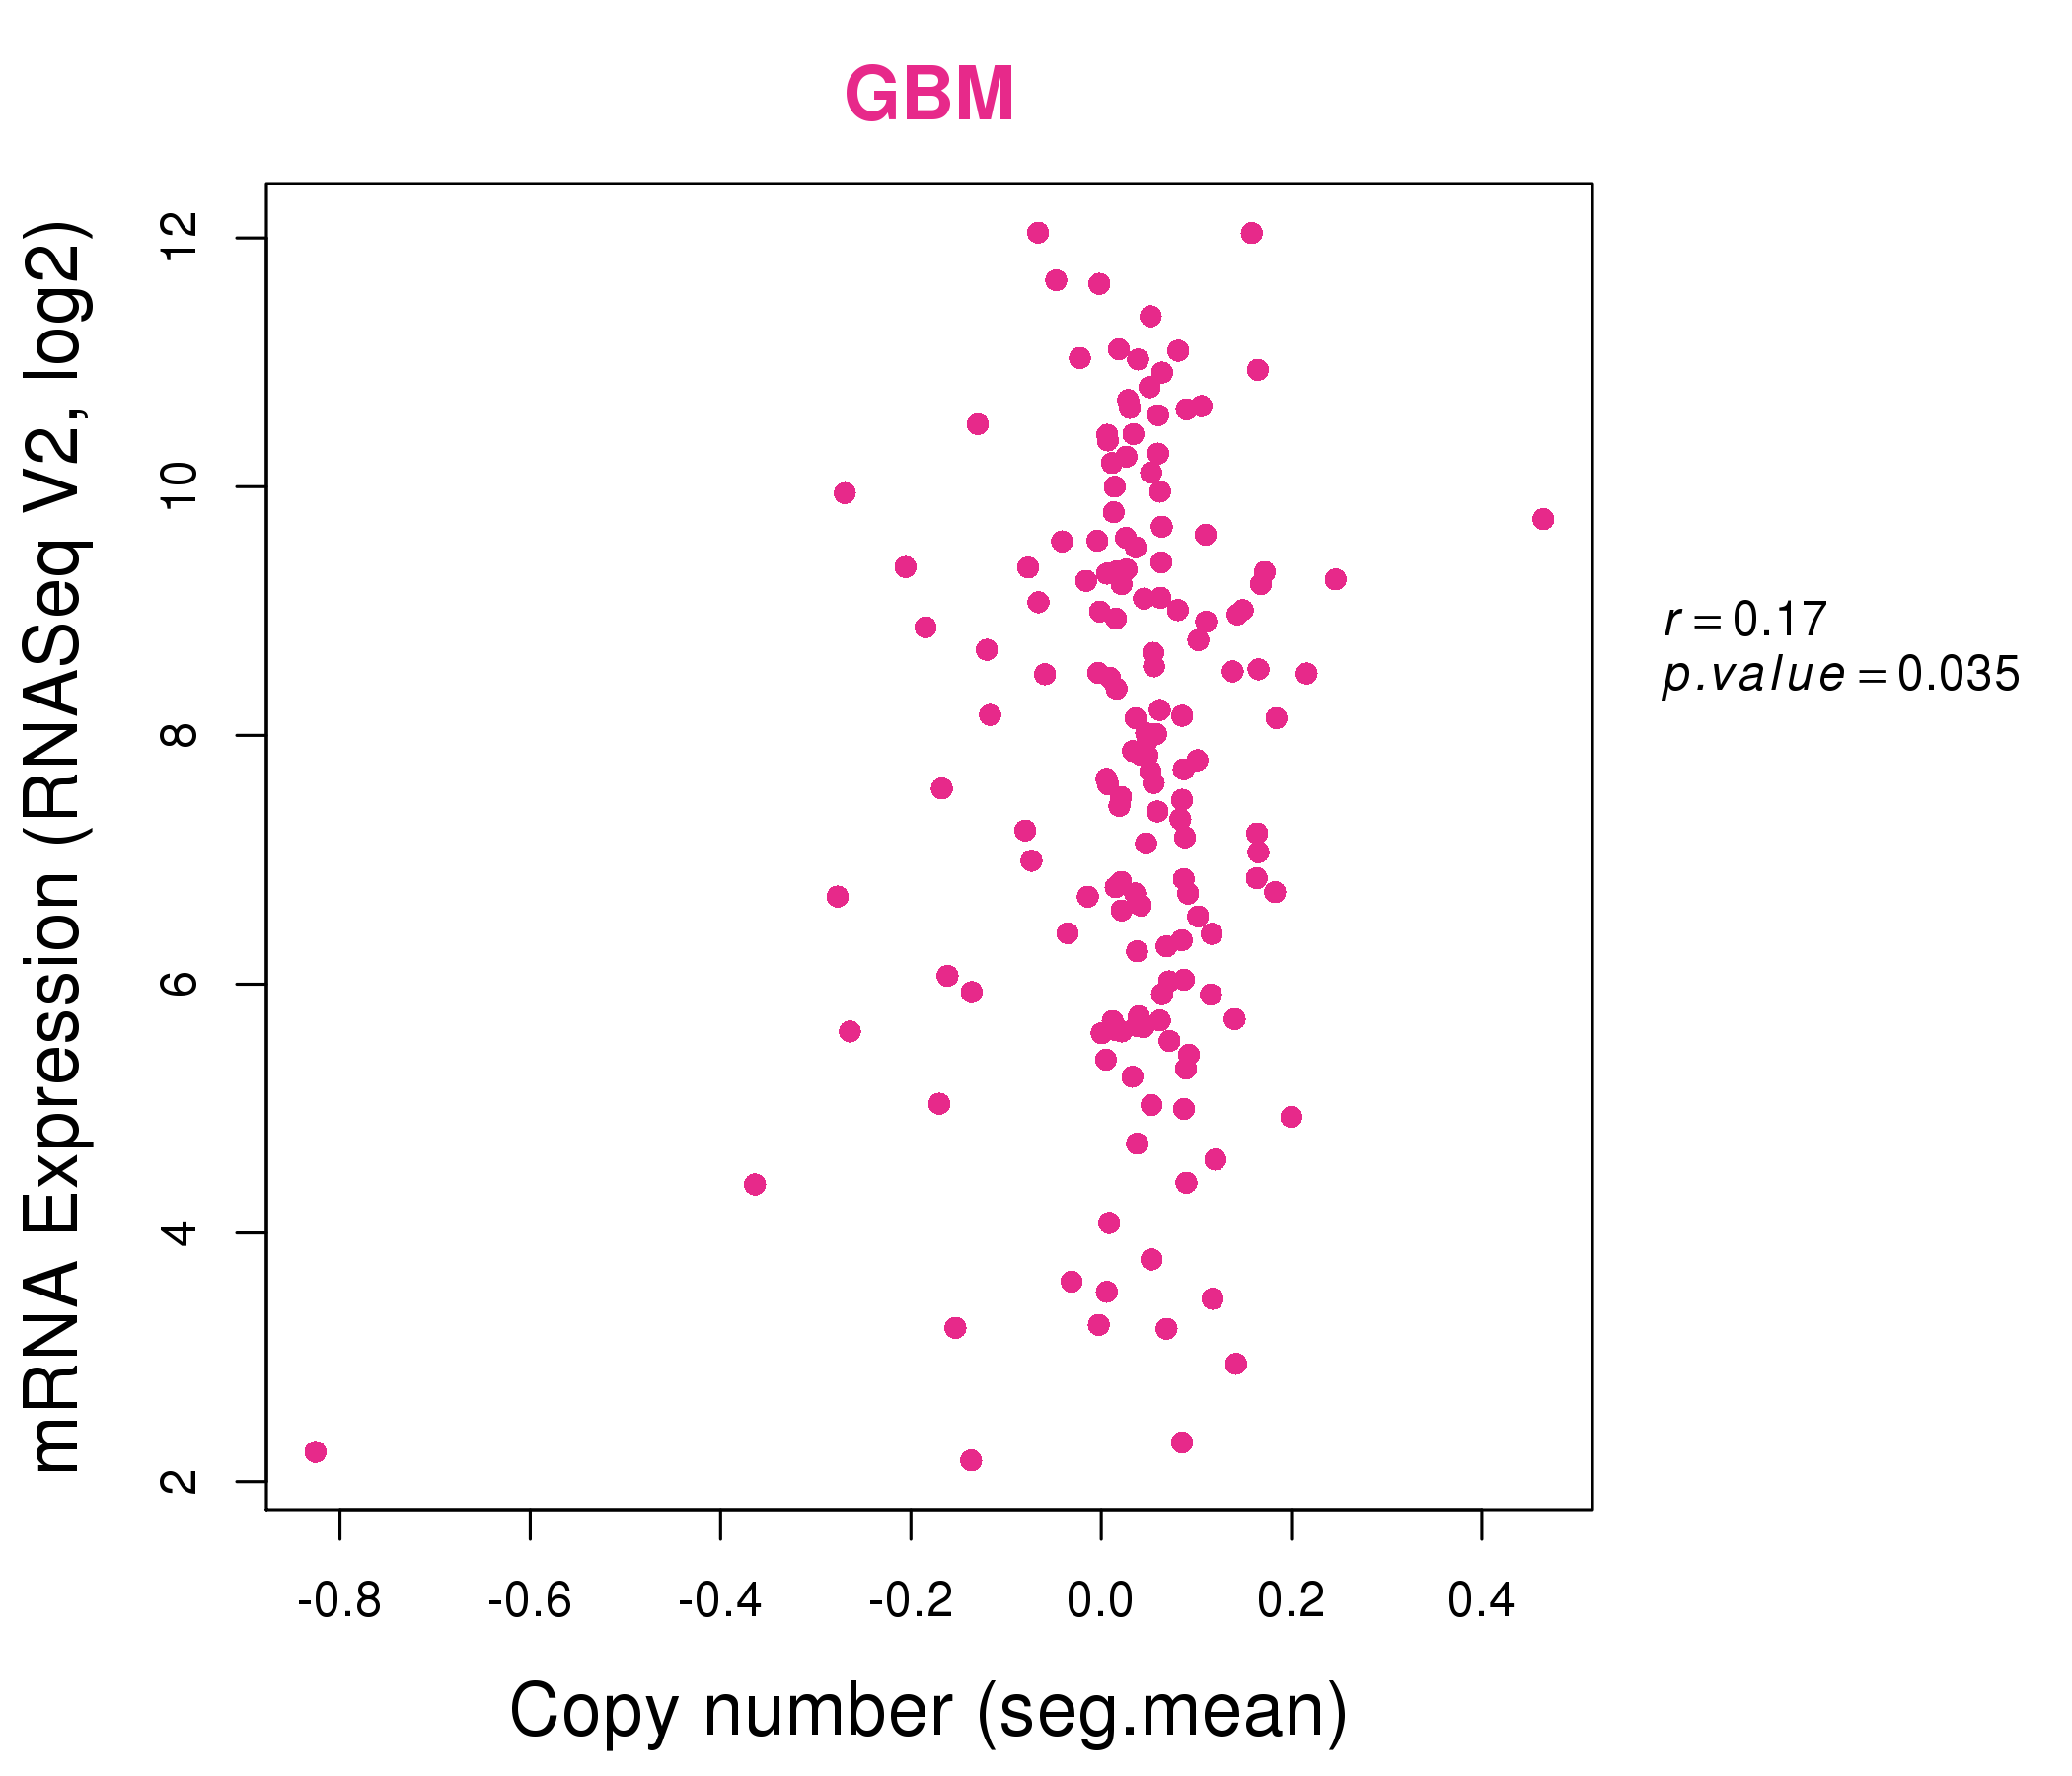
| * Normalized gene expression data of RNASeqV2 was extracted from TCGA using R package TCGA-Assembler. The URLs of all public data files on TCGA DCC data server were gathered at Jan-05-2015. Only eight cancer types have enough normal control samples for differential expression analysis. (t test, adjusted p<0.05 (using Benjamini-Hochberg FDR)) |
 |
| Top |
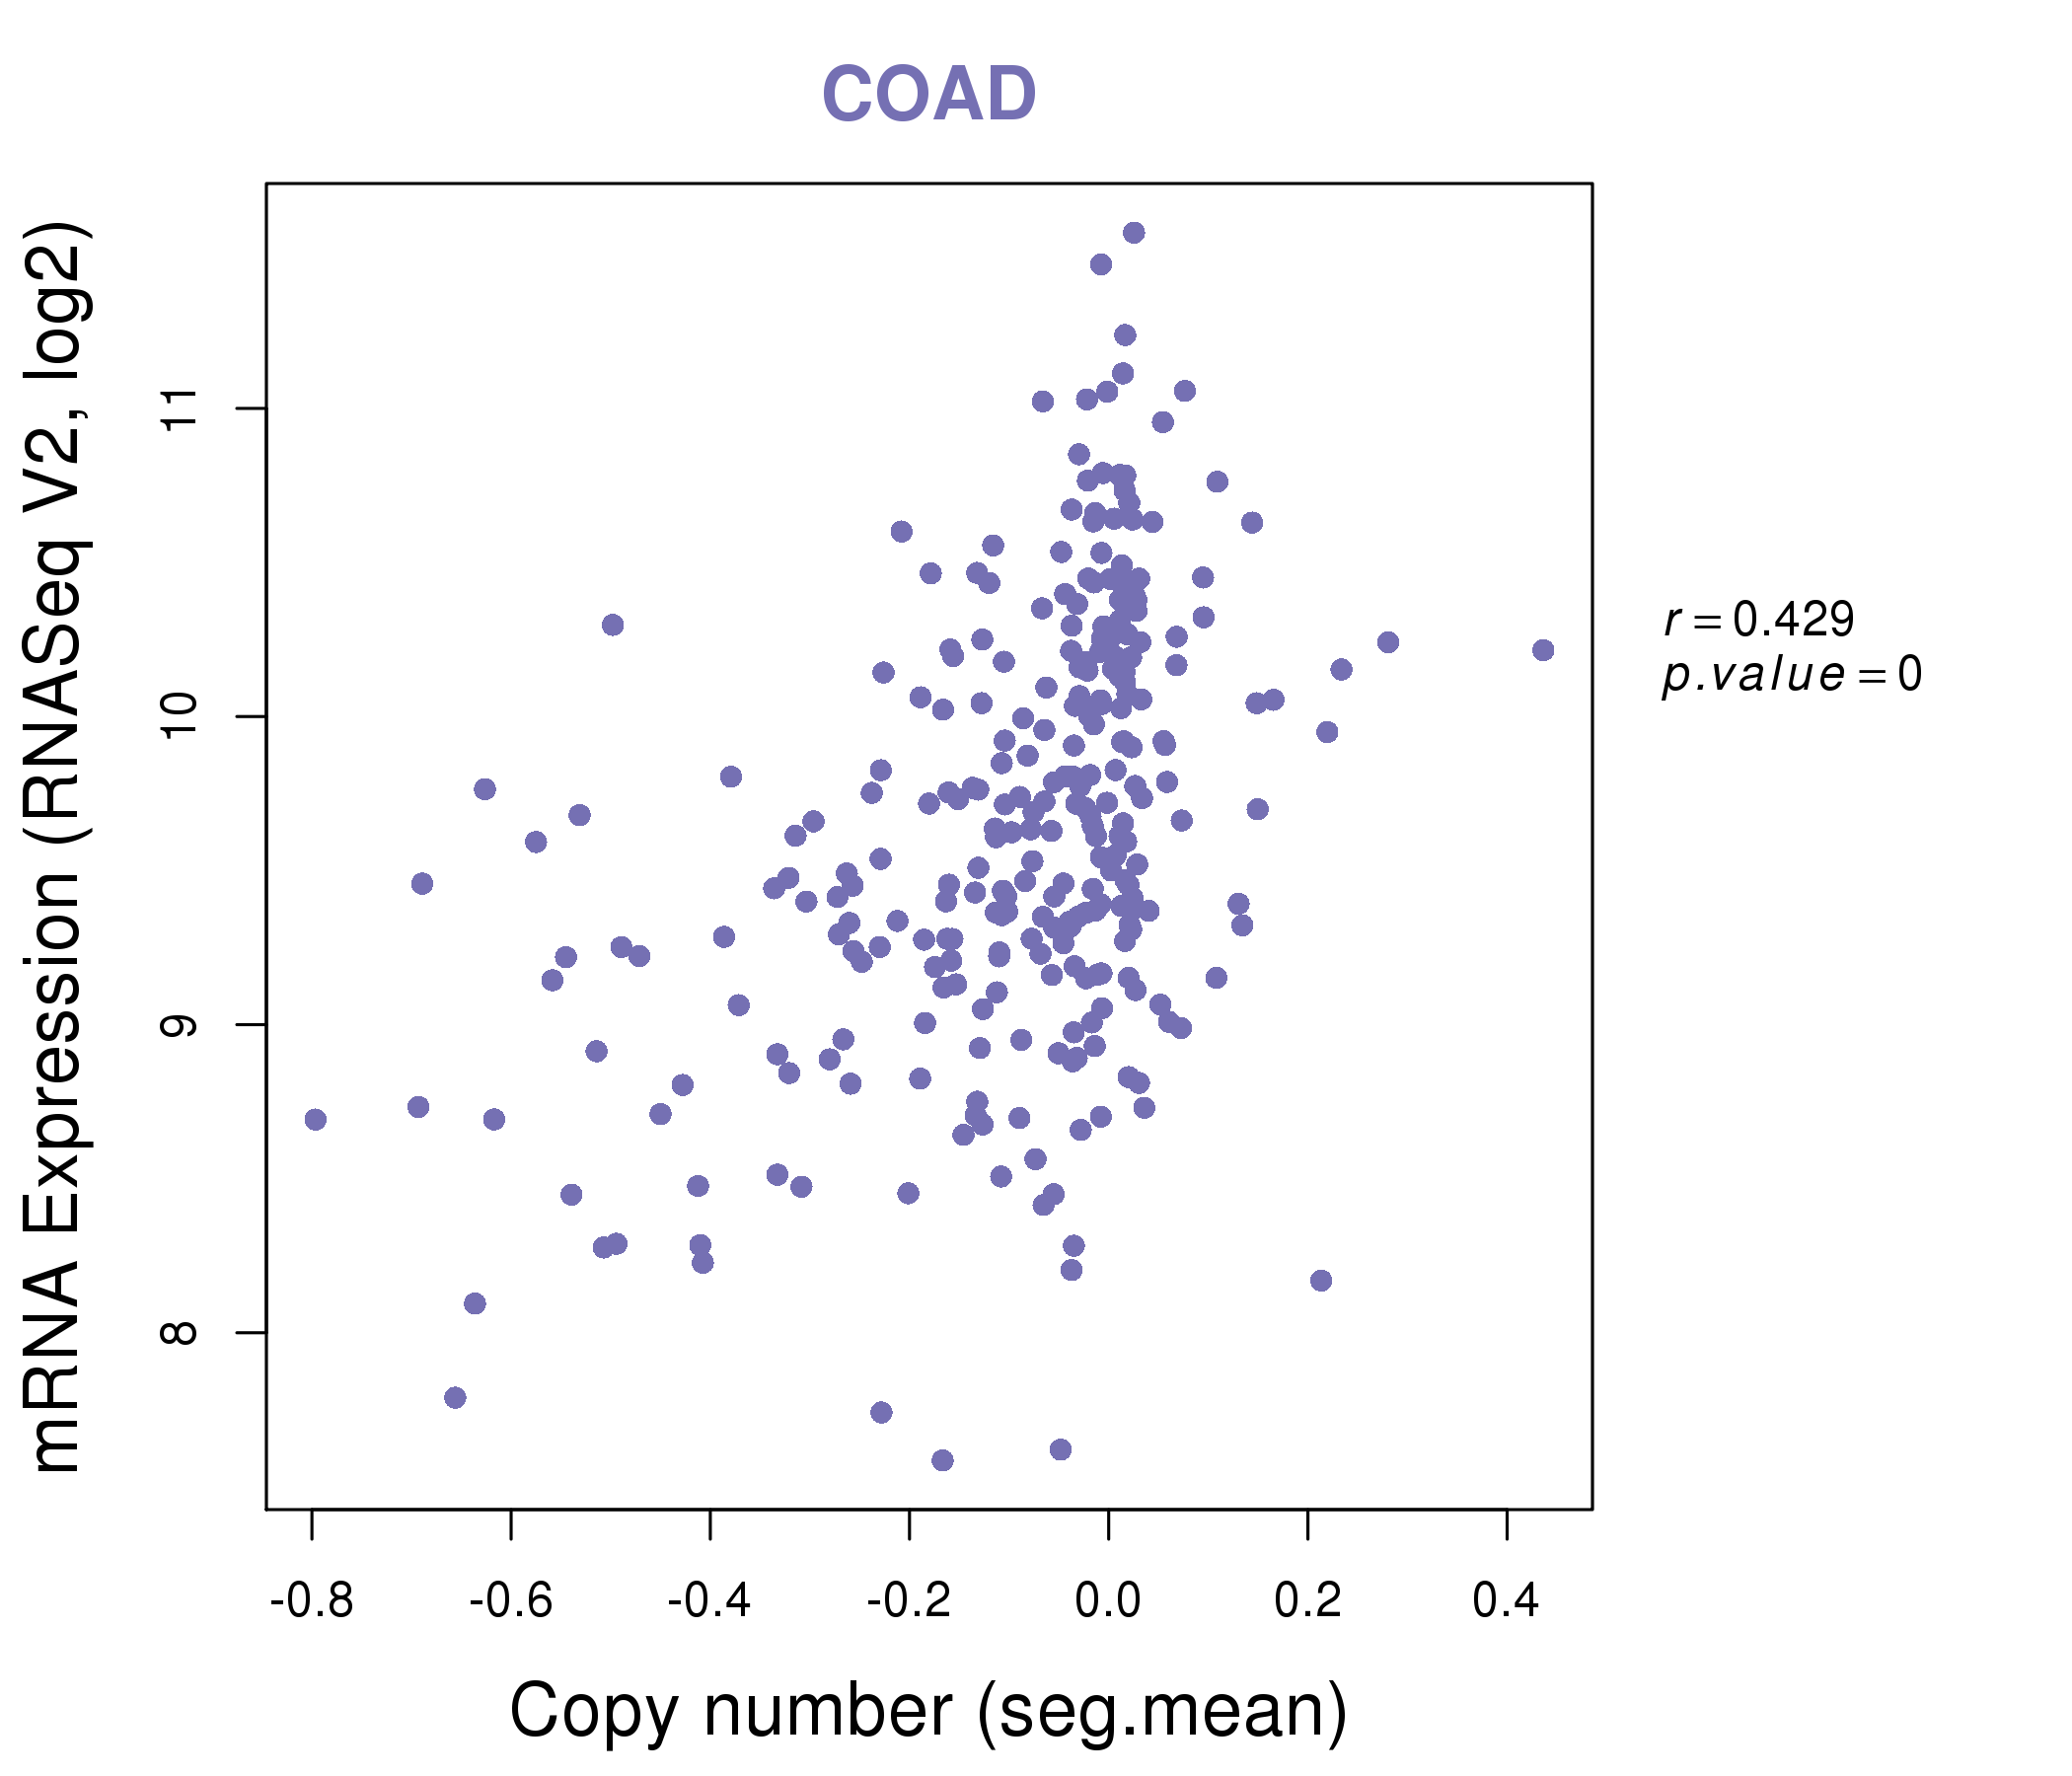
| * This plots show the correlation between CNV and gene expression. |
: Open all plots for all cancer types
 |
|
 |
|
| Top |
| Gene-Gene Network Information |
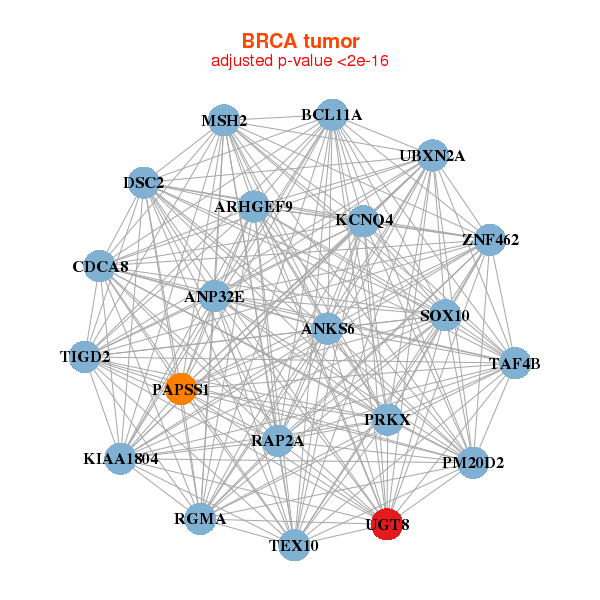
| * Co-Expression network figures were drawn using R package igraph. Only the top 20 genes with the highest correlations were shown. Red circle: input gene, orange circle: cell metabolism gene, sky circle: other gene |
: Open all plots for all cancer types
 |
|
| ANKS6,ANP32E,ARHGEF9,BCL11A,CDCA8,DSC2,KCNQ4, KIAA1804,MSH2,PAPSS1,PM20D2,PRKX,RAP2A,RGMA, SOX10,TAF4B,TEX10,TIGD2,UBXN2A,UGT8,ZNF462 | APBA1,B3GNT3,C10orf90,MYRF,CCL28,CTNNB1,DSC2, EHF,ELF5,FAM196B,FAM81A,FOLH1,GABRP,GPR156, GRHL1,LHFPL1,NALCN,PLCH1,SLC6A14,SPHKAP,UGT8 |
 |
|
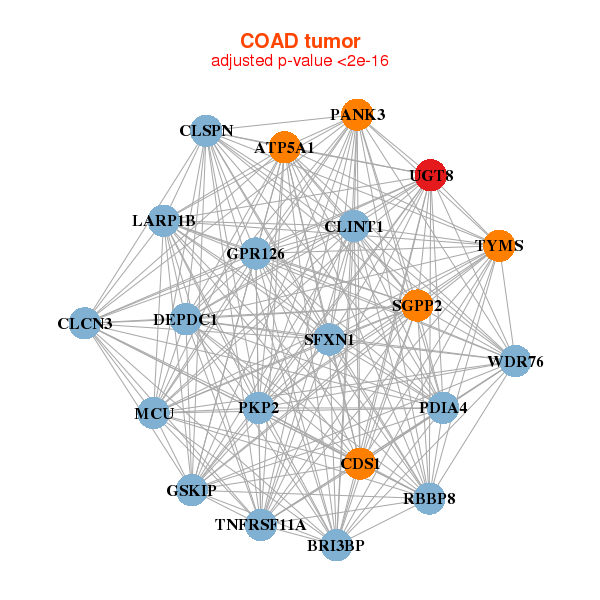
| ATP5A1,BRI3BP,GSKIP,MCU,CDS1,CLCN3,CLINT1, CLSPN,DEPDC1,GPR126,LARP1B,PANK3,PDIA4,PKP2, RBBP8,SFXN1,SGPP2,TNFRSF11A,TYMS,UGT8,WDR76 | ATP8B1,CCDC47,DNAJC16,ERMP1,ESRP1,FAM83B,GOLM1, MARVELD2,AP5M1,PGGT1B,PLCE1,PRSS12,PTBP3,SEPT11, SLC44A1,SLC9A2,TMEM184C,TMEM30B,TMEM33,UGT8,ZDHHC23 |

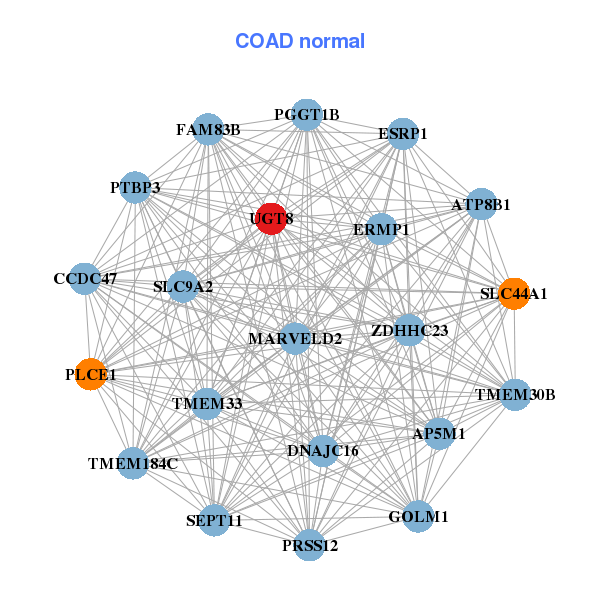
| * Co-Expression network figures were drawn using R package igraph. Only the top 20 genes with the highest correlations were shown. Red circle: input gene, orange circle: cell metabolism gene, sky circle: other gene |
: Open all plots for all cancer types
| Top |
: Open all interacting genes' information including KEGG pathway for all interacting genes from DAVID
| Top |
| Pharmacological Information for UGT8 |
| There's no related Drug. |
| Top |
| Cross referenced IDs for UGT8 |
| * We obtained these cross-references from Uniprot database. It covers 150 different DBs, 18 categories. http://www.uniprot.org/help/cross_references_section |
: Open all cross reference information
|
Copyright © 2016-Present - The Univsersity of Texas Health Science Center at Houston @ |