|
|||||||||||||||||||||||||||||||||||||||||||||||||||||||||||||||||||||||||||||||||||||||||||||||||||||||||||||||||||||||||||||||||||||||||||||||||||||||||||||||||||||||||||||||||||||||||||||||||||||||||||||||||||||||||||||||||||||||||||||||||||||||||||||||||||||||||||||||||||||||||||||||||||||||||||||||||||||||||||||||||||||||||||||||||||||||||||||||||||||
| |
| Phenotypic Information (metabolism pathway, cancer, disease, phenome) |
| |
| |
| Gene-Gene Network Information: Co-Expression Network, Interacting Genes & KEGG |
| |
|


| Gene Summary for UMPS |
| Top |
| Phenotypic Information for UMPS(metabolism pathway, cancer, disease, phenome) |
| Cancer | CGAP: UMPS |
| Familial Cancer Database: UMPS | |
| * This gene is included in those cancer gene databases. |
|
|
|
|
|
| . | |||||||||||||||||||||||||||||||||||||||||||||||||||||||||||||||||||||||||||||||||||||||||||||||||||||||||||||||||||||||||||||||||||||||||||||||||||||||||||||||||||||||||||||||||||||||||||||||||||||||||||||||||||||||||||||||||||||||||||||||||||||||||||||||||||||||||||||||||||||||||||||||||||||||||||||||||||||||||||||||||||||||||||||||||||||||||||||||
Oncogene 1 | Significant driver gene in | ||||||||||||||||||||||||||||||||||||||||||||||||||||||||||||||||||||||||||||||||||||||||||||||||||||||||||||||||||||||||||||||||||||||||||||||||||||||||||||||||||||||||||||||||||||||||||||||||||||||||||||||||||||||||||||||||||||||||||||||||||||||||||||||||||||||||||||||||||||||||||||||||||||||||||||||||||||||||||||||||||||||||||||||||||||||||||||||||||||
| cf) number; DB name 1 Oncogene; http://nar.oxfordjournals.org/content/35/suppl_1/D721.long, 2 Tumor Suppressor gene; https://bioinfo.uth.edu/TSGene/, 3 Cancer Gene Census; http://www.nature.com/nrc/journal/v4/n3/abs/nrc1299.html, 4 CancerGenes; http://nar.oxfordjournals.org/content/35/suppl_1/D721.long, 5 Network of Cancer Gene; http://ncg.kcl.ac.uk/index.php, 1Therapeutic Vulnerabilities in Cancer; http://cbio.mskcc.org/cancergenomics/statius/ |
| KEGG_PYRIMIDINE_METABOLISM KEGG_DRUG_METABOLISM_OTHER_ENZYMES REACTOME_METABOLISM_OF_NUCLEOTIDES REACTOME_PYRIMIDINE_METABOLISM | |
| OMIM | |
| Orphanet | |
| Disease | KEGG Disease: UMPS |
| MedGen: UMPS (Human Medical Genetics with Condition) | |
| ClinVar: UMPS | |
| Phenotype | MGI: UMPS (International Mouse Phenotyping Consortium) |
| PhenomicDB: UMPS | |
| Mutations for UMPS |
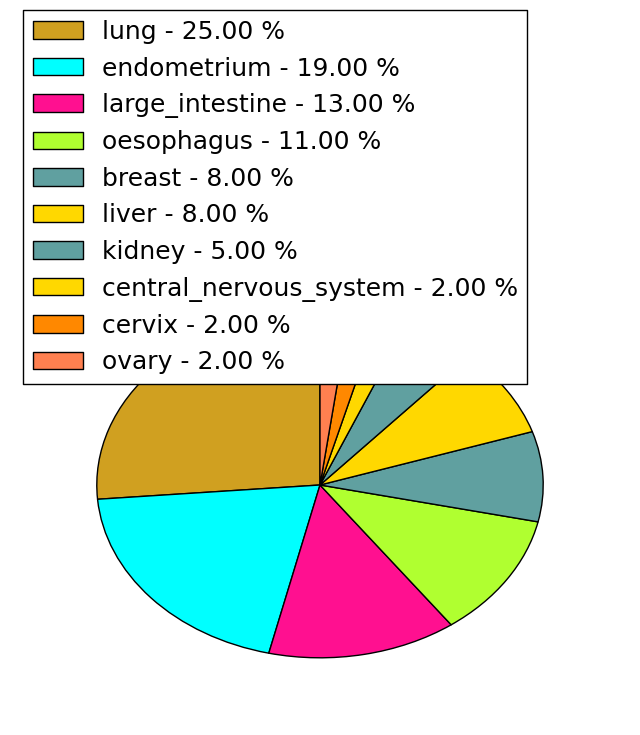
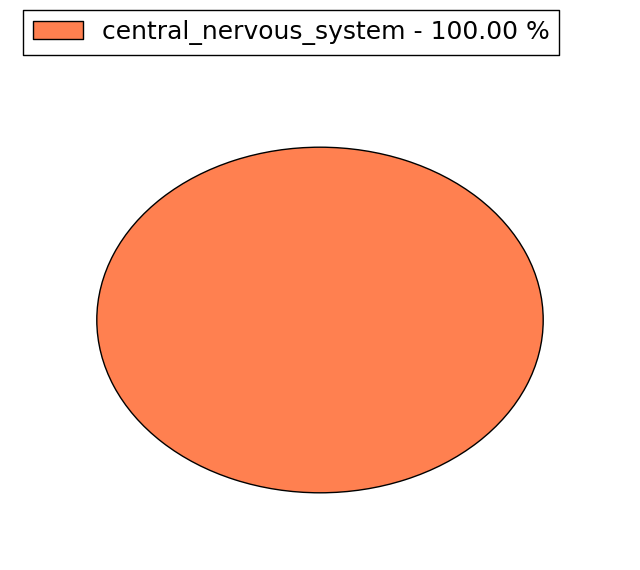
| * Under tables are showing count per each tissue to give us broad intuition about tissue specific mutation patterns.You can go to the detailed page for each mutation database's web site. |
| There's no structural variation information in COSMIC data for this gene. |
| * From mRNA Sanger sequences, Chitars2.0 arranged chimeric transcripts. This table shows UMPS related fusion information. |
| ID | Head Gene | Tail Gene | Accession | Gene_a | qStart_a | qEnd_a | Chromosome_a | tStart_a | tEnd_a | Gene_a | qStart_a | qEnd_a | Chromosome_a | tStart_a | tEnd_a |
| DW427610 | UMPS | 16 | 222 | 3 | 124460050 | 124460256 | UMPS | 223 | 278 | 3 | 124459205 | 124459260 | |
| AW800517 | UMPS | 4 | 74 | 3 | 124463070 | 124463140 | EVC | 67 | 130 | 4 | 5784294 | 5784357 | |
| Top |
| Mutation type/ Tissue ID | brca | cns | cerv | endome | haematopo | kidn | Lintest | liver | lung | ns | ovary | pancre | prost | skin | stoma | thyro | urina | |||
| Total # sample | 1 | |||||||||||||||||||
| GAIN (# sample) | 1 | |||||||||||||||||||
| LOSS (# sample) |
| cf) Tissue ID; Tissue type (1; Breast, 2; Central_nervous_system, 3; Cervix, 4; Endometrium, 5; Haematopoietic_and_lymphoid_tissue, 6; Kidney, 7; Large_intestine, 8; Liver, 9; Lung, 10; NS, 11; Ovary, 12; Pancreas, 13; Prostate, 14; Skin, 15; Stomach, 16; Thyroid, 17; Urinary_tract) |
| Top |
|
 |
| Top |
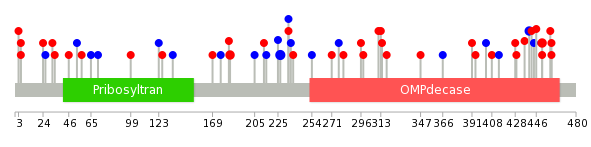
| Stat. for Non-Synonymous SNVs (# total SNVs=36) | (# total SNVs=14) |
 |  |
(# total SNVs=1) | (# total SNVs=0) |
 |
| Top |
| * When you move the cursor on each content, you can see more deailed mutation information on the Tooltip. Those are primary_site,primary_histology,mutation(aa),pubmedID. |
| GRCh37 position | Mutation(aa) | Unique sampleID count |
| chr3:124456785-124456785 | p.F227F | 3 |
| chr3:124462808-124462808 | p.G440G | 2 |
| chr3:124456654-124456654 | p.E184K | 2 |
| chr3:124458954-124458954 | p.E356* | 2 |
| chr3:124462839-124462839 | p.R451C | 2 |
| chr3:124456817-124456817 | p.P238L | 1 |
| chr3:124458928-124458928 | p.G347V | 1 |
| chr3:124453942-124453942 | p.V53V | 1 |
| chr3:124456864-124456864 | p.L254L | 1 |
| chr3:124453952-124453952 | p.L57V | 1 |
| Top |
|
 |
| Point Mutation/ Tissue ID | 1 | 2 | 3 | 4 | 5 | 6 | 7 | 8 | 9 | 10 | 11 | 12 | 13 | 14 | 15 | 16 | 17 | 18 | 19 | 20 |
| # sample | 1 | 3 | 1 | 4 | 1 | 1 | 6 | 1 | 1 | 1 | 3 | 3 | 8 | |||||||
| # mutation | 3 | 3 | 1 | 5 | 1 | 1 | 7 | 1 | 1 | 1 | 3 | 3 | 10 | |||||||
| nonsynonymous SNV | 1 | 2 | 1 | 3 | 1 | 4 | 1 | 1 | 1 | 1 | 2 | 6 | ||||||||
| synonymous SNV | 2 | 1 | 2 | 1 | 3 | 2 | 1 | 4 |
| cf) Tissue ID; Tissue type (1; BLCA[Bladder Urothelial Carcinoma], 2; BRCA[Breast invasive carcinoma], 3; CESC[Cervical squamous cell carcinoma and endocervical adenocarcinoma], 4; COAD[Colon adenocarcinoma], 5; GBM[Glioblastoma multiforme], 6; Glioma Low Grade, 7; HNSC[Head and Neck squamous cell carcinoma], 8; KICH[Kidney Chromophobe], 9; KIRC[Kidney renal clear cell carcinoma], 10; KIRP[Kidney renal papillary cell carcinoma], 11; LAML[Acute Myeloid Leukemia], 12; LUAD[Lung adenocarcinoma], 13; LUSC[Lung squamous cell carcinoma], 14; OV[Ovarian serous cystadenocarcinoma ], 15; PAAD[Pancreatic adenocarcinoma], 16; PRAD[Prostate adenocarcinoma], 17; SKCM[Skin Cutaneous Melanoma], 18:STAD[Stomach adenocarcinoma], 19:THCA[Thyroid carcinoma], 20:UCEC[Uterine Corpus Endometrial Carcinoma]) |
| Top |
| * We represented just top 10 SNVs. When you move the cursor on each content, you can see more deailed mutation information on the Tooltip. Those are primary_site, primary_histology, mutation(aa), pubmedID. |
| Genomic Position | Mutation(aa) | Unique sampleID count |
| chr3:124462839 | p.R451C | 2 |
| chr3:124461053 | p.G65G | 1 |
| chr3:124453978 | p.K296N | 1 |
| chr3:124456812 | p.E123E | 1 |
| chr3:124461062 | p.L298F | 1 |
| chr3:124456473 | p.V126A | 1 |
| chr3:124456817 | p.E311K | 1 |
| chr3:124449388 | p.T135T | 1 |
| chr3:124462773 | p.K314T | 1 |
| chr3:124456481 | p.R169C | 1 |
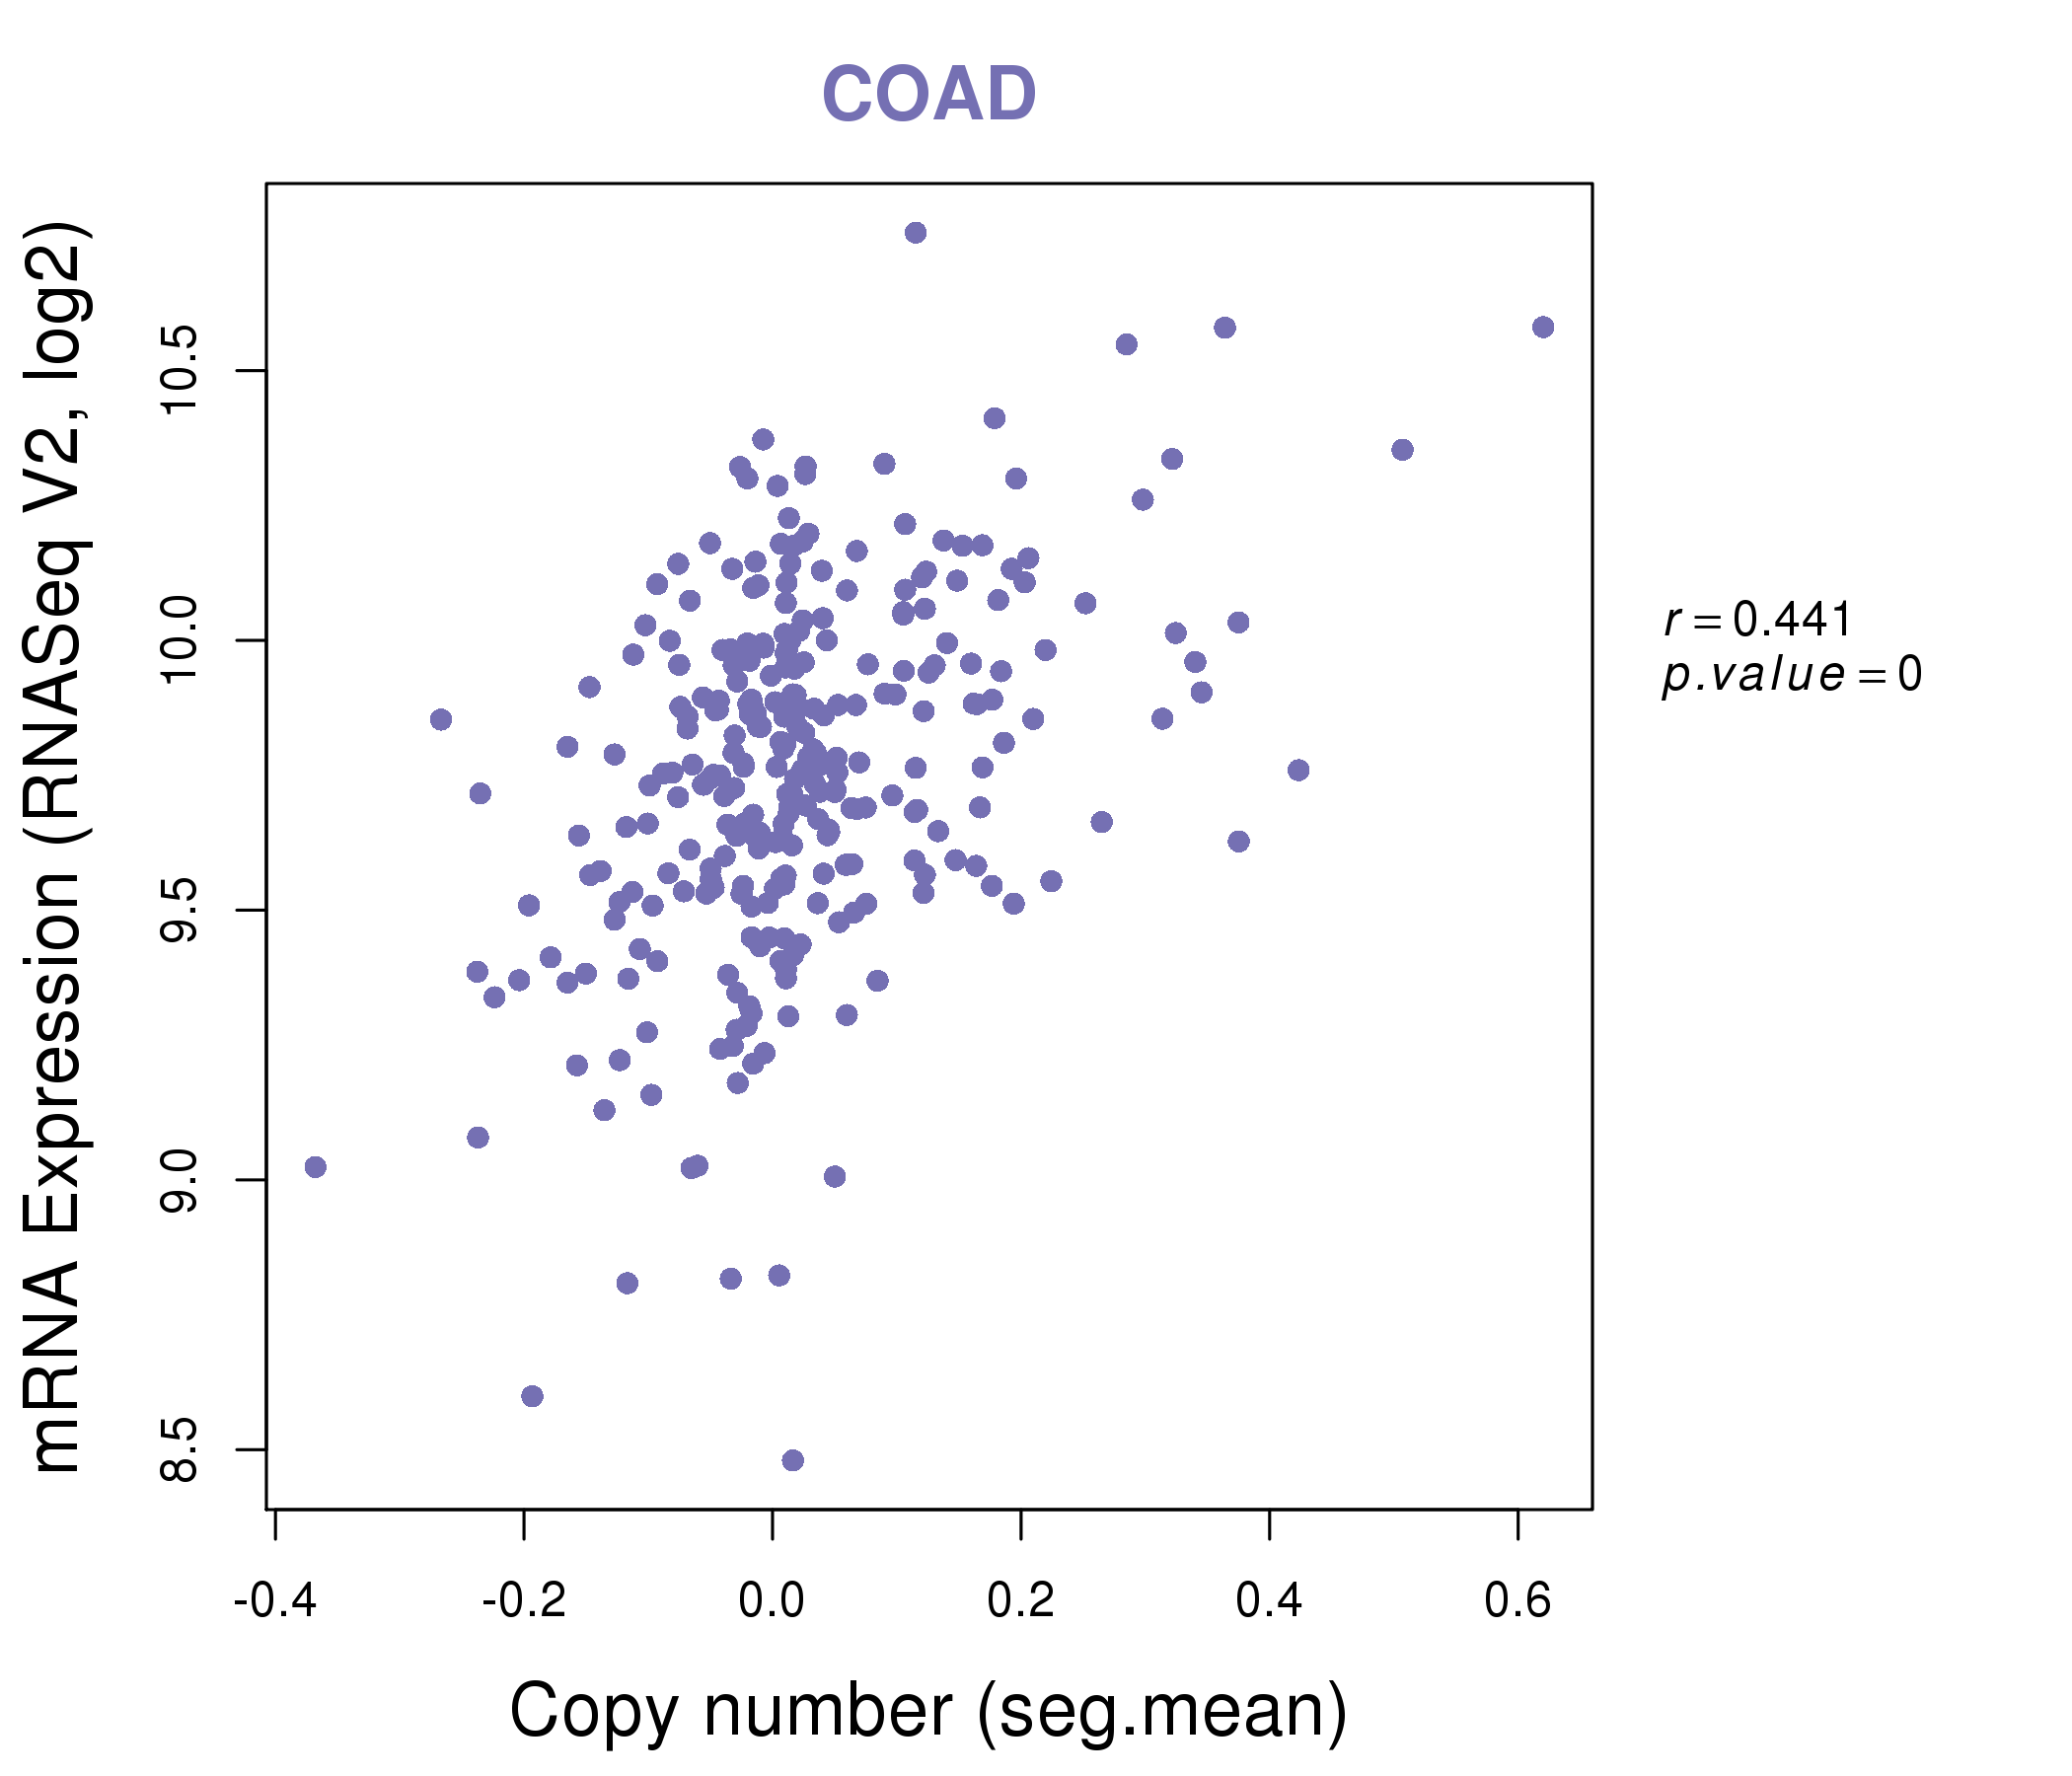
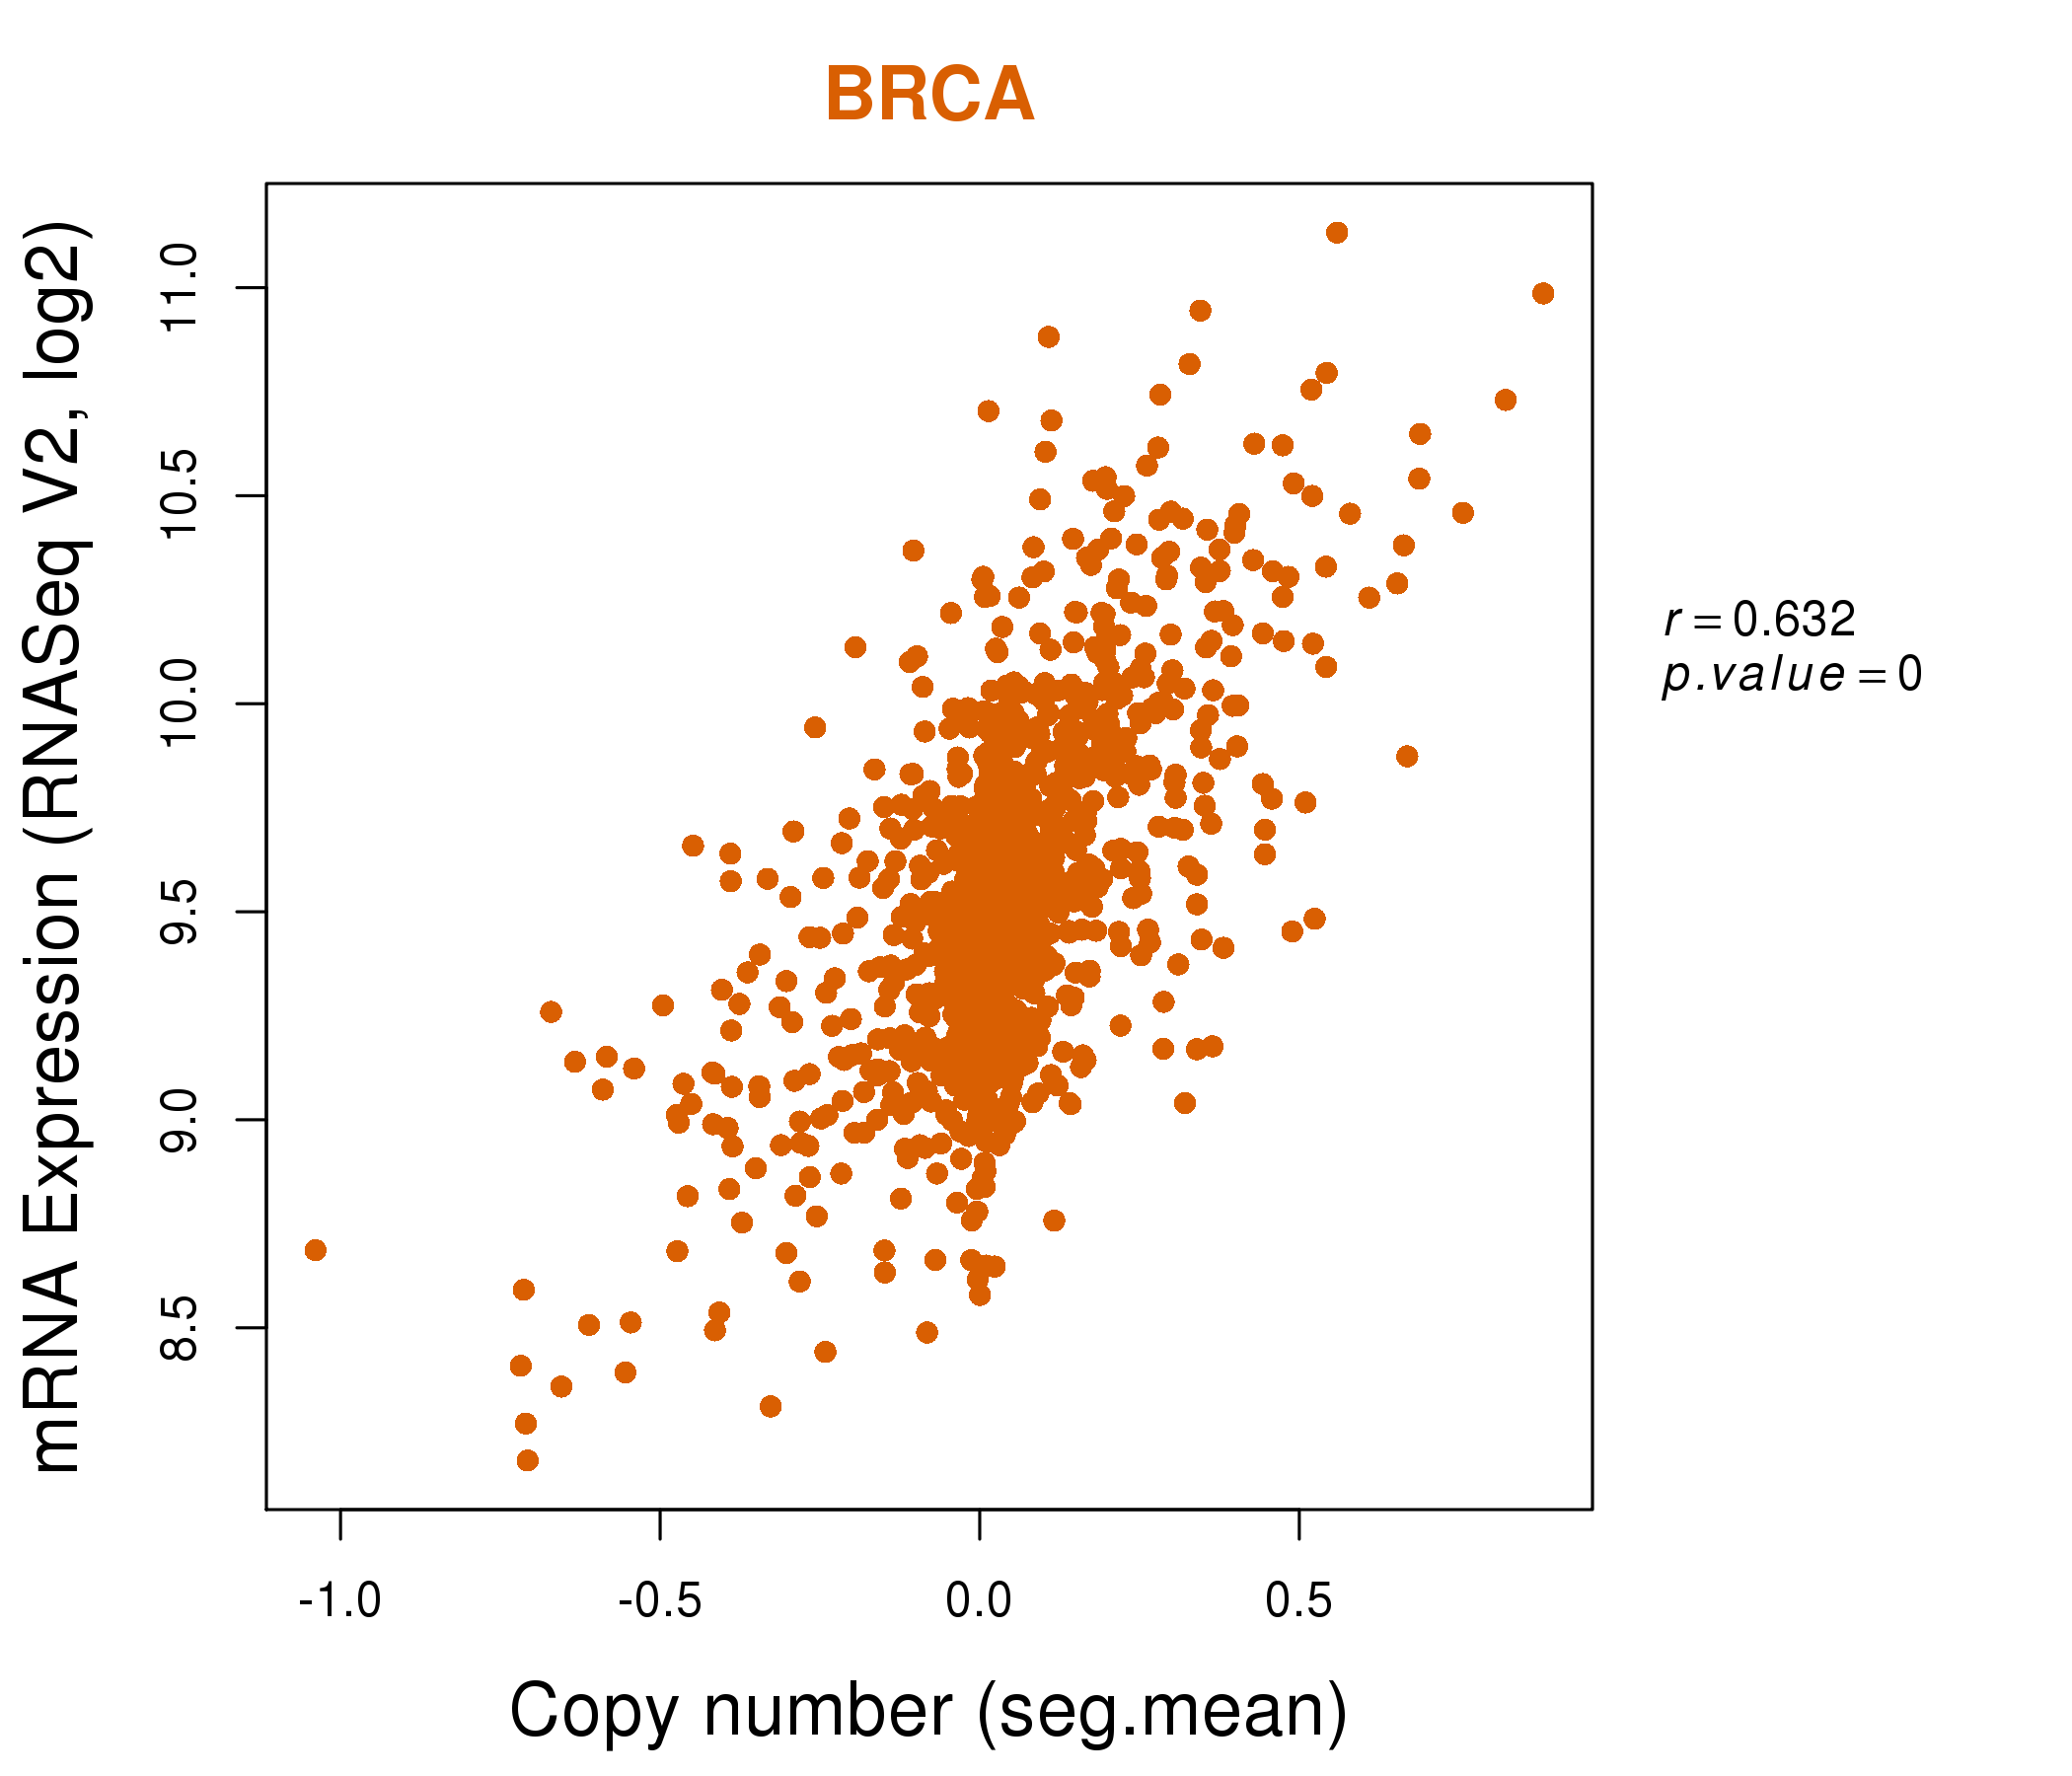
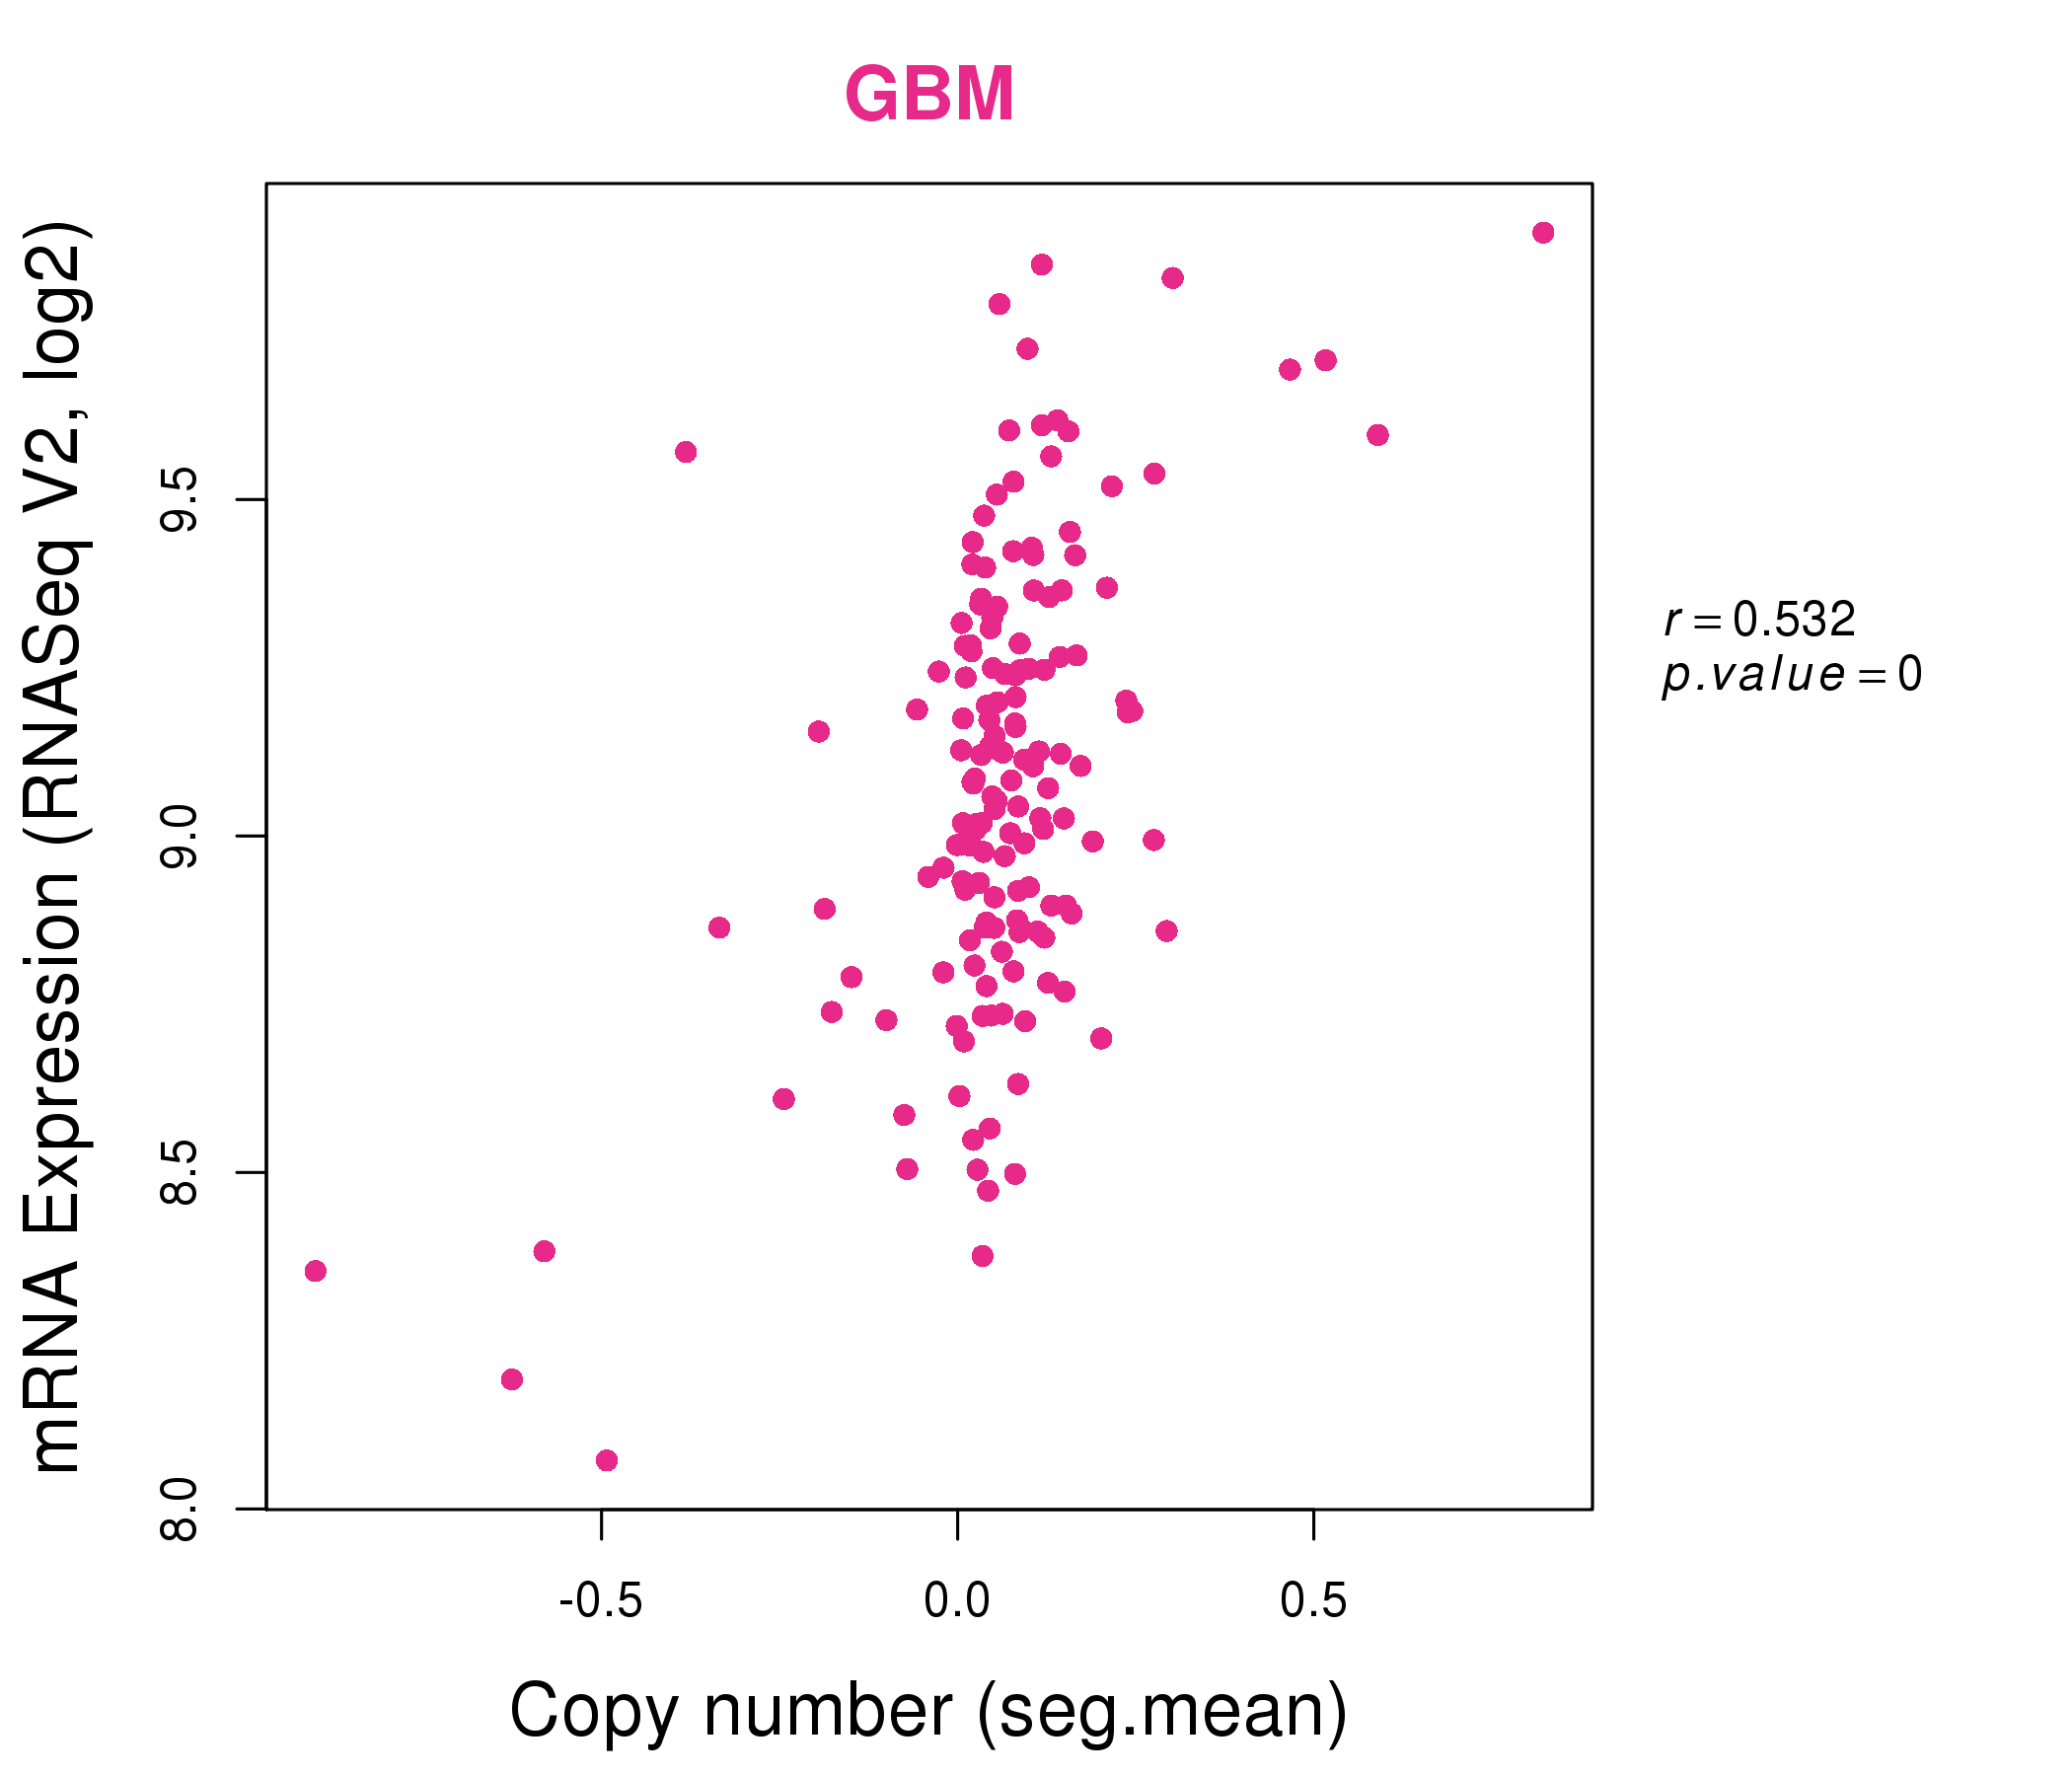
| * Copy number data were extracted from TCGA using R package TCGA-Assembler. The URLs of all public data files on TCGA DCC data server were gathered on Jan-05-2015. Function ProcessCNAData in TCGA-Assembler package was used to obtain gene-level copy number value which is calculated as the average copy number of the genomic region of a gene. |
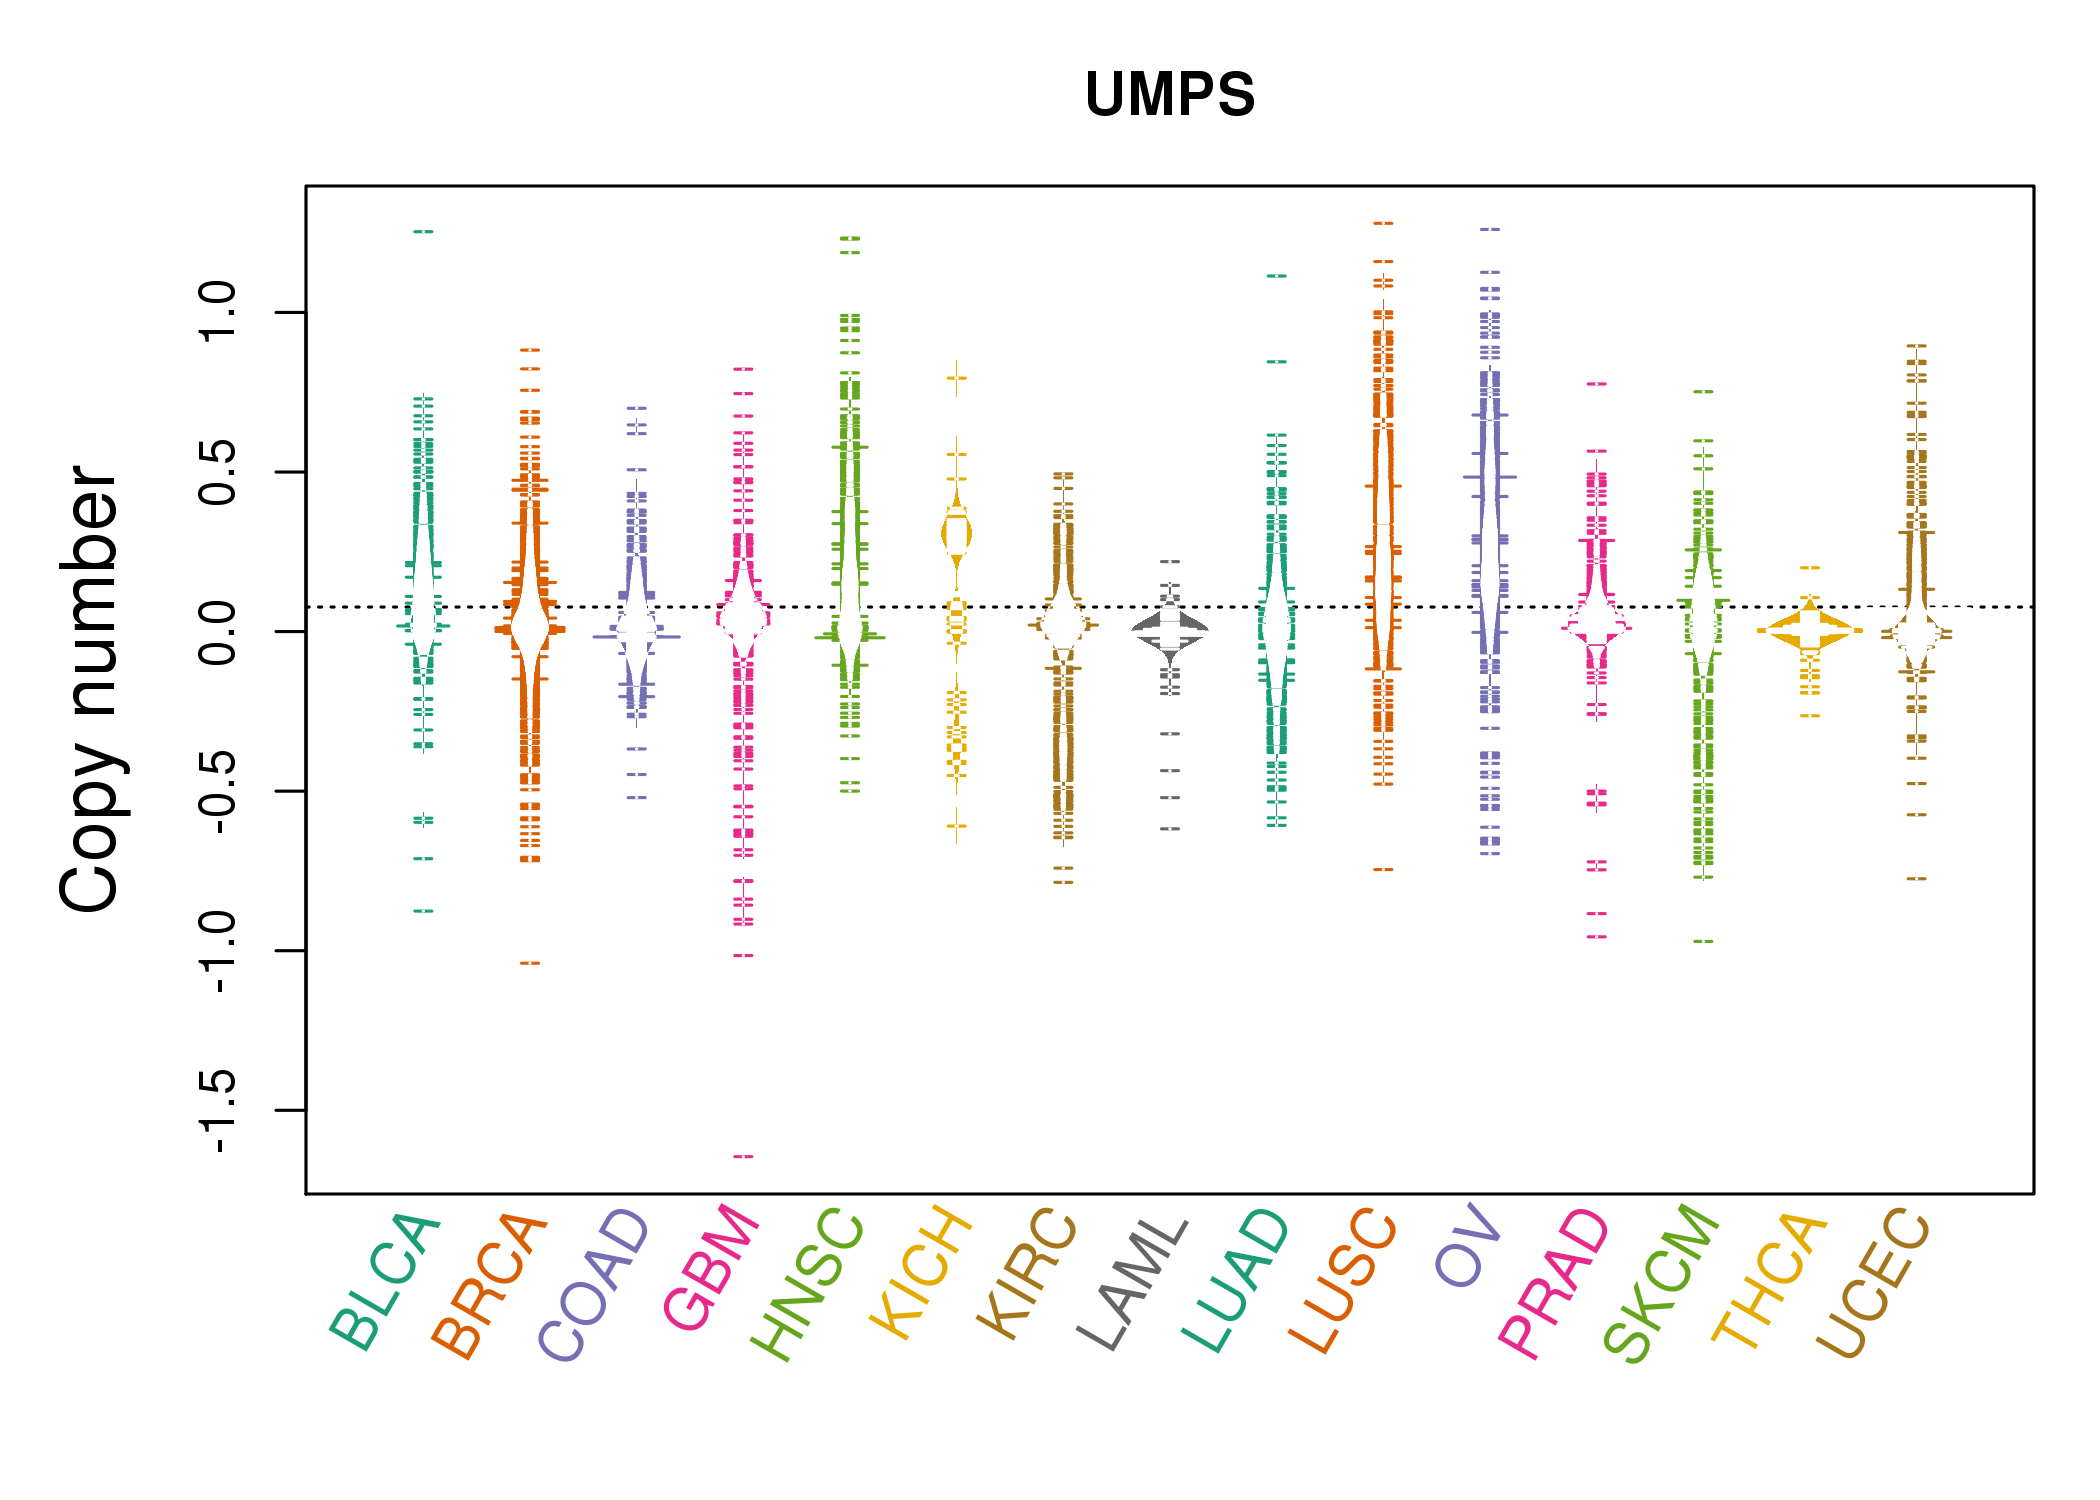 |
| cf) Tissue ID[Tissue type]: BLCA[Bladder Urothelial Carcinoma], BRCA[Breast invasive carcinoma], CESC[Cervical squamous cell carcinoma and endocervical adenocarcinoma], COAD[Colon adenocarcinoma], GBM[Glioblastoma multiforme], Glioma Low Grade, HNSC[Head and Neck squamous cell carcinoma], KICH[Kidney Chromophobe], KIRC[Kidney renal clear cell carcinoma], KIRP[Kidney renal papillary cell carcinoma], LAML[Acute Myeloid Leukemia], LUAD[Lung adenocarcinoma], LUSC[Lung squamous cell carcinoma], OV[Ovarian serous cystadenocarcinoma ], PAAD[Pancreatic adenocarcinoma], PRAD[Prostate adenocarcinoma], SKCM[Skin Cutaneous Melanoma], STAD[Stomach adenocarcinoma], THCA[Thyroid carcinoma], UCEC[Uterine Corpus Endometrial Carcinoma] |
| Top |
| Gene Expression for UMPS |
| * CCLE gene expression data were extracted from CCLE_Expression_Entrez_2012-10-18.res: Gene-centric RMA-normalized mRNA expression data. |
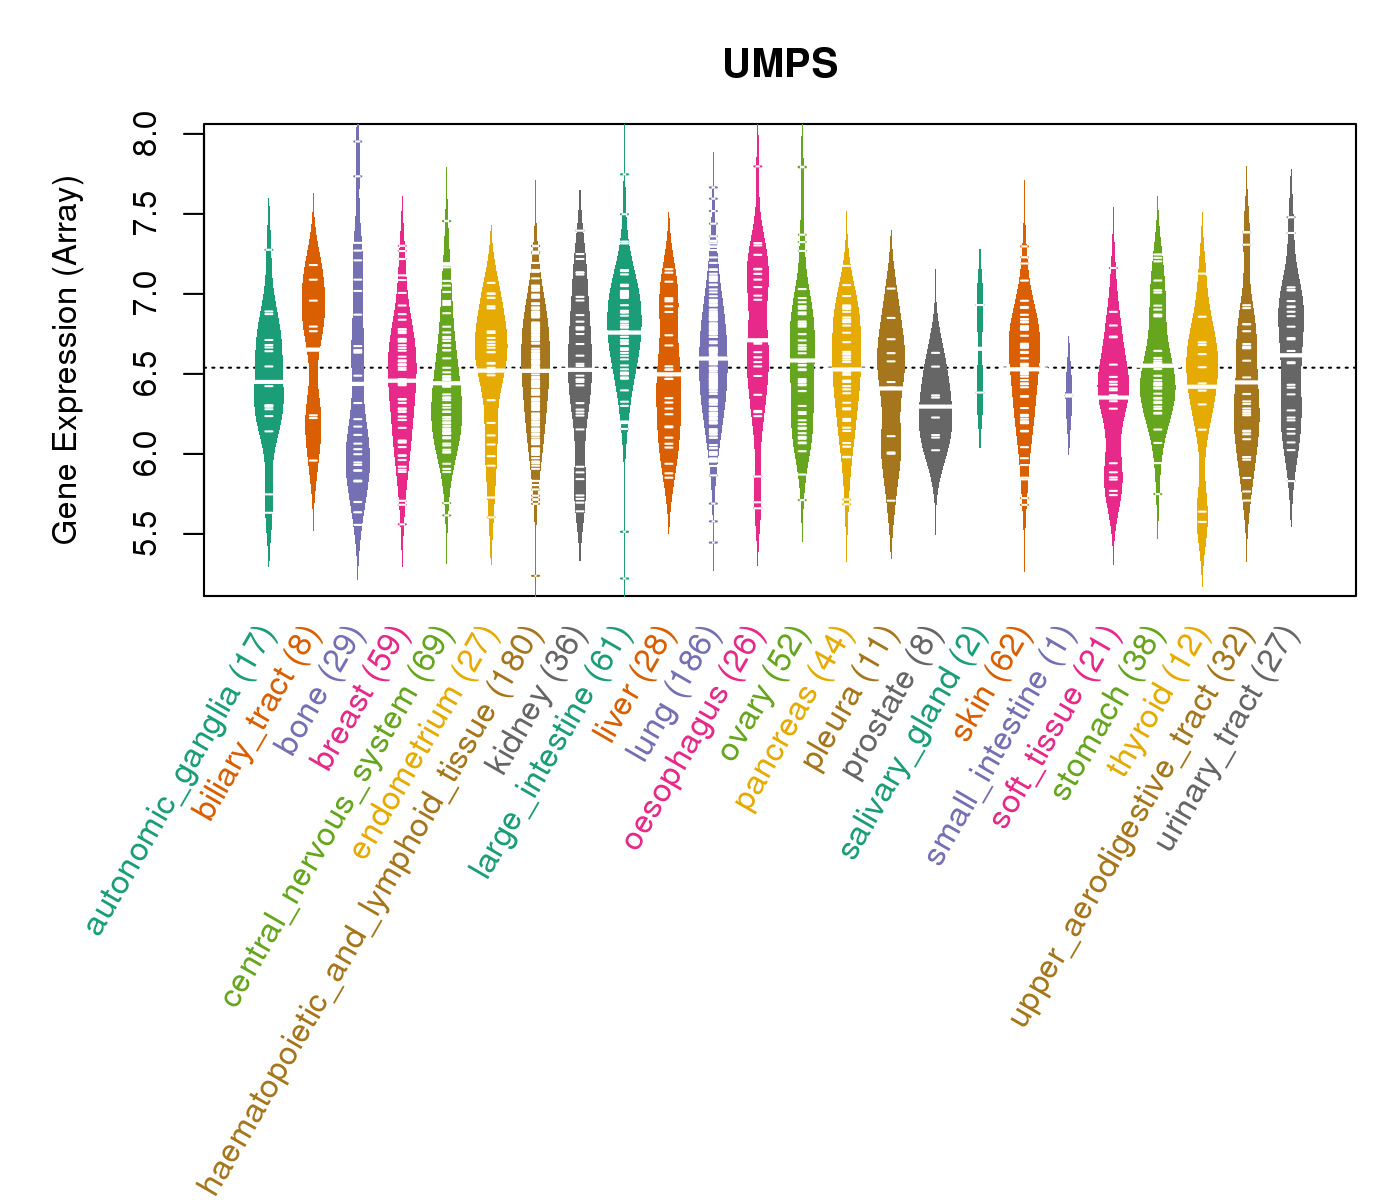 |
| * Normalized gene expression data of RNASeqV2 was extracted from TCGA using R package TCGA-Assembler. The URLs of all public data files on TCGA DCC data server were gathered at Jan-05-2015. Only eight cancer types have enough normal control samples for differential expression analysis. (t test, adjusted p<0.05 (using Benjamini-Hochberg FDR)) |
 |
| Top |
| * This plots show the correlation between CNV and gene expression. |
: Open all plots for all cancer types
 |
|
 |
|
| Top |
| Gene-Gene Network Information |
| * Co-Expression network figures were drawn using R package igraph. Only the top 20 genes with the highest correlations were shown. Red circle: input gene, orange circle: cell metabolism gene, sky circle: other gene |
: Open all plots for all cancer types
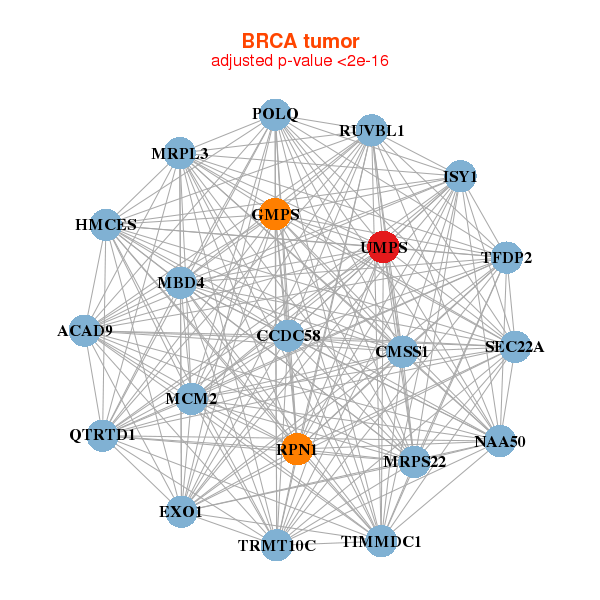 |
| ||||
| ACAD9,TIMMDC1,CMSS1,HMCES,CCDC58,EXO1,GMPS, ISY1,MBD4,MCM2,MRPL3,MRPS22,NAA50,POLQ, QTRTD1,TRMT10C,RPN1,RUVBL1,SEC22A,TFDP2,UMPS | APH1A,APTX,EIF3D,FBL,ILF2,KRTCAP3,NCOA5, OCIAD2,PGAP2,POLR1C,PPAP2C,PRSS8,RAB25,RPS4X, SF3A3,SSRP1,NELFCD,TMEM125,TMEM199,TRIM27,UMPS | ||||
 |
| ||||
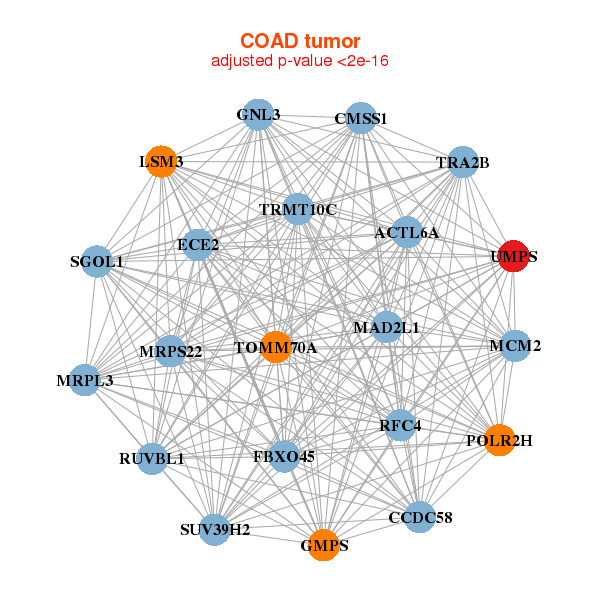
| ACTL6A,CMSS1,CCDC58,ECE2,FBXO45,GMPS,GNL3, LSM3,MAD2L1,MCM2,MRPL3,MRPS22,POLR2H,RFC4, TRMT10C,RUVBL1,SGOL1,SUV39H2,TOMM70A,TRA2B,UMPS | ABCE1,CCT2,CCT5,CCT6A,CCT8,DKC1,EBNA1BP2, EIF3I,EIF4A1,EIF4A3,FARSB,FASTKD2,HNRNPF,METTL1, MRPL3,NOL11,PHB,RANBP1,SRPRB,UMPS,UTP6 |
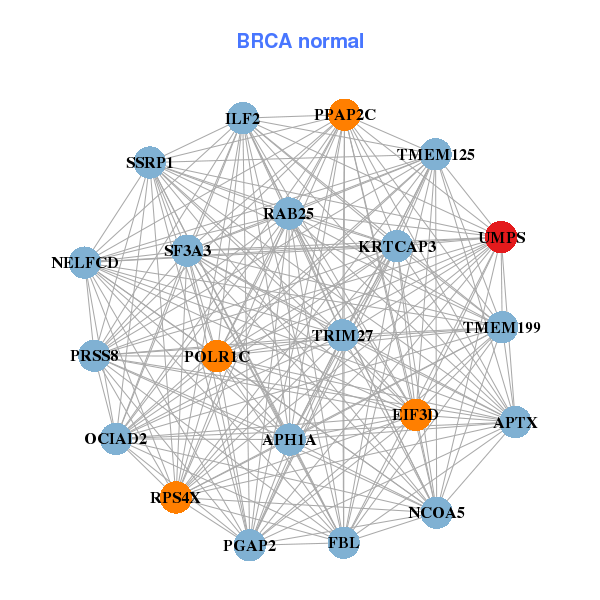
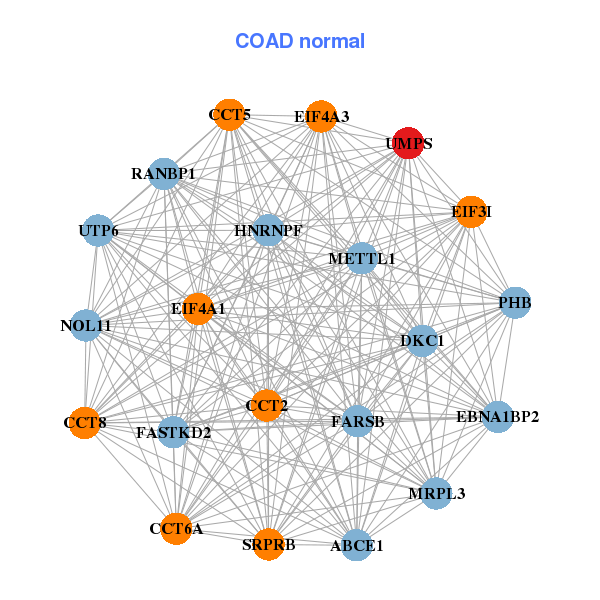
| * Co-Expression network figures were drawn using R package igraph. Only the top 20 genes with the highest correlations were shown. Red circle: input gene, orange circle: cell metabolism gene, sky circle: other gene |
: Open all plots for all cancer types
| Top |
: Open all interacting genes' information including KEGG pathway for all interacting genes from DAVID
| Top |
| Pharmacological Information for UMPS |
| DB Category | DB Name | DB's ID and Url link |
| * Gene Centered Interaction Network. |
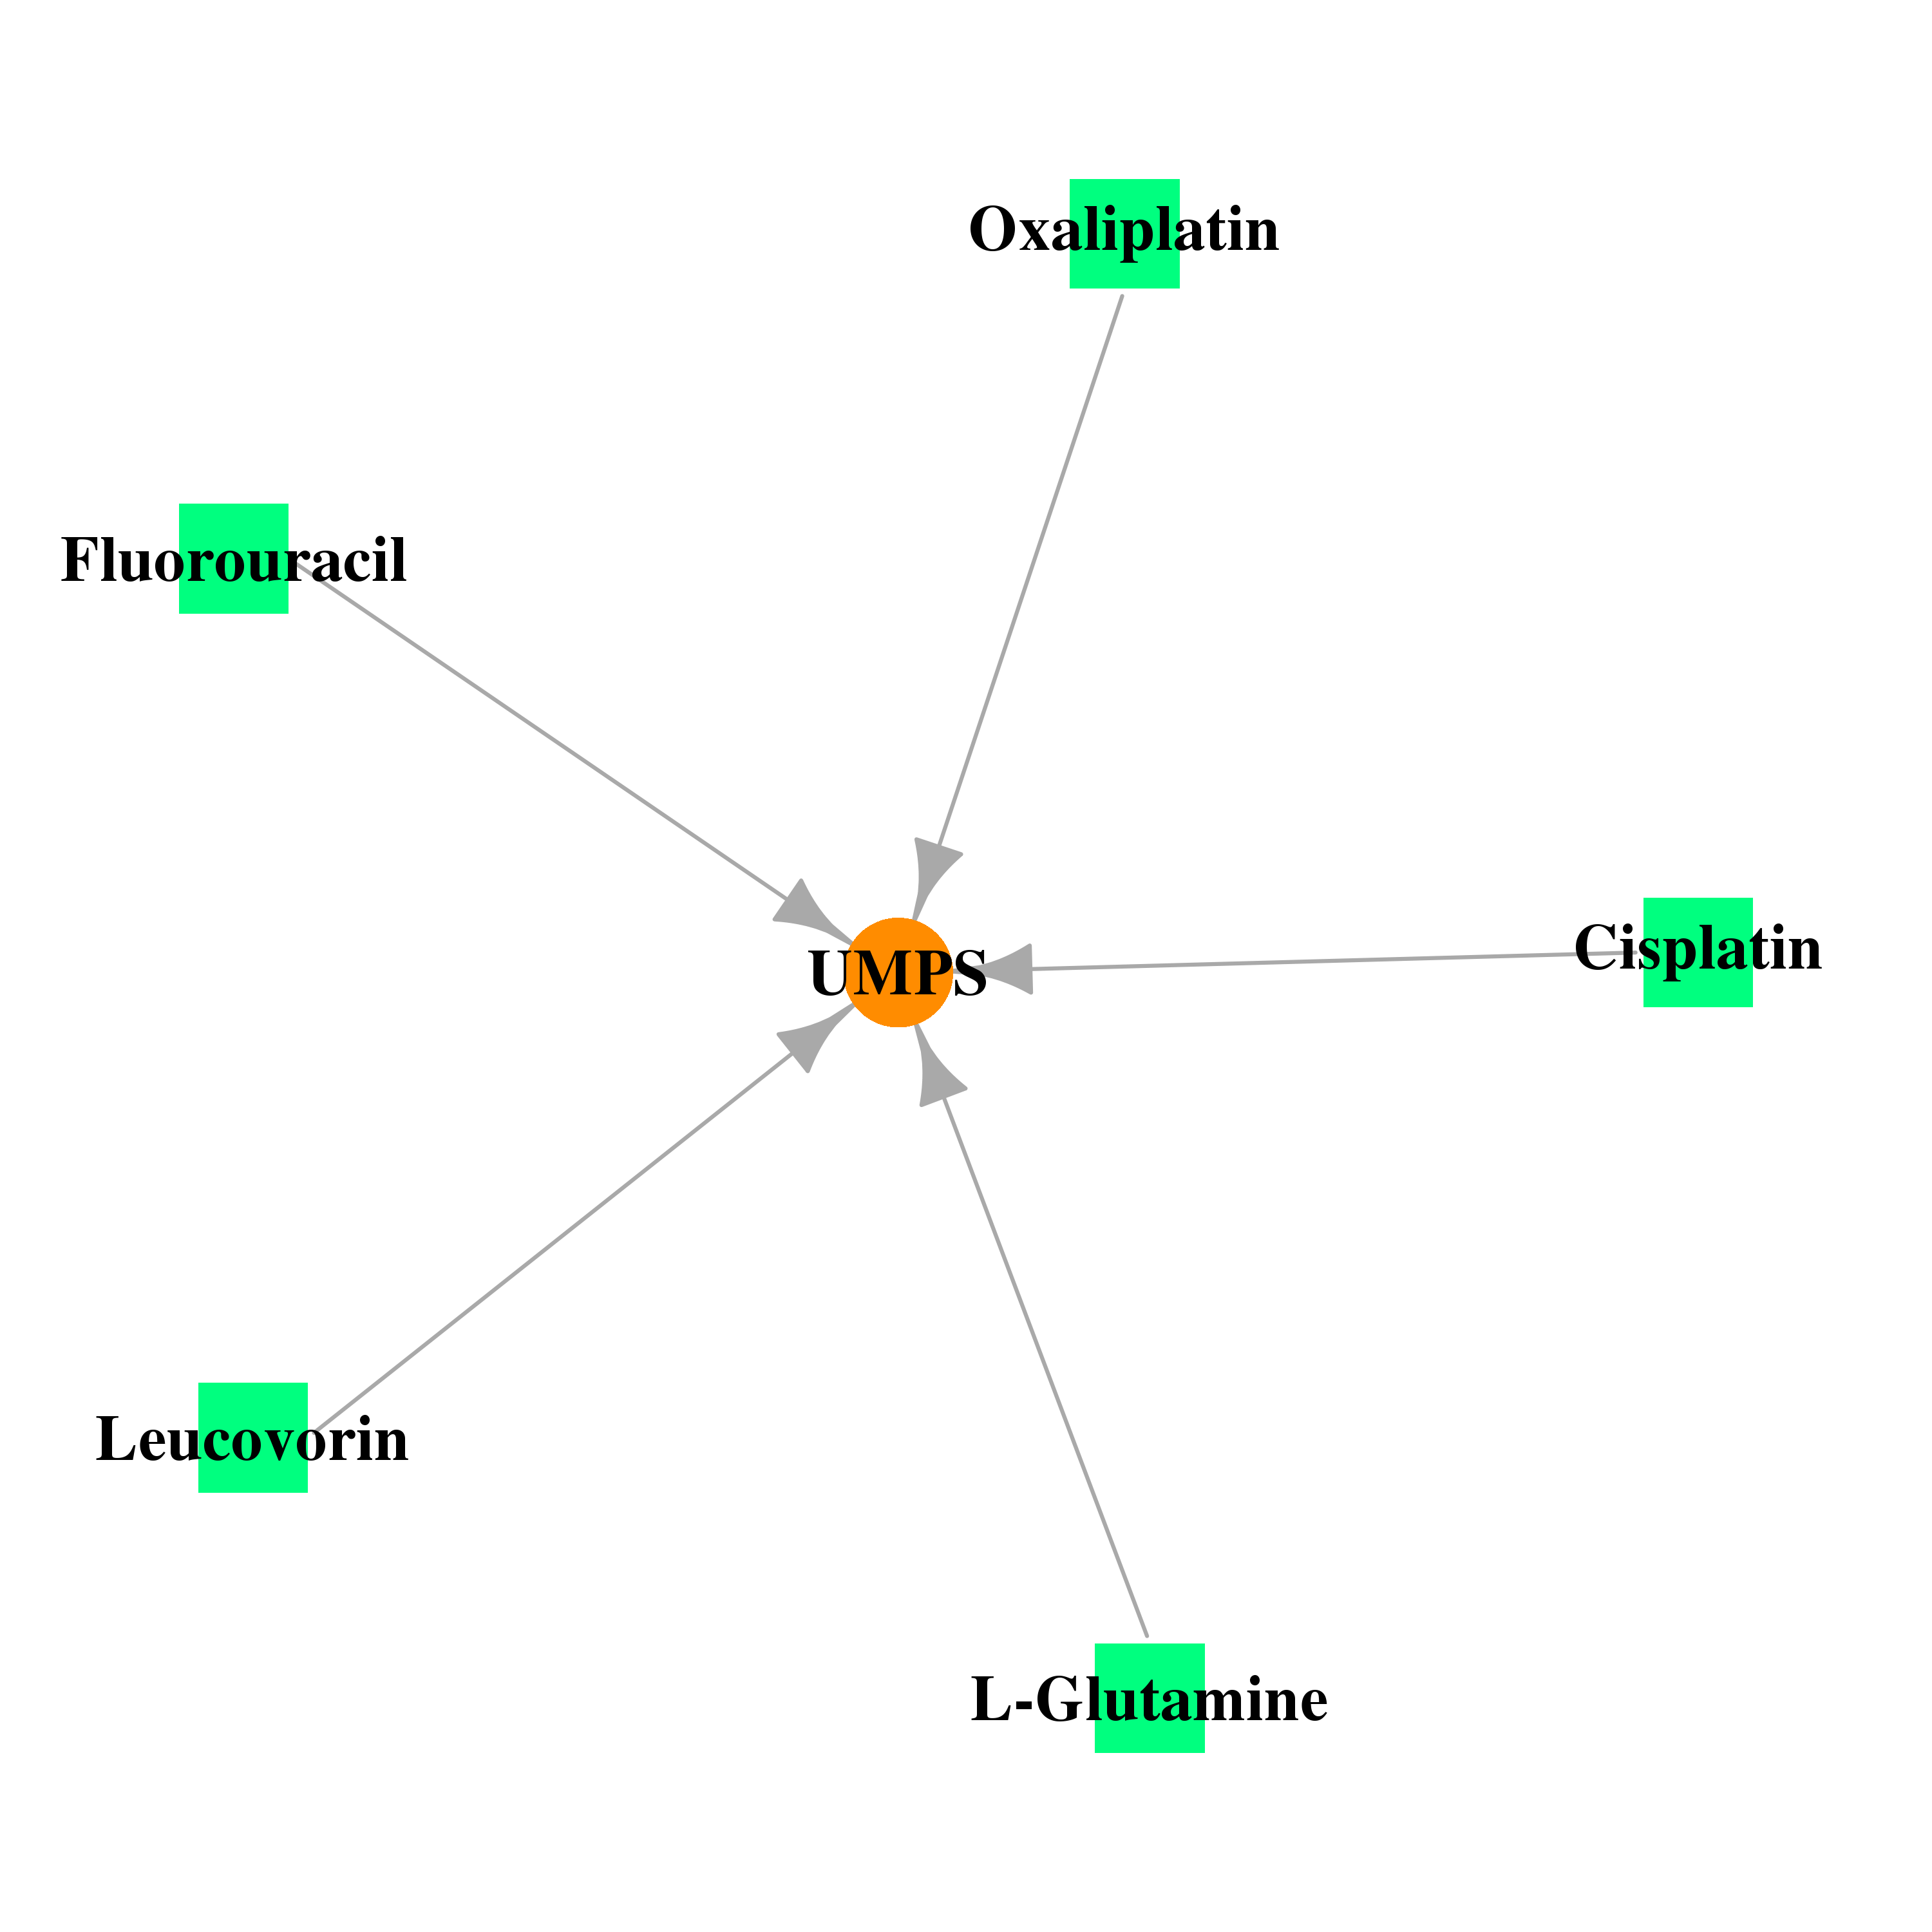 |
| * Drug Centered Interaction Network. |
| DrugBank ID | Target Name | Drug Groups | Generic Name | Drug Centered Network | Drug Structure |
| DB00515 | uridine monophosphate synthetase | approved | Cisplatin |  |  |
| DB00544 | uridine monophosphate synthetase | approved | Fluorouracil |  |  |
| DB00526 | uridine monophosphate synthetase | approved; investigational | Oxaliplatin | 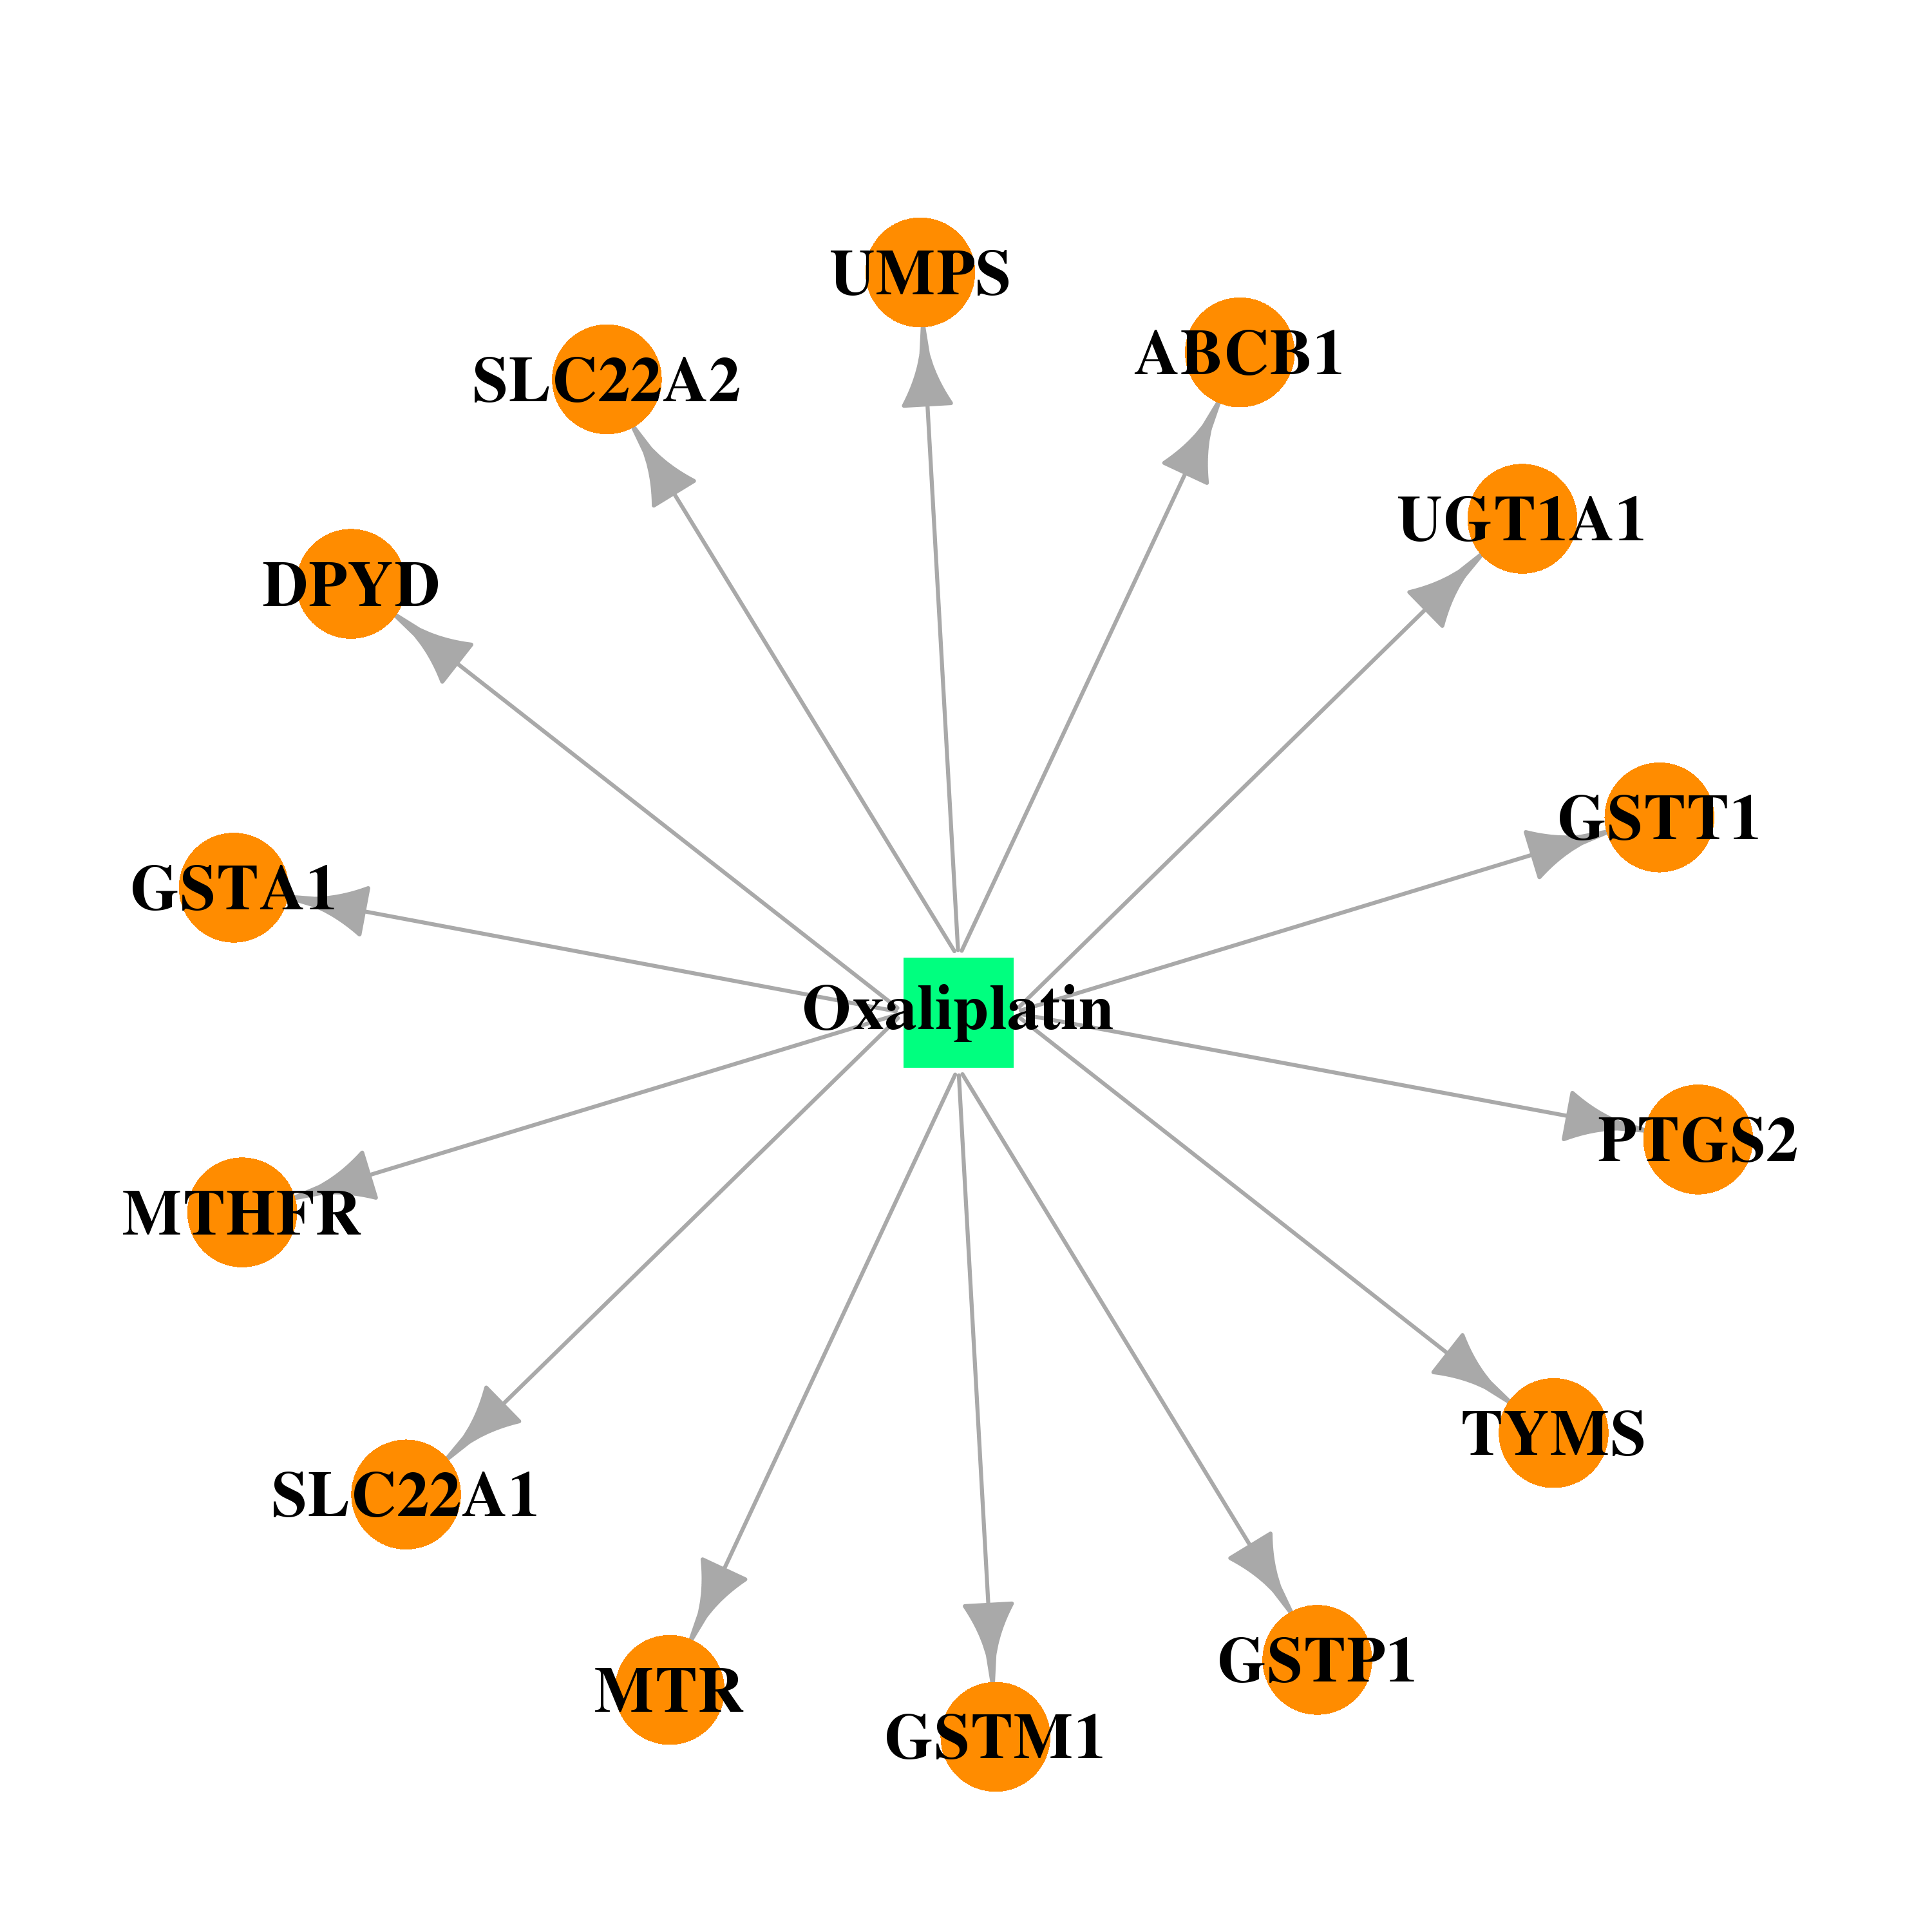 | 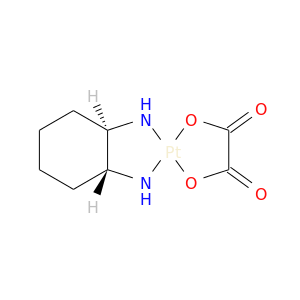 |
| DB00130 | uridine monophosphate synthetase | approved; nutraceutical; investigational | L-Glutamine |  |  |
| DB00650 | uridine monophosphate synthetase | approved | Leucovorin | 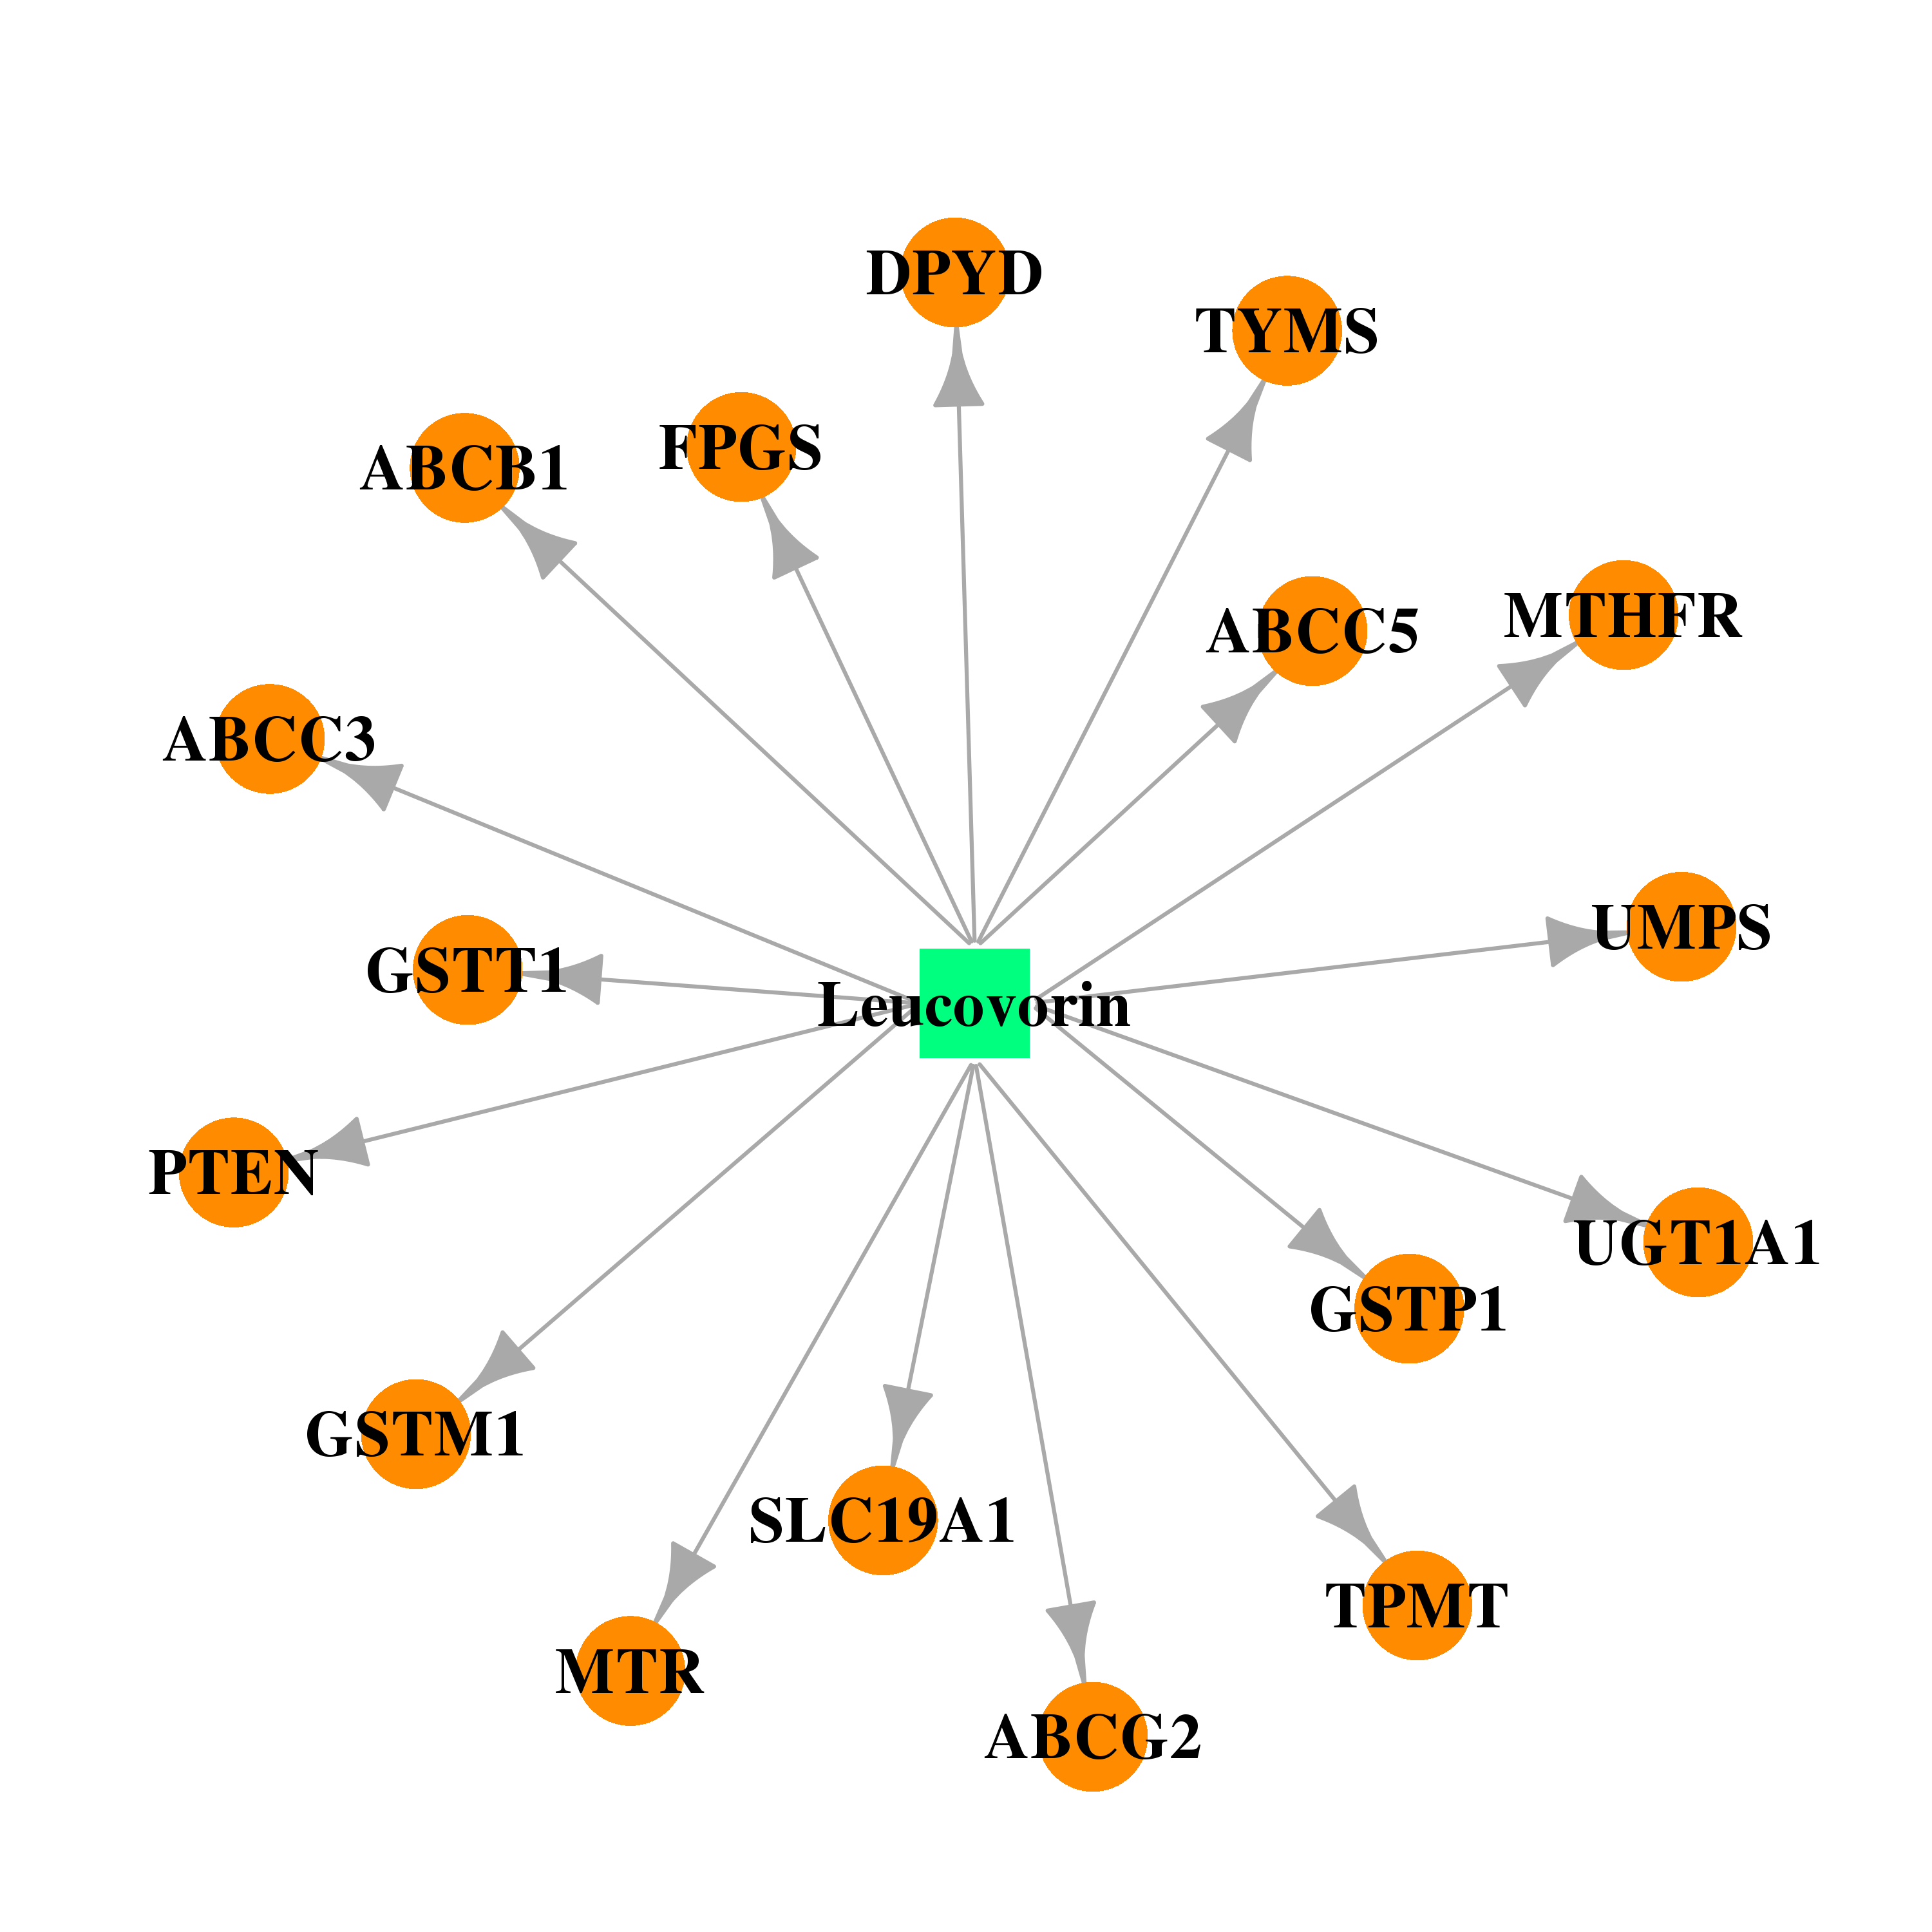 |  |
| Top |
| Cross referenced IDs for UMPS |
| * We obtained these cross-references from Uniprot database. It covers 150 different DBs, 18 categories. http://www.uniprot.org/help/cross_references_section |
: Open all cross reference information
|
Copyright © 2016-Present - The Univsersity of Texas Health Science Center at Houston @ |