|
||||||||||||||||||||
| |
| Phenotypic Information (metabolism pathway, cancer, disease, phenome) |
| |
| |
| Gene-Gene Network Information: Co-Expression Network, Interacting Genes & KEGG |
| |
|


| Gene Summary for UROD |
| Basic gene info. | Gene symbol | UROD |
| Gene name | uroporphyrinogen decarboxylase | |
| Synonyms | PCT|UPD | |
| Cytomap | UCSC genome browser: 1p34 | |
| Genomic location | chr1 :45477804-45481341 | |
| Type of gene | protein-coding | |
| RefGenes | NM_000374.4, NR_036510.1, | |
| Ensembl id | ENSG00000126088 | |
| Description | uroporphyrinogen III decarboxylase | |
| Modification date | 20141219 | |
| dbXrefs | MIM : 613521 | |
| HGNC : HGNC | ||
| Ensembl : ENSG00000126088 | ||
| HPRD : 01441 | ||
| Vega : OTTHUMG00000008949 | ||
| Protein | UniProt: go to UniProt's Cross Reference DB Table | |
| Expression | CleanEX: HS_UROD | |
| BioGPS: 7389 | ||
| Gene Expression Atlas: ENSG00000126088 | ||
| The Human Protein Atlas: ENSG00000126088 | ||
| Pathway | NCI Pathway Interaction Database: UROD | |
| KEGG: UROD | ||
| REACTOME: UROD | ||
| ConsensusPathDB | ||
| Pathway Commons: UROD | ||
| Metabolism | MetaCyc: UROD | |
| HUMANCyc: UROD | ||
| Regulation | Ensembl's Regulation: ENSG00000126088 | |
| miRBase: chr1 :45,477,804-45,481,341 | ||
| TargetScan: NM_000374 | ||
| cisRED: ENSG00000126088 | ||
| Context | iHOP: UROD | |
| cancer metabolism search in PubMed: UROD | ||
| UCL Cancer Institute: UROD | ||
| Assigned class in ccmGDB | C | |
| Top |
| Phenotypic Information for UROD(metabolism pathway, cancer, disease, phenome) |
| Cancer | CGAP: UROD |
| Familial Cancer Database: UROD | |
| * This gene is included in those cancer gene databases. |
|
|
|
|
|
| . | ||||||||||||||
Oncogene 1 | Significant driver gene in | |||||||||||||||||||
| cf) number; DB name 1 Oncogene; http://nar.oxfordjournals.org/content/35/suppl_1/D721.long, 2 Tumor Suppressor gene; https://bioinfo.uth.edu/TSGene/, 3 Cancer Gene Census; http://www.nature.com/nrc/journal/v4/n3/abs/nrc1299.html, 4 CancerGenes; http://nar.oxfordjournals.org/content/35/suppl_1/D721.long, 5 Network of Cancer Gene; http://ncg.kcl.ac.uk/index.php, 1Therapeutic Vulnerabilities in Cancer; http://cbio.mskcc.org/cancergenomics/statius/ |
| KEGG_PORPHYRIN_AND_CHLOROPHYLL_METABOLISM REACTOME_METABOLISM_OF_PORPHYRINS | |
| OMIM | |
| Orphanet | |
| Disease | KEGG Disease: UROD |
| MedGen: UROD (Human Medical Genetics with Condition) | |
| ClinVar: UROD | |
| Phenotype | MGI: UROD (International Mouse Phenotyping Consortium) |
| PhenomicDB: UROD | |
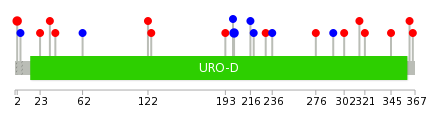
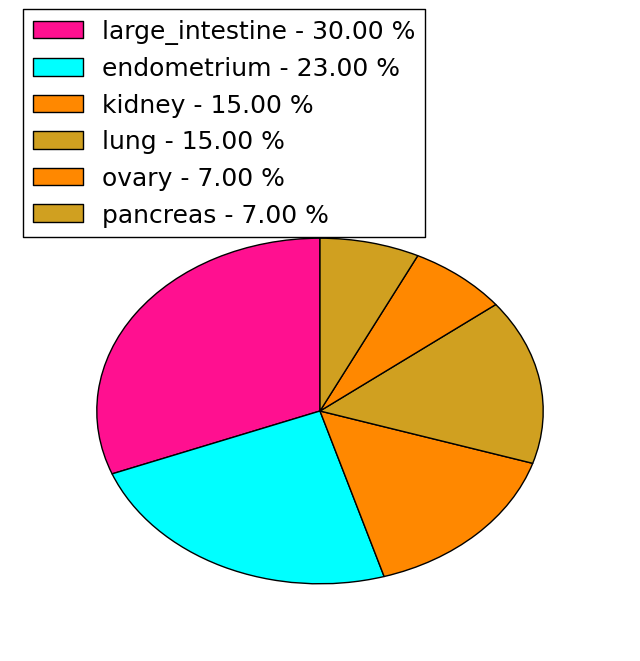
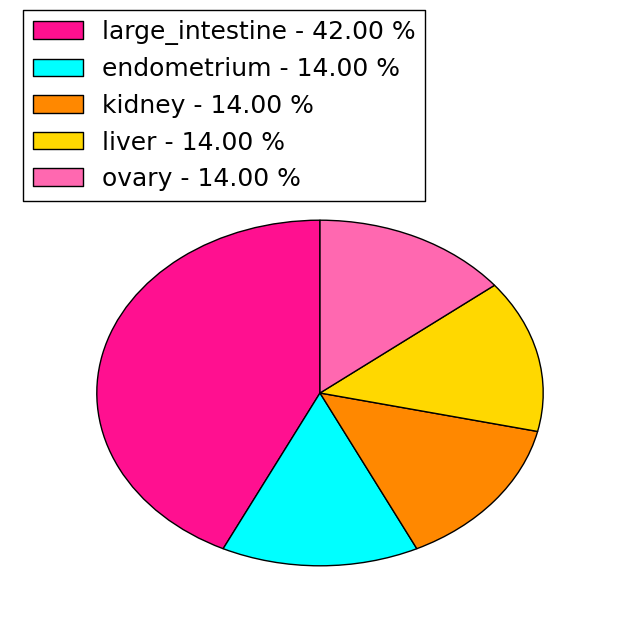
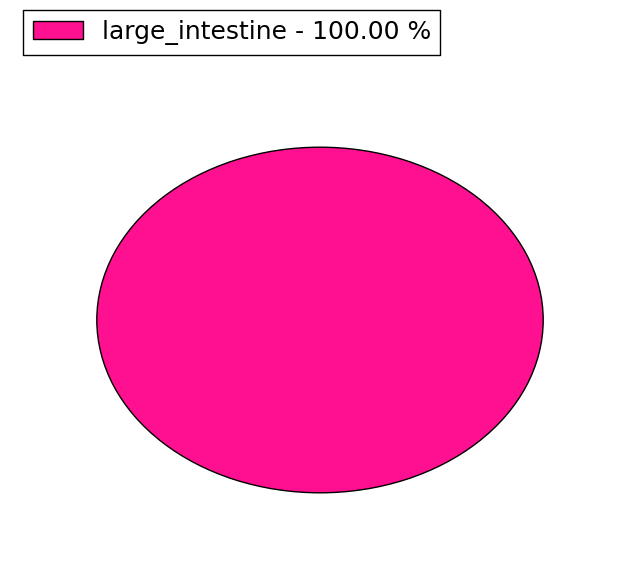
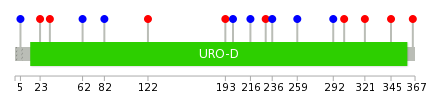
| Mutations for UROD |
| * Under tables are showing count per each tissue to give us broad intuition about tissue specific mutation patterns.You can go to the detailed page for each mutation database's web site. |
| There's no structural variation information in COSMIC data for this gene. |
| * From mRNA Sanger sequences, Chitars2.0 arranged chimeric transcripts. This table shows UROD related fusion information. |
| ID | Head Gene | Tail Gene | Accession | Gene_a | qStart_a | qEnd_a | Chromosome_a | tStart_a | tEnd_a | Gene_a | qStart_a | qEnd_a | Chromosome_a | tStart_a | tEnd_a |
| BU157543 | NSRP1 | 184 | 209 | 17 | 28503625 | 28503653 | UROD | 210 | 646 | 1 | 45478873 | 45479740 | |
| AA368910 | UROD | 1 | 204 | 1 | 45481049 | 45481492 | UROD | 194 | 335 | 1 | 45479387 | 45479642 | |
| AW385230 | UROD | 1 | 65 | 1 | 45480445 | 45480509 | MCM3AP-AS1 | 61 | 483 | 21 | 47654247 | 47654670 | |
| BE772547 | HIPK1 | 1 | 319 | 1 | 114515938 | 114516256 | UROD | 316 | 530 | 1 | 45480619 | 45481163 | |
| BE772548 | HIPK1 | 4 | 338 | 1 | 114515938 | 114516275 | UROD | 335 | 557 | 1 | 45480619 | 45481171 | |
| BM718816 | LMO4 | 17 | 156 | 1 | 87810949 | 87811091 | UROD | 149 | 220 | 1 | 45481176 | 45481247 | |
| Top |
| There's no copy number variation information in COSMIC data for this gene. |
| Top |
|
 |
| Top |
| Stat. for Non-Synonymous SNVs (# total SNVs=13) | (# total SNVs=7) |
 |  |
(# total SNVs=0) | (# total SNVs=1) |
 |
| Top |
| * When you move the cursor on each content, you can see more deailed mutation information on the Tooltip. Those are primary_site,primary_histology,mutation(aa),pubmedID. |
| GRCh37 position | Mutation(aa) | Unique sampleID count |
| chr1:45477941-45477941 | p.E2K | 2 |
| chr1:45479709-45479709 | p.P201P | 2 |
| chr1:45480459-45480459 | p.G276C | 1 |
| chr1:45479413-45479413 | p.R142* | 1 |
| chr1:45480612-45480612 | p.R292R | 1 |
| chr1:45479419-45479419 | p.R144* | 1 |
| chr1:45480642-45480642 | p.Q302H | 1 |
| chr1:45479683-45479683 | p.R193C | 1 |
| chr1:45480657-45480658 | p.C308fs*7 | 1 |
| chr1:45479706-45479706 | p.V200V | 1 |
| Top |
|
 |
| Point Mutation/ Tissue ID | 1 | 2 | 3 | 4 | 5 | 6 | 7 | 8 | 9 | 10 | 11 | 12 | 13 | 14 | 15 | 16 | 17 | 18 | 19 | 20 |
| # sample | 1 | 4 | 3 | 2 | 1 | 1 | 2 | 1 | 1 | 1 | ||||||||||
| # mutation | 1 | 4 | 3 | 2 | 1 | 1 | 2 | 1 | 1 | 1 | ||||||||||
| nonsynonymous SNV | 2 | 1 | 1 | 1 | 1 | 1 | 1 | 1 | ||||||||||||
| synonymous SNV | 1 | 2 | 2 | 1 | 1 | 1 |
| cf) Tissue ID; Tissue type (1; BLCA[Bladder Urothelial Carcinoma], 2; BRCA[Breast invasive carcinoma], 3; CESC[Cervical squamous cell carcinoma and endocervical adenocarcinoma], 4; COAD[Colon adenocarcinoma], 5; GBM[Glioblastoma multiforme], 6; Glioma Low Grade, 7; HNSC[Head and Neck squamous cell carcinoma], 8; KICH[Kidney Chromophobe], 9; KIRC[Kidney renal clear cell carcinoma], 10; KIRP[Kidney renal papillary cell carcinoma], 11; LAML[Acute Myeloid Leukemia], 12; LUAD[Lung adenocarcinoma], 13; LUSC[Lung squamous cell carcinoma], 14; OV[Ovarian serous cystadenocarcinoma ], 15; PAAD[Pancreatic adenocarcinoma], 16; PRAD[Prostate adenocarcinoma], 17; SKCM[Skin Cutaneous Melanoma], 18:STAD[Stomach adenocarcinoma], 19:THCA[Thyroid carcinoma], 20:UCEC[Uterine Corpus Endometrial Carcinoma]) |
| Top |
| * We represented just top 10 SNVs. When you move the cursor on each content, you can see more deailed mutation information on the Tooltip. Those are primary_site, primary_histology, mutation(aa), pubmedID. |
| Genomic Position | Mutation(aa) | Unique sampleID count |
| chr1:45480122 | p.I259I | 1 |
| chr1:45480162 | p.R292R | 1 |
| chr1:45480182 | p.Q302H | 1 |
| chr1:45477952 | p.V321M | 1 |
| chr1:45480410 | p.M345V | 1 |
| chr1:45478626 | p.G5G | 1 |
| chr1:45480612 | p.R365Q | 1 |
| chr1:45478653 | p.A23V | 1 |
| chr1:45480642 | p.P32L | 1 |
| chr1:45478860 | p.P62P | 1 |
| * Copy number data were extracted from TCGA using R package TCGA-Assembler. The URLs of all public data files on TCGA DCC data server were gathered on Jan-05-2015. Function ProcessCNAData in TCGA-Assembler package was used to obtain gene-level copy number value which is calculated as the average copy number of the genomic region of a gene. |
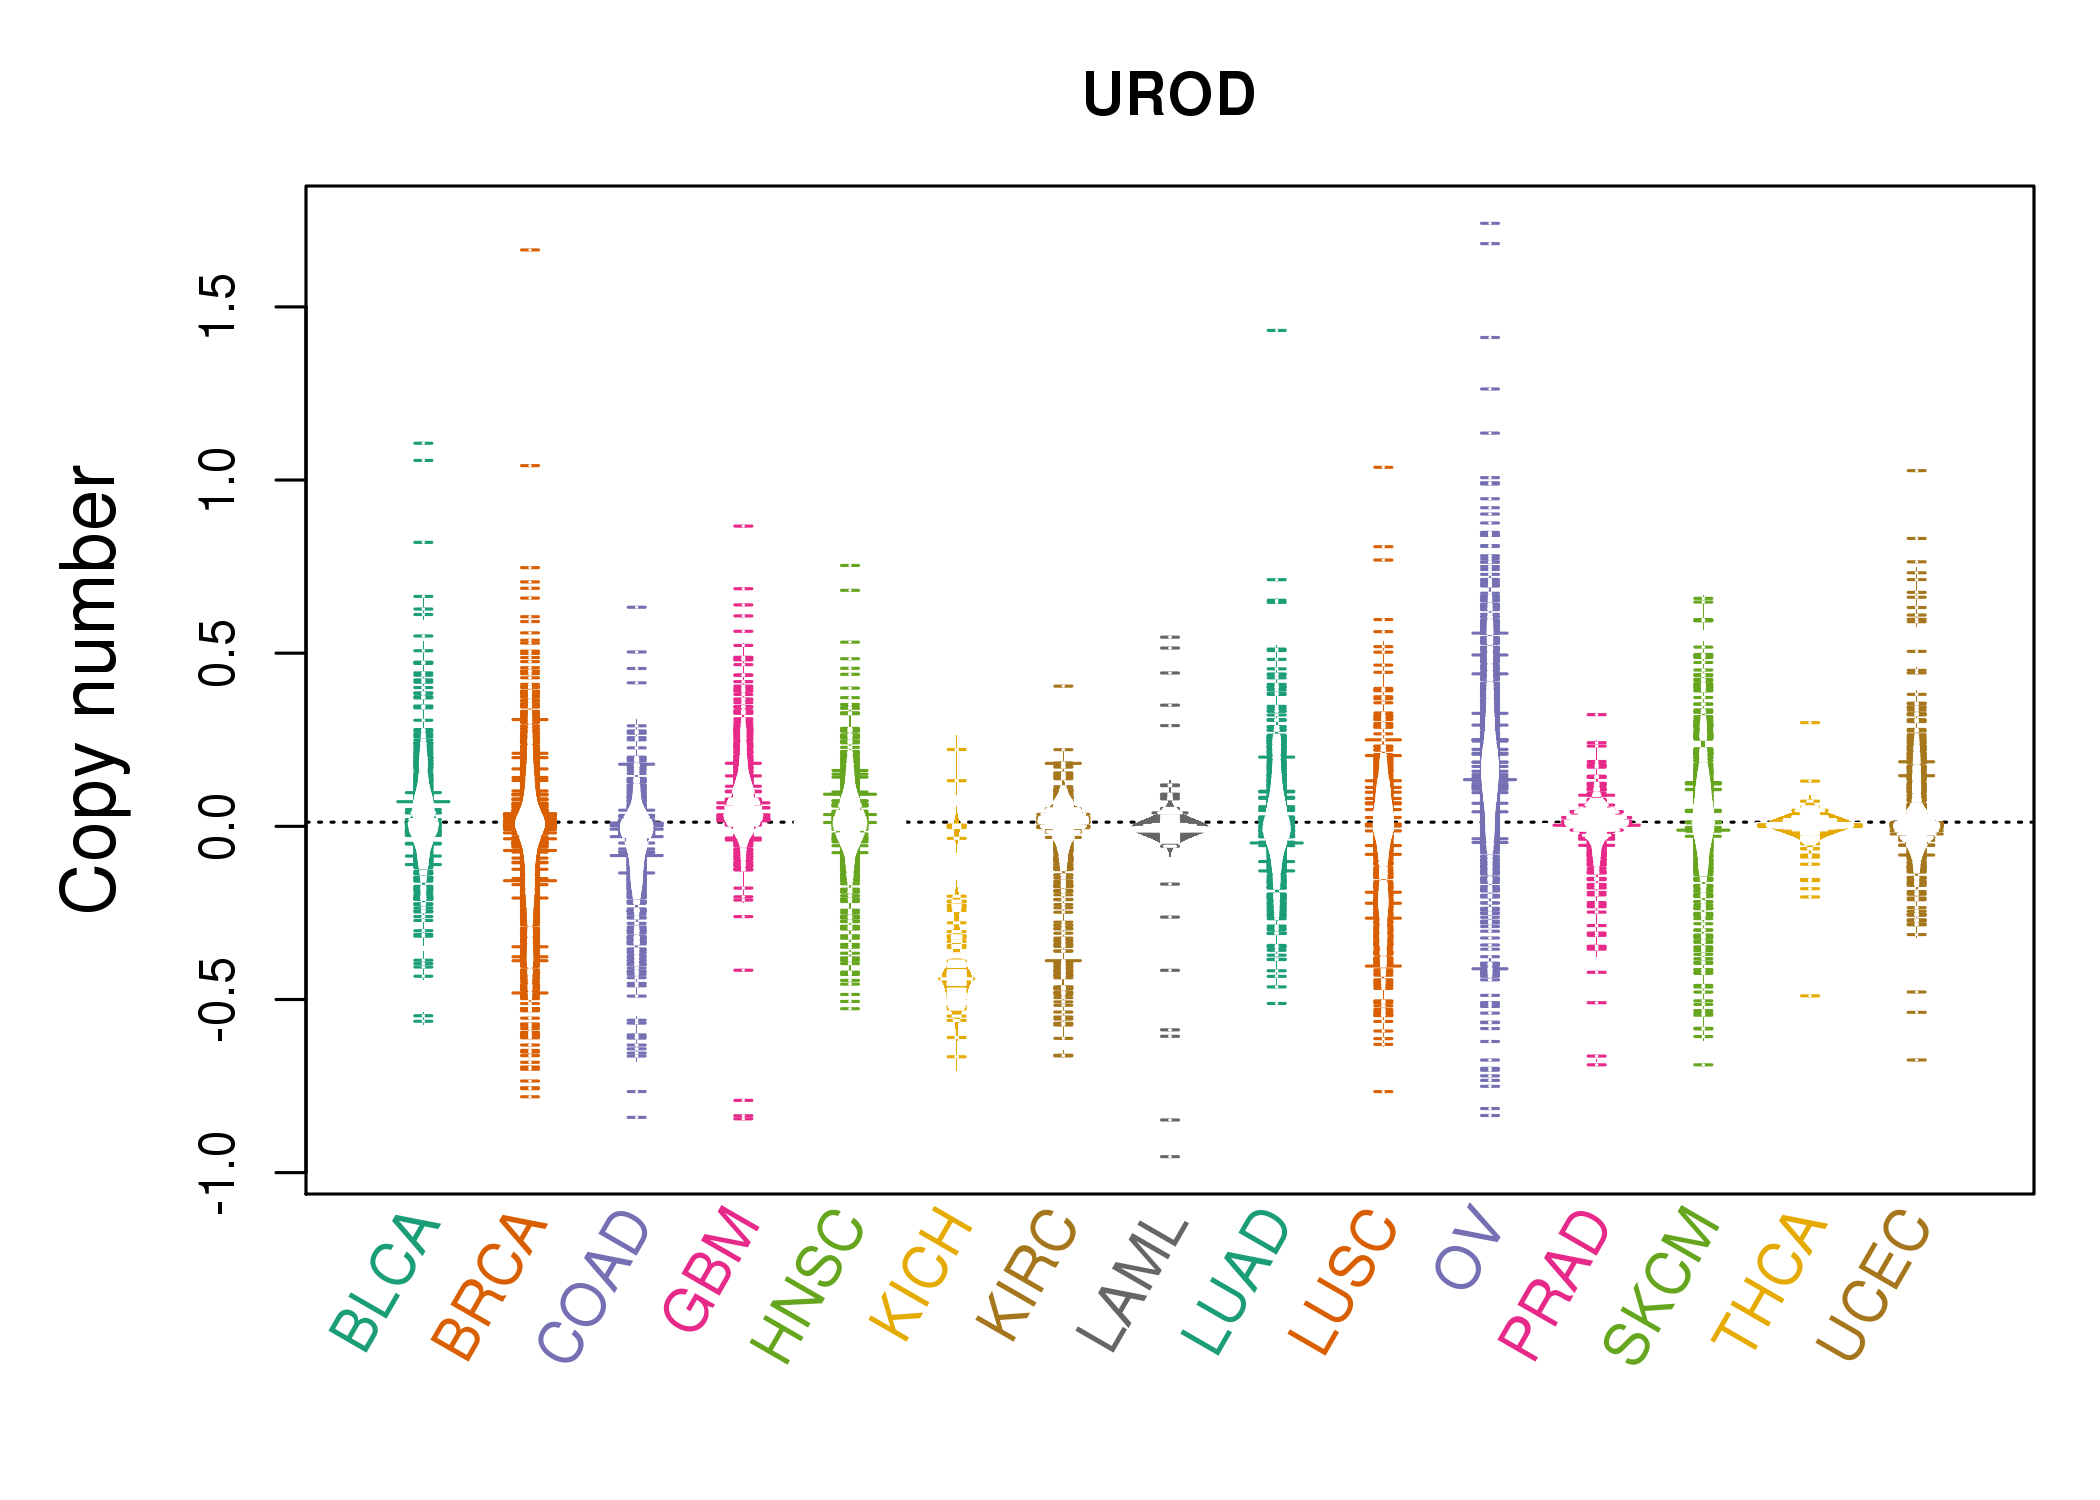 |
| cf) Tissue ID[Tissue type]: BLCA[Bladder Urothelial Carcinoma], BRCA[Breast invasive carcinoma], CESC[Cervical squamous cell carcinoma and endocervical adenocarcinoma], COAD[Colon adenocarcinoma], GBM[Glioblastoma multiforme], Glioma Low Grade, HNSC[Head and Neck squamous cell carcinoma], KICH[Kidney Chromophobe], KIRC[Kidney renal clear cell carcinoma], KIRP[Kidney renal papillary cell carcinoma], LAML[Acute Myeloid Leukemia], LUAD[Lung adenocarcinoma], LUSC[Lung squamous cell carcinoma], OV[Ovarian serous cystadenocarcinoma ], PAAD[Pancreatic adenocarcinoma], PRAD[Prostate adenocarcinoma], SKCM[Skin Cutaneous Melanoma], STAD[Stomach adenocarcinoma], THCA[Thyroid carcinoma], UCEC[Uterine Corpus Endometrial Carcinoma] |
| Top |
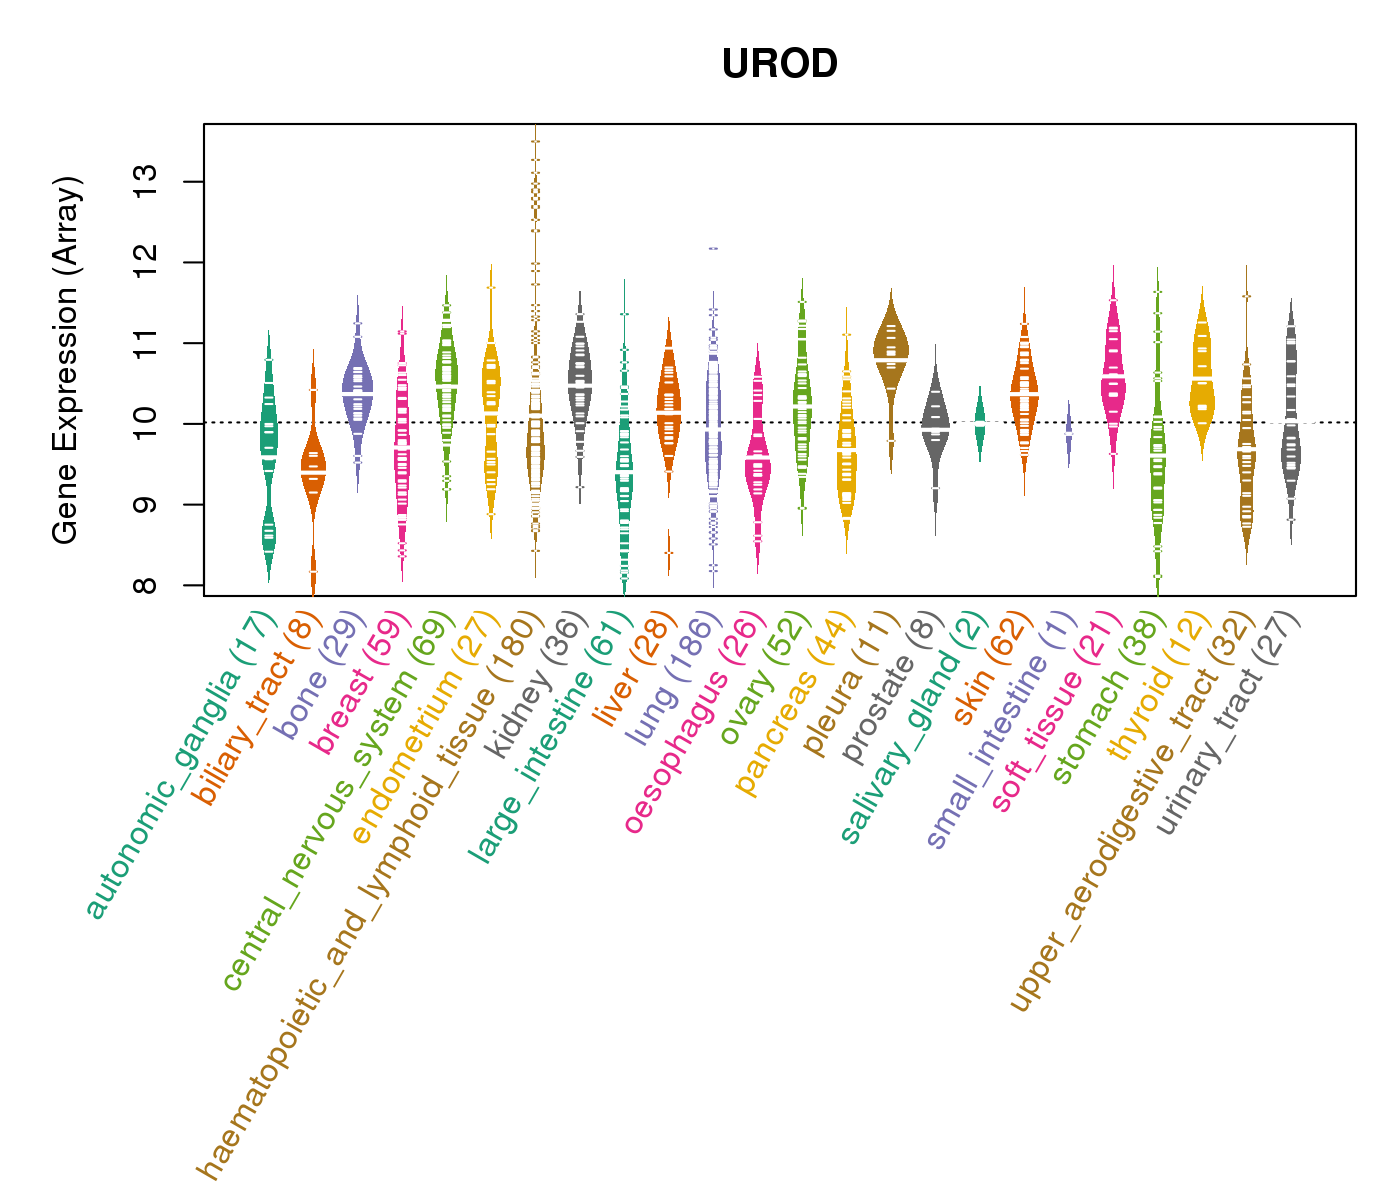
| Gene Expression for UROD |
| * CCLE gene expression data were extracted from CCLE_Expression_Entrez_2012-10-18.res: Gene-centric RMA-normalized mRNA expression data. |
 |
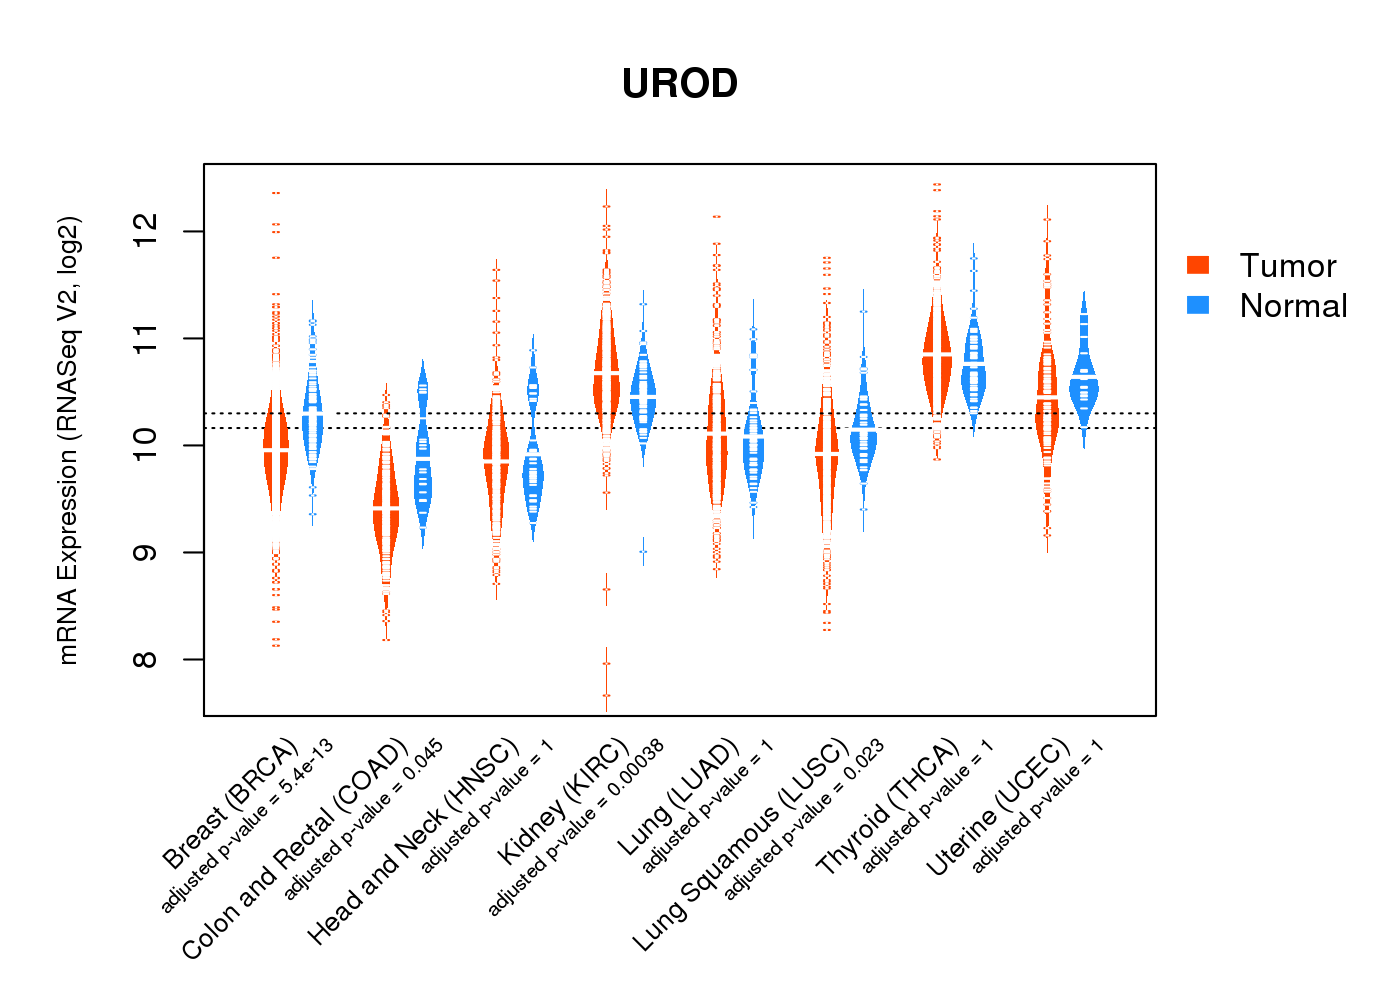
| * Normalized gene expression data of RNASeqV2 was extracted from TCGA using R package TCGA-Assembler. The URLs of all public data files on TCGA DCC data server were gathered at Jan-05-2015. Only eight cancer types have enough normal control samples for differential expression analysis. (t test, adjusted p<0.05 (using Benjamini-Hochberg FDR)) |
 |
| Top |
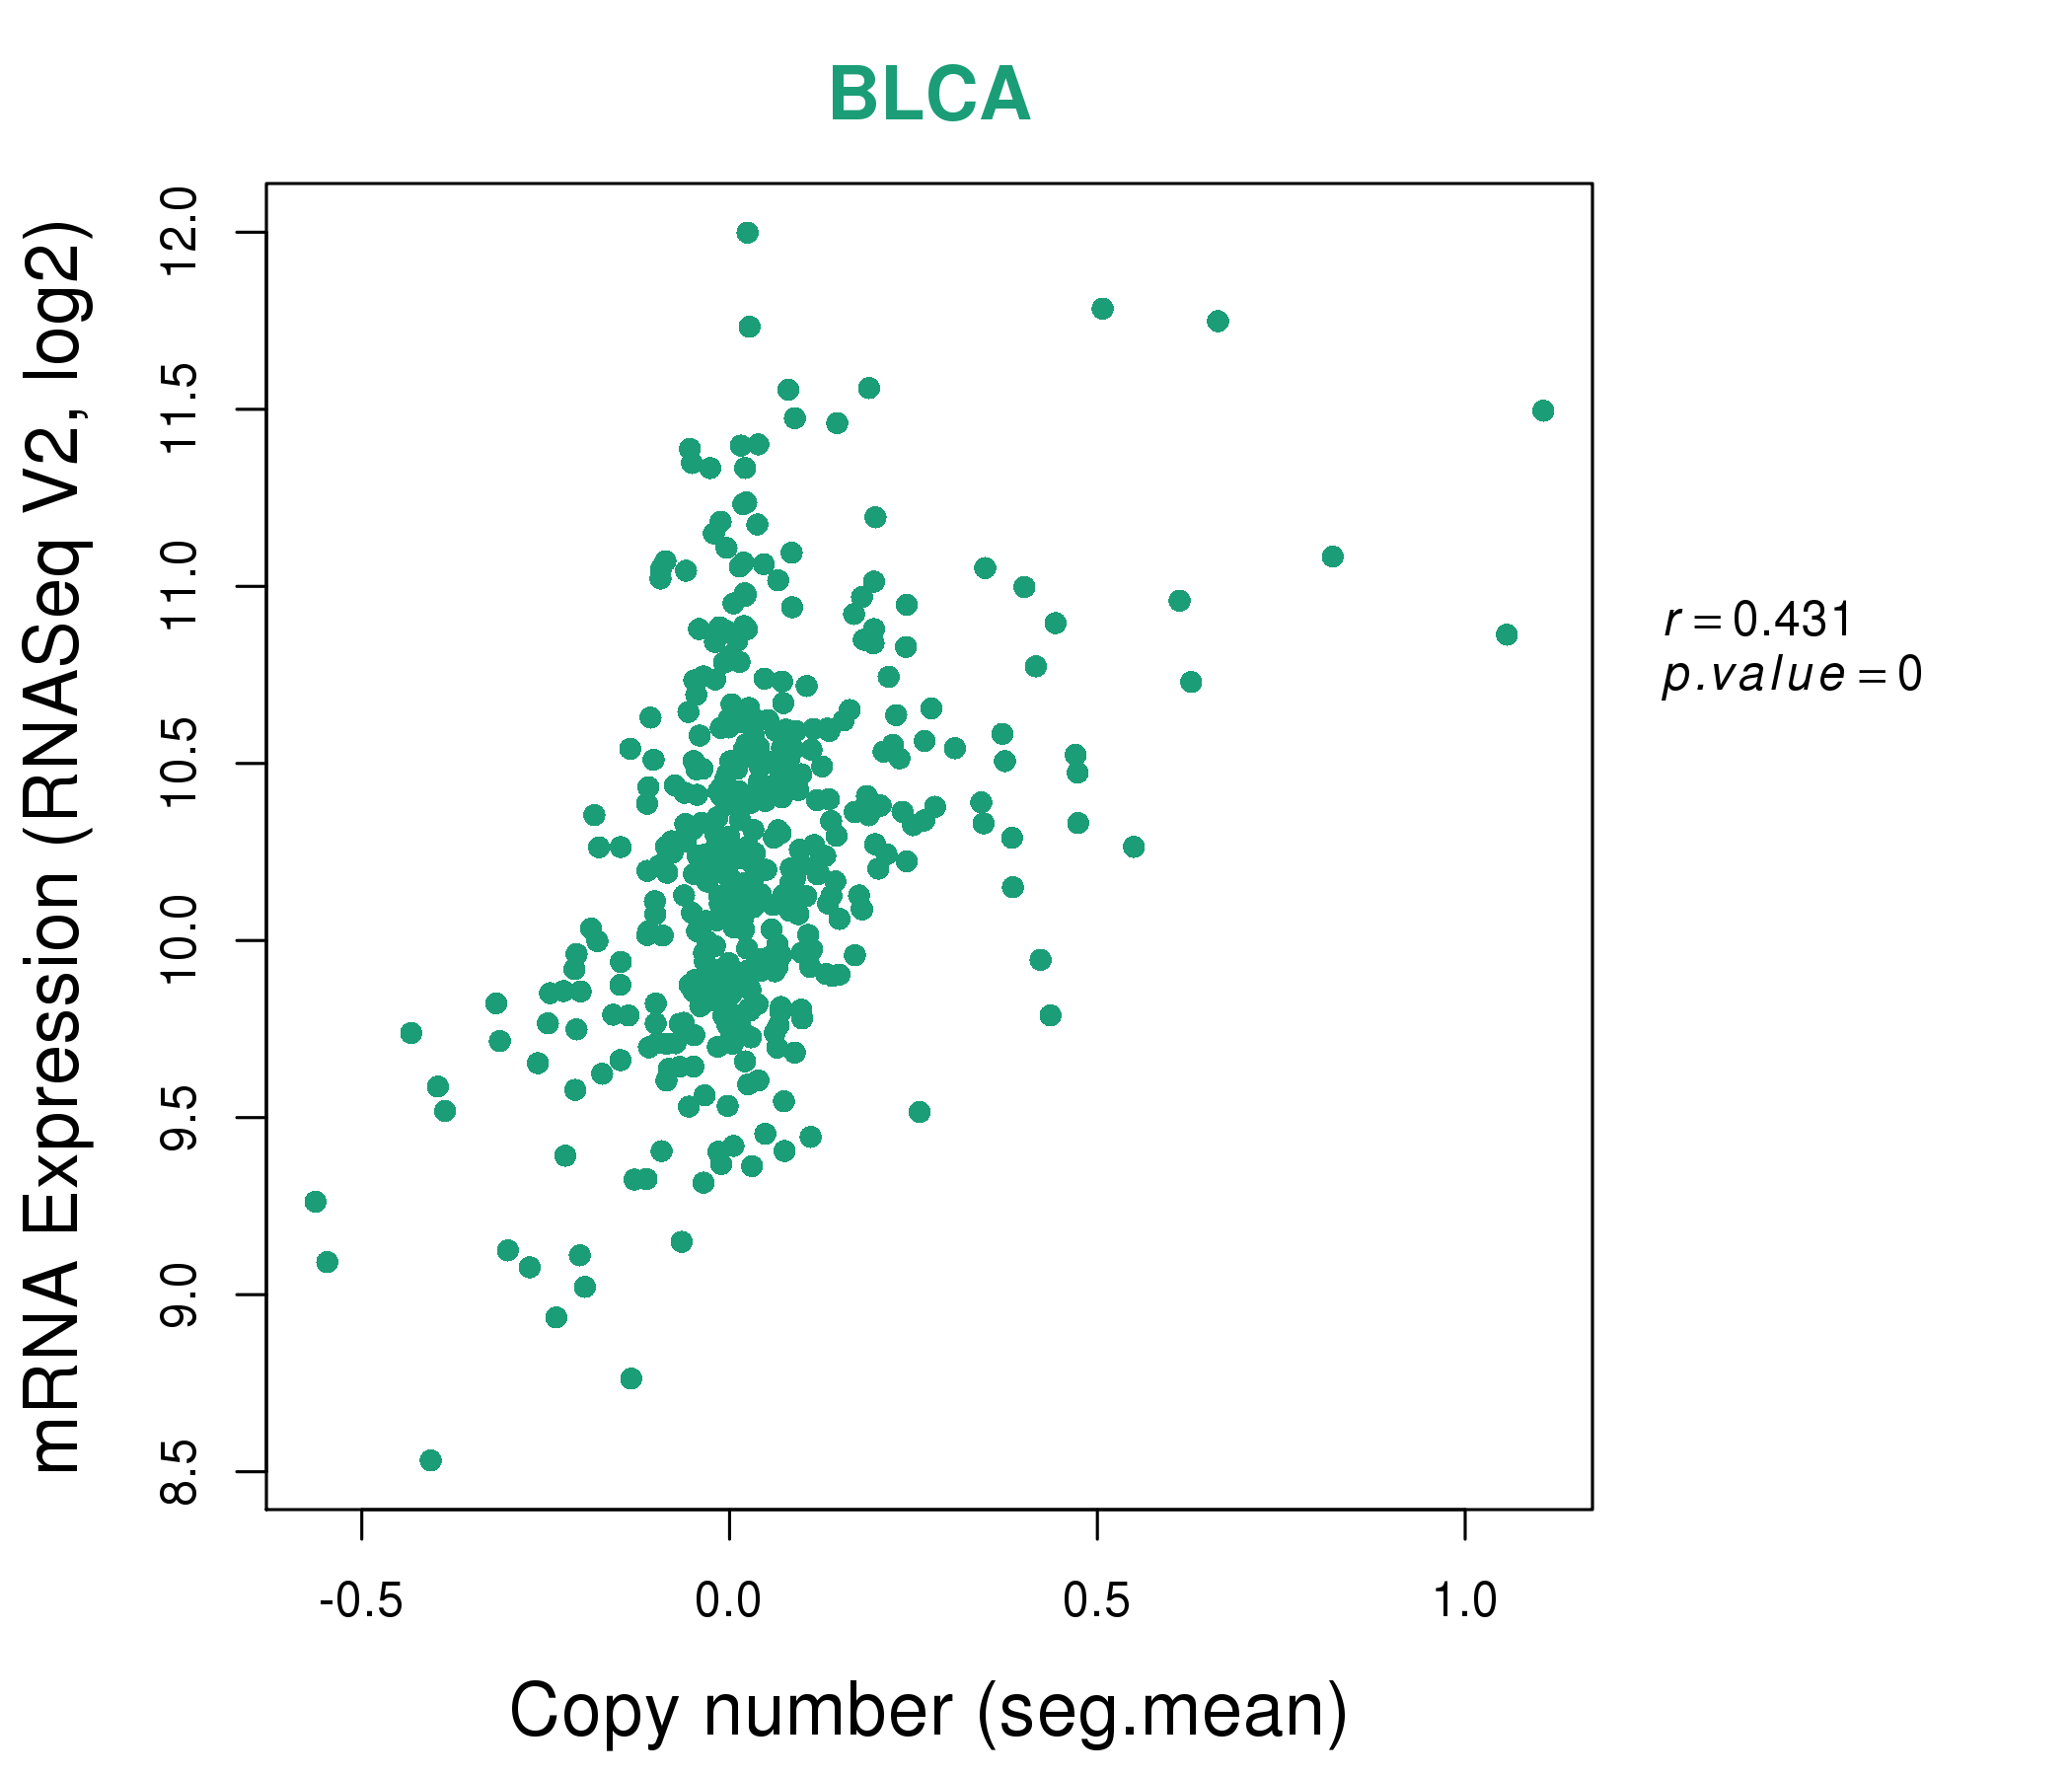
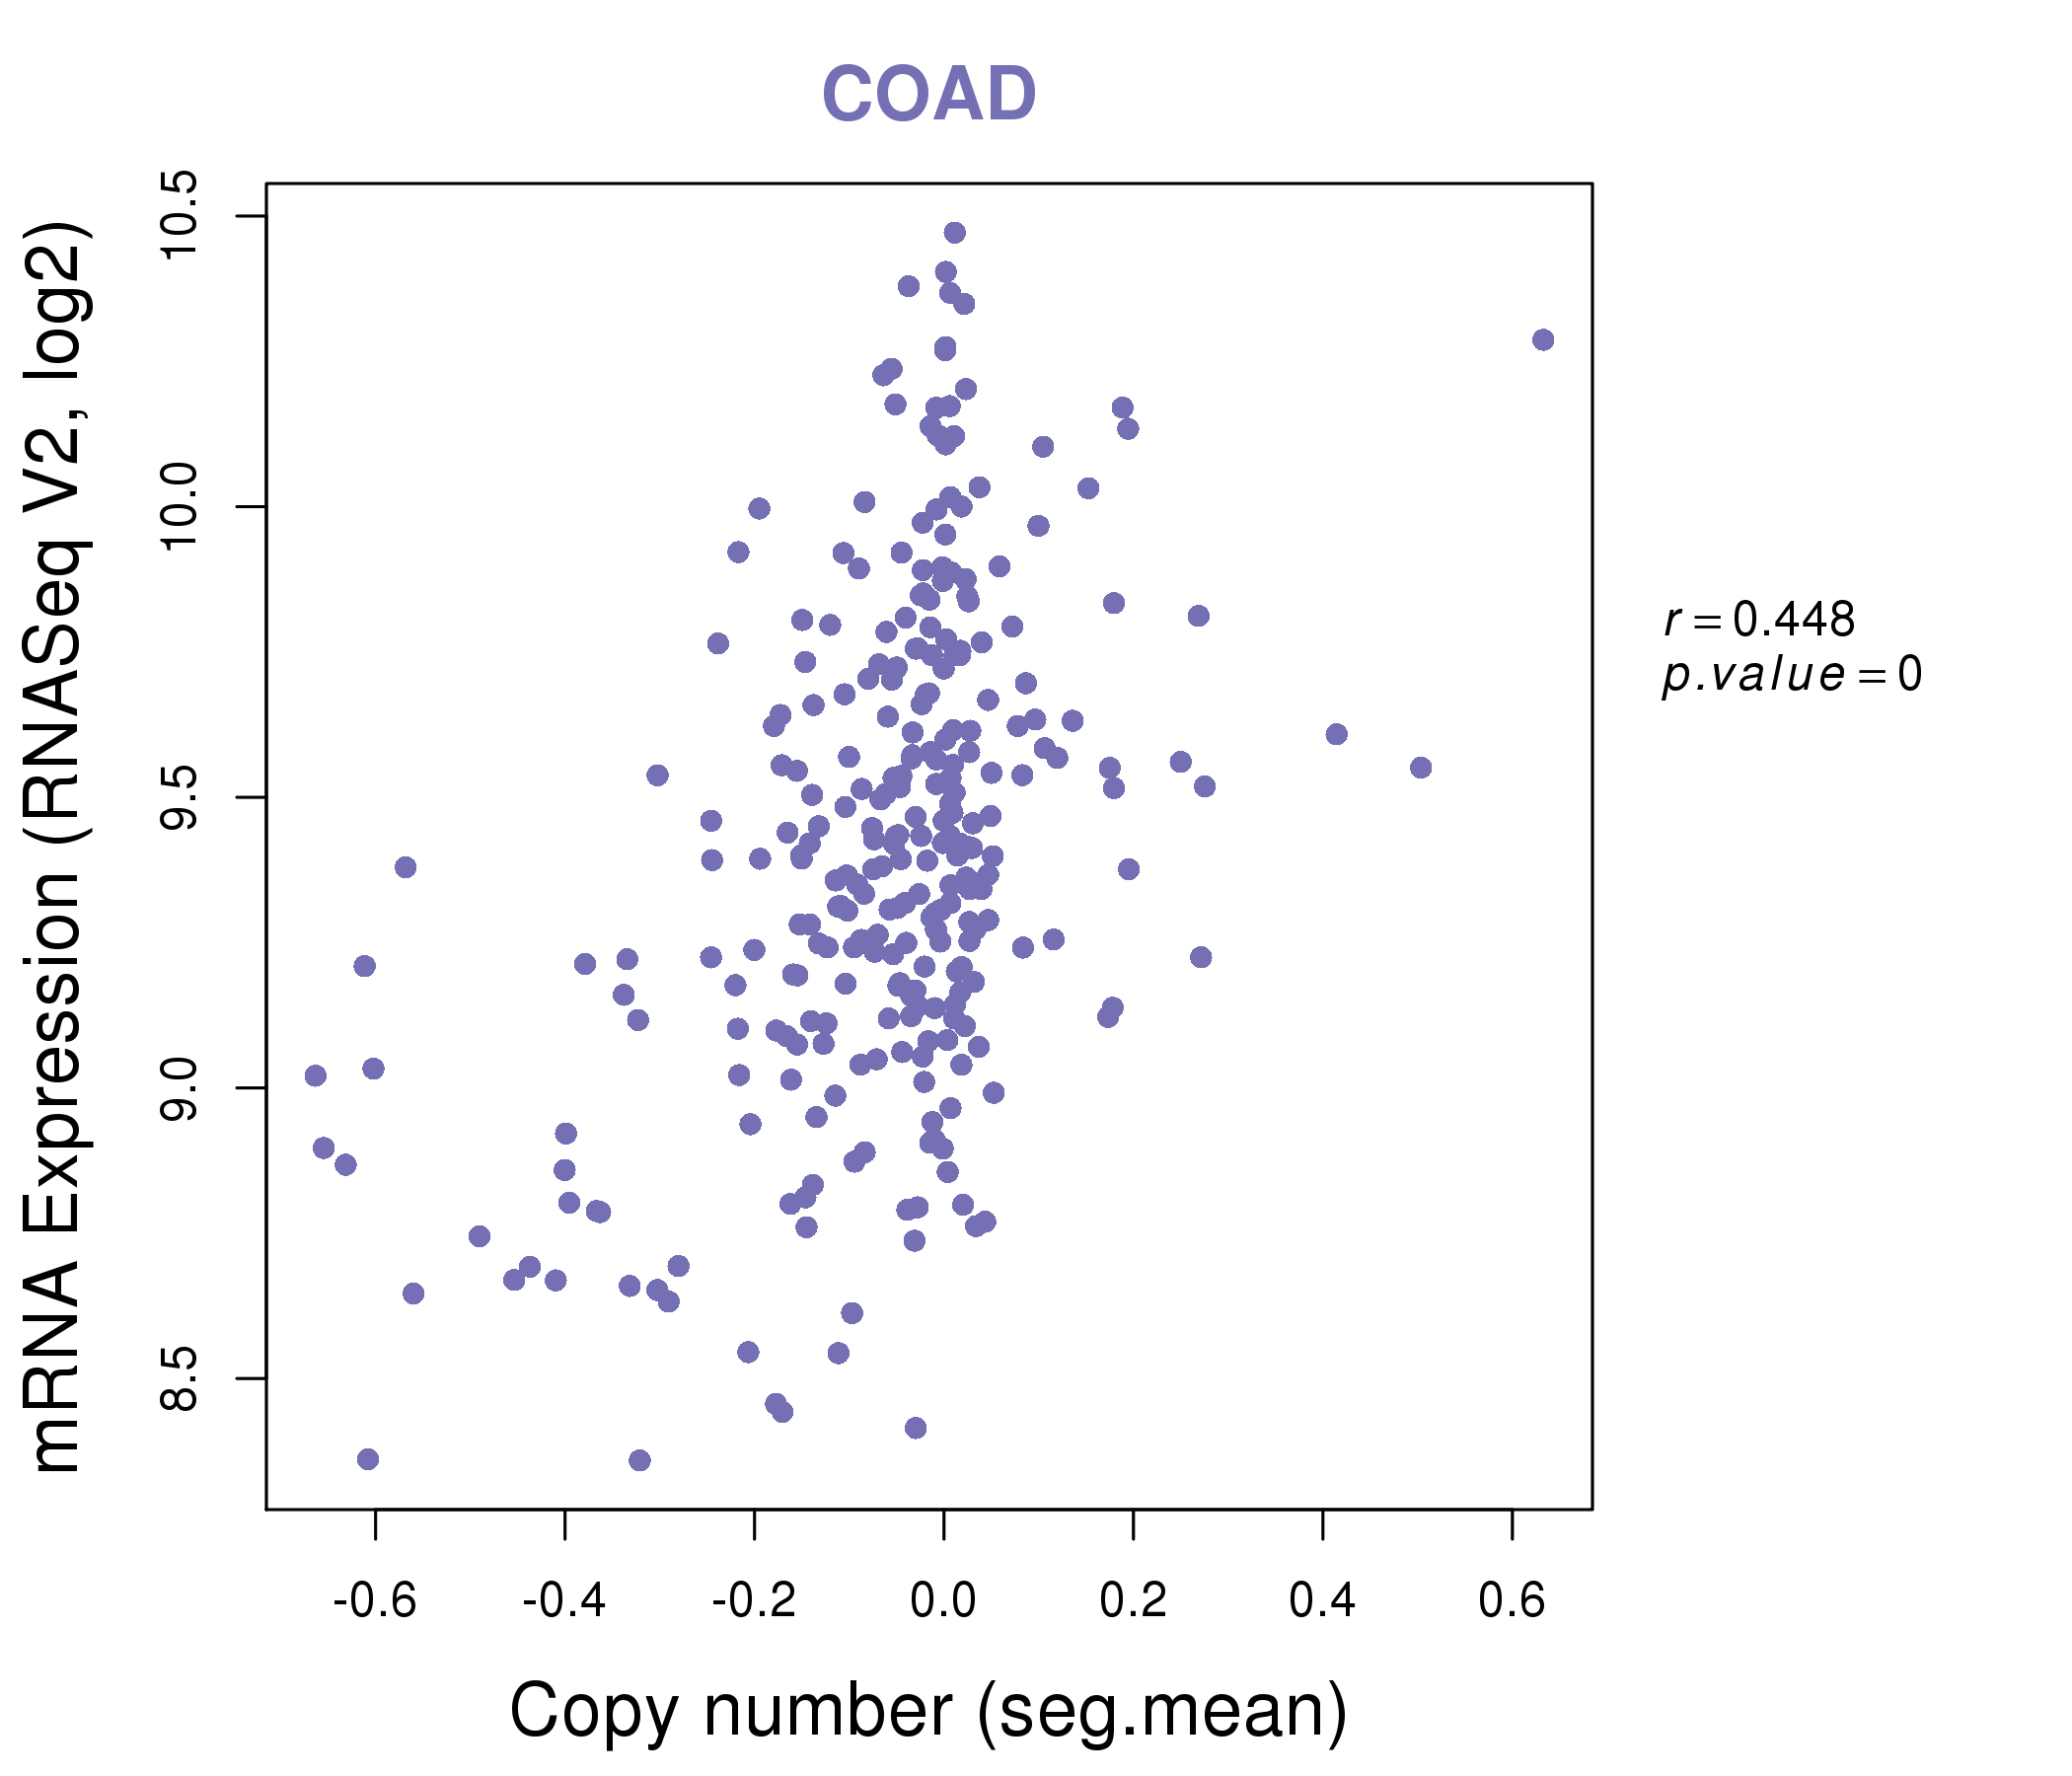
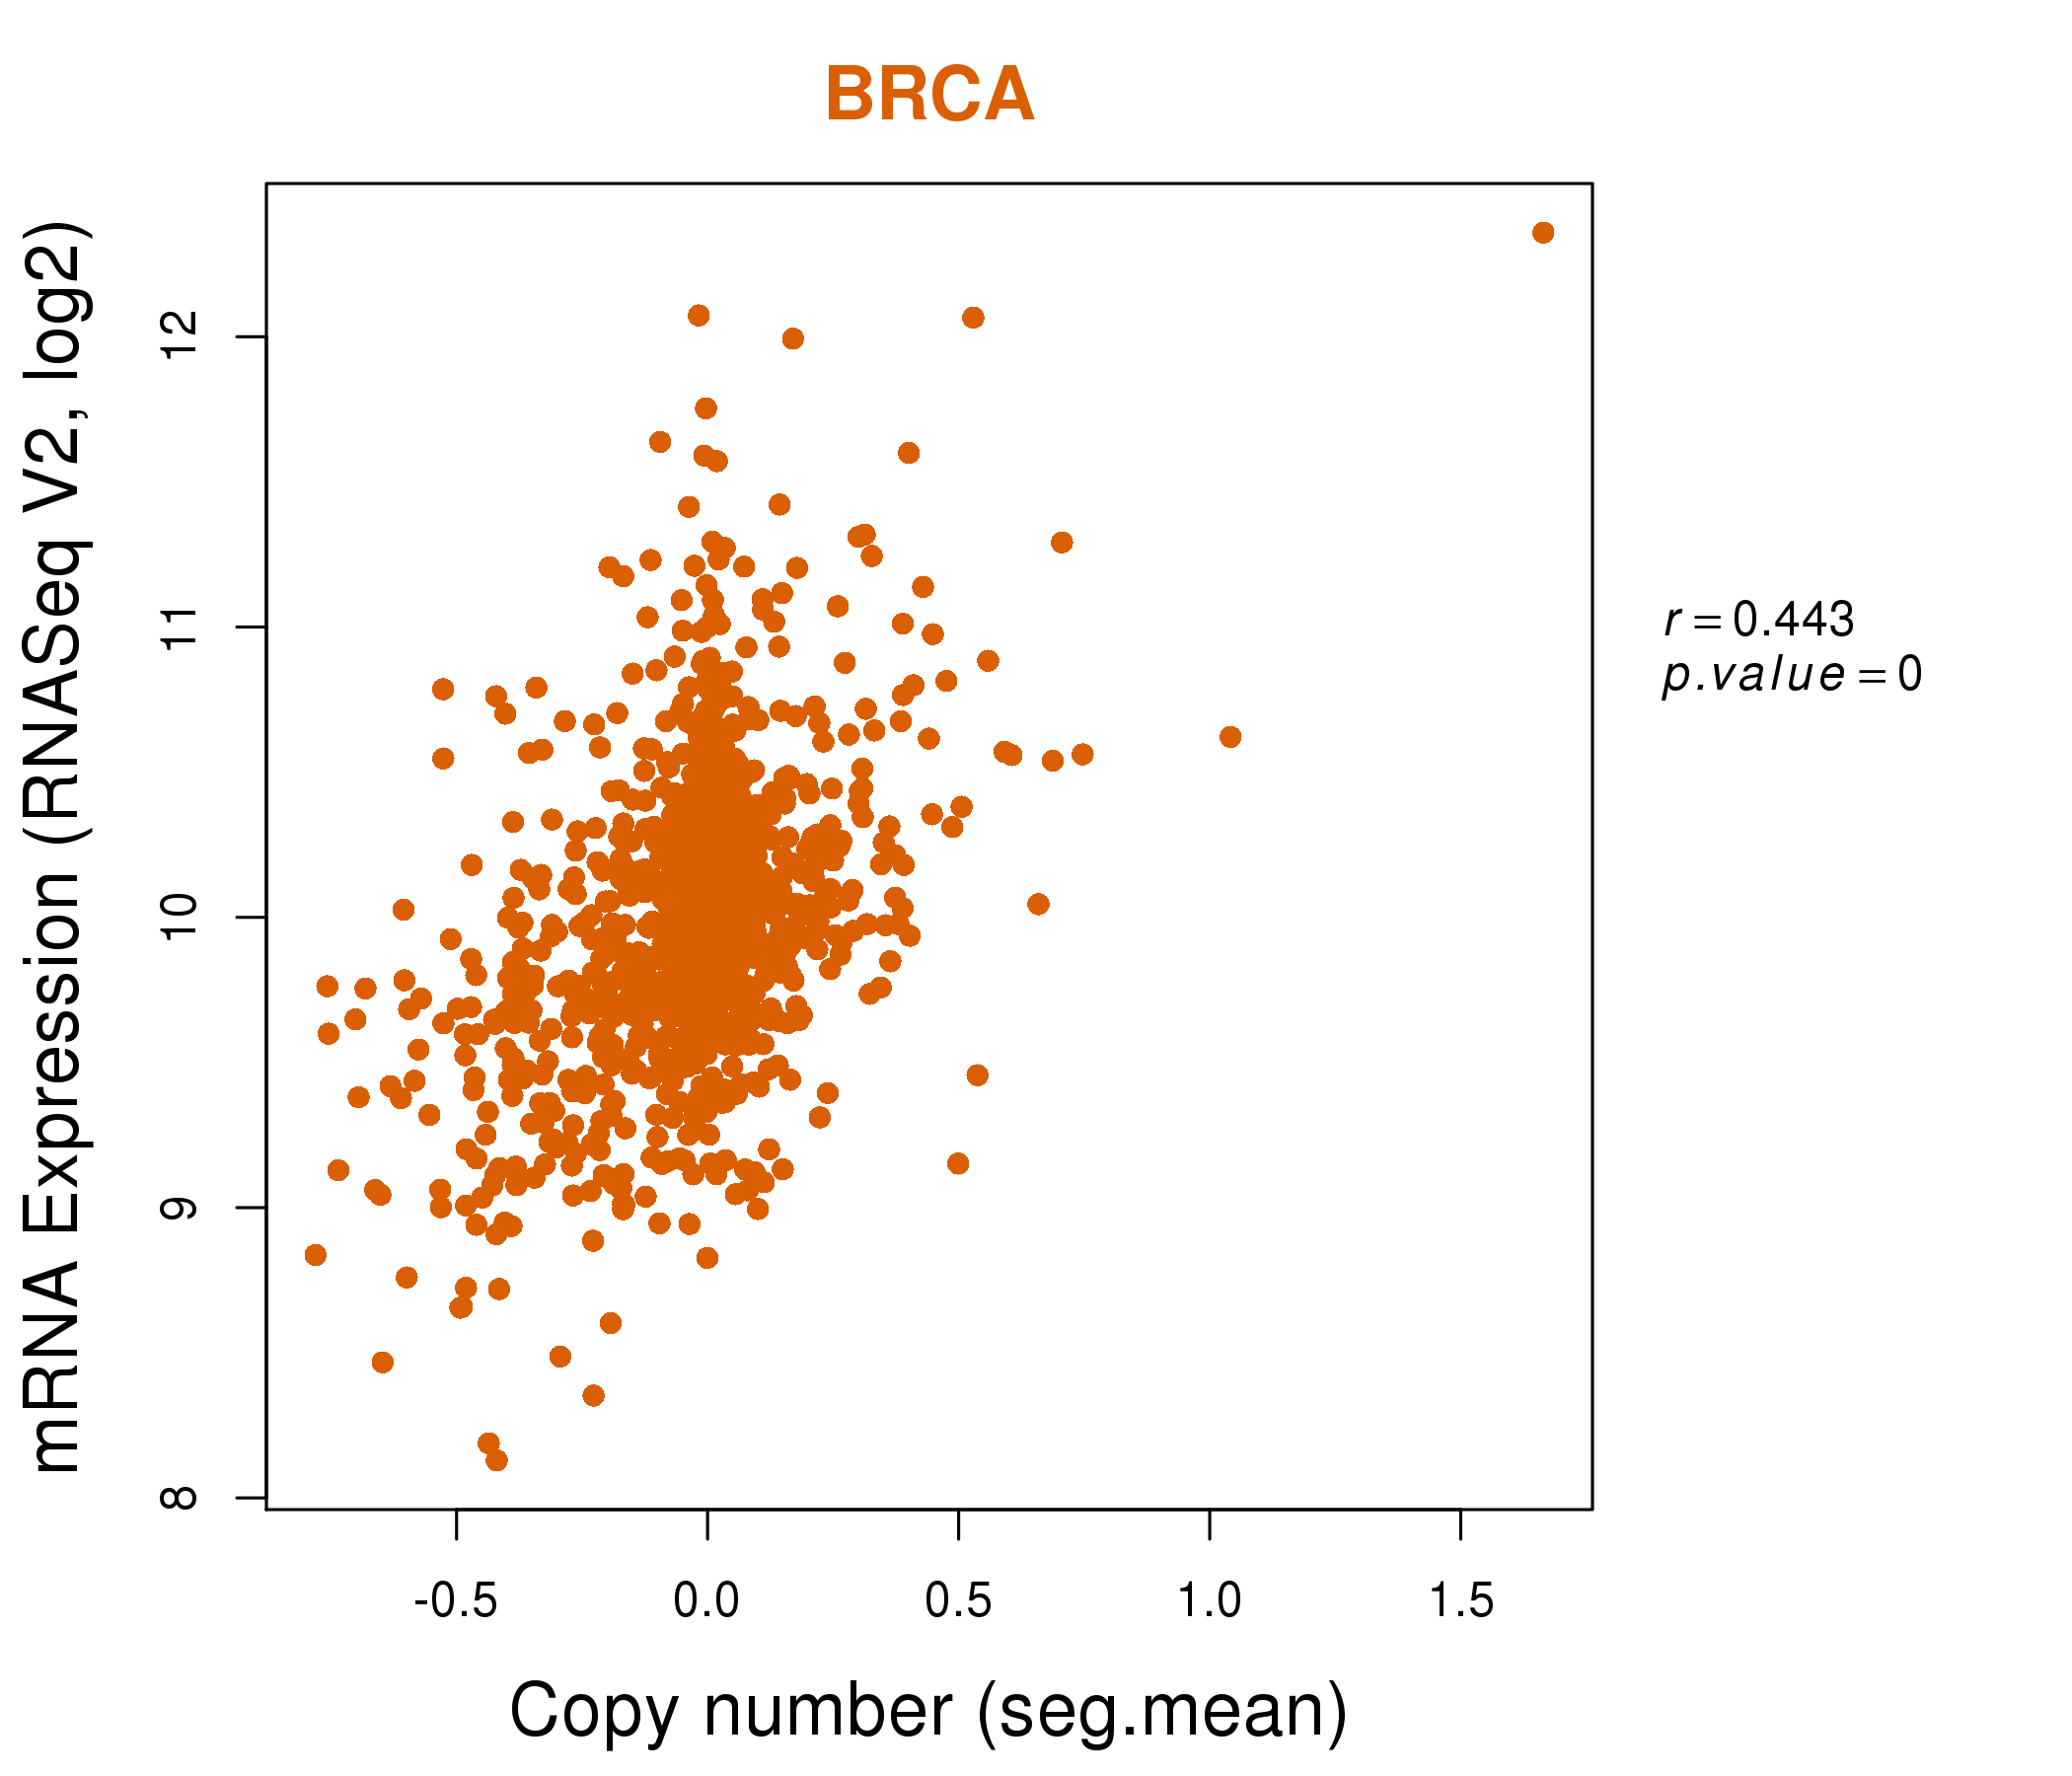
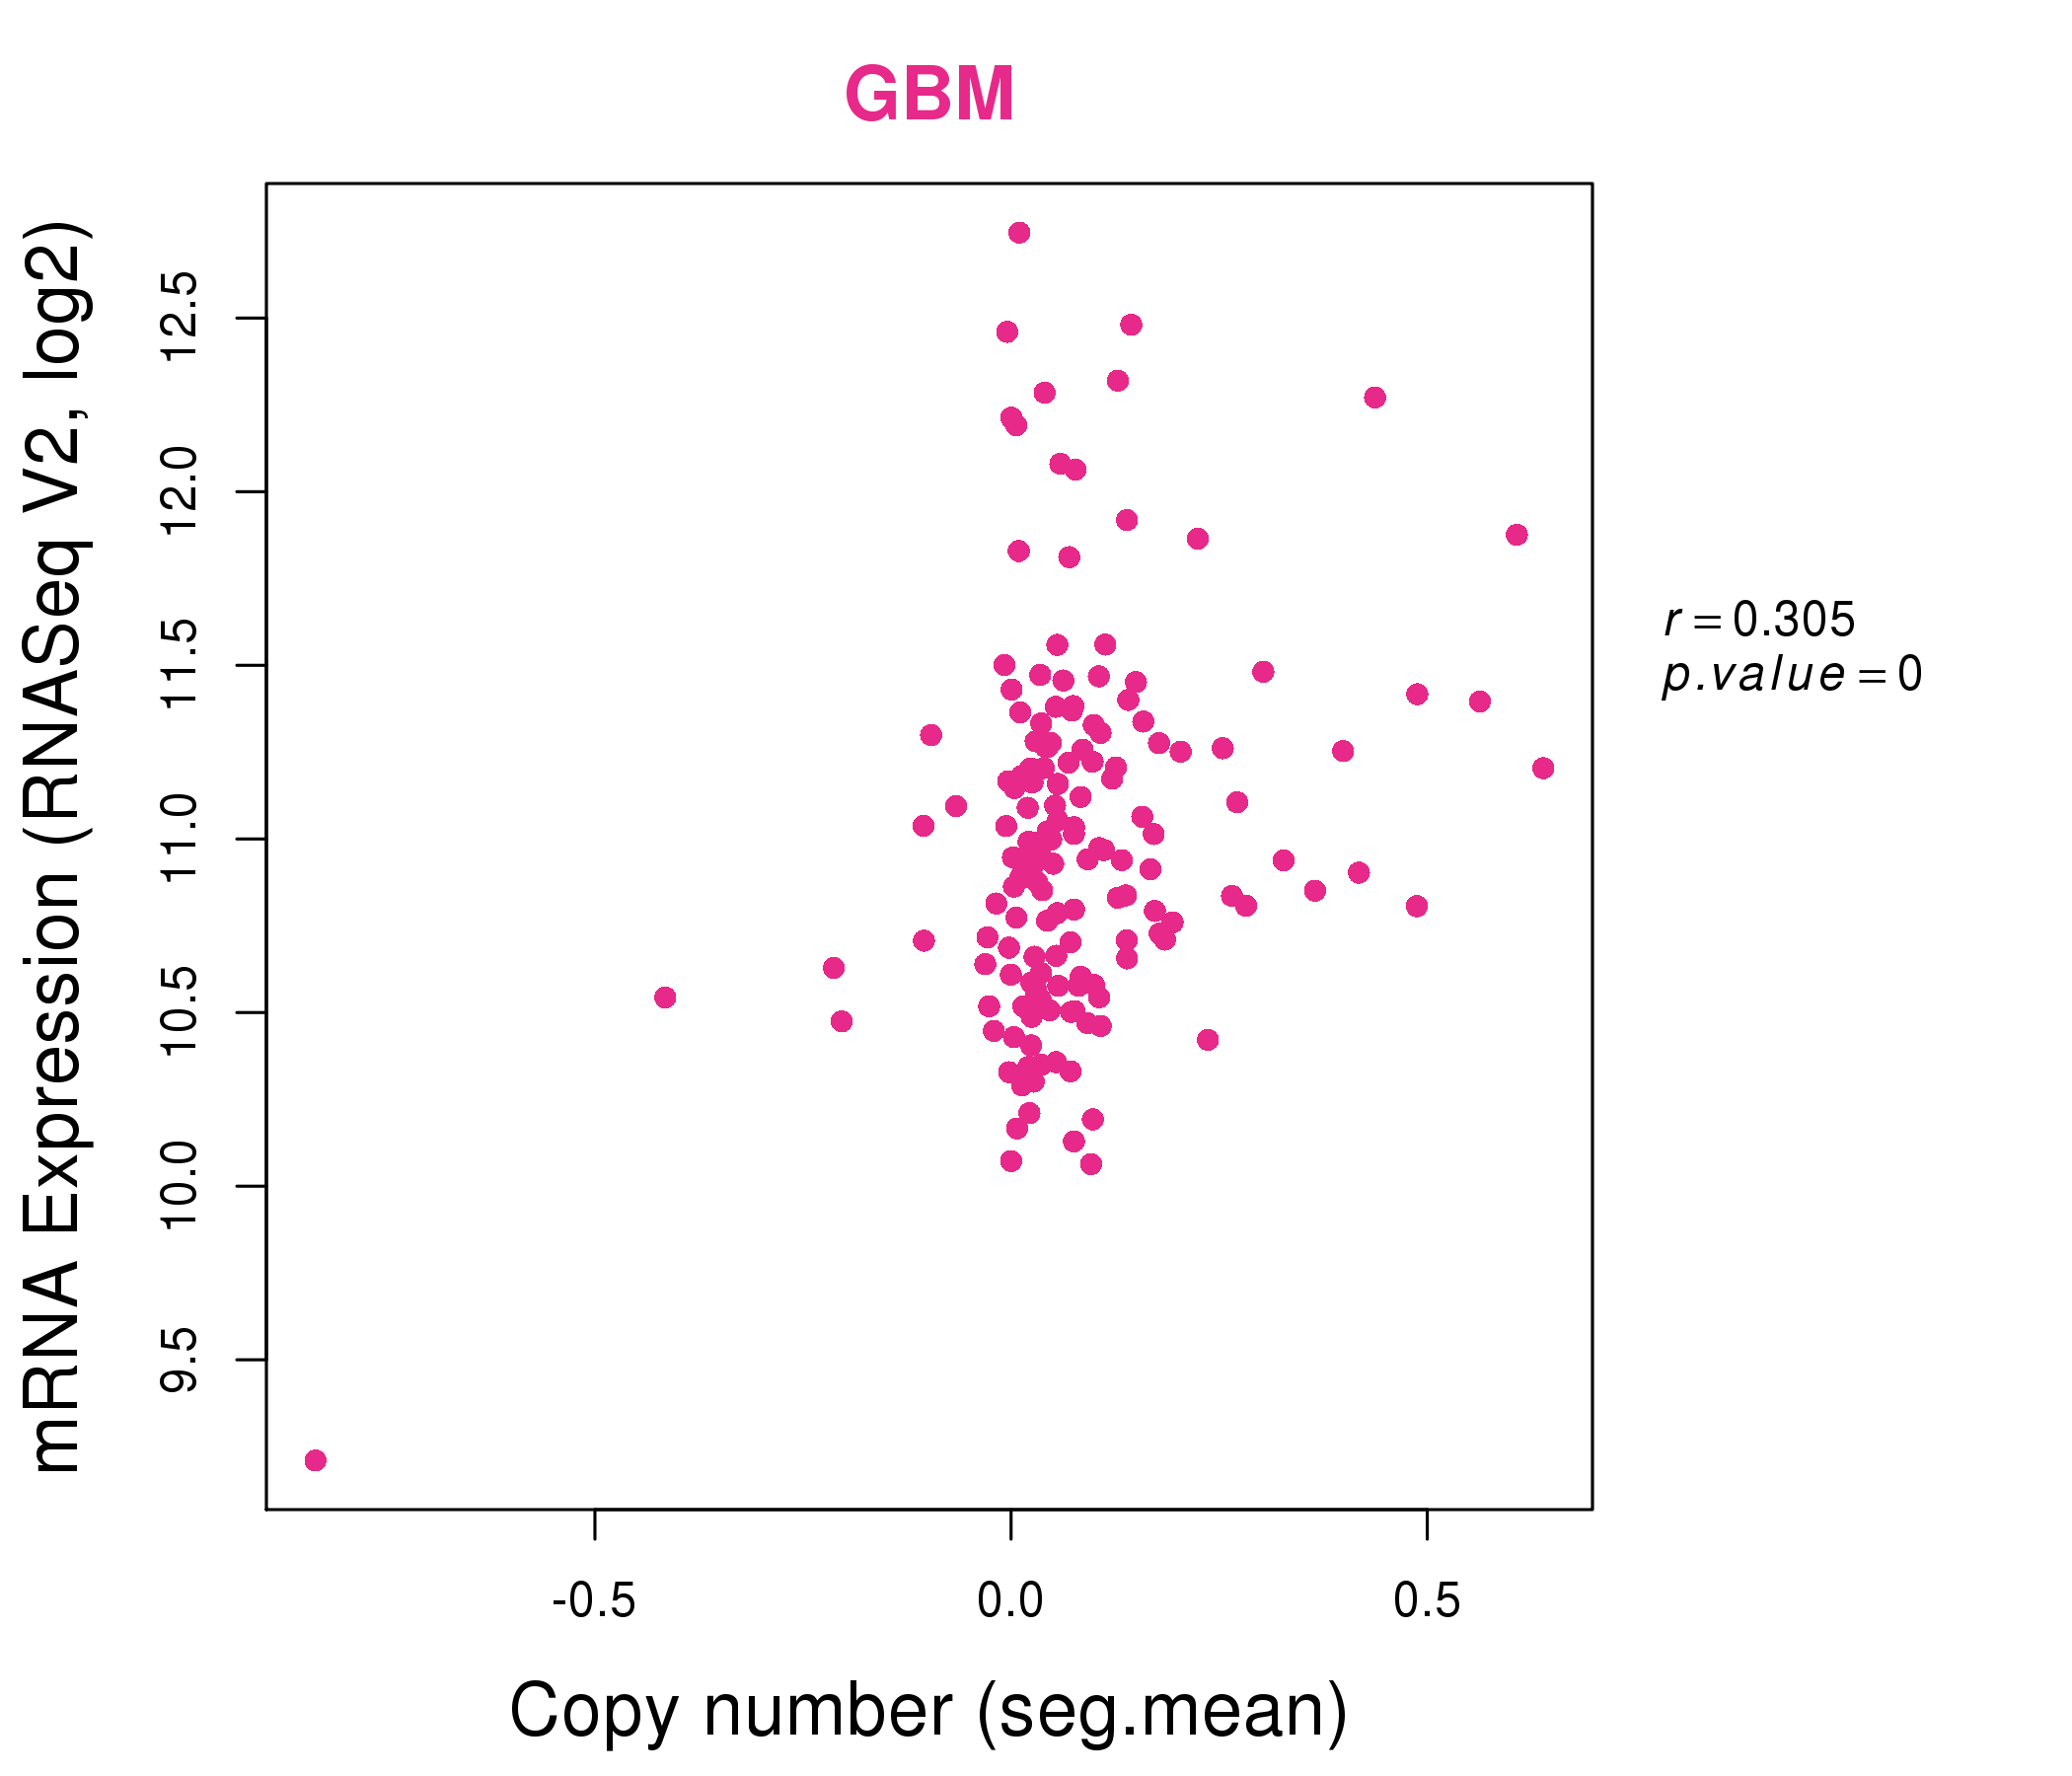
| * This plots show the correlation between CNV and gene expression. |
: Open all plots for all cancer types
 |
|
 |
|
| Top |
| Gene-Gene Network Information |
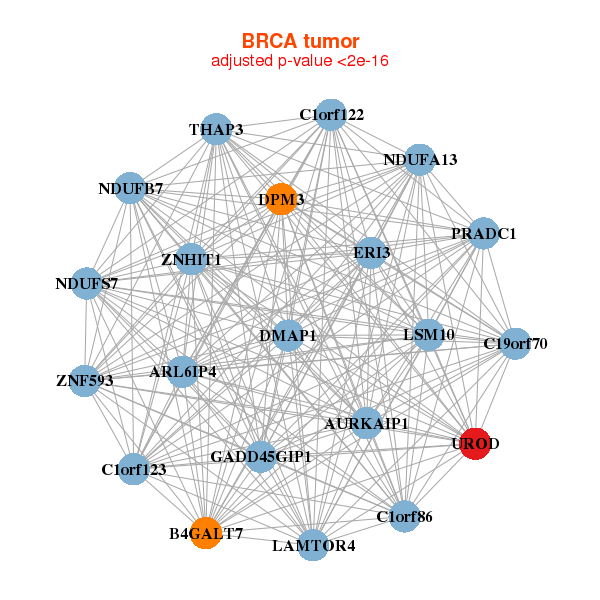
| * Co-Expression network figures were drawn using R package igraph. Only the top 20 genes with the highest correlations were shown. Red circle: input gene, orange circle: cell metabolism gene, sky circle: other gene |
: Open all plots for all cancer types
 |
| ||||
| ARL6IP4,AURKAIP1,B4GALT7,C19orf70,C1orf122,C1orf123,C1orf86, PRADC1,LAMTOR4,DMAP1,DPM3,ERI3,GADD45GIP1,LSM10, NDUFA13,NDUFB7,NDUFS7,THAP3,UROD,ZNF593,ZNHIT1 | ABHD14A,ANXA11,ARL2,BLOC1S1,BLVRB,LAMTOR1,CCDC23, CCM2,CD63,GPX1,GPX4,HINT2,LRP3,MYL6, NEDD8,NUCB1,POLR2L,PSMD8,RNPEPL1,SNX17,UROD | ||||
 |
| ||||
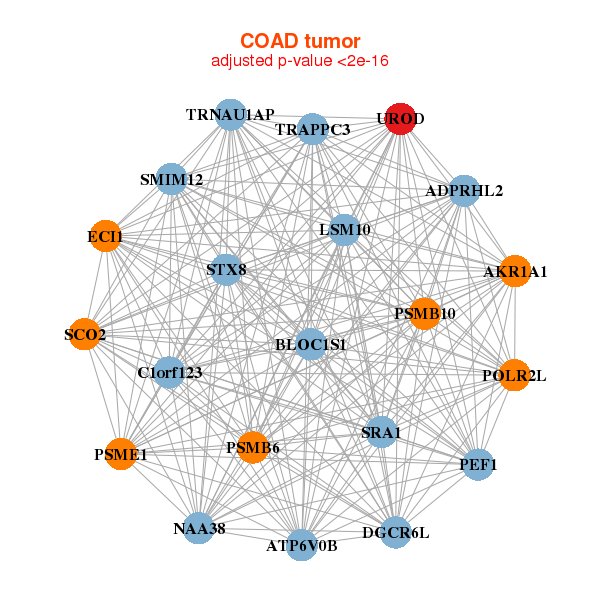
| ADPRHL2,AKR1A1,ATP6V0B,BLOC1S1,C1orf123,SMIM12,ECI1, DGCR6L,LSM10,NAA38,PEF1,POLR2L,PSMB10,PSMB6, PSME1,SCO2,SRA1,STX8,TRAPPC3,TRNAU1AP,UROD | ANAPC16,ARL2,BOLA1,BRK1,CCDC23,DCTN3,FBXL5, FIS1,FUNDC2,MANBAL,MRPL40,PFDN1,RWDD2B,SNAPIN, SNX3,THTPA,TPD52L2,UROD,YPEL5,ZMAT5,ZNF32 |
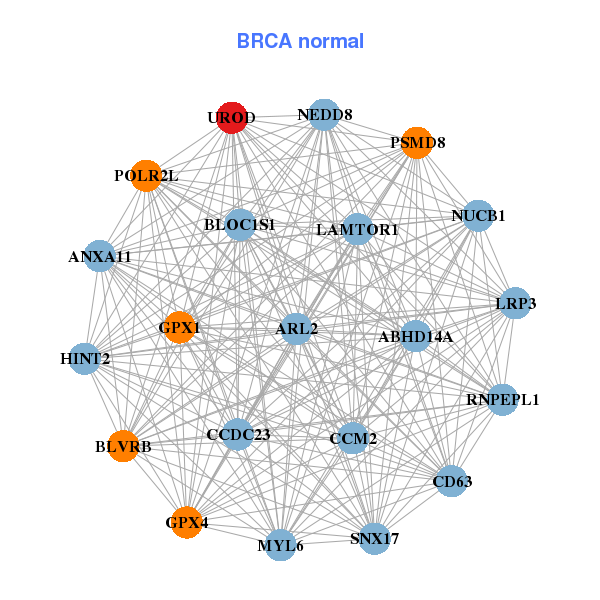
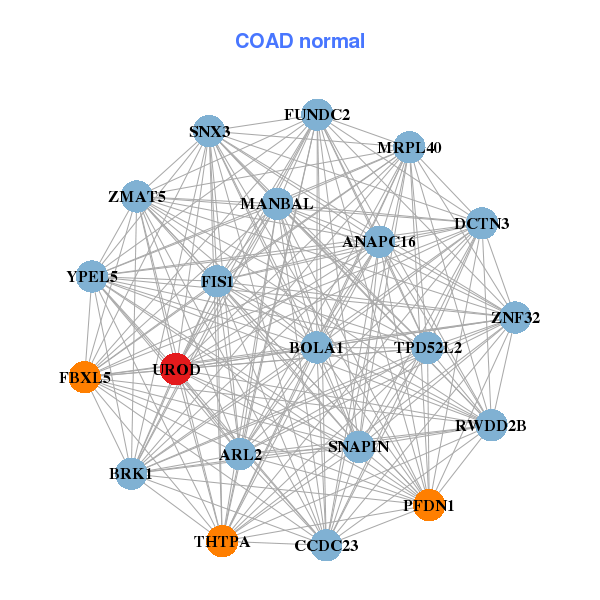
| * Co-Expression network figures were drawn using R package igraph. Only the top 20 genes with the highest correlations were shown. Red circle: input gene, orange circle: cell metabolism gene, sky circle: other gene |
: Open all plots for all cancer types
| Top |
: Open all interacting genes' information including KEGG pathway for all interacting genes from DAVID
| Top |
| Pharmacological Information for UROD |
| DB Category | DB Name | DB's ID and Url link |
| * Gene Centered Interaction Network. |
 |
| * Drug Centered Interaction Network. |
| DrugBank ID | Target Name | Drug Groups | Generic Name | Drug Centered Network | Drug Structure |
| DB00145 | uroporphyrinogen decarboxylase | approved; nutraceutical | Glycine |  |  |
| Top |
| Cross referenced IDs for UROD |
| * We obtained these cross-references from Uniprot database. It covers 150 different DBs, 18 categories. http://www.uniprot.org/help/cross_references_section |
: Open all cross reference information
|
Copyright © 2016-Present - The Univsersity of Texas Health Science Center at Houston @ |