|
||||||||||||||||||||
| |
| Phenotypic Information (metabolism pathway, cancer, disease, phenome) |
| |
| |
| Gene-Gene Network Information: Co-Expression Network, Interacting Genes & KEGG |
| |
|


| Gene Summary for VBP1 |
| Basic gene info. | Gene symbol | VBP1 |
| Gene name | von Hippel-Lindau binding protein 1 | |
| Synonyms | PFD3|PFDN3|VBP-1 | |
| Cytomap | UCSC genome browser: Xq28 | |
| Genomic location | chrX :154444700-154468098 | |
| Type of gene | protein-coding | |
| RefGenes | NM_003372.5, | |
| Ensembl id | ENSG00000268440 | |
| Description | HIBBJ46VHL binding protein-1VHL-binding protein 1prefoldin 3prefoldin subunit 3von Hippel-Lindau-binding protein 1 | |
| Modification date | 20141207 | |
| dbXrefs | MIM : 300133 | |
| HGNC : HGNC | ||
| Ensembl : ENSG00000155959 | ||
| HPRD : 02135 | ||
| Vega : OTTHUMG00000022666 | ||
| Protein | UniProt: P61758 go to UniProt's Cross Reference DB Table | |
| Expression | CleanEX: HS_VBP1 | |
| BioGPS: 7411 | ||
| Gene Expression Atlas: ENSG00000268440 | ||
| The Human Protein Atlas: ENSG00000268440 | ||
| Pathway | NCI Pathway Interaction Database: VBP1 | |
| KEGG: VBP1 | ||
| REACTOME: VBP1 | ||
| ConsensusPathDB | ||
| Pathway Commons: VBP1 | ||
| Metabolism | MetaCyc: VBP1 | |
| HUMANCyc: VBP1 | ||
| Regulation | Ensembl's Regulation: ENSG00000268440 | |
| miRBase: chrX :154,444,700-154,468,098 | ||
| TargetScan: NM_003372 | ||
| cisRED: ENSG00000268440 | ||
| Context | iHOP: VBP1 | |
| cancer metabolism search in PubMed: VBP1 | ||
| UCL Cancer Institute: VBP1 | ||
| Assigned class in ccmGDB | B - This gene belongs to cancer gene. | |
| Top |
| Phenotypic Information for VBP1(metabolism pathway, cancer, disease, phenome) |
| Cancer | CGAP: VBP1 |
| Familial Cancer Database: VBP1 | |
| * This gene is included in those cancer gene databases. |
|
|
|
|
|
| . | ||||||||||||||
Oncogene 1 | Significant driver gene in | |||||||||||||||||||
| cf) number; DB name 1 Oncogene; http://nar.oxfordjournals.org/content/35/suppl_1/D721.long, 2 Tumor Suppressor gene; https://bioinfo.uth.edu/TSGene/, 3 Cancer Gene Census; http://www.nature.com/nrc/journal/v4/n3/abs/nrc1299.html, 4 CancerGenes; http://nar.oxfordjournals.org/content/35/suppl_1/D721.long, 5 Network of Cancer Gene; http://ncg.kcl.ac.uk/index.php, 1Therapeutic Vulnerabilities in Cancer; http://cbio.mskcc.org/cancergenomics/statius/ |
| REACTOME_METABOLISM_OF_PROTEINS | |
| OMIM | 300133; gene. |
| Orphanet | |
| Disease | KEGG Disease: VBP1 |
| MedGen: VBP1 (Human Medical Genetics with Condition) | |
| ClinVar: VBP1 | |
| Phenotype | MGI: VBP1 (International Mouse Phenotyping Consortium) |
| PhenomicDB: VBP1 | |
| Mutations for VBP1 |
| * Under tables are showing count per each tissue to give us broad intuition about tissue specific mutation patterns.You can go to the detailed page for each mutation database's web site. |
| There's no structural variation information in COSMIC data for this gene. |
| * From mRNA Sanger sequences, Chitars2.0 arranged chimeric transcripts. This table shows VBP1 related fusion information. |
| ID | Head Gene | Tail Gene | Accession | Gene_a | qStart_a | qEnd_a | Chromosome_a | tStart_a | tEnd_a | Gene_a | qStart_a | qEnd_a | Chromosome_a | tStart_a | tEnd_a |
| AL079966 | VBP1 | 21 | 156 | X | 154467136 | 154467271 | VBP1 | 151 | 616 | X | 154467246 | 154467710 | |
| Top |
| There's no copy number variation information in COSMIC data for this gene. |
| Top |
|
 |
| Top |
| Stat. for Non-Synonymous SNVs (# total SNVs=17) | (# total SNVs=0) |
 | |
(# total SNVs=0) | (# total SNVs=0) |
| Top |
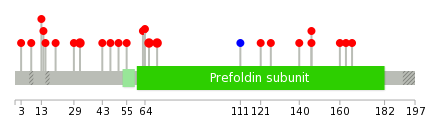
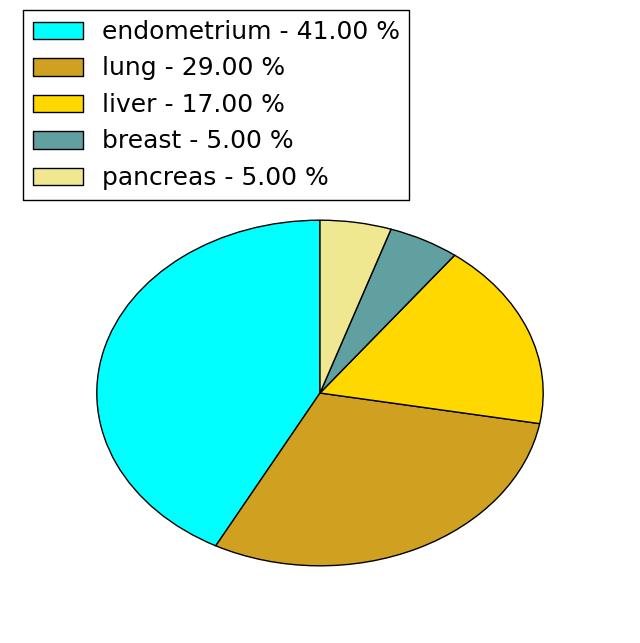
| * When you move the cursor on each content, you can see more deailed mutation information on the Tooltip. Those are primary_site,primary_histology,mutation(aa),pubmedID. |
| GRCh37 position | Mutation(aa) | Unique sampleID count |
| chr23:154448461-154448461 | p.E32G | 2 |
| chr23:154448563-154448563 | p.N66S | 2 |
| chr23:154448575-154448575 | p.K70T | 2 |
| chr23:154464613-154464613 | p.D163G | 1 |
| chr23:154444817-154444817 | p.R20W | 1 |
| chr23:154448586-154448586 | p.? | 1 |
| chr23:154464621-154464621 | p.R166G | 1 |
| chr23:154444844-154444844 | p.V29M | 1 |
| chr23:154455508-154455508 | p.? | 1 |
| chr23:154467052-154467052 | p.? | 1 |
| Top |
|
 |
| Point Mutation/ Tissue ID | 1 | 2 | 3 | 4 | 5 | 6 | 7 | 8 | 9 | 10 | 11 | 12 | 13 | 14 | 15 | 16 | 17 | 18 | 19 | 20 |
| # sample | 1 | 1 | 4 | 2 | 2 | 7 | ||||||||||||||
| # mutation | 1 | 1 | 4 | 2 | 2 | 7 | ||||||||||||||
| nonsynonymous SNV | 1 | 1 | 1 | 2 | 1 | 7 | ||||||||||||||
| synonymous SNV | 3 | 1 |
| cf) Tissue ID; Tissue type (1; BLCA[Bladder Urothelial Carcinoma], 2; BRCA[Breast invasive carcinoma], 3; CESC[Cervical squamous cell carcinoma and endocervical adenocarcinoma], 4; COAD[Colon adenocarcinoma], 5; GBM[Glioblastoma multiforme], 6; Glioma Low Grade, 7; HNSC[Head and Neck squamous cell carcinoma], 8; KICH[Kidney Chromophobe], 9; KIRC[Kidney renal clear cell carcinoma], 10; KIRP[Kidney renal papillary cell carcinoma], 11; LAML[Acute Myeloid Leukemia], 12; LUAD[Lung adenocarcinoma], 13; LUSC[Lung squamous cell carcinoma], 14; OV[Ovarian serous cystadenocarcinoma ], 15; PAAD[Pancreatic adenocarcinoma], 16; PRAD[Prostate adenocarcinoma], 17; SKCM[Skin Cutaneous Melanoma], 18:STAD[Stomach adenocarcinoma], 19:THCA[Thyroid carcinoma], 20:UCEC[Uterine Corpus Endometrial Carcinoma]) |
| Top |
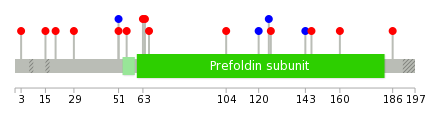
| * We represented just top 10 SNVs. When you move the cursor on each content, you can see more deailed mutation information on the Tooltip. Those are primary_site, primary_histology, mutation(aa), pubmedID. |
| Genomic Position | Mutation(aa) | Unique sampleID count |
| chrX:154448519 | p.K51K | 2 |
| chrX:154448530 | p.N66S | 1 |
| chrX:154467086 | p.R104K | 1 |
| chrX:154448554 | p.T120T | 1 |
| chrX:154448556 | p.L125L | 1 |
| chrX:154448563 | p.W126C | 1 |
| chrX:154456691 | p.L143L | 1 |
| chrX:154456740 | p.K146N | 1 |
| chrX:154444767 | p.E160K | 1 |
| chrX:154456755 | p.A3V | 1 |
| * Copy number data were extracted from TCGA using R package TCGA-Assembler. The URLs of all public data files on TCGA DCC data server were gathered on Jan-05-2015. Function ProcessCNAData in TCGA-Assembler package was used to obtain gene-level copy number value which is calculated as the average copy number of the genomic region of a gene. |
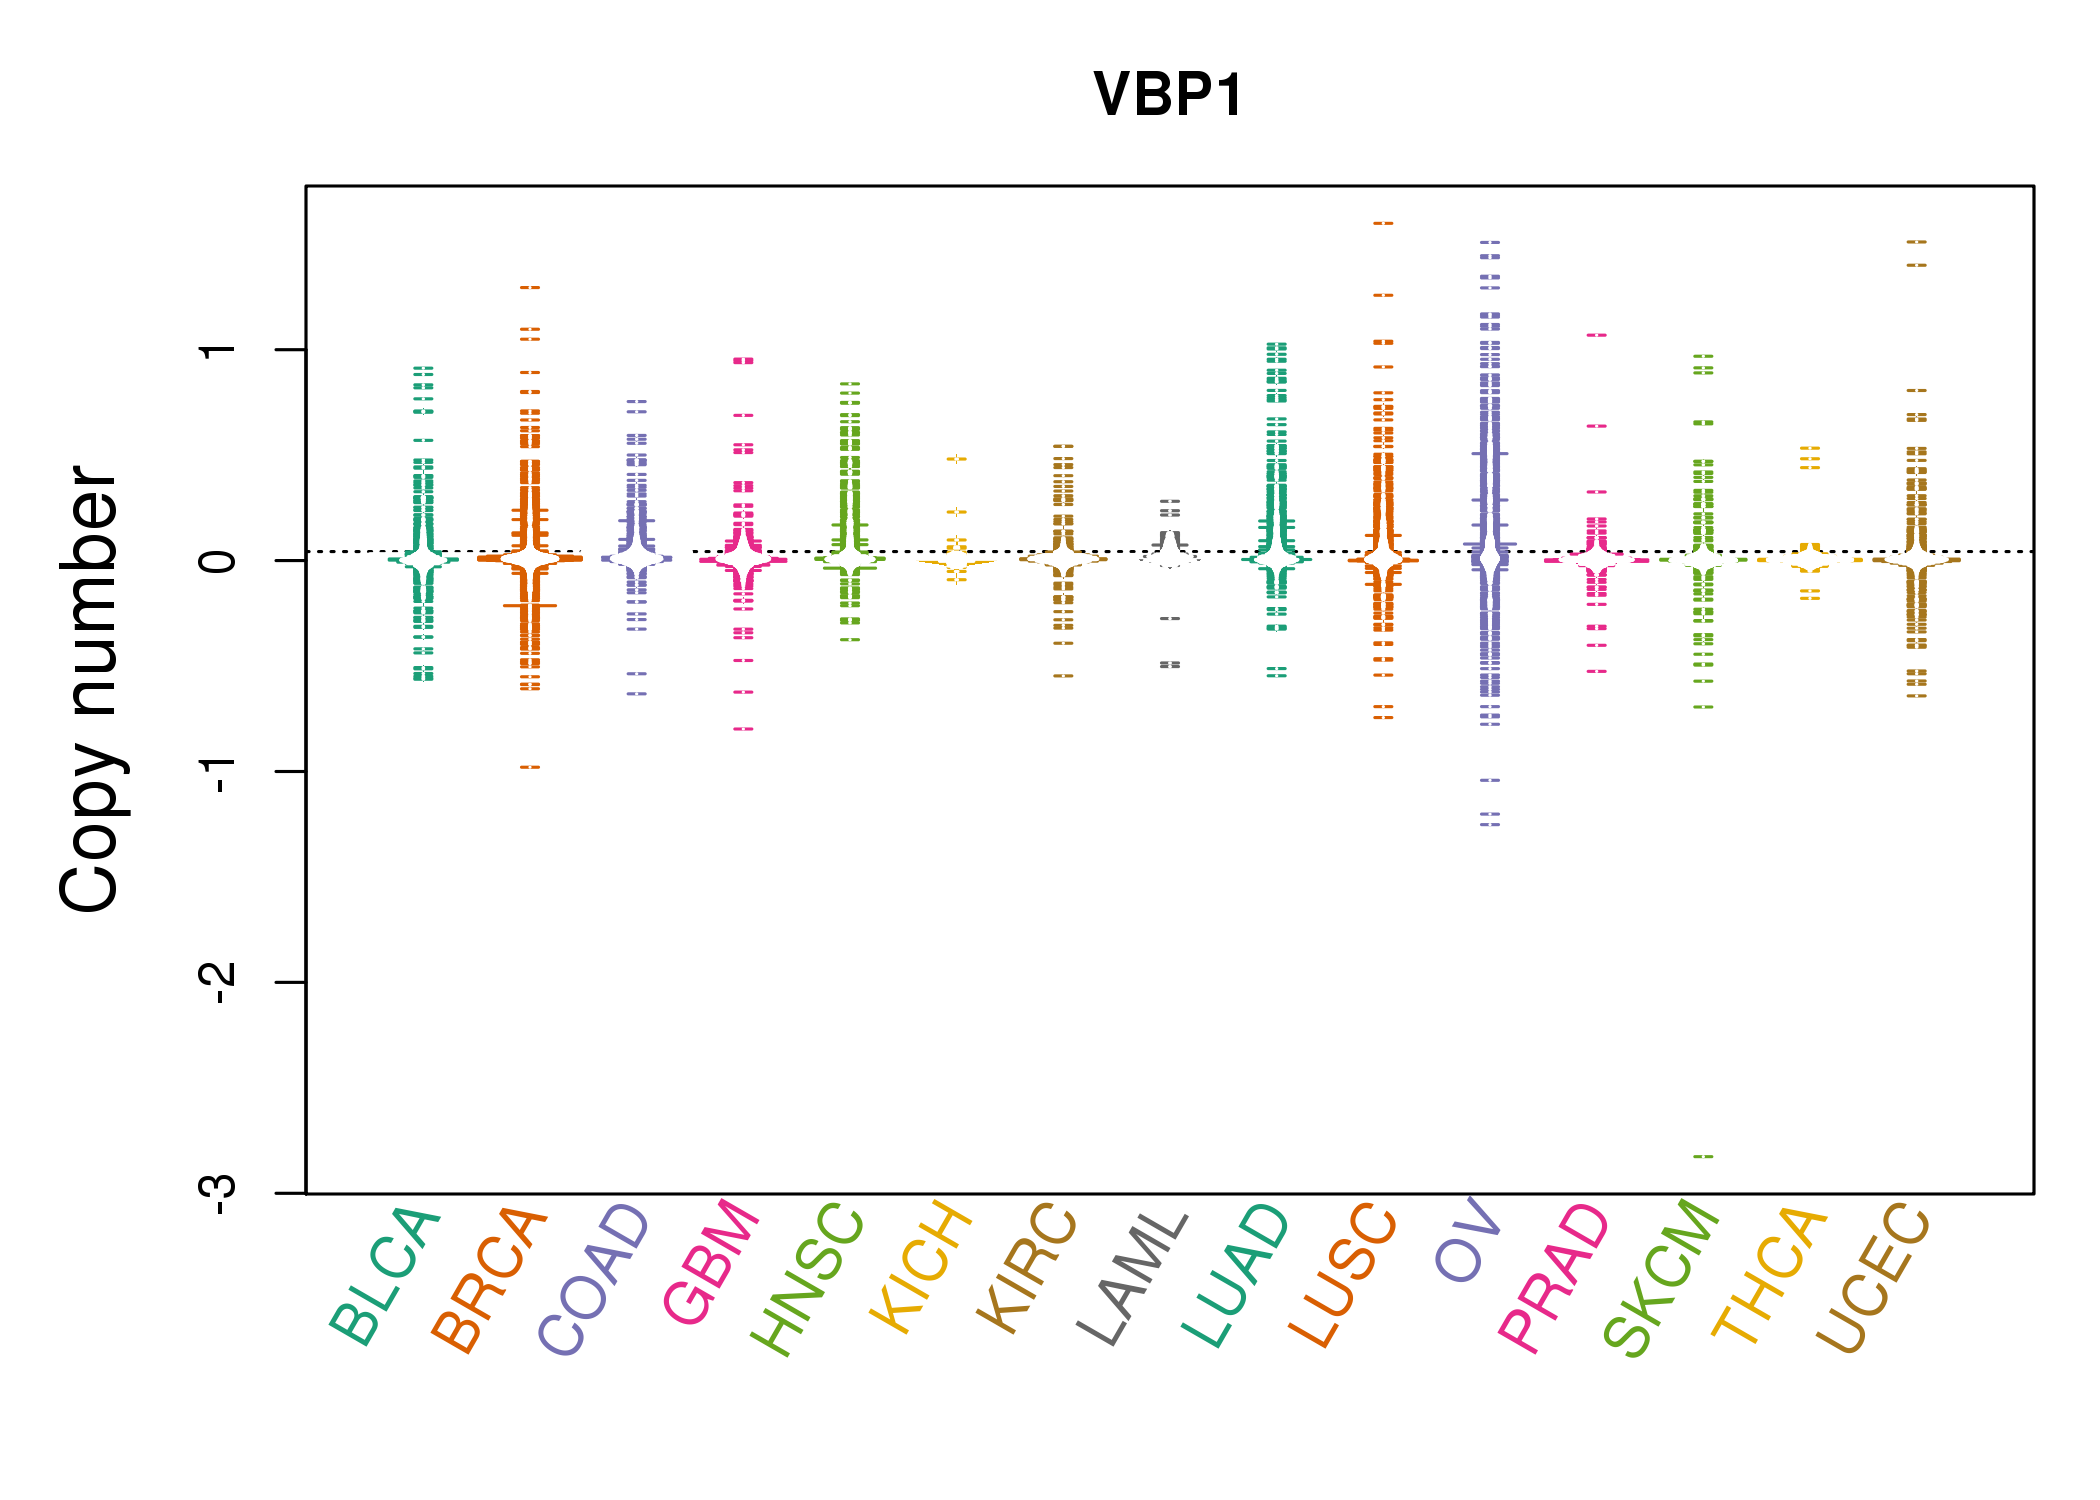 |
| cf) Tissue ID[Tissue type]: BLCA[Bladder Urothelial Carcinoma], BRCA[Breast invasive carcinoma], CESC[Cervical squamous cell carcinoma and endocervical adenocarcinoma], COAD[Colon adenocarcinoma], GBM[Glioblastoma multiforme], Glioma Low Grade, HNSC[Head and Neck squamous cell carcinoma], KICH[Kidney Chromophobe], KIRC[Kidney renal clear cell carcinoma], KIRP[Kidney renal papillary cell carcinoma], LAML[Acute Myeloid Leukemia], LUAD[Lung adenocarcinoma], LUSC[Lung squamous cell carcinoma], OV[Ovarian serous cystadenocarcinoma ], PAAD[Pancreatic adenocarcinoma], PRAD[Prostate adenocarcinoma], SKCM[Skin Cutaneous Melanoma], STAD[Stomach adenocarcinoma], THCA[Thyroid carcinoma], UCEC[Uterine Corpus Endometrial Carcinoma] |
| Top |
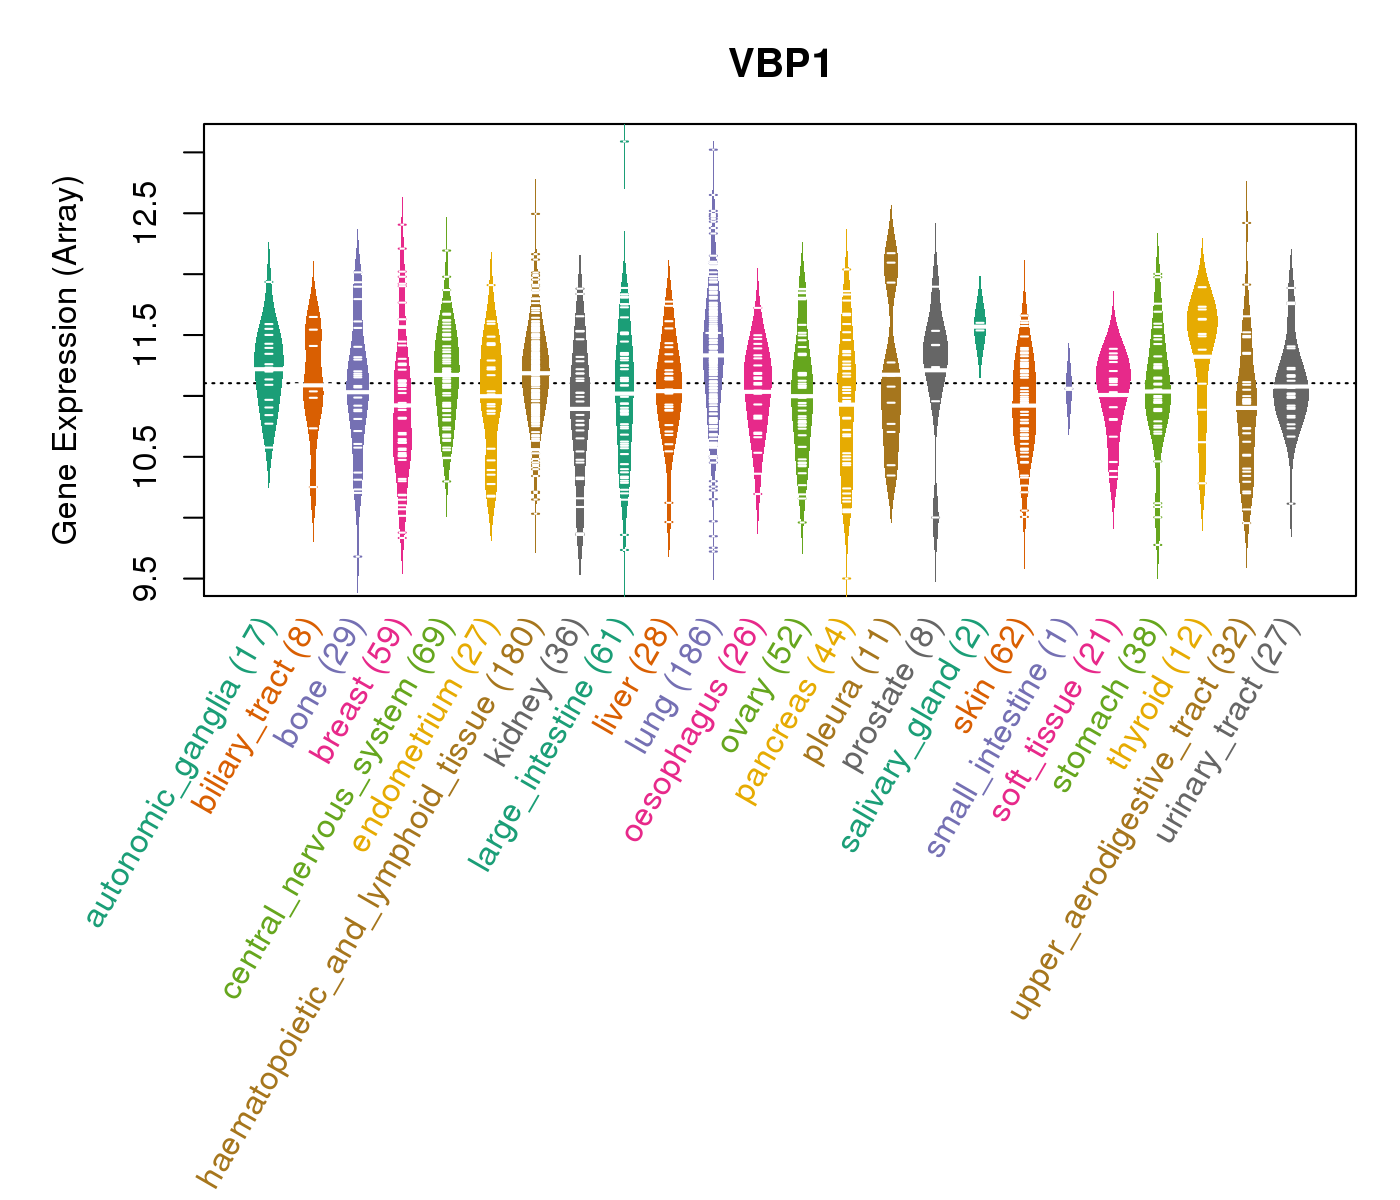
| Gene Expression for VBP1 |
| * CCLE gene expression data were extracted from CCLE_Expression_Entrez_2012-10-18.res: Gene-centric RMA-normalized mRNA expression data. |
 |
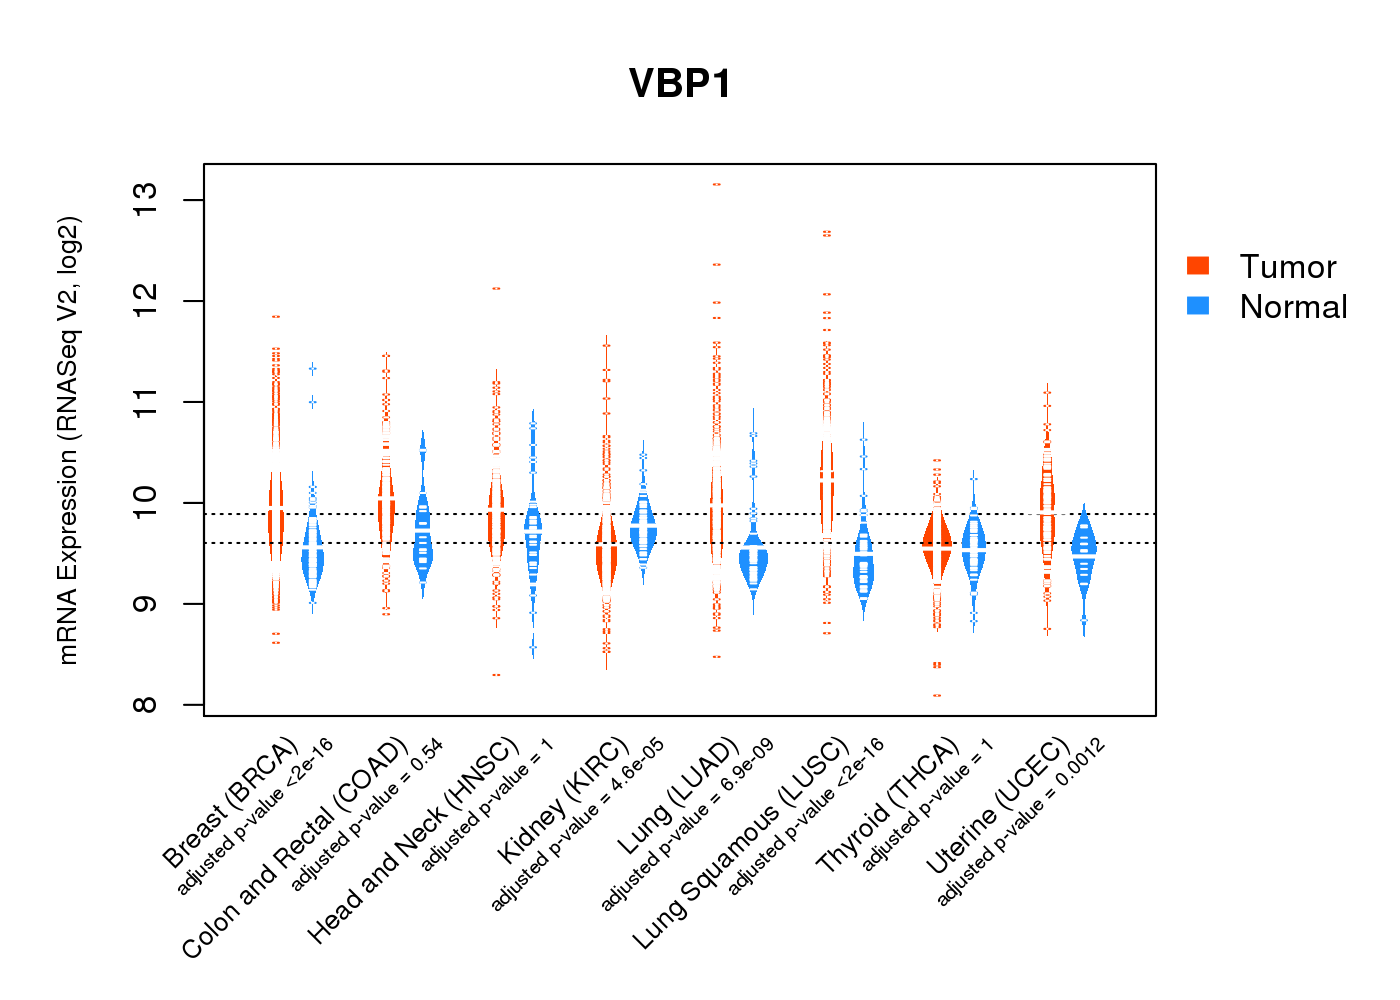
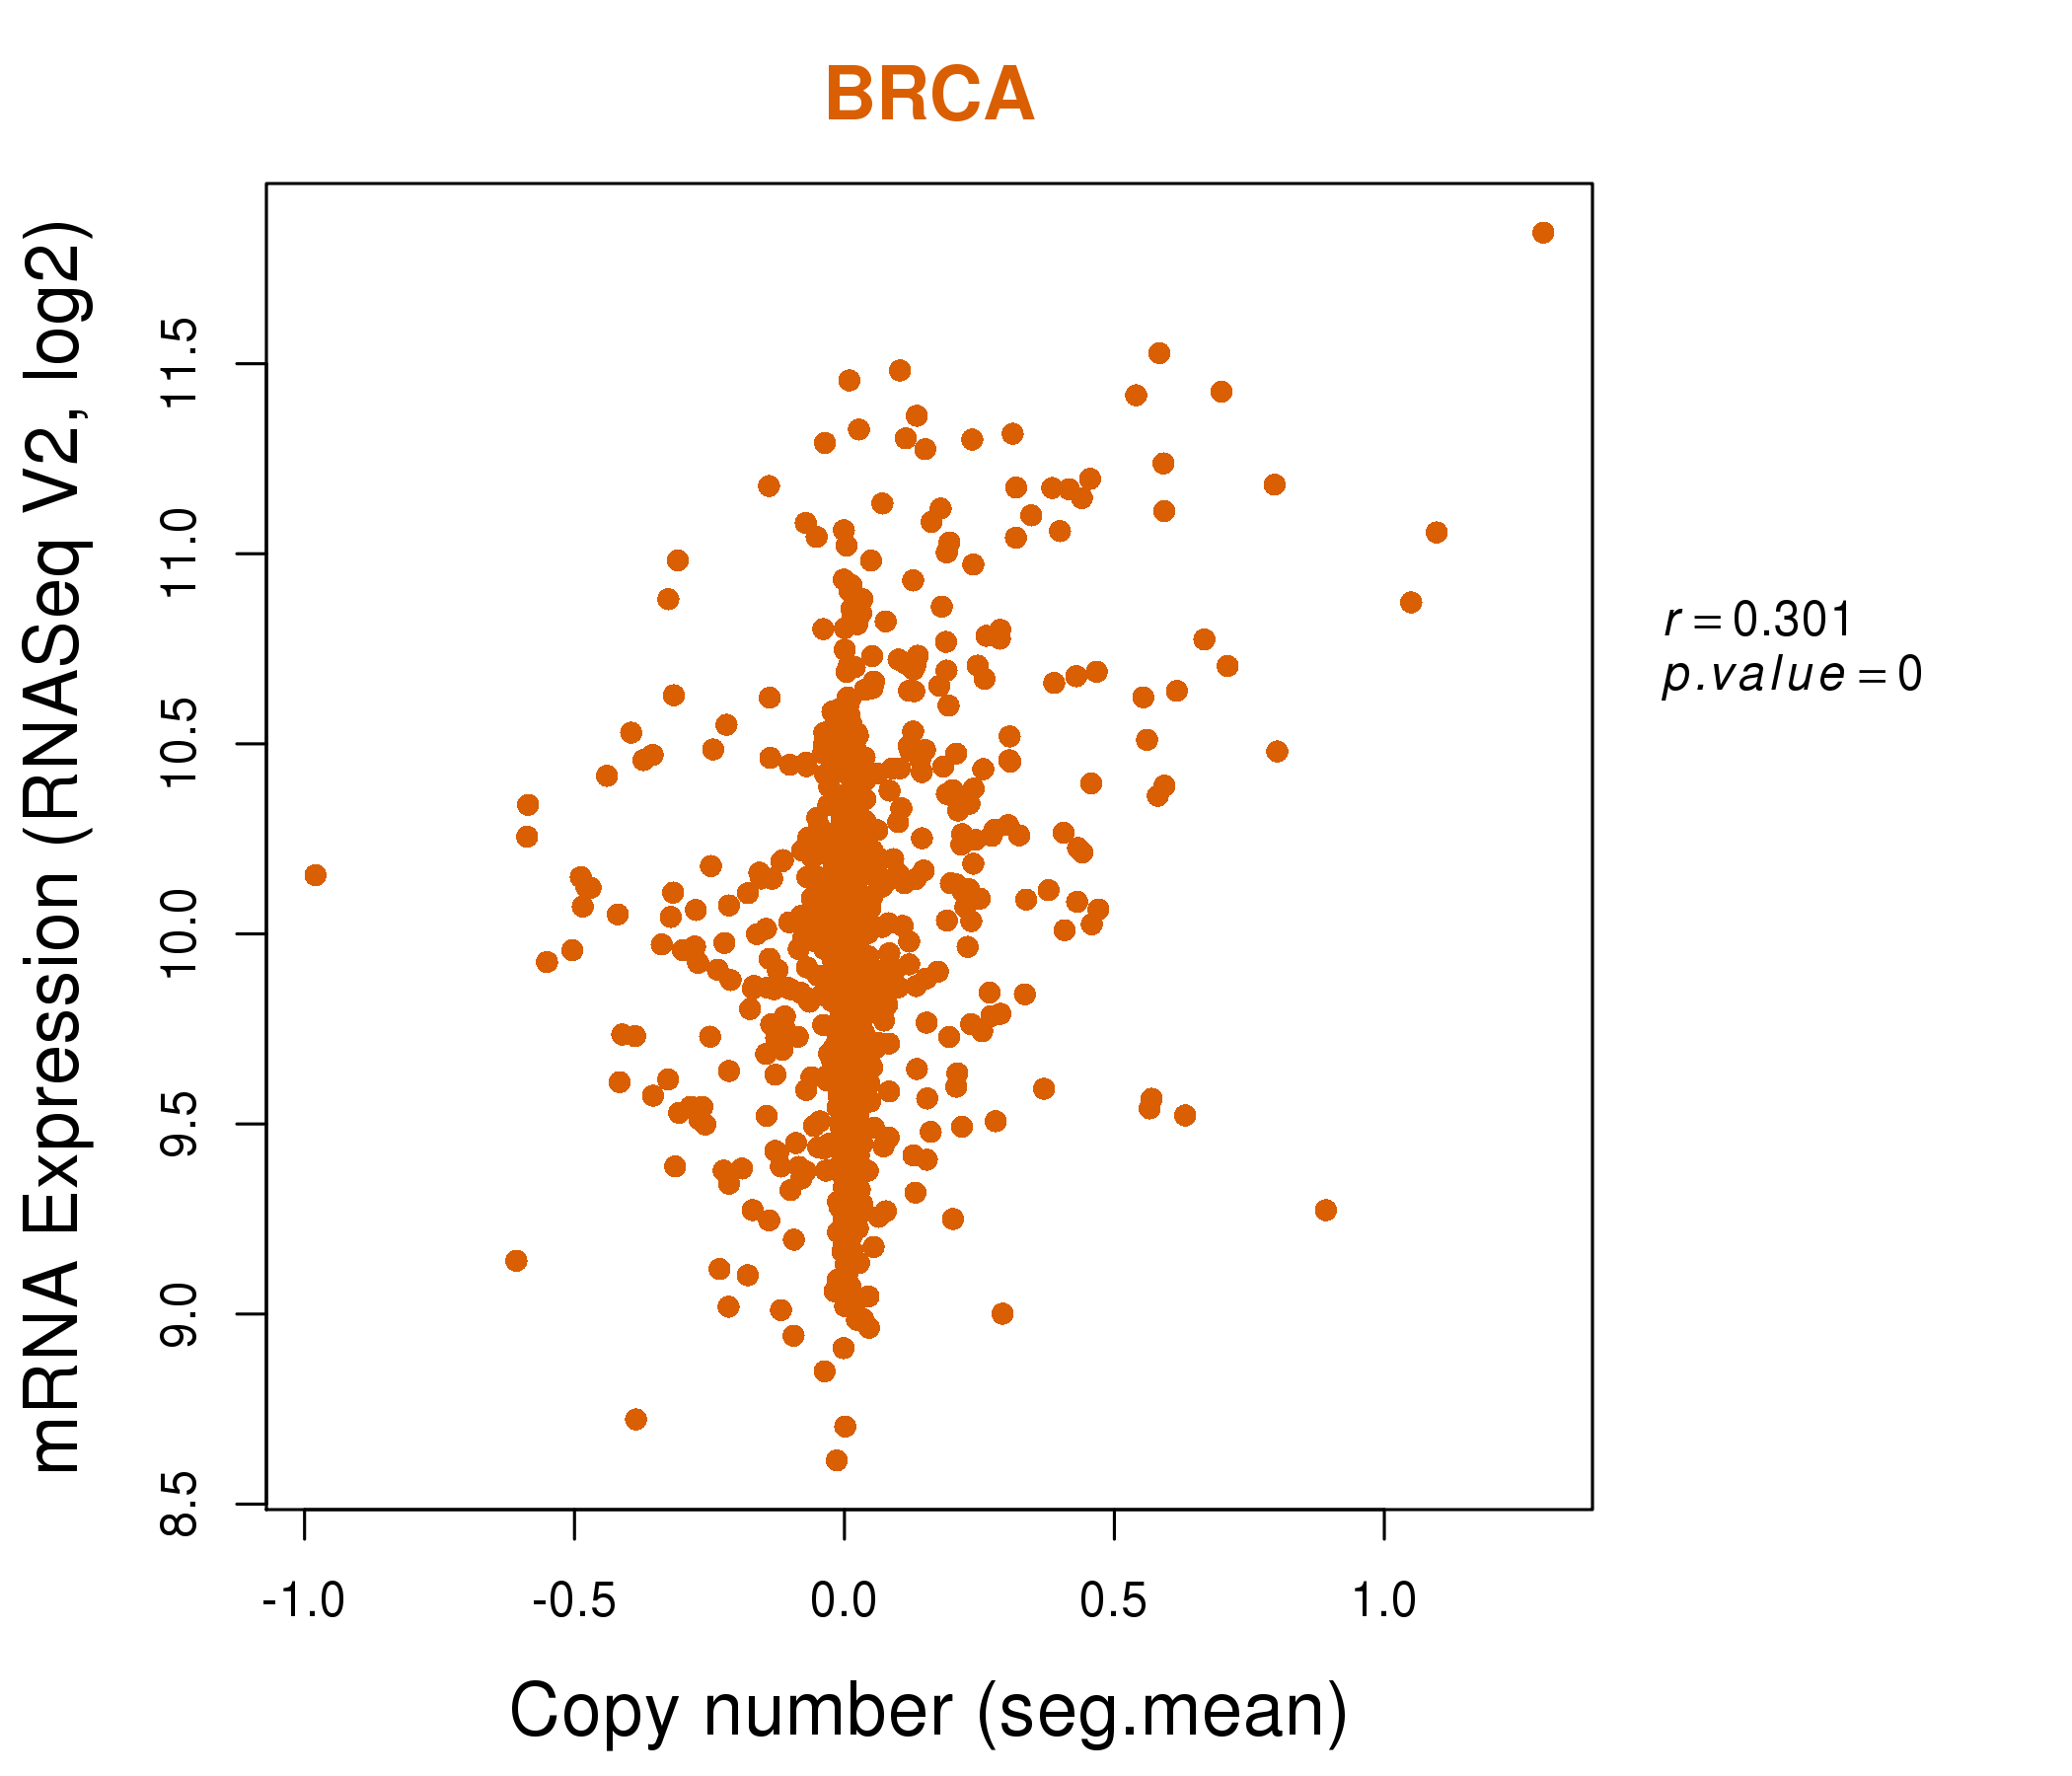
| * Normalized gene expression data of RNASeqV2 was extracted from TCGA using R package TCGA-Assembler. The URLs of all public data files on TCGA DCC data server were gathered at Jan-05-2015. Only eight cancer types have enough normal control samples for differential expression analysis. (t test, adjusted p<0.05 (using Benjamini-Hochberg FDR)) |
 |
| Top |
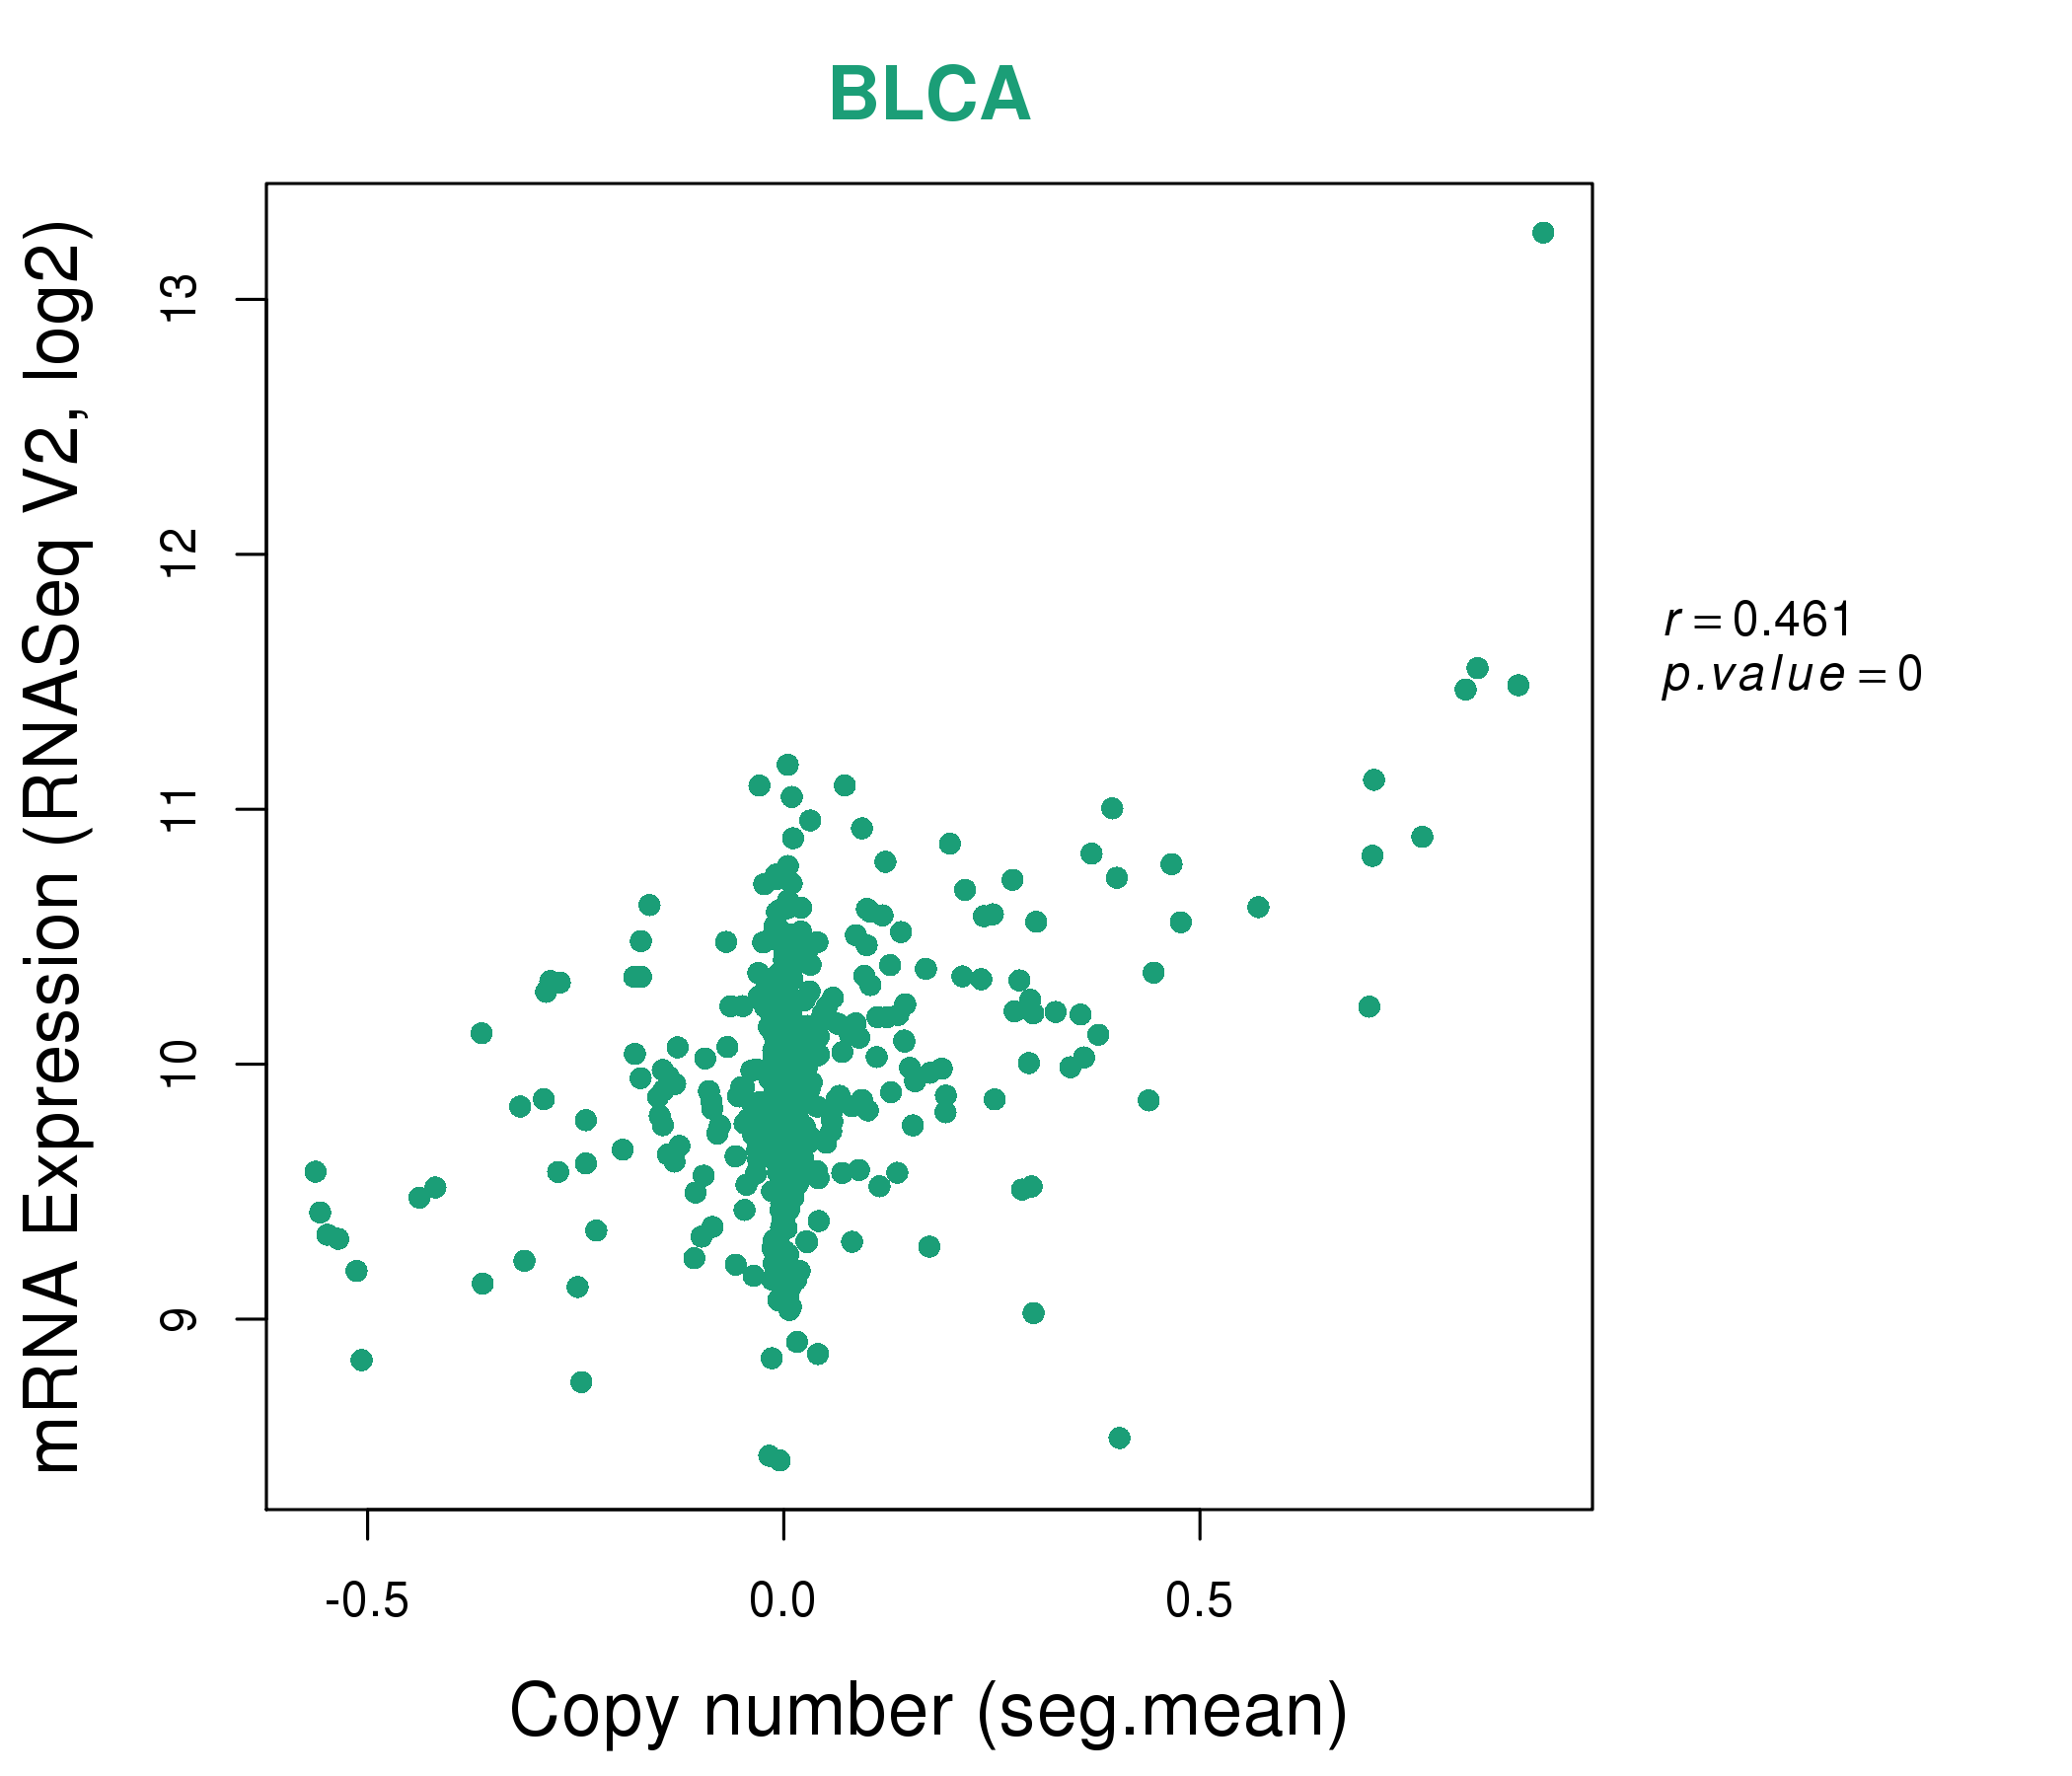
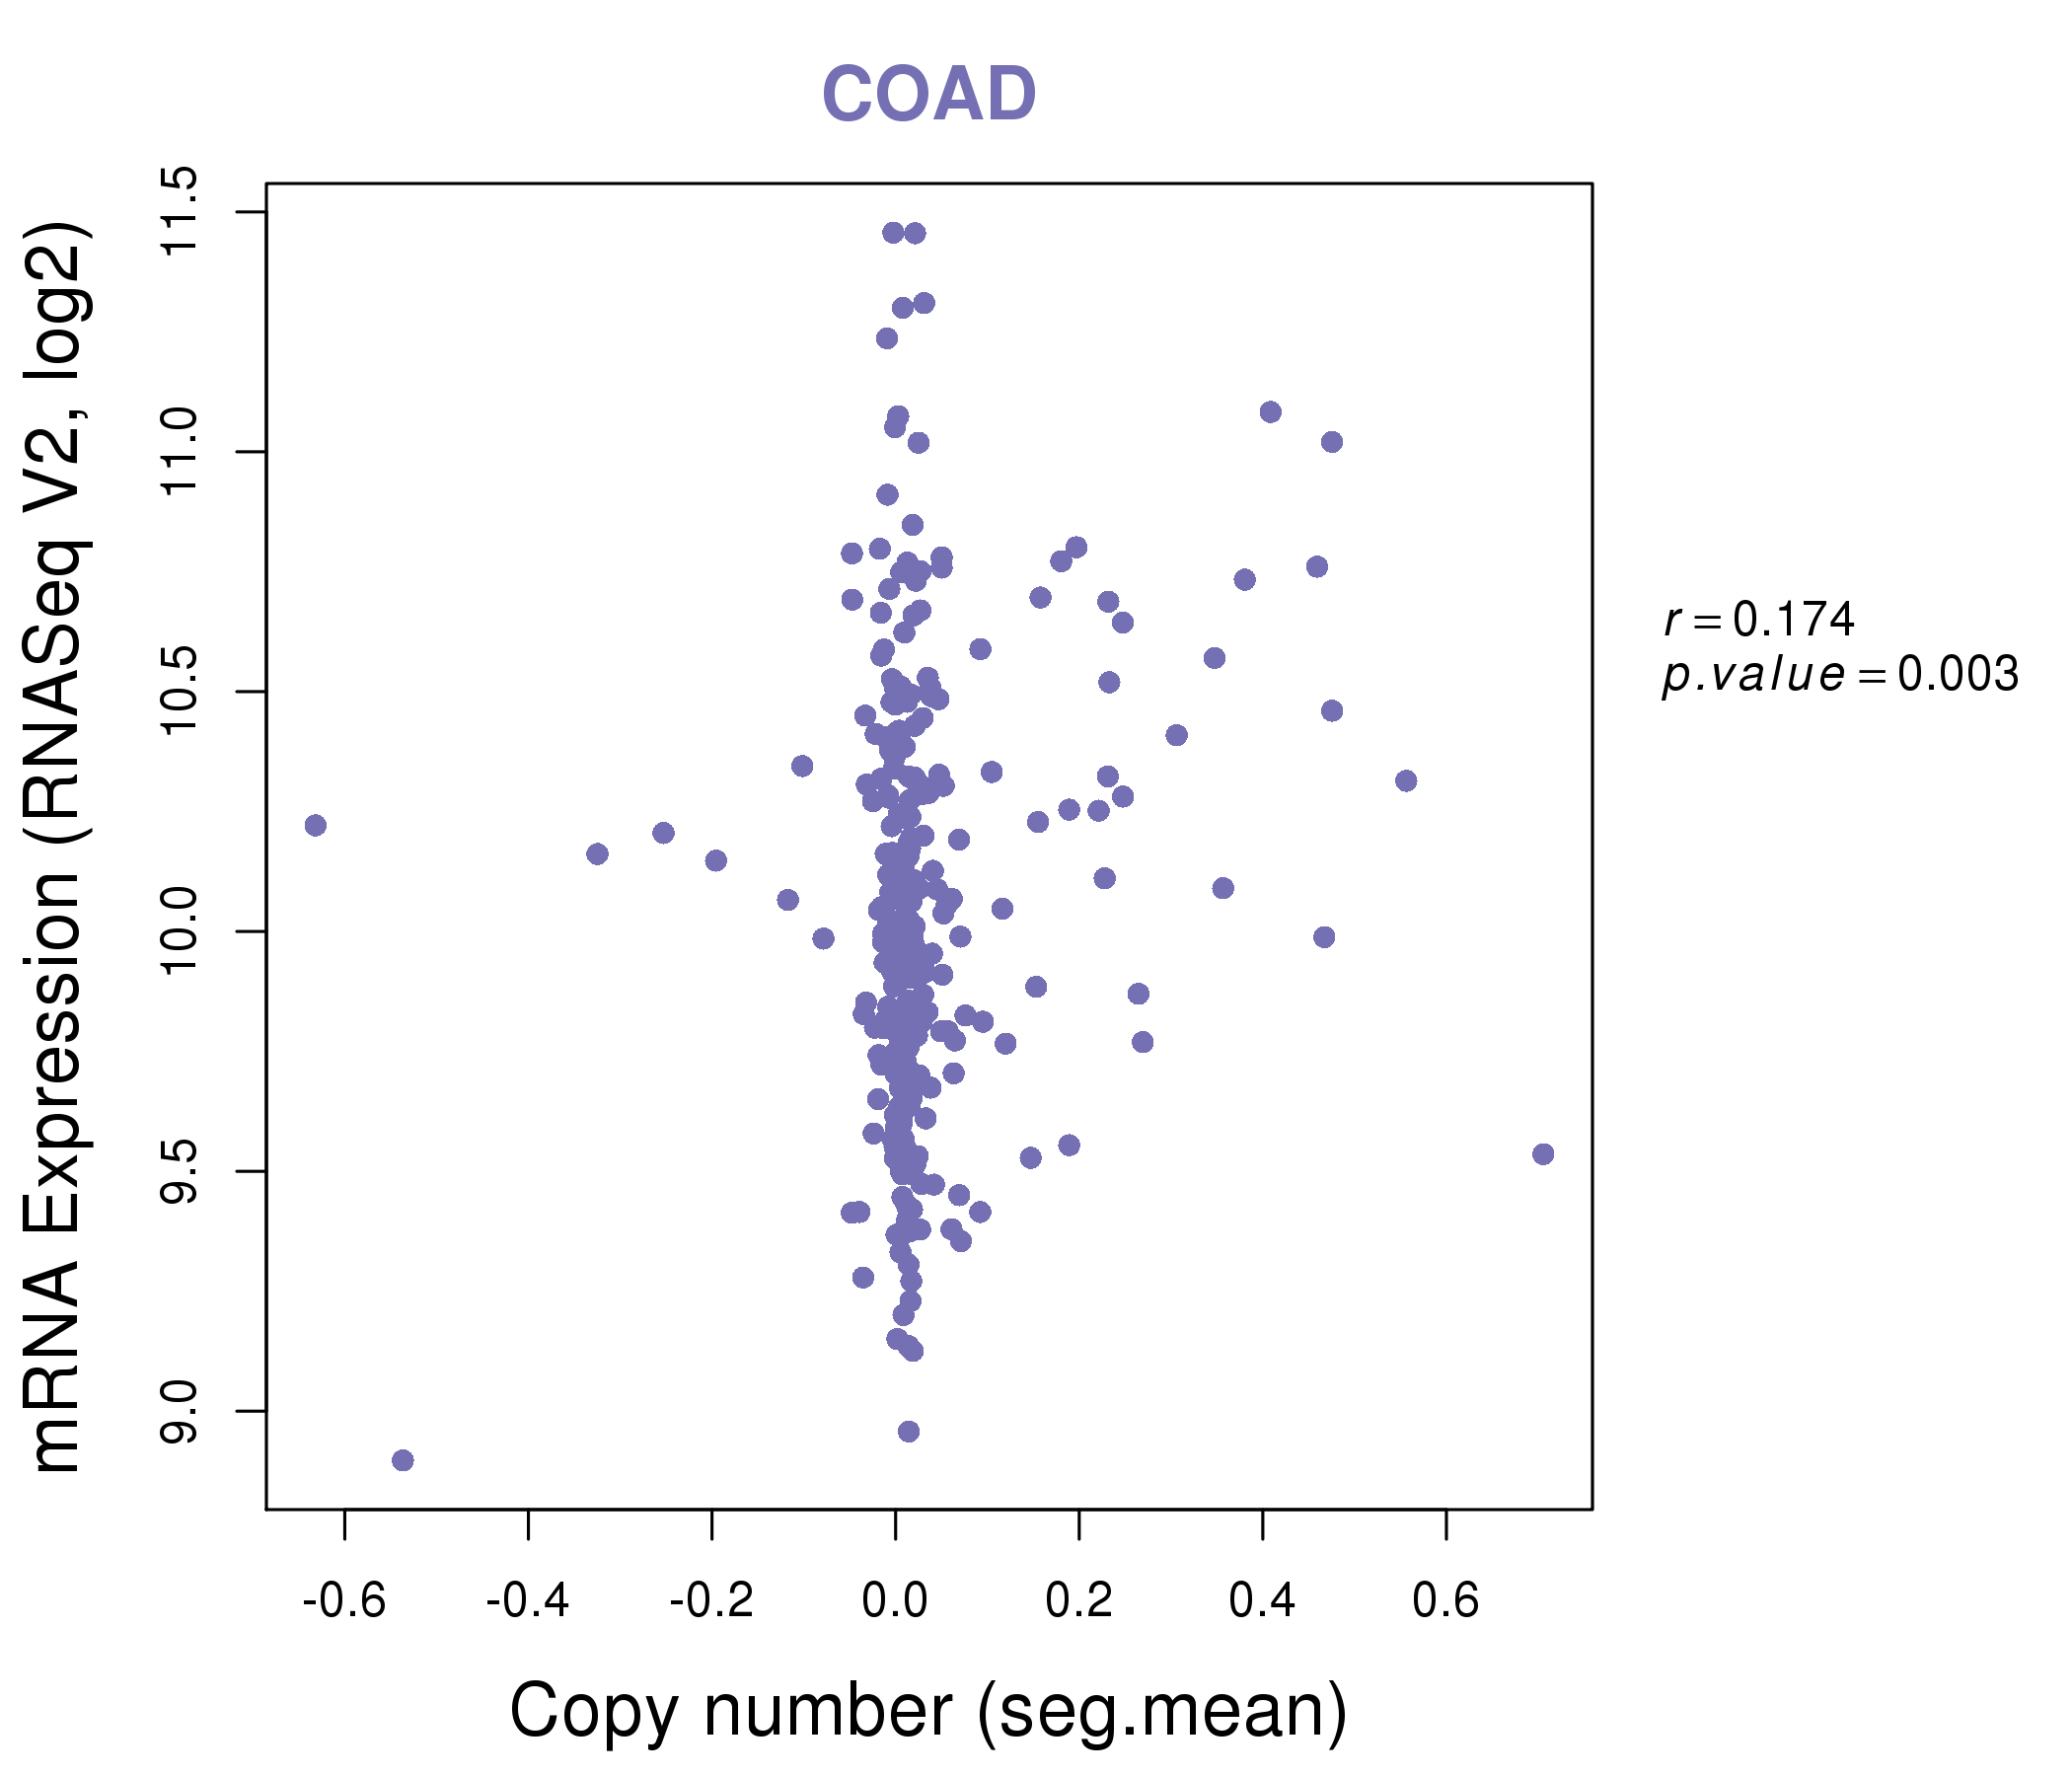
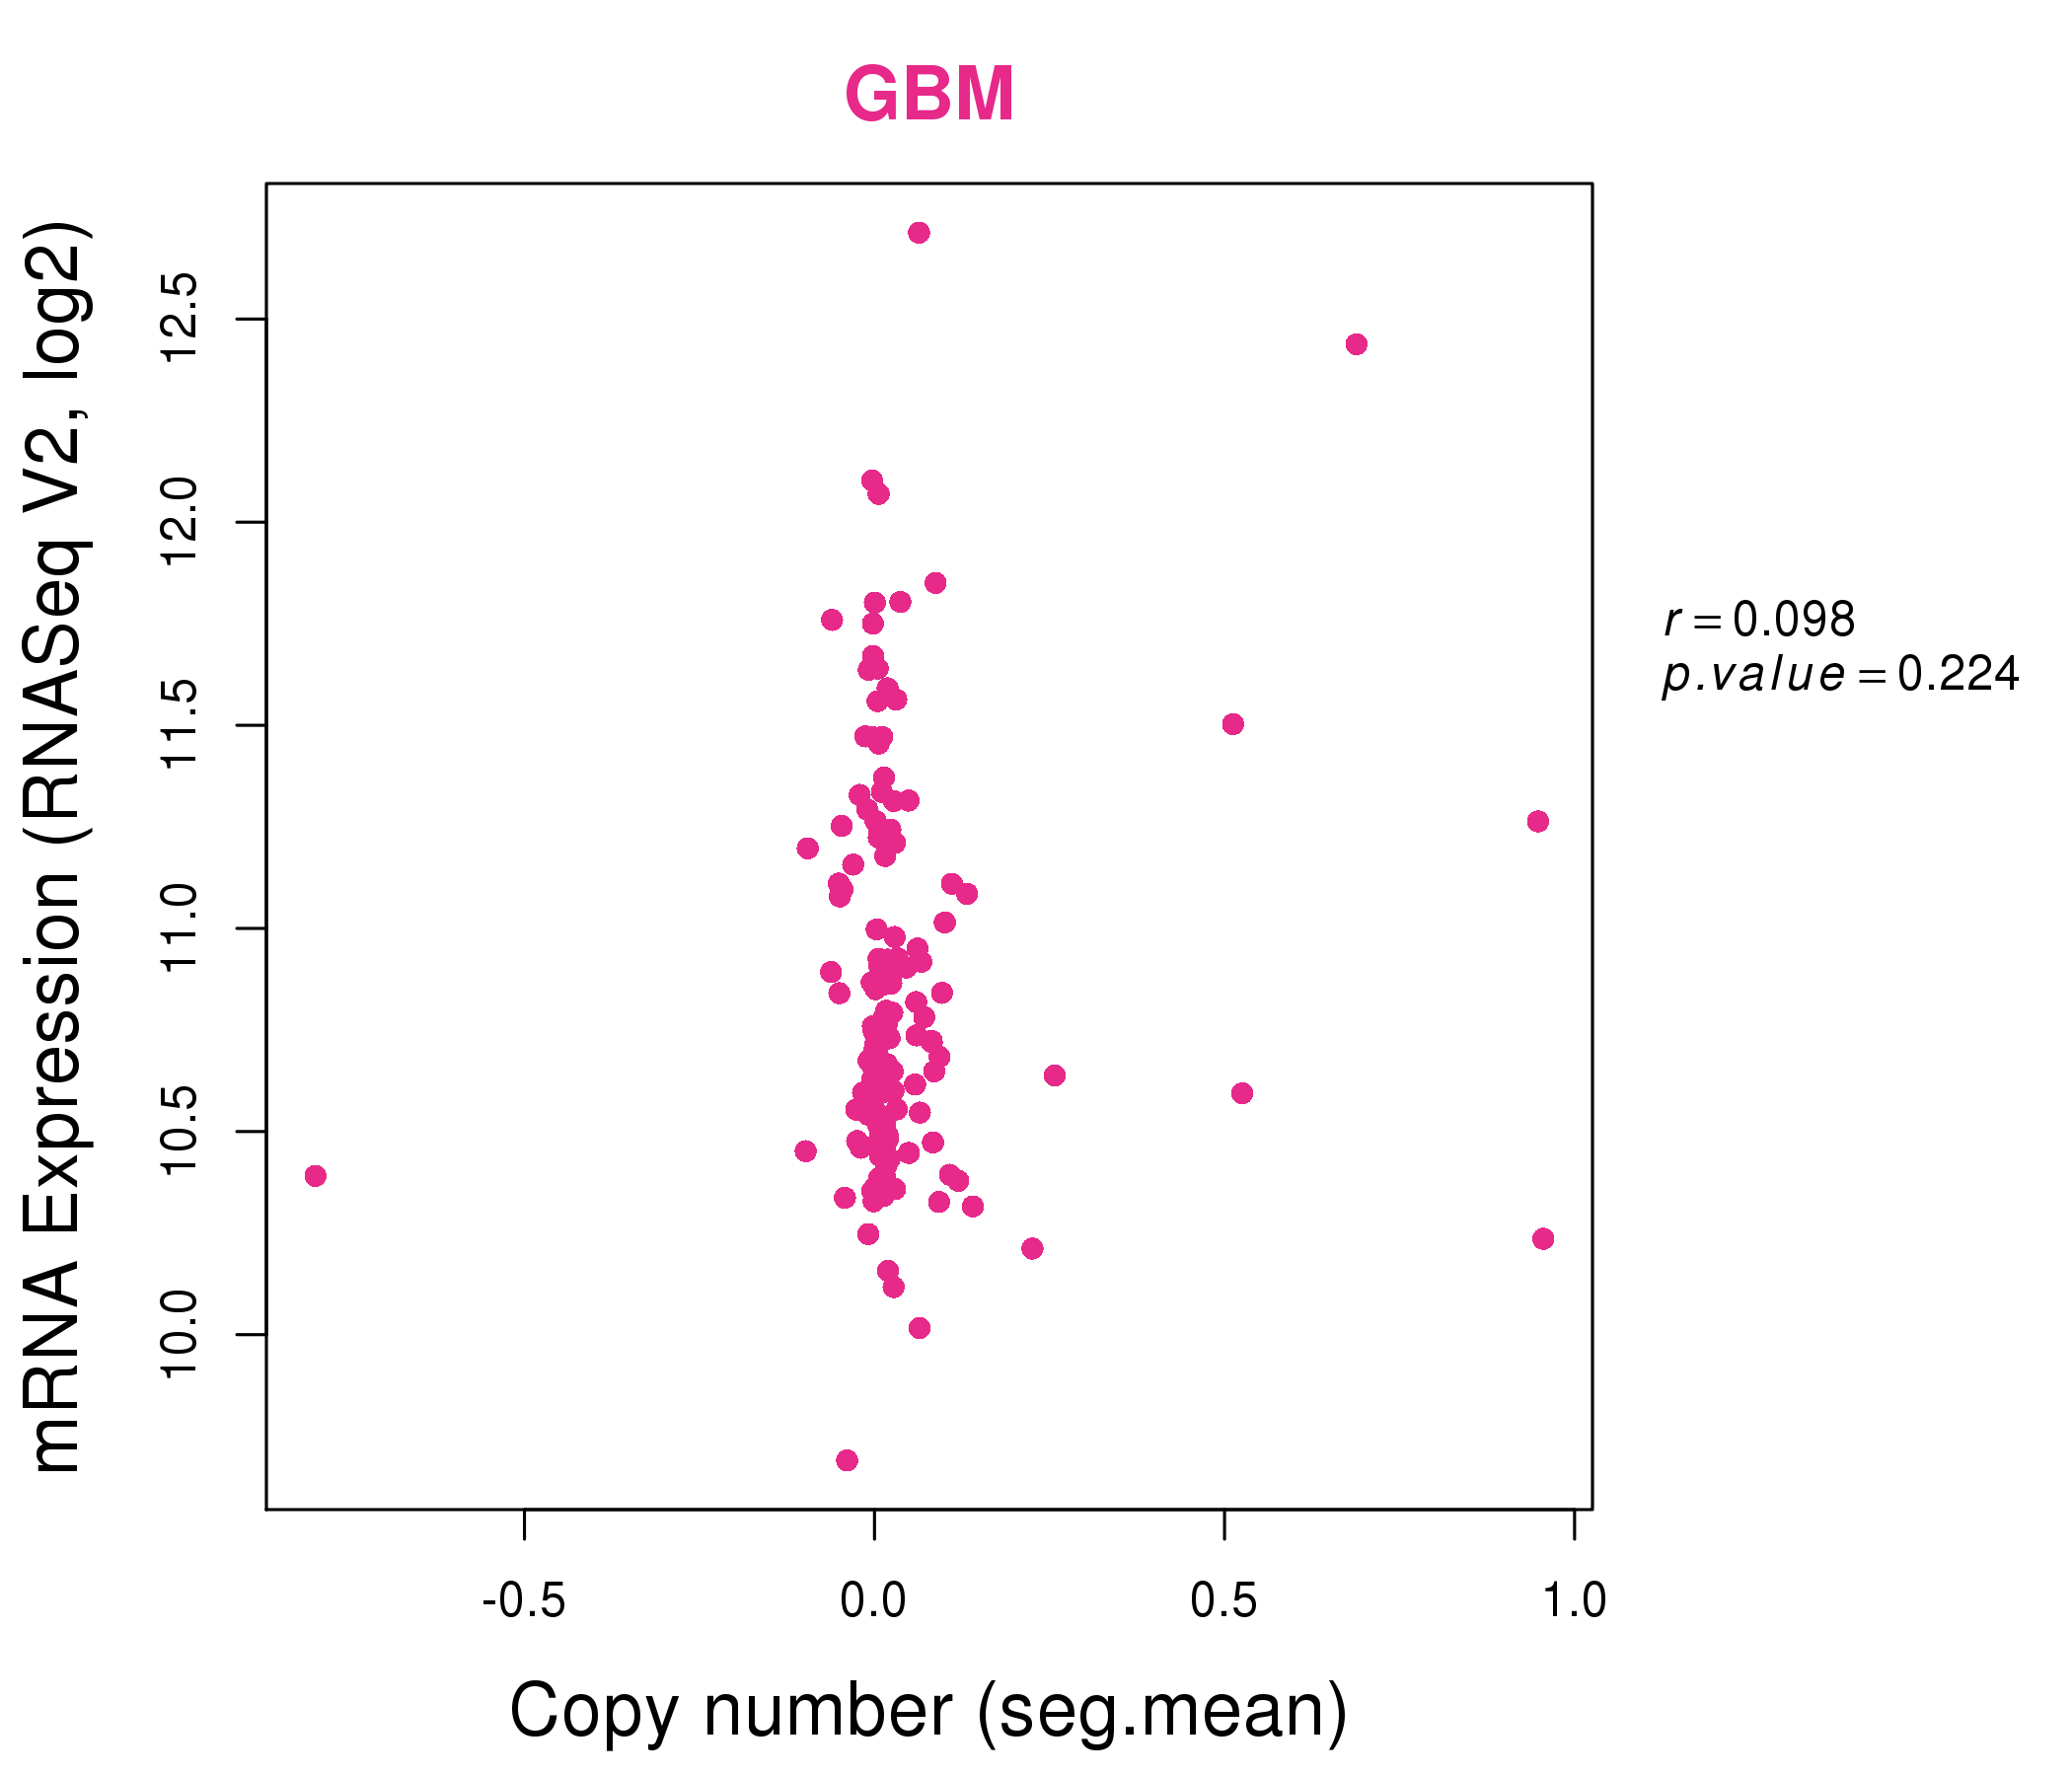
| * This plots show the correlation between CNV and gene expression. |
: Open all plots for all cancer types
 |
|
 |
|
| Top |
| Gene-Gene Network Information |
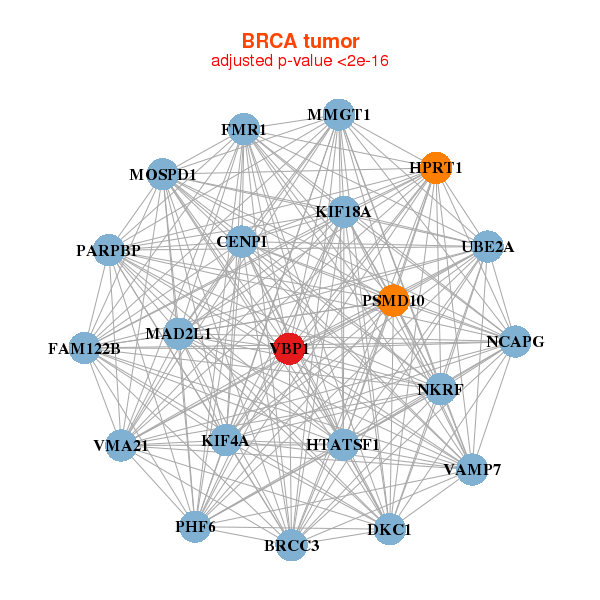
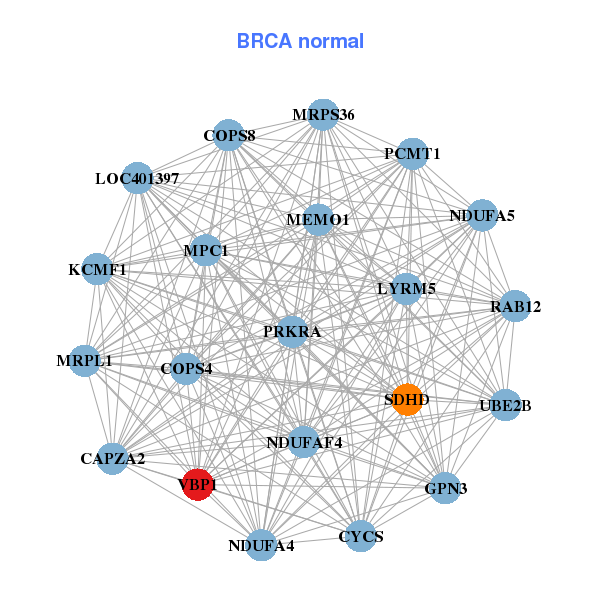
| * Co-Expression network figures were drawn using R package igraph. Only the top 20 genes with the highest correlations were shown. Red circle: input gene, orange circle: cell metabolism gene, sky circle: other gene |
: Open all plots for all cancer types
 |
|
| BRCC3,PARPBP,CENPI,DKC1,FAM122B,FMR1,HPRT1, HTATSF1,KIF18A,KIF4A,MAD2L1,MMGT1,MOSPD1,NCAPG, NKRF,PHF6,PSMD10,UBE2A,VAMP7,VBP1,VMA21 | MPC1,CAPZA2,COPS4,COPS8,CYCS,GPN3,KCMF1, LOC401397,LYRM5,MEMO1,MRPL1,MRPS36,NDUFA4,NDUFA5, NDUFAF4,PCMT1,PRKRA,RAB12,SDHD,UBE2B,VBP1 |
 |
|
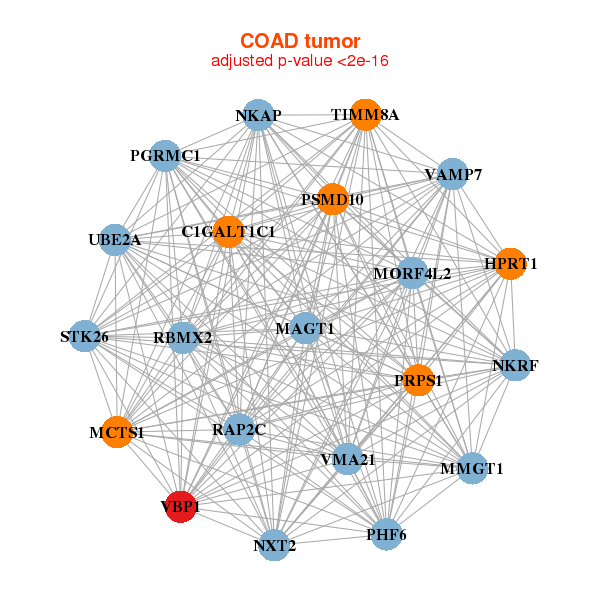
| C1GALT1C1,HPRT1,MAGT1,MCTS1,MMGT1,MORF4L2,STK26, NKAP,NKRF,NXT2,PGRMC1,PHF6,PRPS1,PSMD10, RAP2C,RBMX2,TIMM8A,UBE2A,VAMP7,VBP1,VMA21 | COPS3,COPS4,ERH,LSM5,MOB4,MRPS10,NAA20, POLR2K,RCN2,SARNP,SNRPB2,SNRPE,SSBP1,SUB1, TCEB1,THOC7,TMEM50B,TOMM5,UBA3,UBE2N,VBP1 |
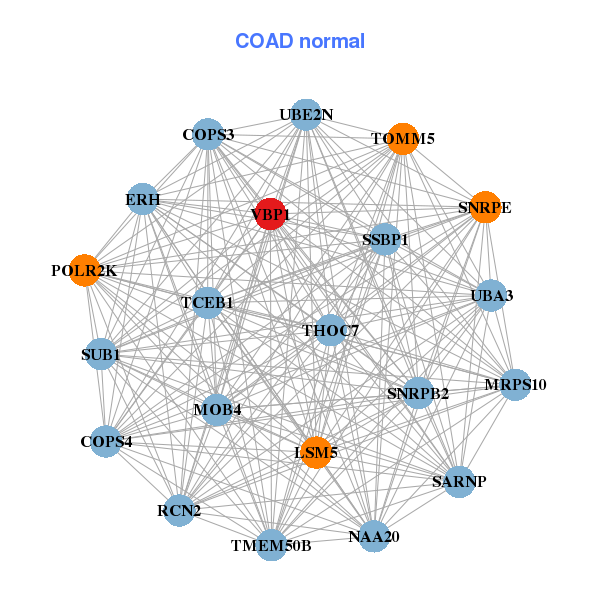
| * Co-Expression network figures were drawn using R package igraph. Only the top 20 genes with the highest correlations were shown. Red circle: input gene, orange circle: cell metabolism gene, sky circle: other gene |
: Open all plots for all cancer types
| Top |
: Open all interacting genes' information including KEGG pathway for all interacting genes from DAVID
| Top |
| Pharmacological Information for VBP1 |
| There's no related Drug. |
| Top |
| Cross referenced IDs for VBP1 |
| * We obtained these cross-references from Uniprot database. It covers 150 different DBs, 18 categories. http://www.uniprot.org/help/cross_references_section |
: Open all cross reference information
|
Copyright © 2016-Present - The Univsersity of Texas Health Science Center at Houston @ |