|
||||||||||||||||||||
| |
| Phenotypic Information (metabolism pathway, cancer, disease, phenome) |
| |
| |
| Gene-Gene Network Information: Co-Expression Network, Interacting Genes & KEGG |
| |
|


| Gene Summary for VDAC1 |
| Basic gene info. | Gene symbol | VDAC1 |
| Gene name | voltage-dependent anion channel 1 | |
| Synonyms | PORIN|VDAC-1 | |
| Cytomap | UCSC genome browser: 5q31 | |
| Genomic location | chr5 :133307565-133340657 | |
| Type of gene | protein-coding | |
| RefGenes | NM_003374.2, NR_036624.1,NR_036625.1, | |
| Ensembl id | ENSG00000213585 | |
| Description | outer mitochondrial membrane protein porin 1plasmalemmal porinporin 31HLporin 31HMvoltage-dependent anion-selective channel protein 1 | |
| Modification date | 20141207 | |
| dbXrefs | MIM : 604492 | |
| HGNC : HGNC | ||
| Ensembl : ENSG00000213585 | ||
| HPRD : 05137 | ||
| Vega : OTTHUMG00000129118 | ||
| Protein | UniProt: P21796 go to UniProt's Cross Reference DB Table | |
| Expression | CleanEX: HS_VDAC1 | |
| BioGPS: 7416 | ||
| Gene Expression Atlas: ENSG00000213585 | ||
| The Human Protein Atlas: ENSG00000213585 | ||
| Pathway | NCI Pathway Interaction Database: VDAC1 | |
| KEGG: VDAC1 | ||
| REACTOME: VDAC1 | ||
| ConsensusPathDB | ||
| Pathway Commons: VDAC1 | ||
| Metabolism | MetaCyc: VDAC1 | |
| HUMANCyc: VDAC1 | ||
| Regulation | Ensembl's Regulation: ENSG00000213585 | |
| miRBase: chr5 :133,307,565-133,340,657 | ||
| TargetScan: NM_003374 | ||
| cisRED: ENSG00000213585 | ||
| Context | iHOP: VDAC1 | |
| cancer metabolism search in PubMed: VDAC1 | ||
| UCL Cancer Institute: VDAC1 | ||
| Assigned class in ccmGDB | A - This gene has a literature evidence and it belongs to cancer gene. | |
| References showing role of VDAC1 in cancer cell metabolism | 1. Prezma T, Shteinfer A, Admoni L, Raviv Z, Sela I, et al. (2013) VDAC1-based peptides: novel pro-apoptotic agents and potential therapeutics for B-cell chronic lymphocytic leukemia. Cell death & disease 4: e809. go to article 2. Arif T, Vasilkovsky L, Refaely Y, Konson A, Shoshan-Barmatz V (2014) Silencing VDAC1 expression by siRNA inhibits cancer cell proliferation and tumor growth in vivo. Molecular Therapy—Nucleic Acids 3: e159. go to article | |
| Top |
| Phenotypic Information for VDAC1(metabolism pathway, cancer, disease, phenome) |
| Cancer | CGAP: VDAC1 |
| Familial Cancer Database: VDAC1 | |
| * This gene is included in those cancer gene databases. |
|
|
|
|
|
| . | ||||||||||||||
Oncogene 1 | Significant driver gene in | |||||||||||||||||||
| cf) number; DB name 1 Oncogene; http://nar.oxfordjournals.org/content/35/suppl_1/D721.long, 2 Tumor Suppressor gene; https://bioinfo.uth.edu/TSGene/, 3 Cancer Gene Census; http://www.nature.com/nrc/journal/v4/n3/abs/nrc1299.html, 4 CancerGenes; http://nar.oxfordjournals.org/content/35/suppl_1/D721.long, 5 Network of Cancer Gene; http://ncg.kcl.ac.uk/index.php, 1Therapeutic Vulnerabilities in Cancer; http://cbio.mskcc.org/cancergenomics/statius/ |
| REACTOME_METABOLISM_OF_PROTEINS | |
| OMIM | 604492; gene+phenotype. |
| Orphanet | |
| Disease | KEGG Disease: VDAC1 |
| MedGen: VDAC1 (Human Medical Genetics with Condition) | |
| ClinVar: VDAC1 | |
| Phenotype | MGI: VDAC1 (International Mouse Phenotyping Consortium) |
| PhenomicDB: VDAC1 | |
| Mutations for VDAC1 |
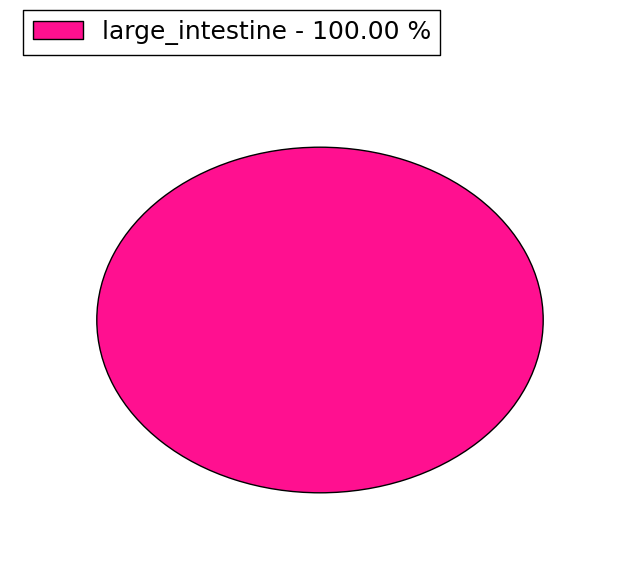
| * Under tables are showing count per each tissue to give us broad intuition about tissue specific mutation patterns.You can go to the detailed page for each mutation database's web site. |
| - Statistics for Tissue and Mutation type | Top |
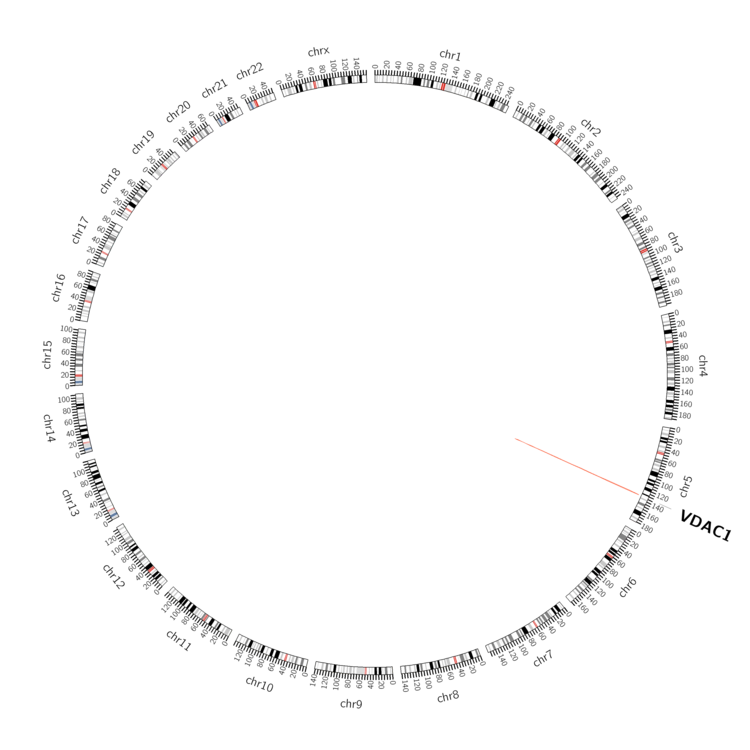 |
| - For Inter-chromosomal Variations |
| There's no inter-chromosomal structural variation. |
| - For Intra-chromosomal Variations |
| * Intra-chromosomal variantions includes 'intrachromosomal amplicon to amplicon', 'intrachromosomal amplicon to non-amplified dna', 'intrachromosomal deletion', 'intrachromosomal fold-back inversion', 'intrachromosomal inversion', 'intrachromosomal tandem duplication', 'Intrachromosomal unknown type', 'intrachromosomal with inverted orientation', 'intrachromosomal with non-inverted orientation'. |
 |
| Sample | Symbol_a | Chr_a | Start_a | End_a | Symbol_b | Chr_b | Start_b | End_b |
| ovary | VDAC1 | chr5 | 133339900 | 133339920 | chr5 | 134177025 | 134177045 |
| cf) Tissue number; Tissue name (1;Breast, 2;Central_nervous_system, 3;Haematopoietic_and_lymphoid_tissue, 4;Large_intestine, 5;Liver, 6;Lung, 7;Ovary, 8;Pancreas, 9;Prostate, 10;Skin, 11;Soft_tissue, 12;Upper_aerodigestive_tract) |
| * From mRNA Sanger sequences, Chitars2.0 arranged chimeric transcripts. This table shows VDAC1 related fusion information. |
| ID | Head Gene | Tail Gene | Accession | Gene_a | qStart_a | qEnd_a | Chromosome_a | tStart_a | tEnd_a | Gene_a | qStart_a | qEnd_a | Chromosome_a | tStart_a | tEnd_a |
| DA973843 | LOC100507412 | 1 | 107 | ? | 112074 | 112180 | VDAC1 | 107 | 550 | 5 | 133316597 | 133340401 | |
| Top |
| There's no copy number variation information in COSMIC data for this gene. |
| Top |
|
 |
| Top |
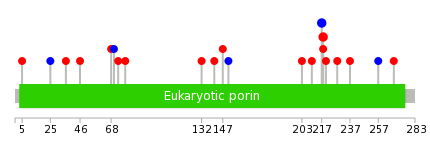
| Stat. for Non-Synonymous SNVs (# total SNVs=13) | (# total SNVs=4) |
 |  |
(# total SNVs=1) | (# total SNVs=0) |
 |
| Top |
| * When you move the cursor on each content, you can see more deailed mutation information on the Tooltip. Those are primary_site,primary_histology,mutation(aa),pubmedID. |
| GRCh37 position | Mutation(aa) | Unique sampleID count |
| chr5:133326832-133326832 | p.S44* | 2 |
| chr5:133311611-133311611 | p.R218H | 2 |
| chr5:133311613-133311613 | p.T217T | 2 |
| chr5:133311636-133311636 | p.W210R | 1 |
| chr5:133326753-133326753 | p.T70T | 1 |
| chr5:133311655-133311655 | p.E203D | 1 |
| chr5:133326760-133326760 | p.G68D | 1 |
| chr5:133316436-133316436 | p.Q179* | 1 |
| chr5:133326826-133326826 | p.S46L | 1 |
| chr5:133308512-133308512 | p.V268I | 1 |
| Top |
|
 |
| Point Mutation/ Tissue ID | 1 | 2 | 3 | 4 | 5 | 6 | 7 | 8 | 9 | 10 | 11 | 12 | 13 | 14 | 15 | 16 | 17 | 18 | 19 | 20 |
| # sample | 1 | 4 | 1 | 1 | 1 | 1 | 4 | 1 | 3 | |||||||||||
| # mutation | 1 | 4 | 1 | 1 | 1 | 1 | 4 | 1 | 4 | |||||||||||
| nonsynonymous SNV | 1 | 4 | 1 | 1 | 3 | 1 | 2 | |||||||||||||
| synonymous SNV | 1 | 1 | 1 | 2 |
| cf) Tissue ID; Tissue type (1; BLCA[Bladder Urothelial Carcinoma], 2; BRCA[Breast invasive carcinoma], 3; CESC[Cervical squamous cell carcinoma and endocervical adenocarcinoma], 4; COAD[Colon adenocarcinoma], 5; GBM[Glioblastoma multiforme], 6; Glioma Low Grade, 7; HNSC[Head and Neck squamous cell carcinoma], 8; KICH[Kidney Chromophobe], 9; KIRC[Kidney renal clear cell carcinoma], 10; KIRP[Kidney renal papillary cell carcinoma], 11; LAML[Acute Myeloid Leukemia], 12; LUAD[Lung adenocarcinoma], 13; LUSC[Lung squamous cell carcinoma], 14; OV[Ovarian serous cystadenocarcinoma ], 15; PAAD[Pancreatic adenocarcinoma], 16; PRAD[Prostate adenocarcinoma], 17; SKCM[Skin Cutaneous Melanoma], 18:STAD[Stomach adenocarcinoma], 19:THCA[Thyroid carcinoma], 20:UCEC[Uterine Corpus Endometrial Carcinoma]) |
| Top |
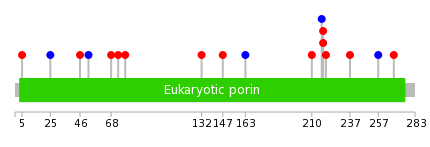
| * We represented just top 10 SNVs. When you move the cursor on each content, you can see more deailed mutation information on the Tooltip. Those are primary_site, primary_histology, mutation(aa), pubmedID. |
| Genomic Position | Mutation(aa) | Unique sampleID count |
| chr5:133316484 | p.E73D | 1 |
| chr5:133316532 | p.G68D | 1 |
| chr5:133316577 | p.T52T | 1 |
| chr5:133308512 | p.S46L | 1 |
| chr5:133326731 | p.V268I | 1 |
| chr5:133308543 | p.G25G | 1 |
| chr5:133326744 | p.L257L | 1 |
| chr5:133309532 | p.P5S | 1 |
| chr5:133326760 | p.V237A | 1 |
| chr5:133311606 | p.G220R | 1 |
| * Copy number data were extracted from TCGA using R package TCGA-Assembler. The URLs of all public data files on TCGA DCC data server were gathered on Jan-05-2015. Function ProcessCNAData in TCGA-Assembler package was used to obtain gene-level copy number value which is calculated as the average copy number of the genomic region of a gene. |
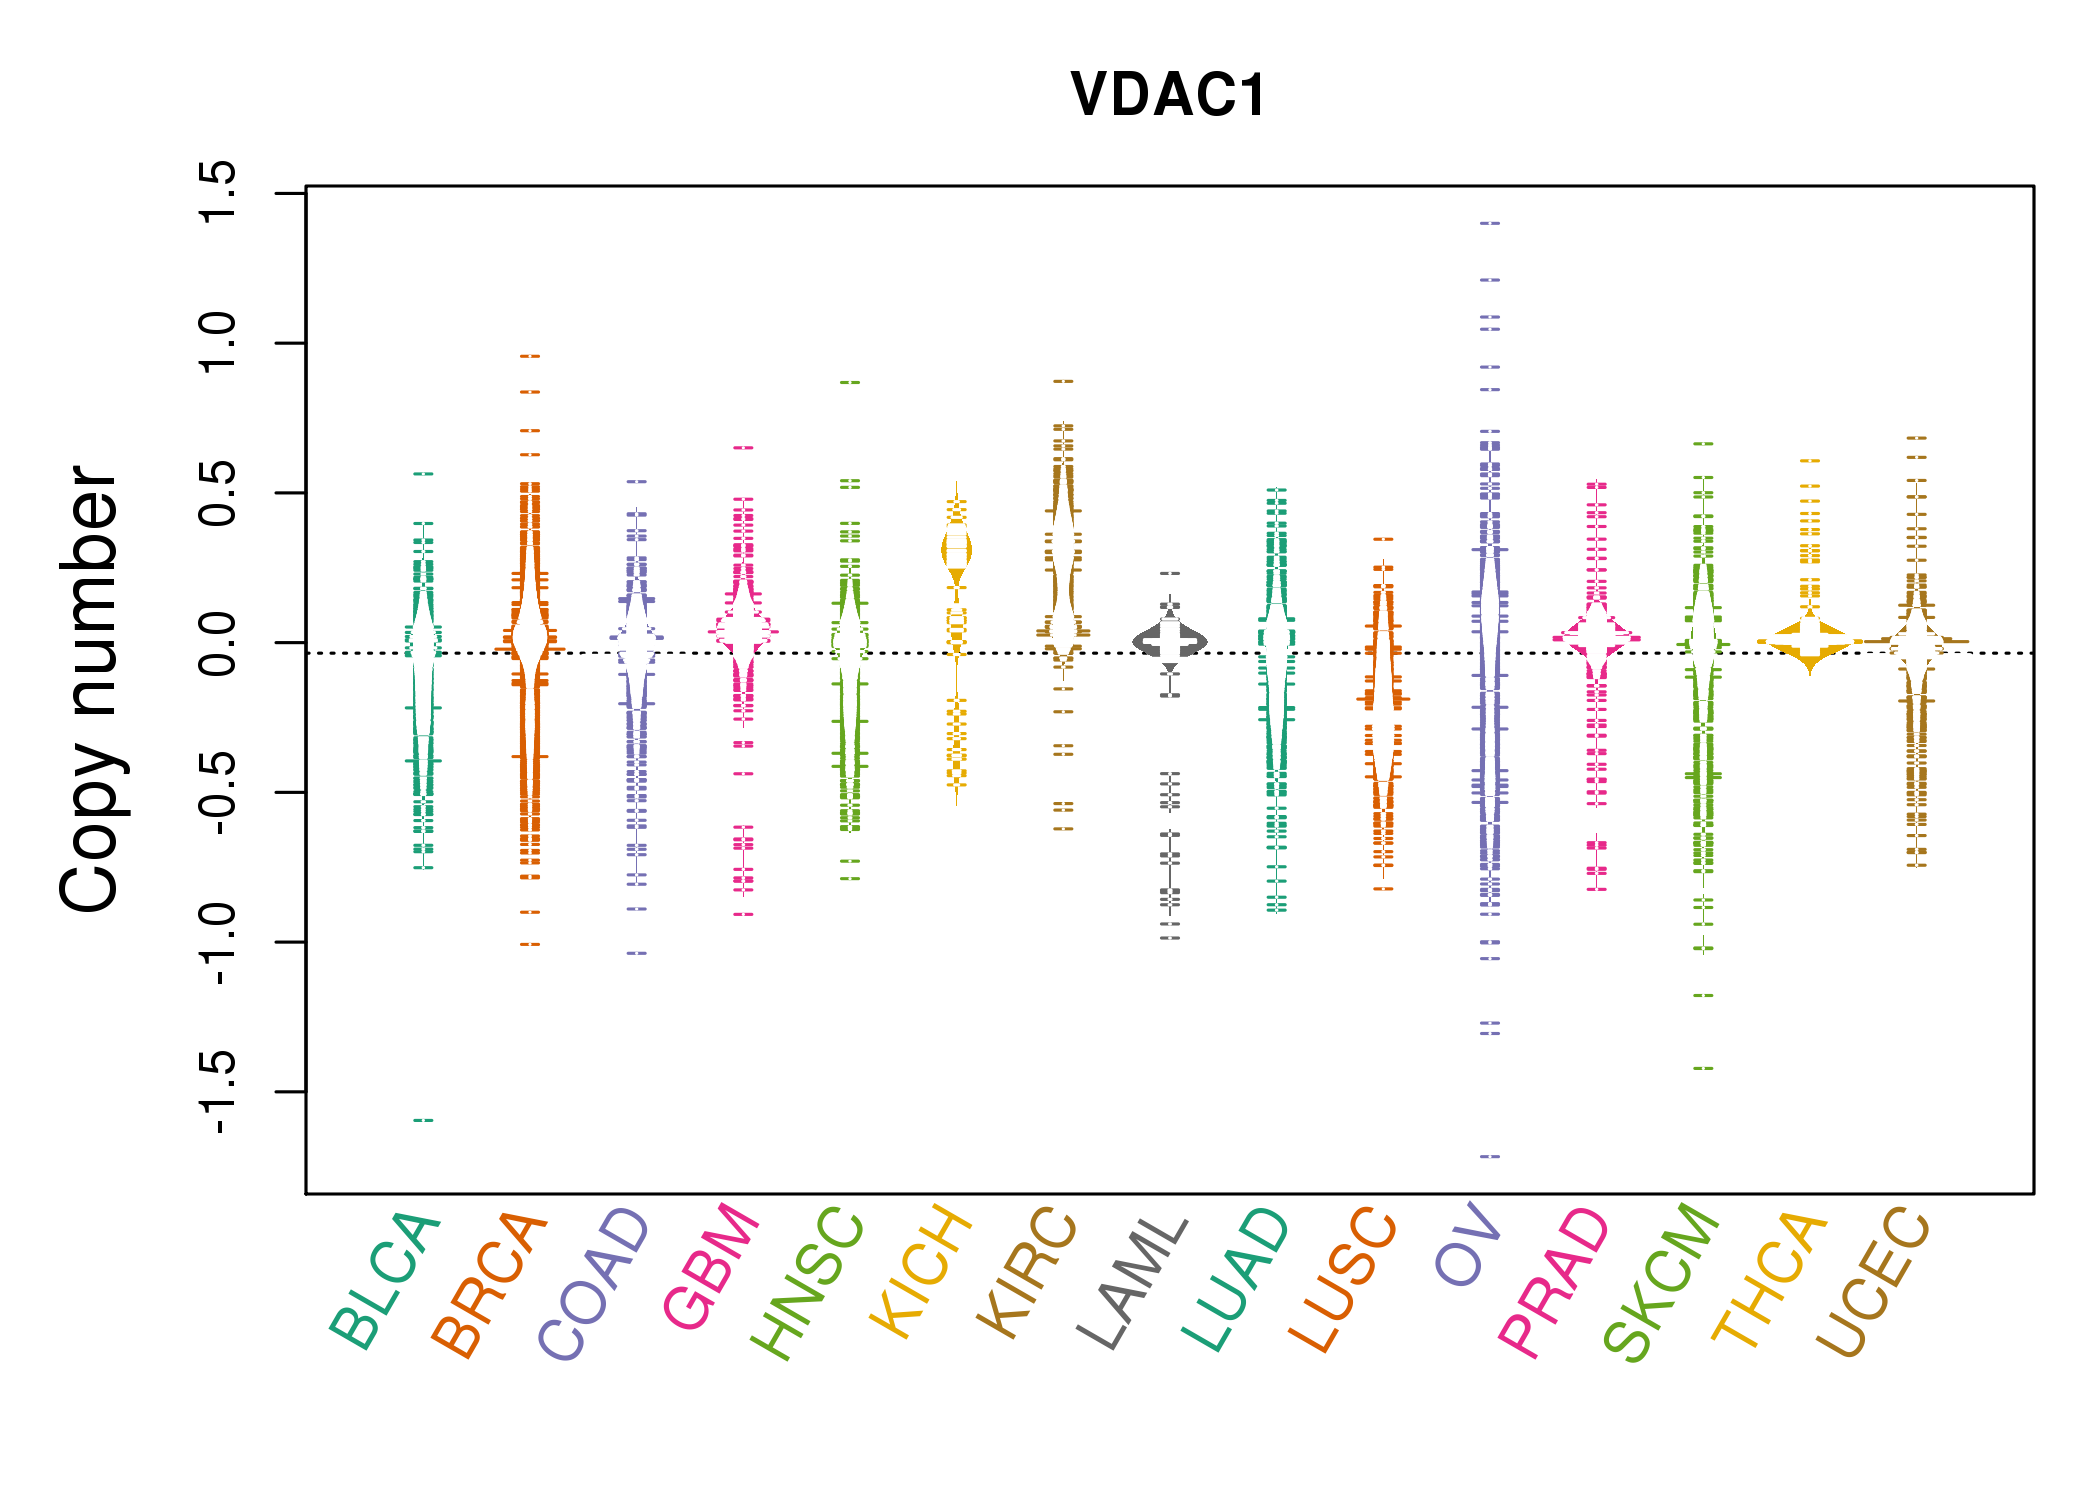 |
| cf) Tissue ID[Tissue type]: BLCA[Bladder Urothelial Carcinoma], BRCA[Breast invasive carcinoma], CESC[Cervical squamous cell carcinoma and endocervical adenocarcinoma], COAD[Colon adenocarcinoma], GBM[Glioblastoma multiforme], Glioma Low Grade, HNSC[Head and Neck squamous cell carcinoma], KICH[Kidney Chromophobe], KIRC[Kidney renal clear cell carcinoma], KIRP[Kidney renal papillary cell carcinoma], LAML[Acute Myeloid Leukemia], LUAD[Lung adenocarcinoma], LUSC[Lung squamous cell carcinoma], OV[Ovarian serous cystadenocarcinoma ], PAAD[Pancreatic adenocarcinoma], PRAD[Prostate adenocarcinoma], SKCM[Skin Cutaneous Melanoma], STAD[Stomach adenocarcinoma], THCA[Thyroid carcinoma], UCEC[Uterine Corpus Endometrial Carcinoma] |
| Top |
| Gene Expression for VDAC1 |
| * CCLE gene expression data were extracted from CCLE_Expression_Entrez_2012-10-18.res: Gene-centric RMA-normalized mRNA expression data. |
 |
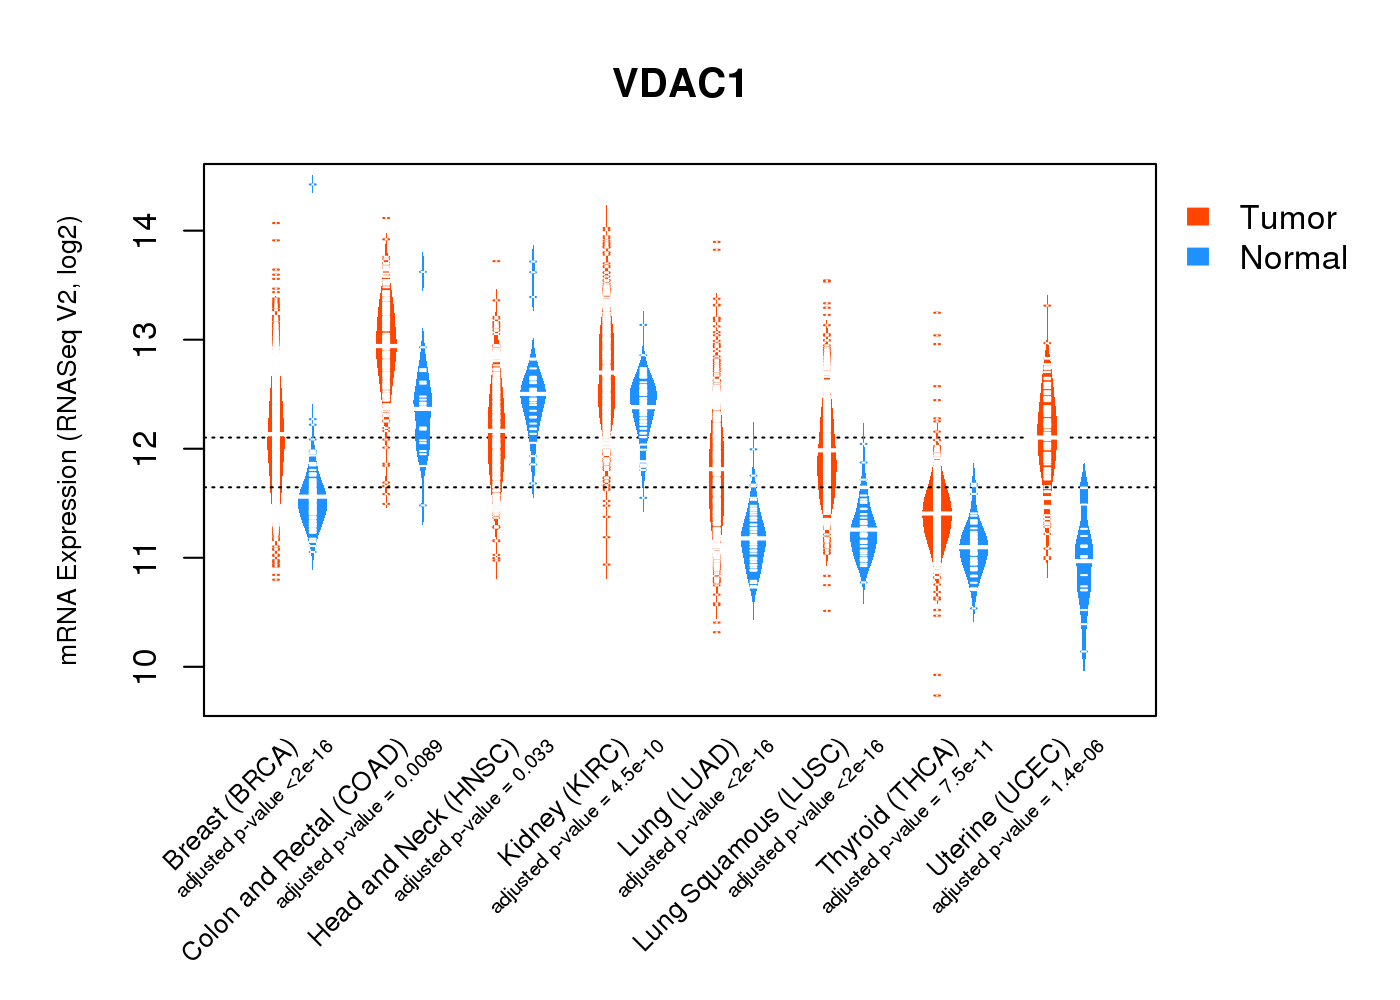
| * Normalized gene expression data of RNASeqV2 was extracted from TCGA using R package TCGA-Assembler. The URLs of all public data files on TCGA DCC data server were gathered at Jan-05-2015. Only eight cancer types have enough normal control samples for differential expression analysis. (t test, adjusted p<0.05 (using Benjamini-Hochberg FDR)) |
 |
| Top |
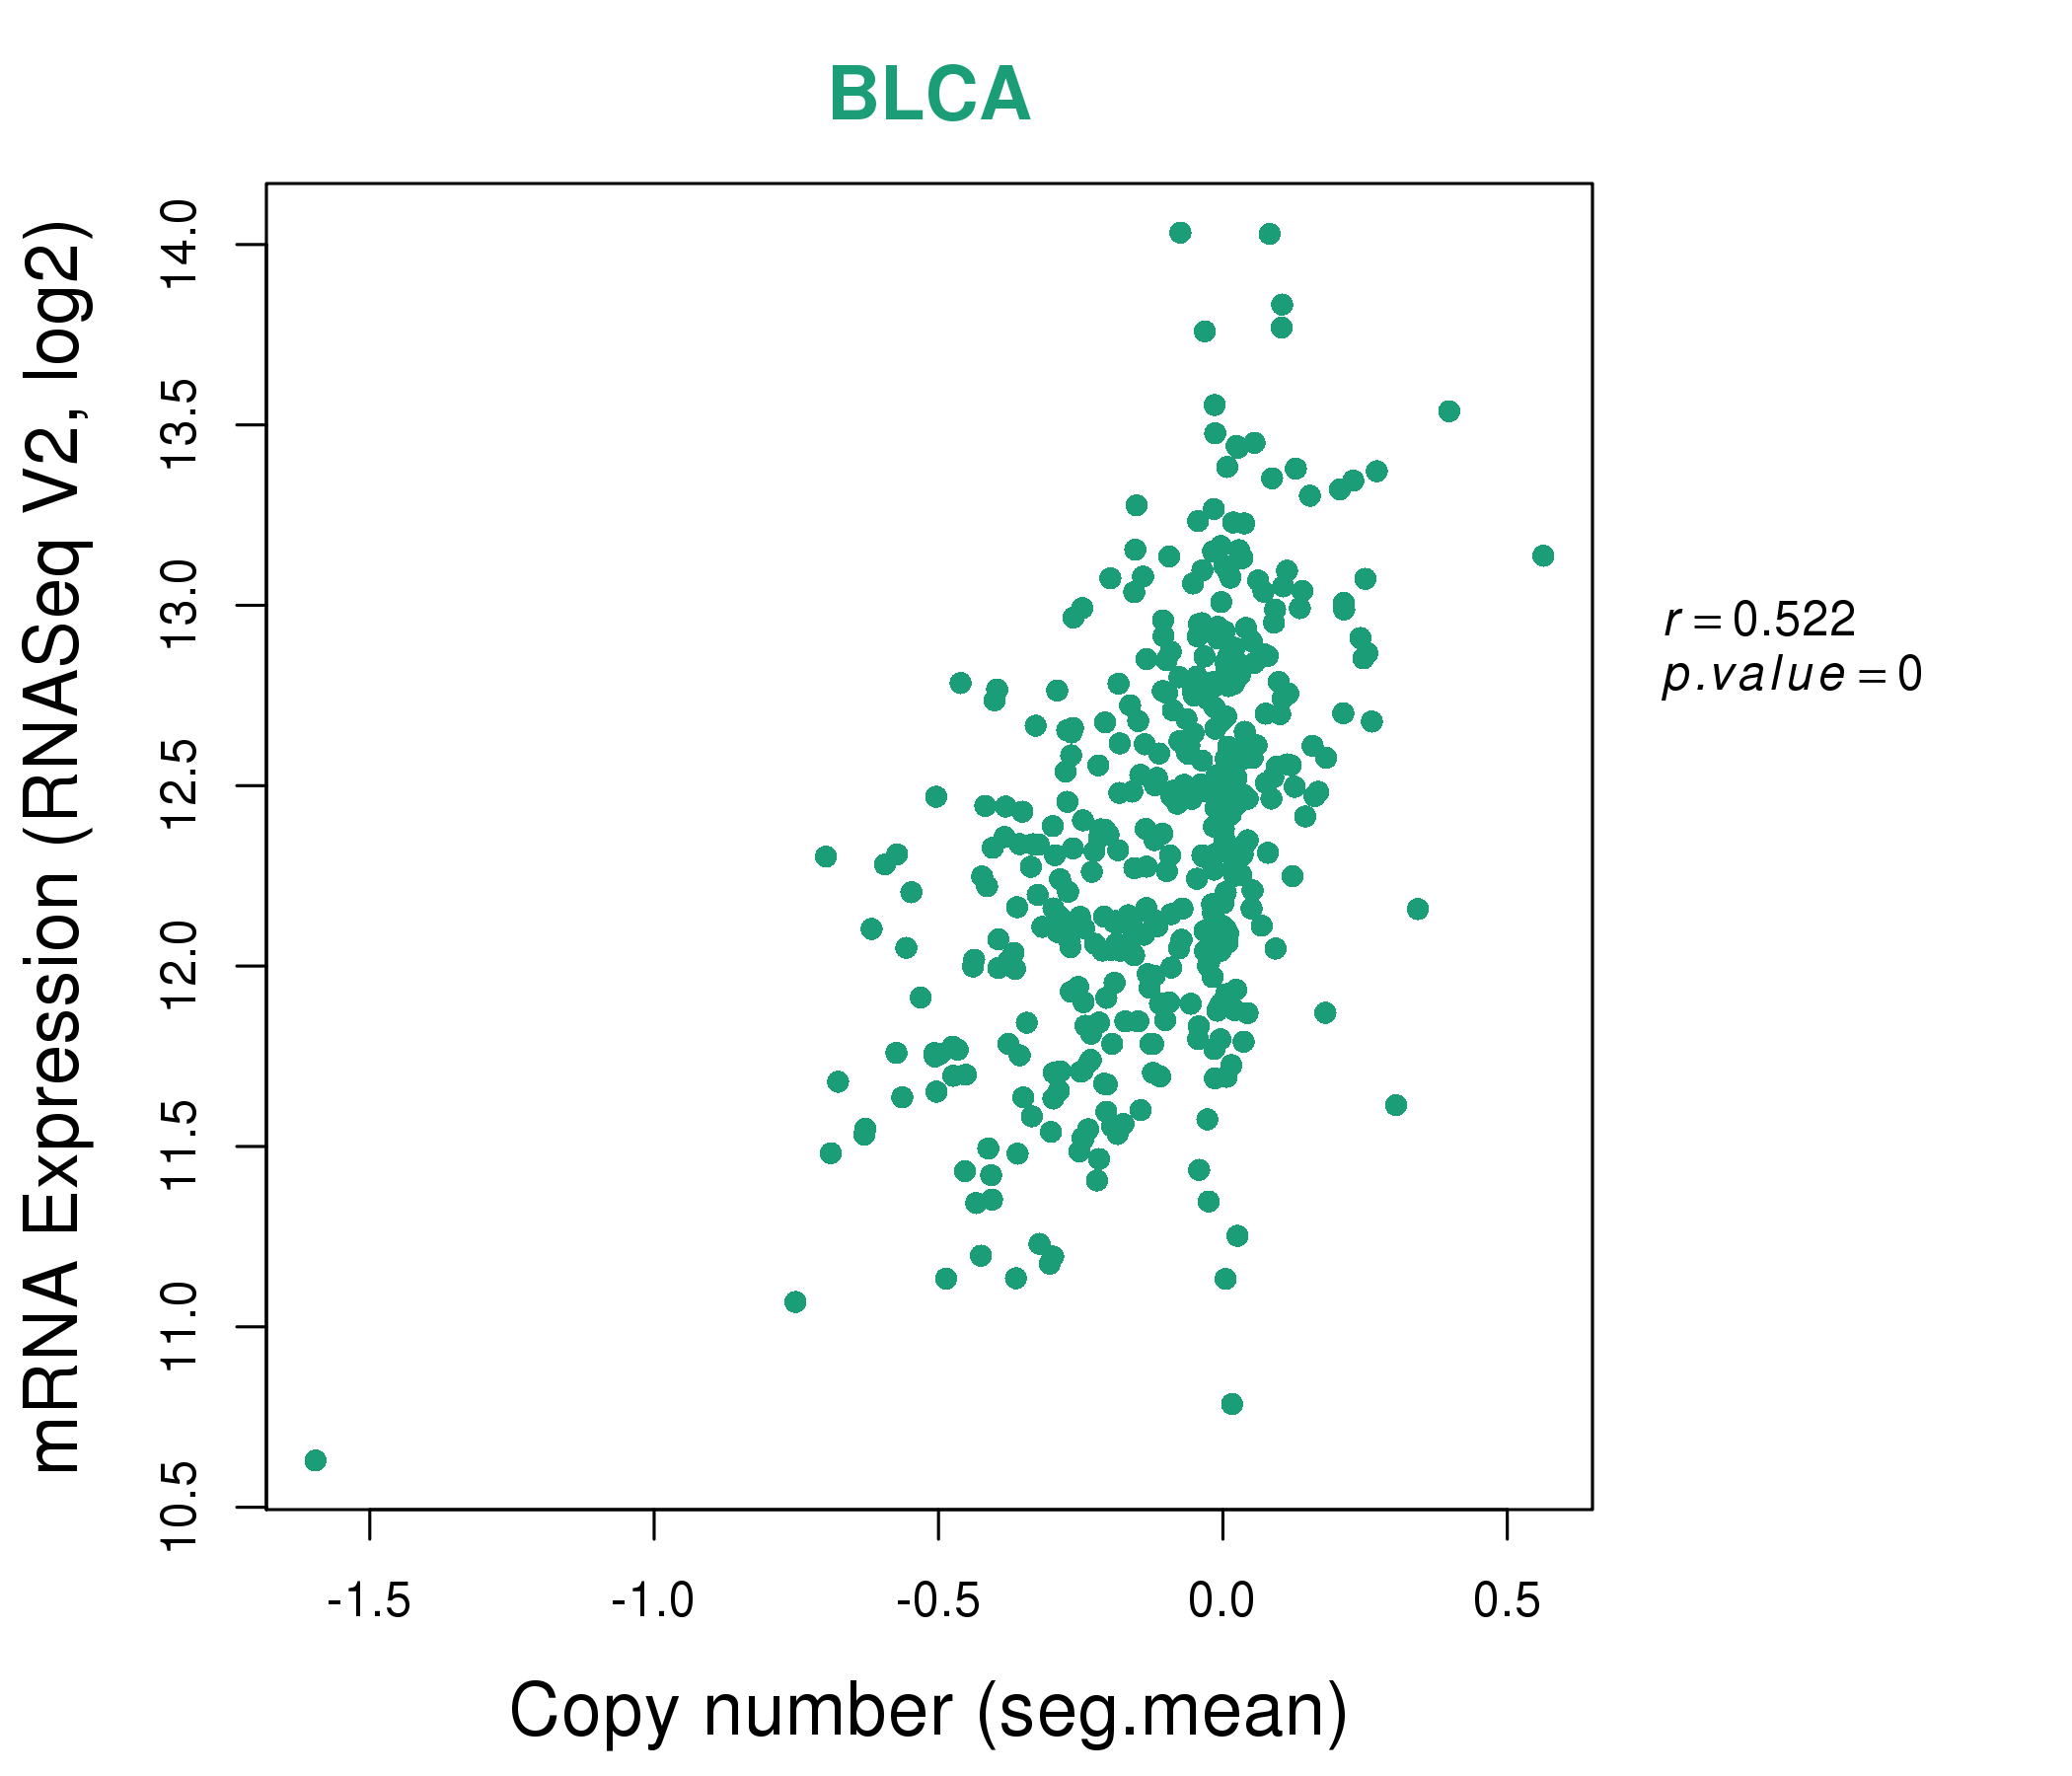
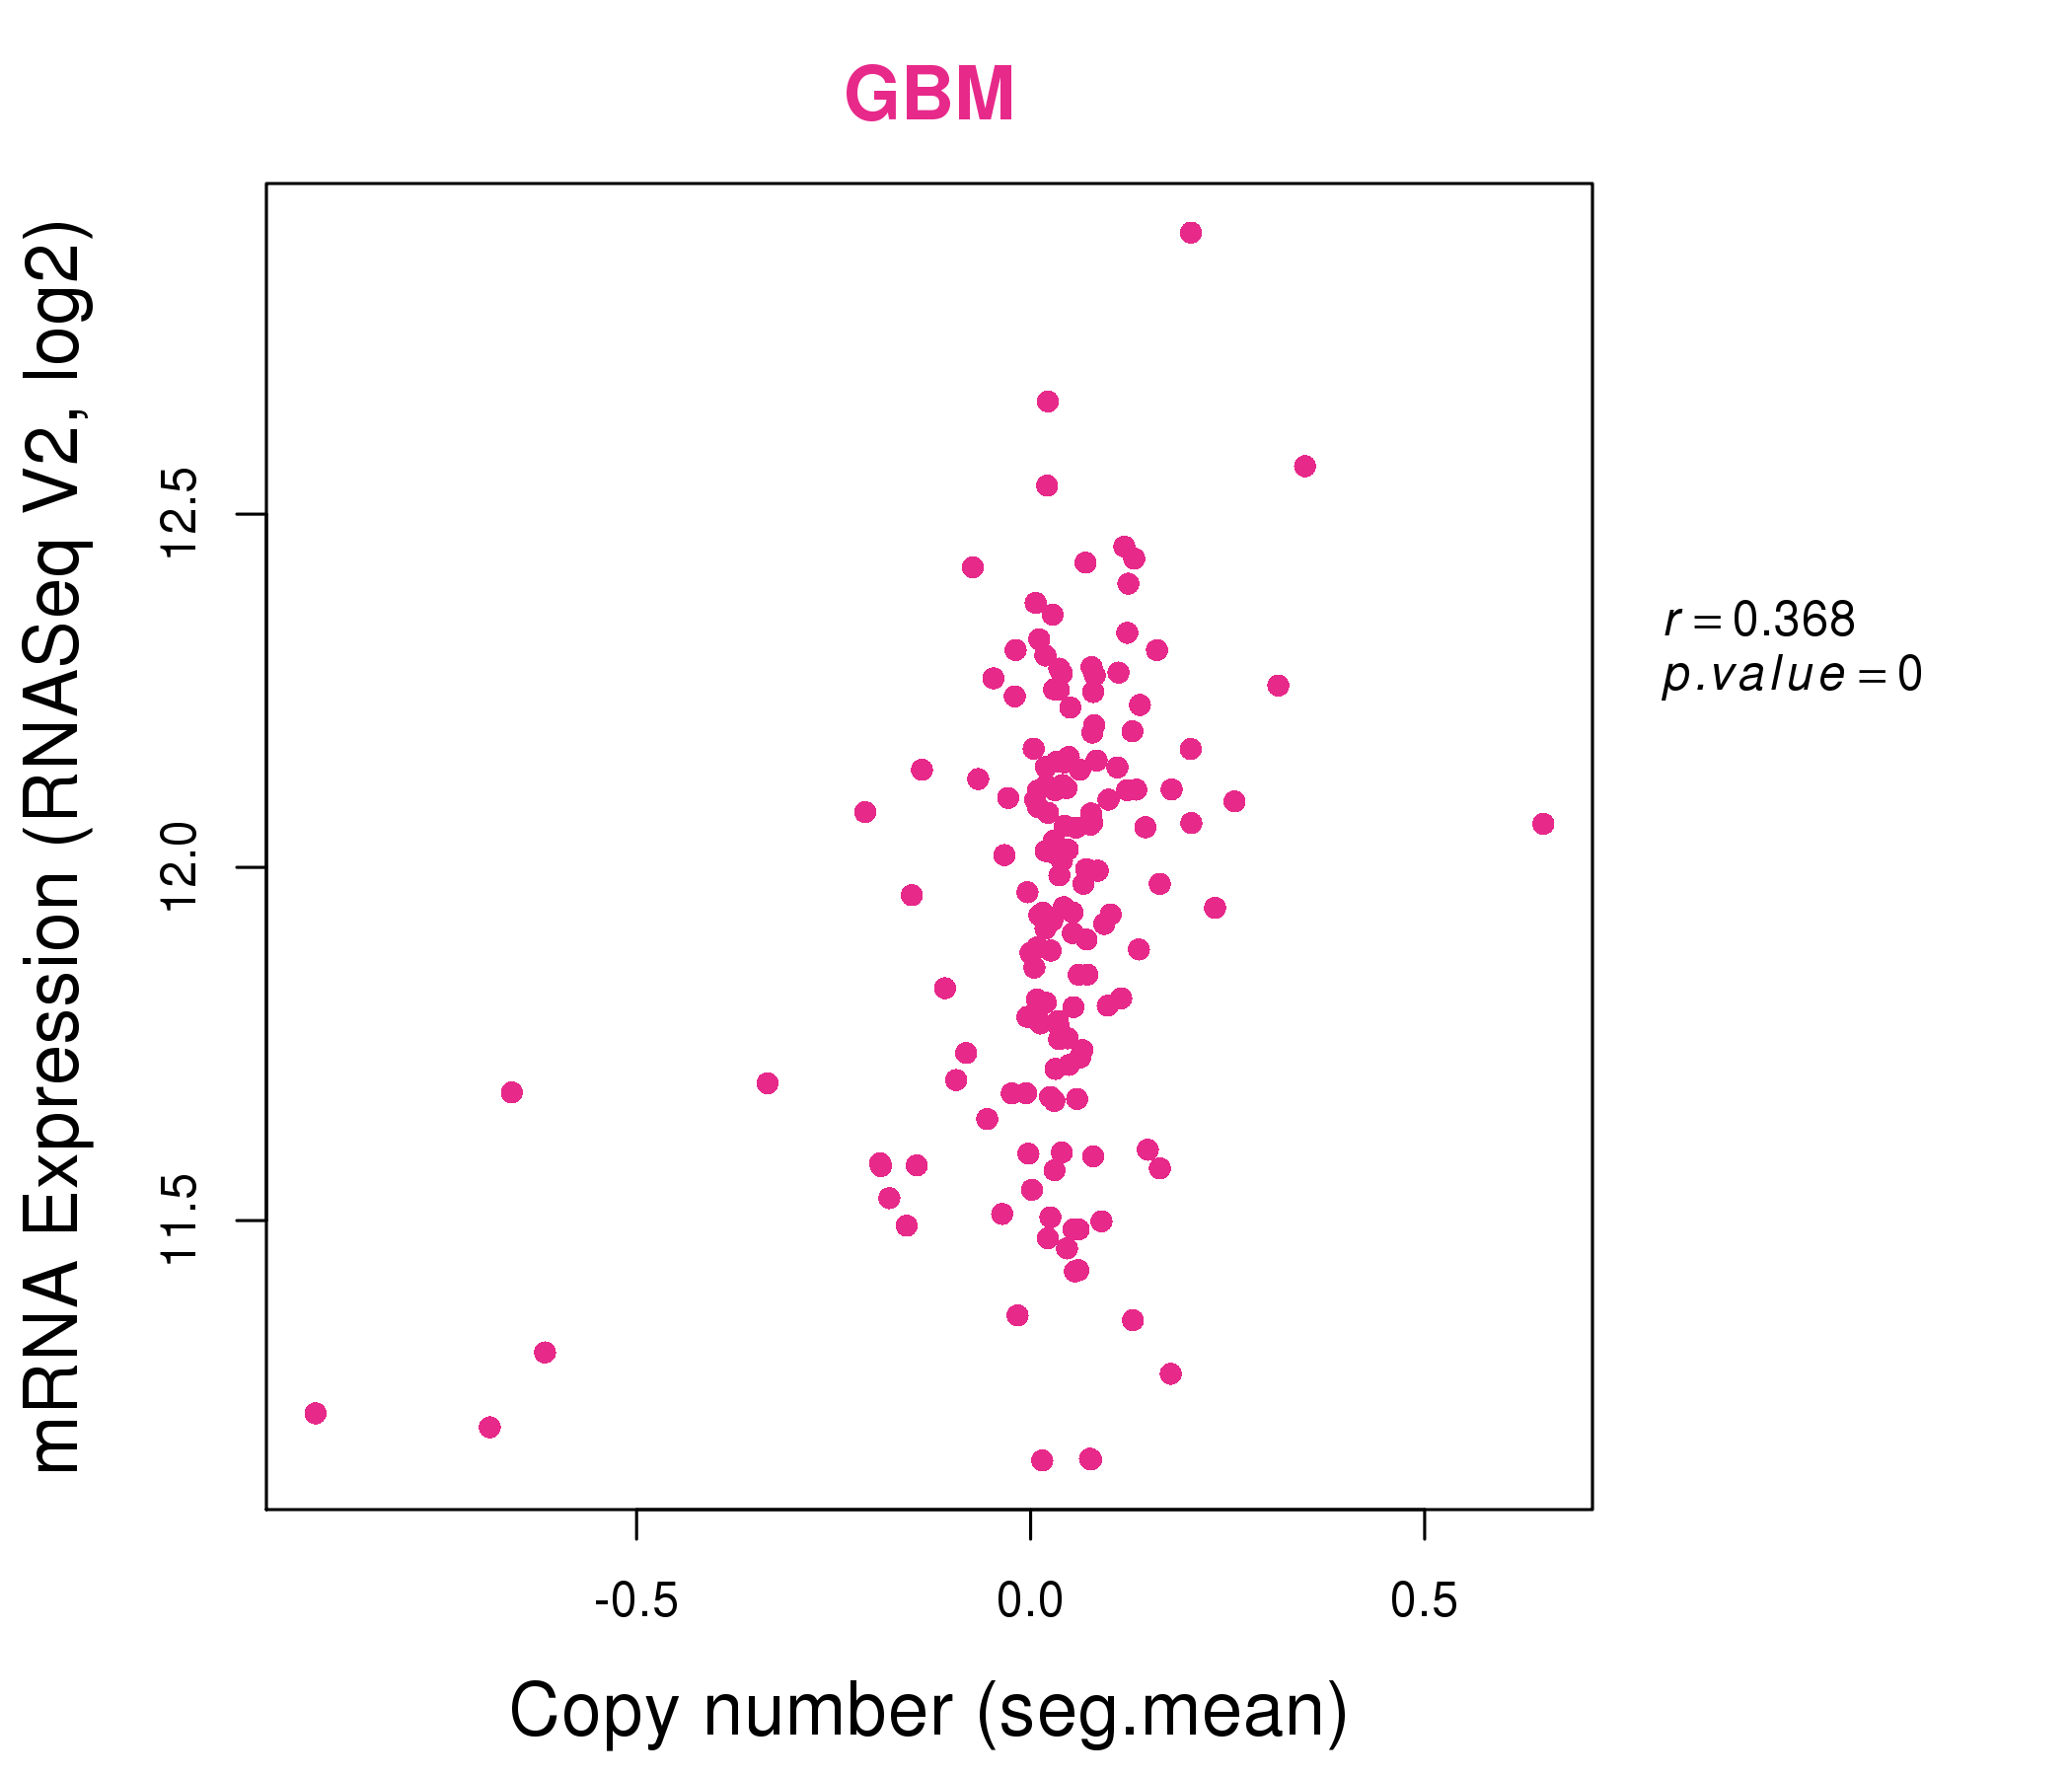
| * This plots show the correlation between CNV and gene expression. |
: Open all plots for all cancer types
 |
|
 |
|

| Top |
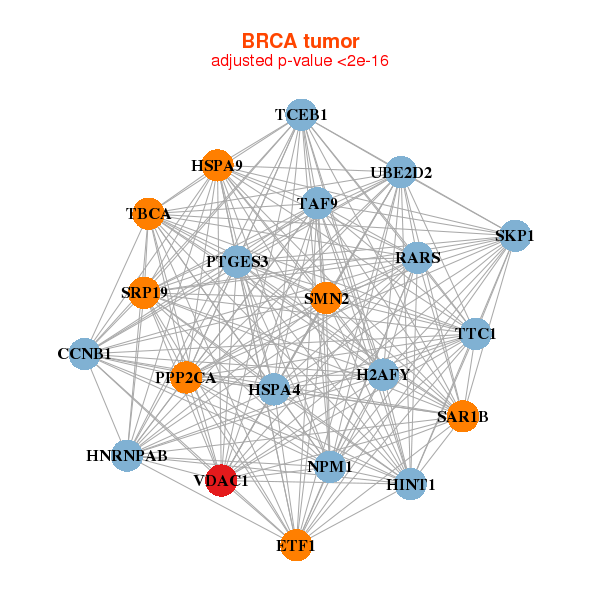
| Gene-Gene Network Information |
| * Co-Expression network figures were drawn using R package igraph. Only the top 20 genes with the highest correlations were shown. Red circle: input gene, orange circle: cell metabolism gene, sky circle: other gene |
: Open all plots for all cancer types
 |
| ||||
| CCNB1,ETF1,H2AFY,HINT1,HNRNPAB,HSPA4,HSPA9, NPM1,PPP2CA,PTGES3,RARS,SAR1B,SKP1,SMN2, SRP19,TAF9,TBCA,TCEB1,TTC1,UBE2D2,VDAC1 | ALDOA,ALPK2,ANK1,BEST3,CTXN3,EEF1A2,FEM1A, FHL3,FKBP3,GOT1,HS3ST5,IP6K3,LRRC20,MYOM2, MYOZ2,PEBP4,SLC25A4,SYNPO2L,TPM3,VDAC1,WDR62 | ||||
 |
| ||||
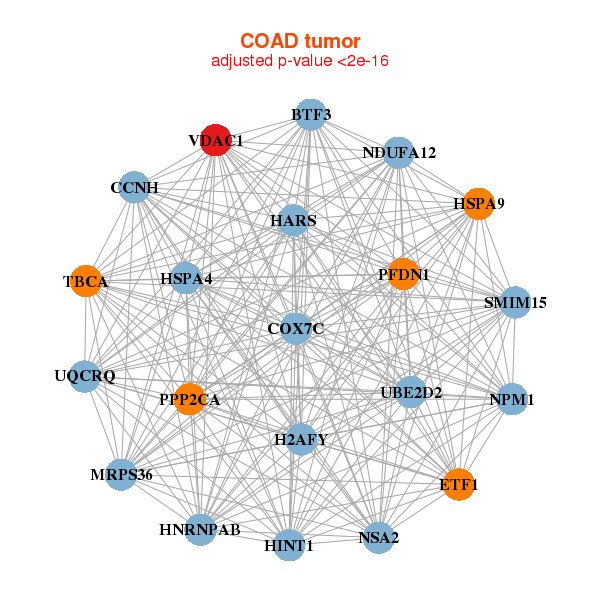
| BTF3,SMIM15,CCNH,COX7C,ETF1,H2AFY,HARS, HINT1,HNRNPAB,HSPA4,HSPA9,MRPS36,NDUFA12,NPM1, NSA2,PFDN1,PPP2CA,TBCA,UBE2D2,UQCRQ,VDAC1 | ABCD3,ACOX1,ALAS1,ATP1B1,CD2AP,CFL1,RHOV___CHP1, CORO2A,DSC2,FABP1,KALRN,PDCD6IP,PSEN1,RELL1, RNF103,SFXN1,SLC41A2,SMAP1,TGFA,UGT1A10,VDAC1 |

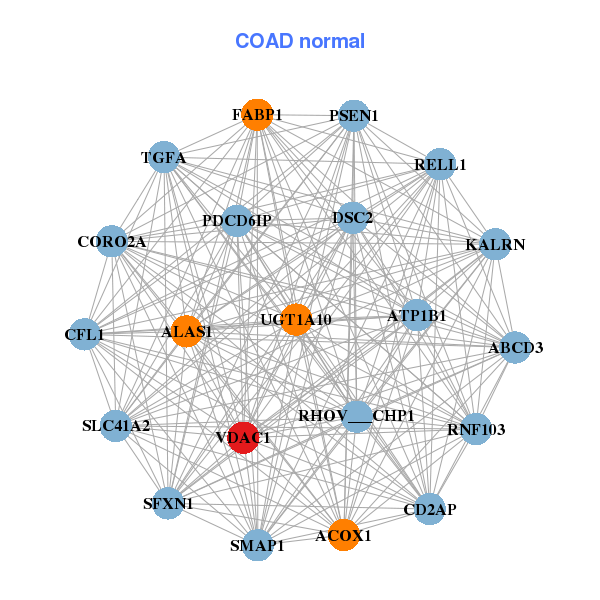
| * Co-Expression network figures were drawn using R package igraph. Only the top 20 genes with the highest correlations were shown. Red circle: input gene, orange circle: cell metabolism gene, sky circle: other gene |
: Open all plots for all cancer types
| Top |
: Open all interacting genes' information including KEGG pathway for all interacting genes from DAVID
| Top |
| Pharmacological Information for VDAC1 |
| DB Category | DB Name | DB's ID and Url link |
| Organism-specific databases | PharmGKB | PA37292; -. |
| Organism-specific databases | CTD | 7416; -. |
| * Gene Centered Interaction Network. |
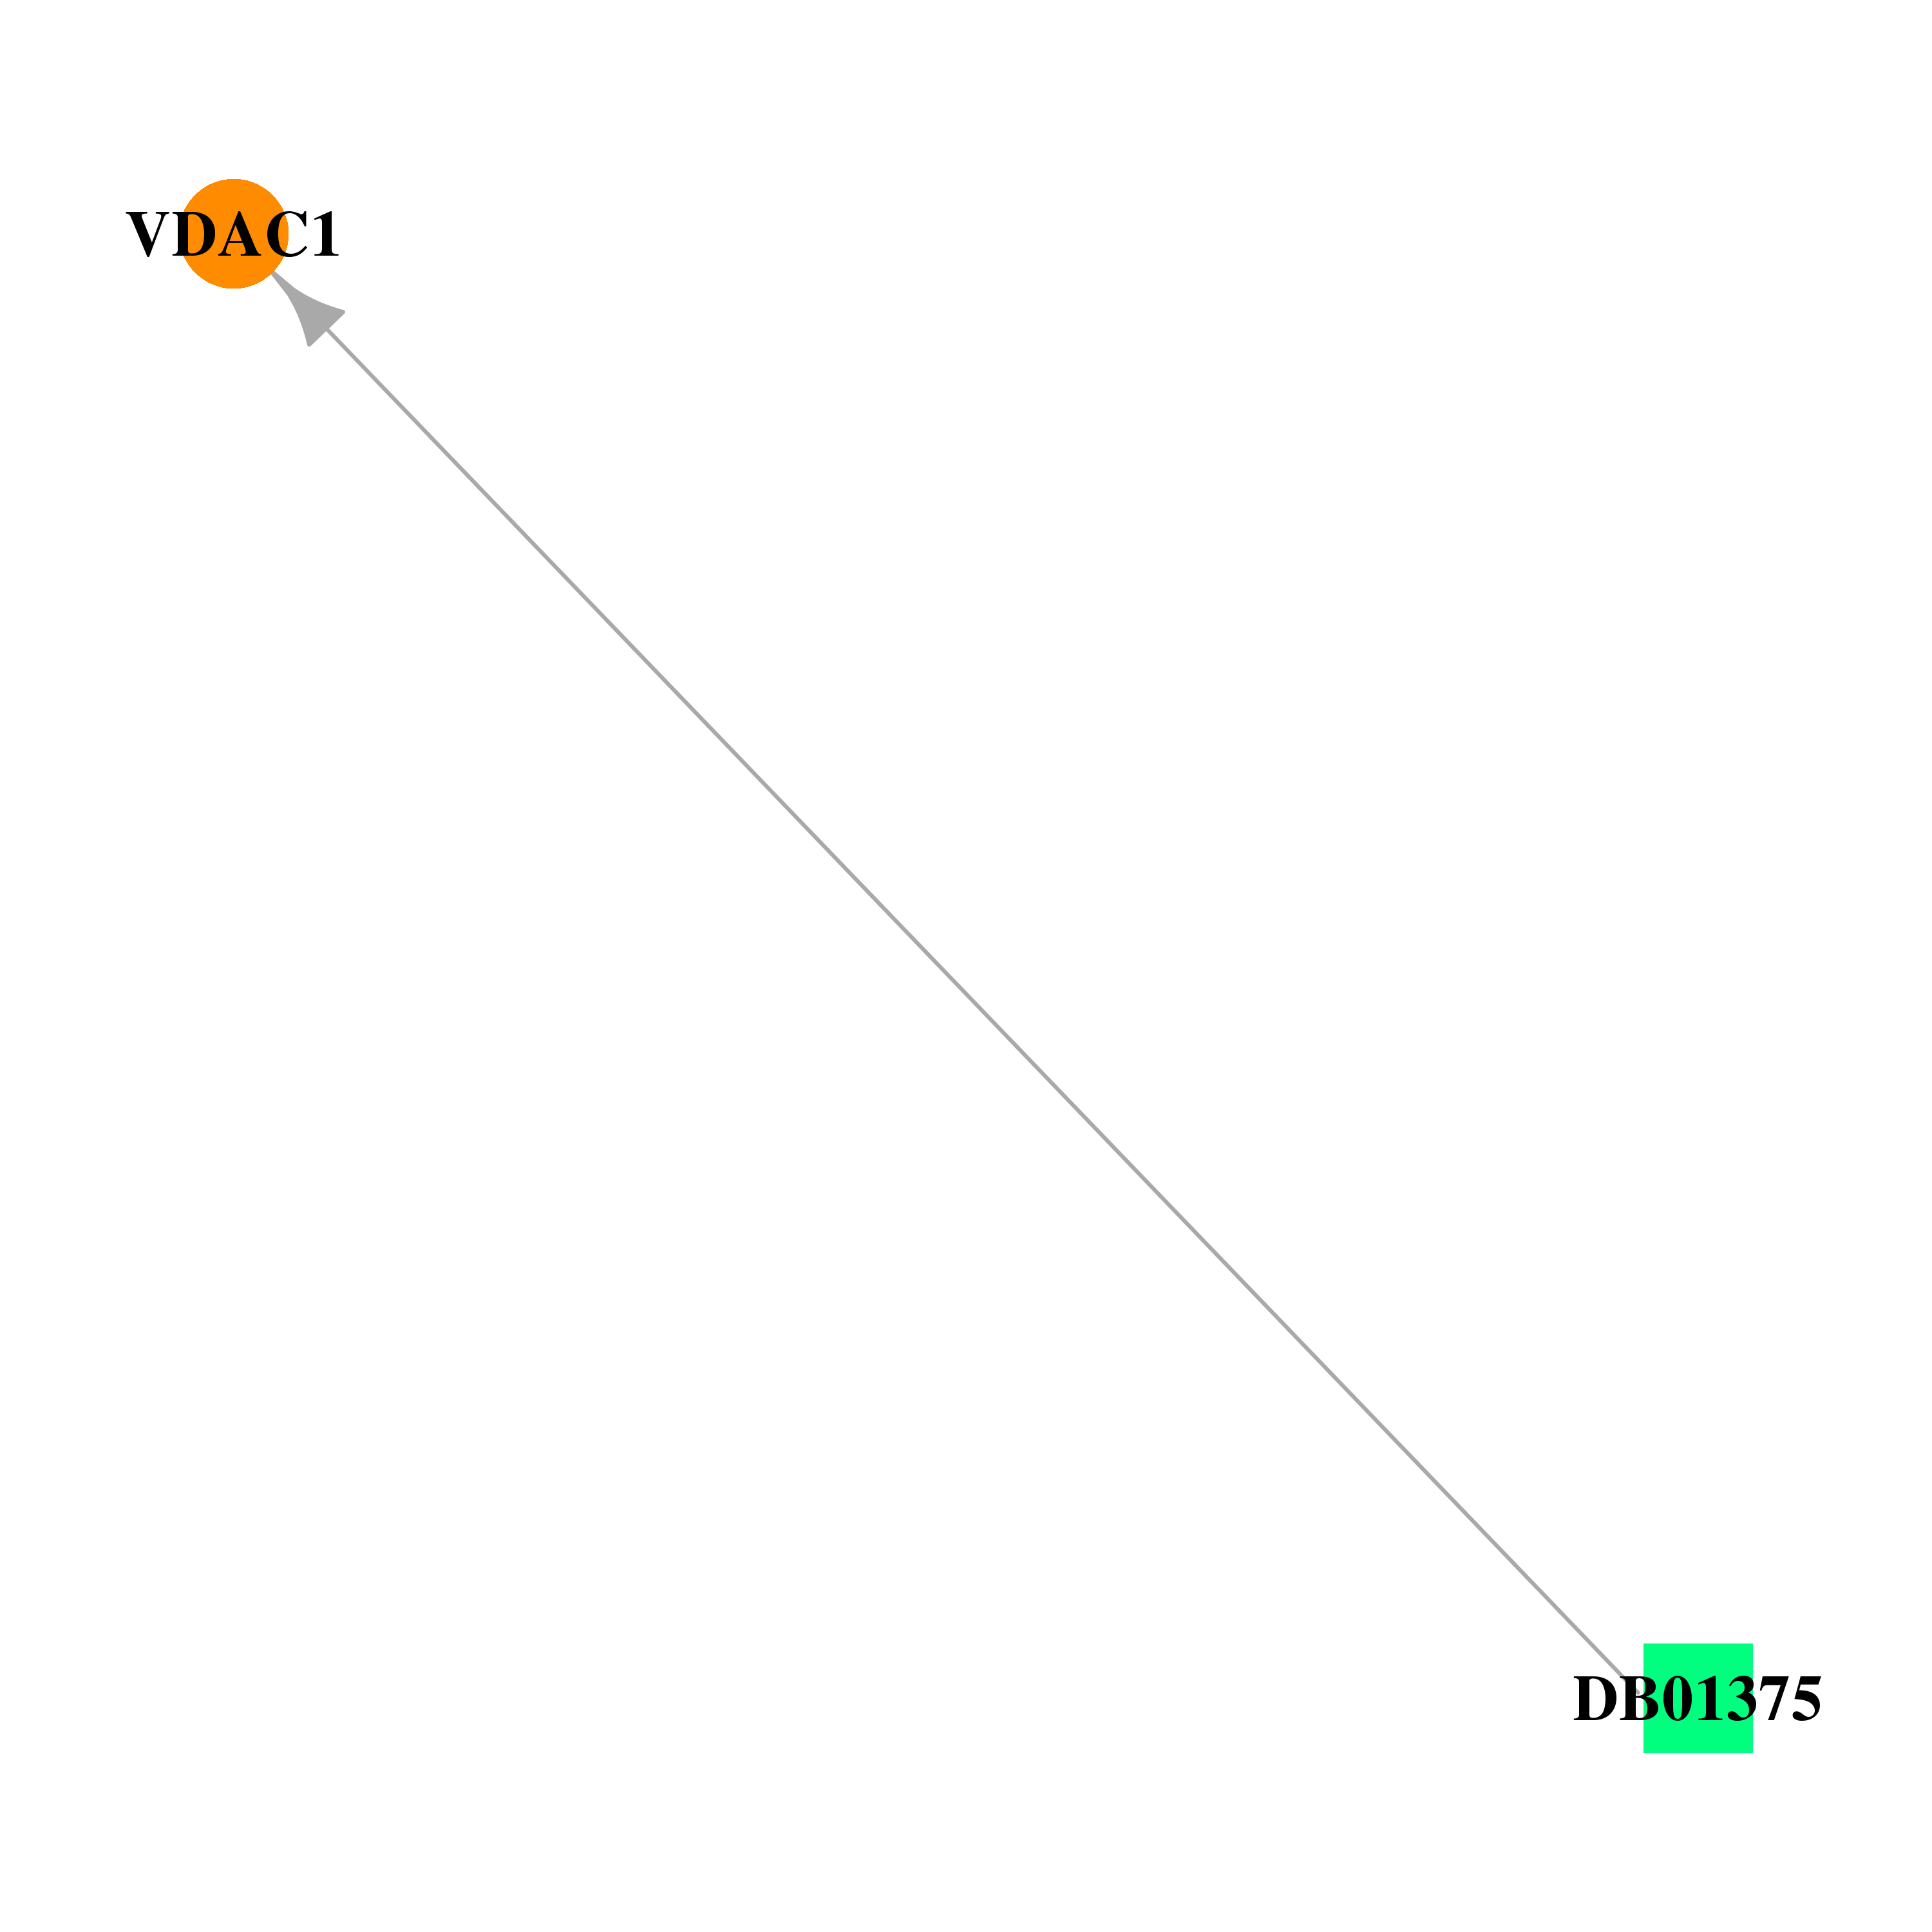 |
| * Drug Centered Interaction Network. |
| DrugBank ID | Target Name | Drug Groups | Generic Name | Drug Centered Network | Drug Structure |
| DB01375 | voltage-dependent anion channel 1 | approved | Dihydroxyaluminium |  | 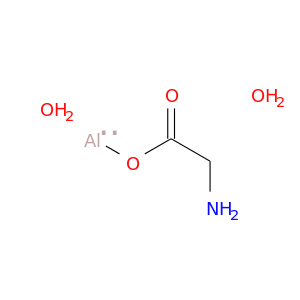 |
| Top |
| Cross referenced IDs for VDAC1 |
| * We obtained these cross-references from Uniprot database. It covers 150 different DBs, 18 categories. http://www.uniprot.org/help/cross_references_section |
: Open all cross reference information
|
Copyright © 2016-Present - The Univsersity of Texas Health Science Center at Houston @ |