|
||||||||||||||||||||
| |
| Phenotypic Information (metabolism pathway, cancer, disease, phenome) |
| |
| |
| Gene-Gene Network Information: Co-Expression Network, Interacting Genes & KEGG |
| |
|


| Gene Summary for EIF4H |
| Top |
| Phenotypic Information for EIF4H(metabolism pathway, cancer, disease, phenome) |
| Cancer | CGAP: EIF4H |
| Familial Cancer Database: EIF4H | |
| * This gene is included in those cancer gene databases. |
|
|
|
|
|
| . | ||||||||||||||
Oncogene 1 | Significant driver gene in | |||||||||||||||||||
| cf) number; DB name 1 Oncogene; http://nar.oxfordjournals.org/content/35/suppl_1/D721.long, 2 Tumor Suppressor gene; https://bioinfo.uth.edu/TSGene/, 3 Cancer Gene Census; http://www.nature.com/nrc/journal/v4/n3/abs/nrc1299.html, 4 CancerGenes; http://nar.oxfordjournals.org/content/35/suppl_1/D721.long, 5 Network of Cancer Gene; http://ncg.kcl.ac.uk/index.php, 1Therapeutic Vulnerabilities in Cancer; http://cbio.mskcc.org/cancergenomics/statius/ |
| REACTOME_METABOLISM_OF_PROTEINS | |
| OMIM | |
| Orphanet | |
| Disease | KEGG Disease: EIF4H |
| MedGen: EIF4H (Human Medical Genetics with Condition) | |
| ClinVar: EIF4H | |
| Phenotype | MGI: EIF4H (International Mouse Phenotyping Consortium) |
| PhenomicDB: EIF4H | |
| Mutations for EIF4H |
| * Under tables are showing count per each tissue to give us broad intuition about tissue specific mutation patterns.You can go to the detailed page for each mutation database's web site. |
| - Statistics for Tissue and Mutation type | Top |
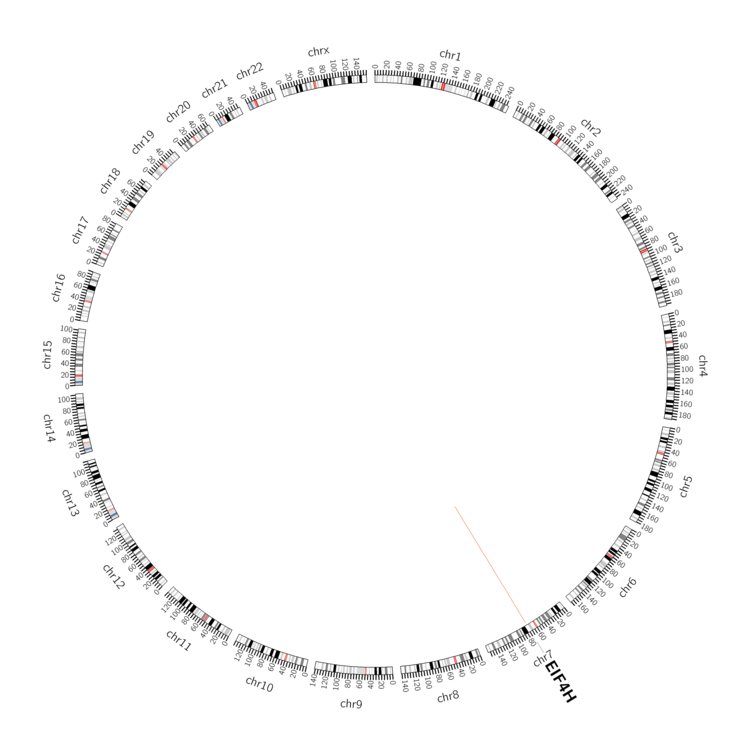 |
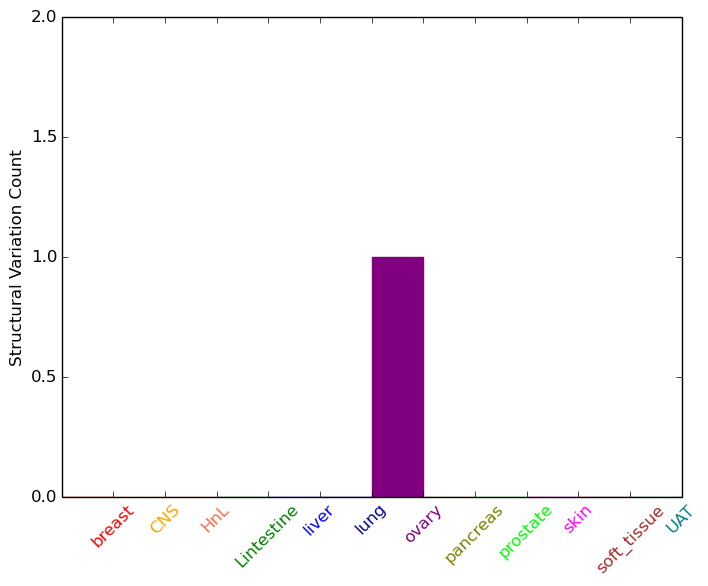
| - For Inter-chromosomal Variations |
| There's no inter-chromosomal structural variation. |
| - For Intra-chromosomal Variations |
| * Intra-chromosomal variantions includes 'intrachromosomal amplicon to amplicon', 'intrachromosomal amplicon to non-amplified dna', 'intrachromosomal deletion', 'intrachromosomal fold-back inversion', 'intrachromosomal inversion', 'intrachromosomal tandem duplication', 'Intrachromosomal unknown type', 'intrachromosomal with inverted orientation', 'intrachromosomal with non-inverted orientation'. |
 |
| Sample | Symbol_a | Chr_a | Start_a | End_a | Symbol_b | Chr_b | Start_b | End_b |
| ovary | EIF4H | chr7 | 73589006 | 73589026 | EIF4H | chr7 | 73589070 | 73589090 |
| cf) Tissue number; Tissue name (1;Breast, 2;Central_nervous_system, 3;Haematopoietic_and_lymphoid_tissue, 4;Large_intestine, 5;Liver, 6;Lung, 7;Ovary, 8;Pancreas, 9;Prostate, 10;Skin, 11;Soft_tissue, 12;Upper_aerodigestive_tract) |
| * From mRNA Sanger sequences, Chitars2.0 arranged chimeric transcripts. This table shows EIF4H related fusion information. |
| ID | Head Gene | Tail Gene | Accession | Gene_a | qStart_a | qEnd_a | Chromosome_a | tStart_a | tEnd_a | Gene_a | qStart_a | qEnd_a | Chromosome_a | tStart_a | tEnd_a |
| BM479877 | EIF4H | 1 | 107 | 7 | 73609854 | 73609960 | H2AFY | 100 | 879 | 5 | 134681668 | 134724788 | |
| BU540394 | EIF4H | 2 | 389 | 7 | 73610618 | 73611005 | PKP3 | 384 | 605 | 11 | 404687 | 404908 | |
| CN419986 | RSL1D1 | 1 | 595 | 16 | 11931660 | 11933835 | EIF4H | 588 | 765 | 7 | 73606366 | 73606543 | |
| Top |
| There's no copy number variation information in COSMIC data for this gene. |
| Top |
|
 |
| Top |
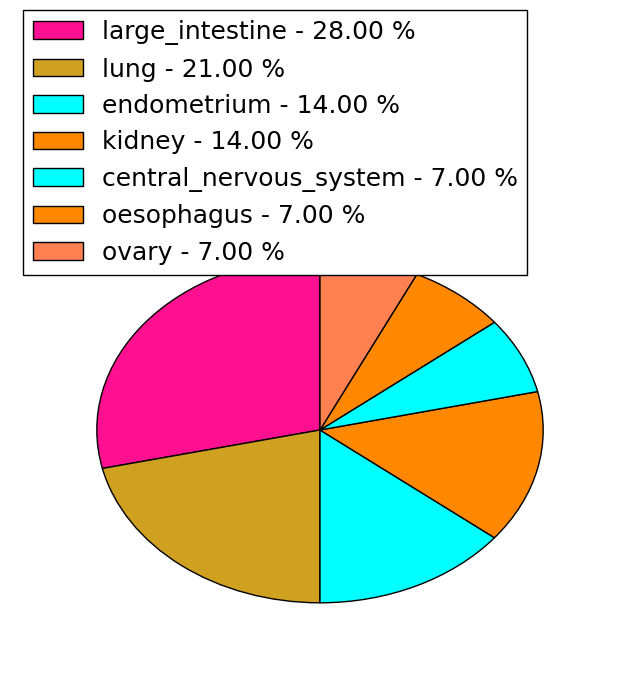
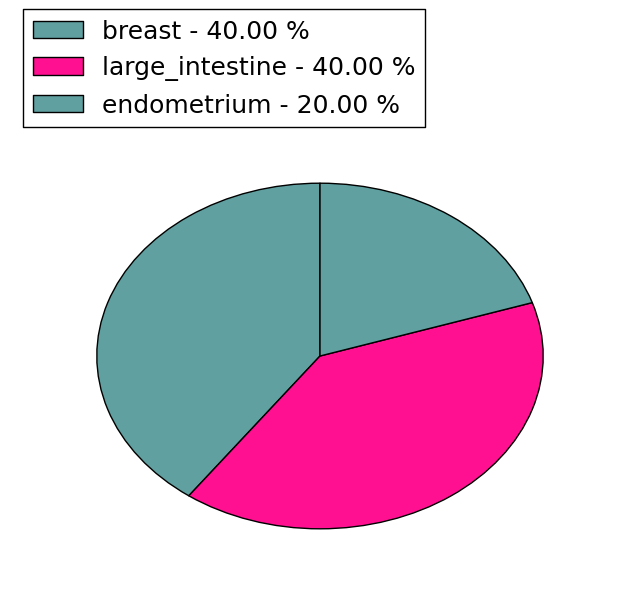
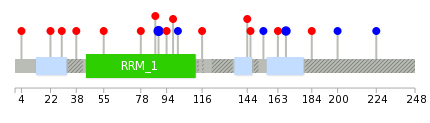
| Stat. for Non-Synonymous SNVs (# total SNVs=14) | (# total SNVs=5) |
 |  |
(# total SNVs=0) | (# total SNVs=0) |
| Top |
| * When you move the cursor on each content, you can see more deailed mutation information on the Tooltip. Those are primary_site,primary_histology,mutation(aa),pubmedID. |
| GRCh37 position | Mutation(aa) | Unique sampleID count |
| chr7:73609165-73609165 | p.P188P | 2 |
| chr7:73609537-73609537 | p.R216* | 2 |
| chr7:73604022-73604022 | p.F89F | 2 |
| chr7:73609623-73609623 | p.Q244Q | 1 |
| chr7:73604023-73604023 | p.D90N | 1 |
| chr7:73609094-73609094 | p.G165R | 1 |
| chr7:73604036-73604036 | p.S94F | 1 |
| chr7:73609136-73609136 | p.P179A | 1 |
| chr7:73588723-73588723 | p.F4V | 1 |
| chr7:73604047-73604047 | p.A98P | 1 |
| Top |
|
 |
| Point Mutation/ Tissue ID | 1 | 2 | 3 | 4 | 5 | 6 | 7 | 8 | 9 | 10 | 11 | 12 | 13 | 14 | 15 | 16 | 17 | 18 | 19 | 20 |
| # sample | 1 | 4 | 2 | 1 | 1 | 1 | 1 | 1 | 2 | 5 | 1 | 3 | ||||||||
| # mutation | 1 | 4 | 2 | 1 | 1 | 1 | 1 | 1 | 2 | 5 | 1 | 3 | ||||||||
| nonsynonymous SNV | 2 | 2 | 1 | 1 | 1 | 2 | 3 | 2 | ||||||||||||
| synonymous SNV | 1 | 2 | 1 | 1 | 2 | 1 | 1 |
| cf) Tissue ID; Tissue type (1; BLCA[Bladder Urothelial Carcinoma], 2; BRCA[Breast invasive carcinoma], 3; CESC[Cervical squamous cell carcinoma and endocervical adenocarcinoma], 4; COAD[Colon adenocarcinoma], 5; GBM[Glioblastoma multiforme], 6; Glioma Low Grade, 7; HNSC[Head and Neck squamous cell carcinoma], 8; KICH[Kidney Chromophobe], 9; KIRC[Kidney renal clear cell carcinoma], 10; KIRP[Kidney renal papillary cell carcinoma], 11; LAML[Acute Myeloid Leukemia], 12; LUAD[Lung adenocarcinoma], 13; LUSC[Lung squamous cell carcinoma], 14; OV[Ovarian serous cystadenocarcinoma ], 15; PAAD[Pancreatic adenocarcinoma], 16; PRAD[Prostate adenocarcinoma], 17; SKCM[Skin Cutaneous Melanoma], 18:STAD[Stomach adenocarcinoma], 19:THCA[Thyroid carcinoma], 20:UCEC[Uterine Corpus Endometrial Carcinoma]) |
| Top |
| * We represented just top 10 SNVs. When you move the cursor on each content, you can see more deailed mutation information on the Tooltip. Those are primary_site, primary_histology, mutation(aa), pubmedID. |
| Genomic Position | Mutation(aa) | Unique sampleID count |
| chr7:73604022 | p.F89F,EIF4H | 3 |
| chr7:73609165 | p.P168P,EIF4H | 2 |
| chr7:73604047 | p.F154F | 1 |
| chr7:73604058 | p.R146K,EIF4H | 1 |
| chr7:73588723 | p.R163H,EIF4H | 1 |
| chr7:73604186 | p.F4V,EIF4H | 1 |
| chr7:73601945 | p.E184Q,EIF4H | 1 |
| chr7:73604598 | p.R22C,EIF4H | 1 |
| chr7:73601967 | p.T200T,EIF4H | 1 |
| chr7:73604629 | p.G29V,EIF4H | 1 |
| * Copy number data were extracted from TCGA using R package TCGA-Assembler. The URLs of all public data files on TCGA DCC data server were gathered on Jan-05-2015. Function ProcessCNAData in TCGA-Assembler package was used to obtain gene-level copy number value which is calculated as the average copy number of the genomic region of a gene. |
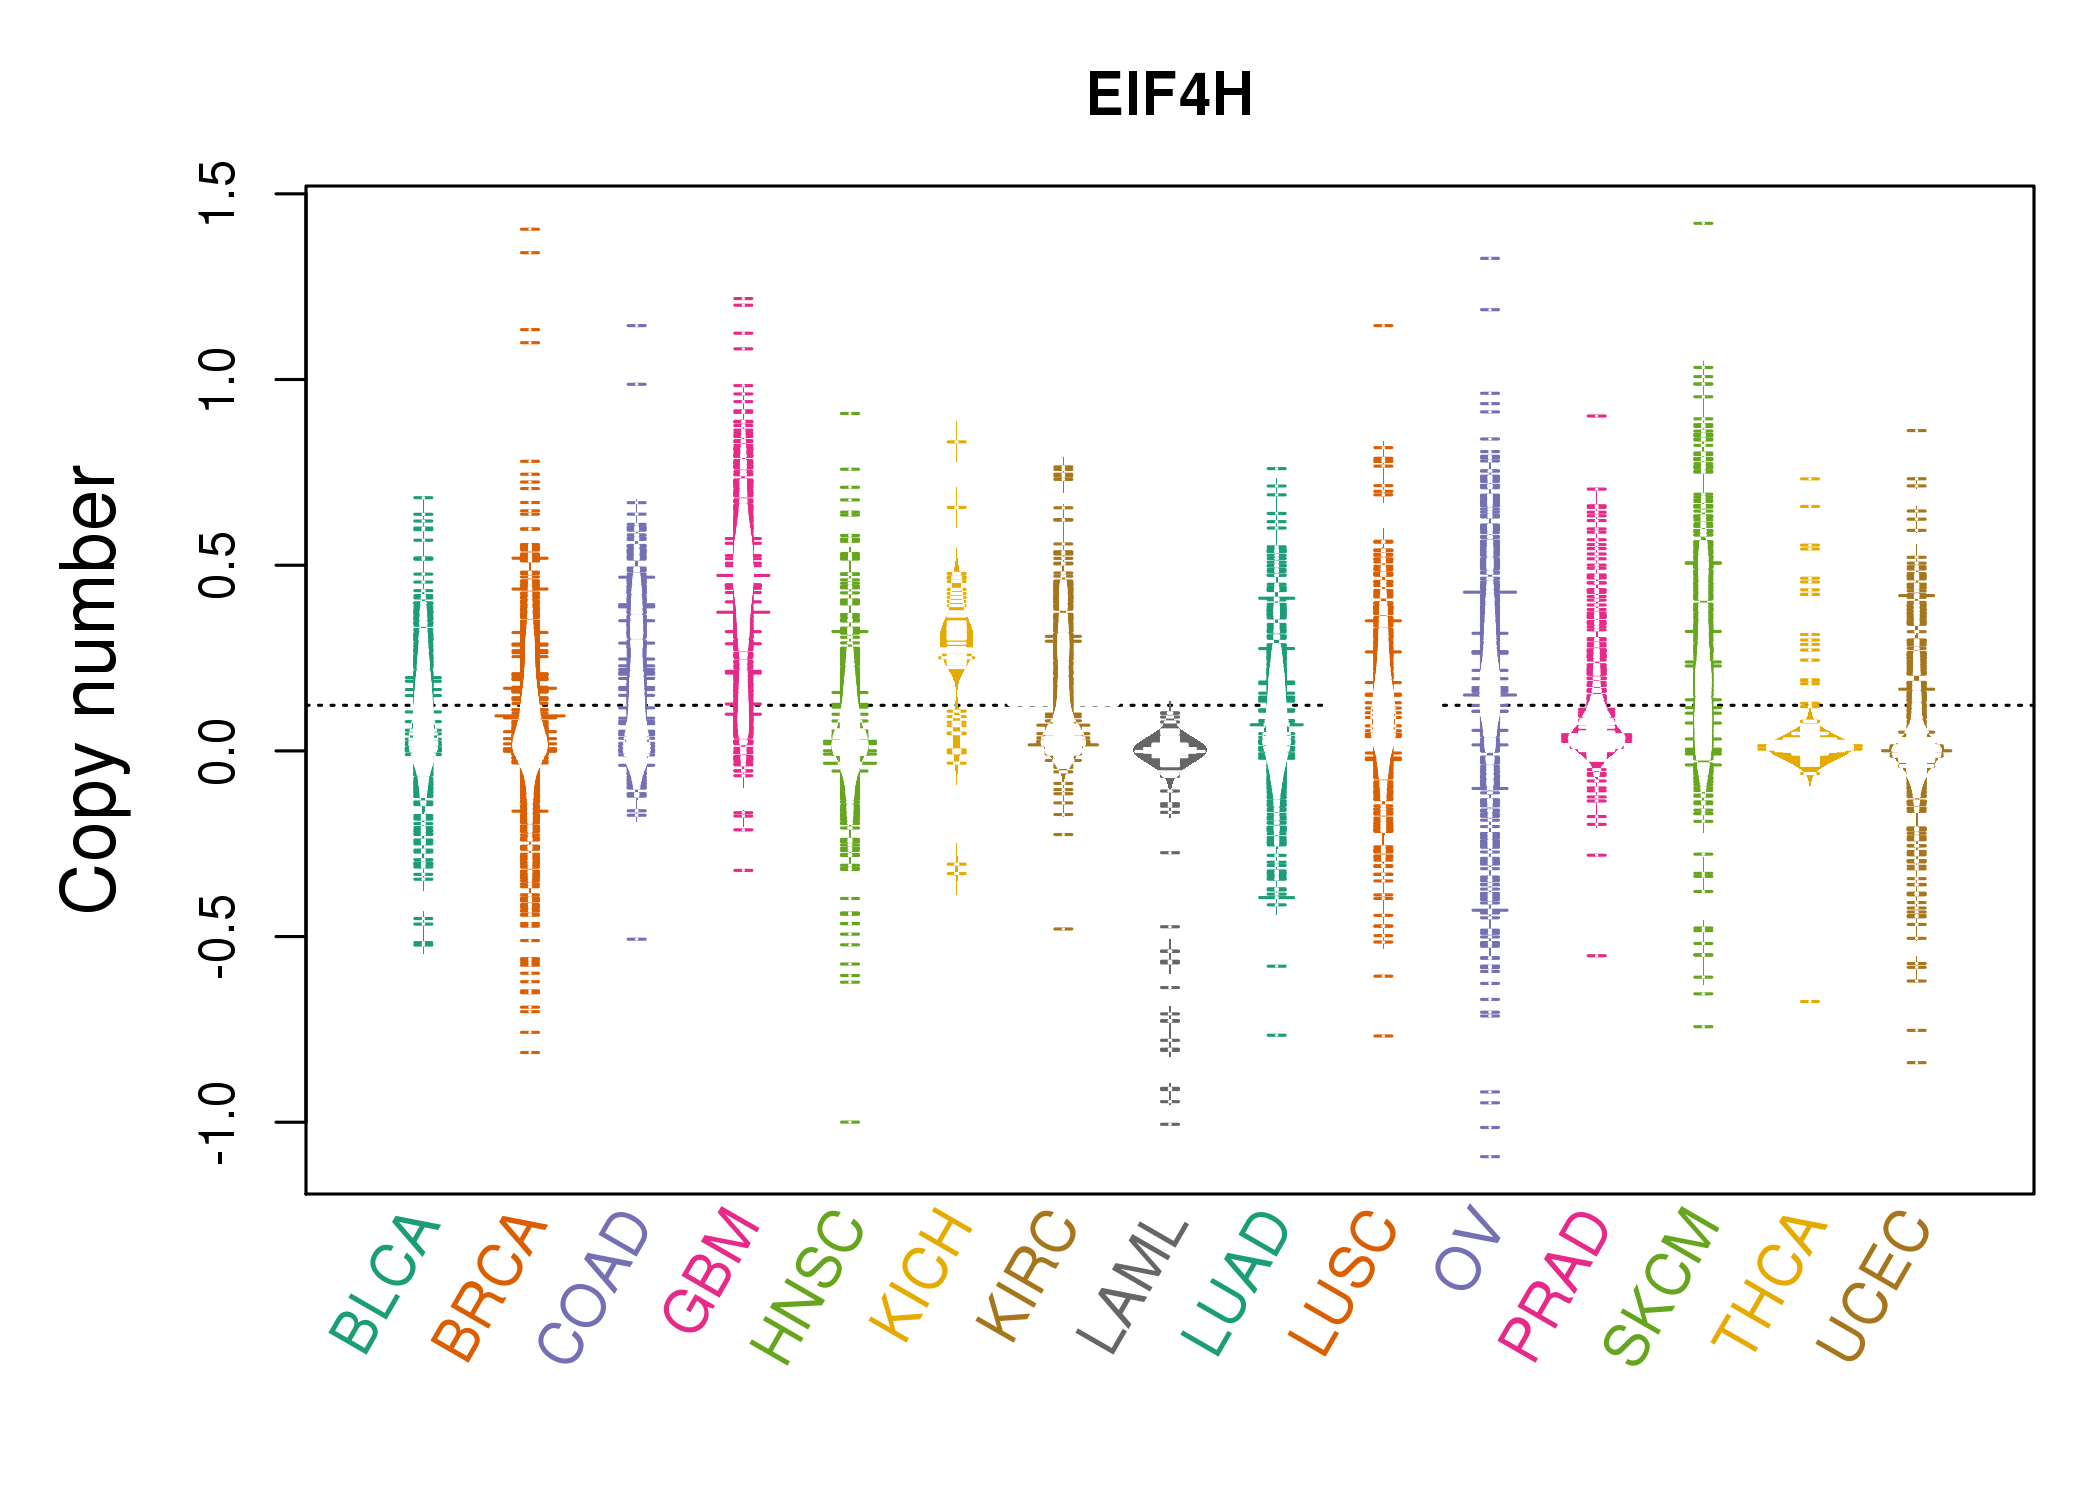 |
| cf) Tissue ID[Tissue type]: BLCA[Bladder Urothelial Carcinoma], BRCA[Breast invasive carcinoma], CESC[Cervical squamous cell carcinoma and endocervical adenocarcinoma], COAD[Colon adenocarcinoma], GBM[Glioblastoma multiforme], Glioma Low Grade, HNSC[Head and Neck squamous cell carcinoma], KICH[Kidney Chromophobe], KIRC[Kidney renal clear cell carcinoma], KIRP[Kidney renal papillary cell carcinoma], LAML[Acute Myeloid Leukemia], LUAD[Lung adenocarcinoma], LUSC[Lung squamous cell carcinoma], OV[Ovarian serous cystadenocarcinoma ], PAAD[Pancreatic adenocarcinoma], PRAD[Prostate adenocarcinoma], SKCM[Skin Cutaneous Melanoma], STAD[Stomach adenocarcinoma], THCA[Thyroid carcinoma], UCEC[Uterine Corpus Endometrial Carcinoma] |
| Top |
| Gene Expression for EIF4H |
| * CCLE gene expression data were extracted from CCLE_Expression_Entrez_2012-10-18.res: Gene-centric RMA-normalized mRNA expression data. |
 |
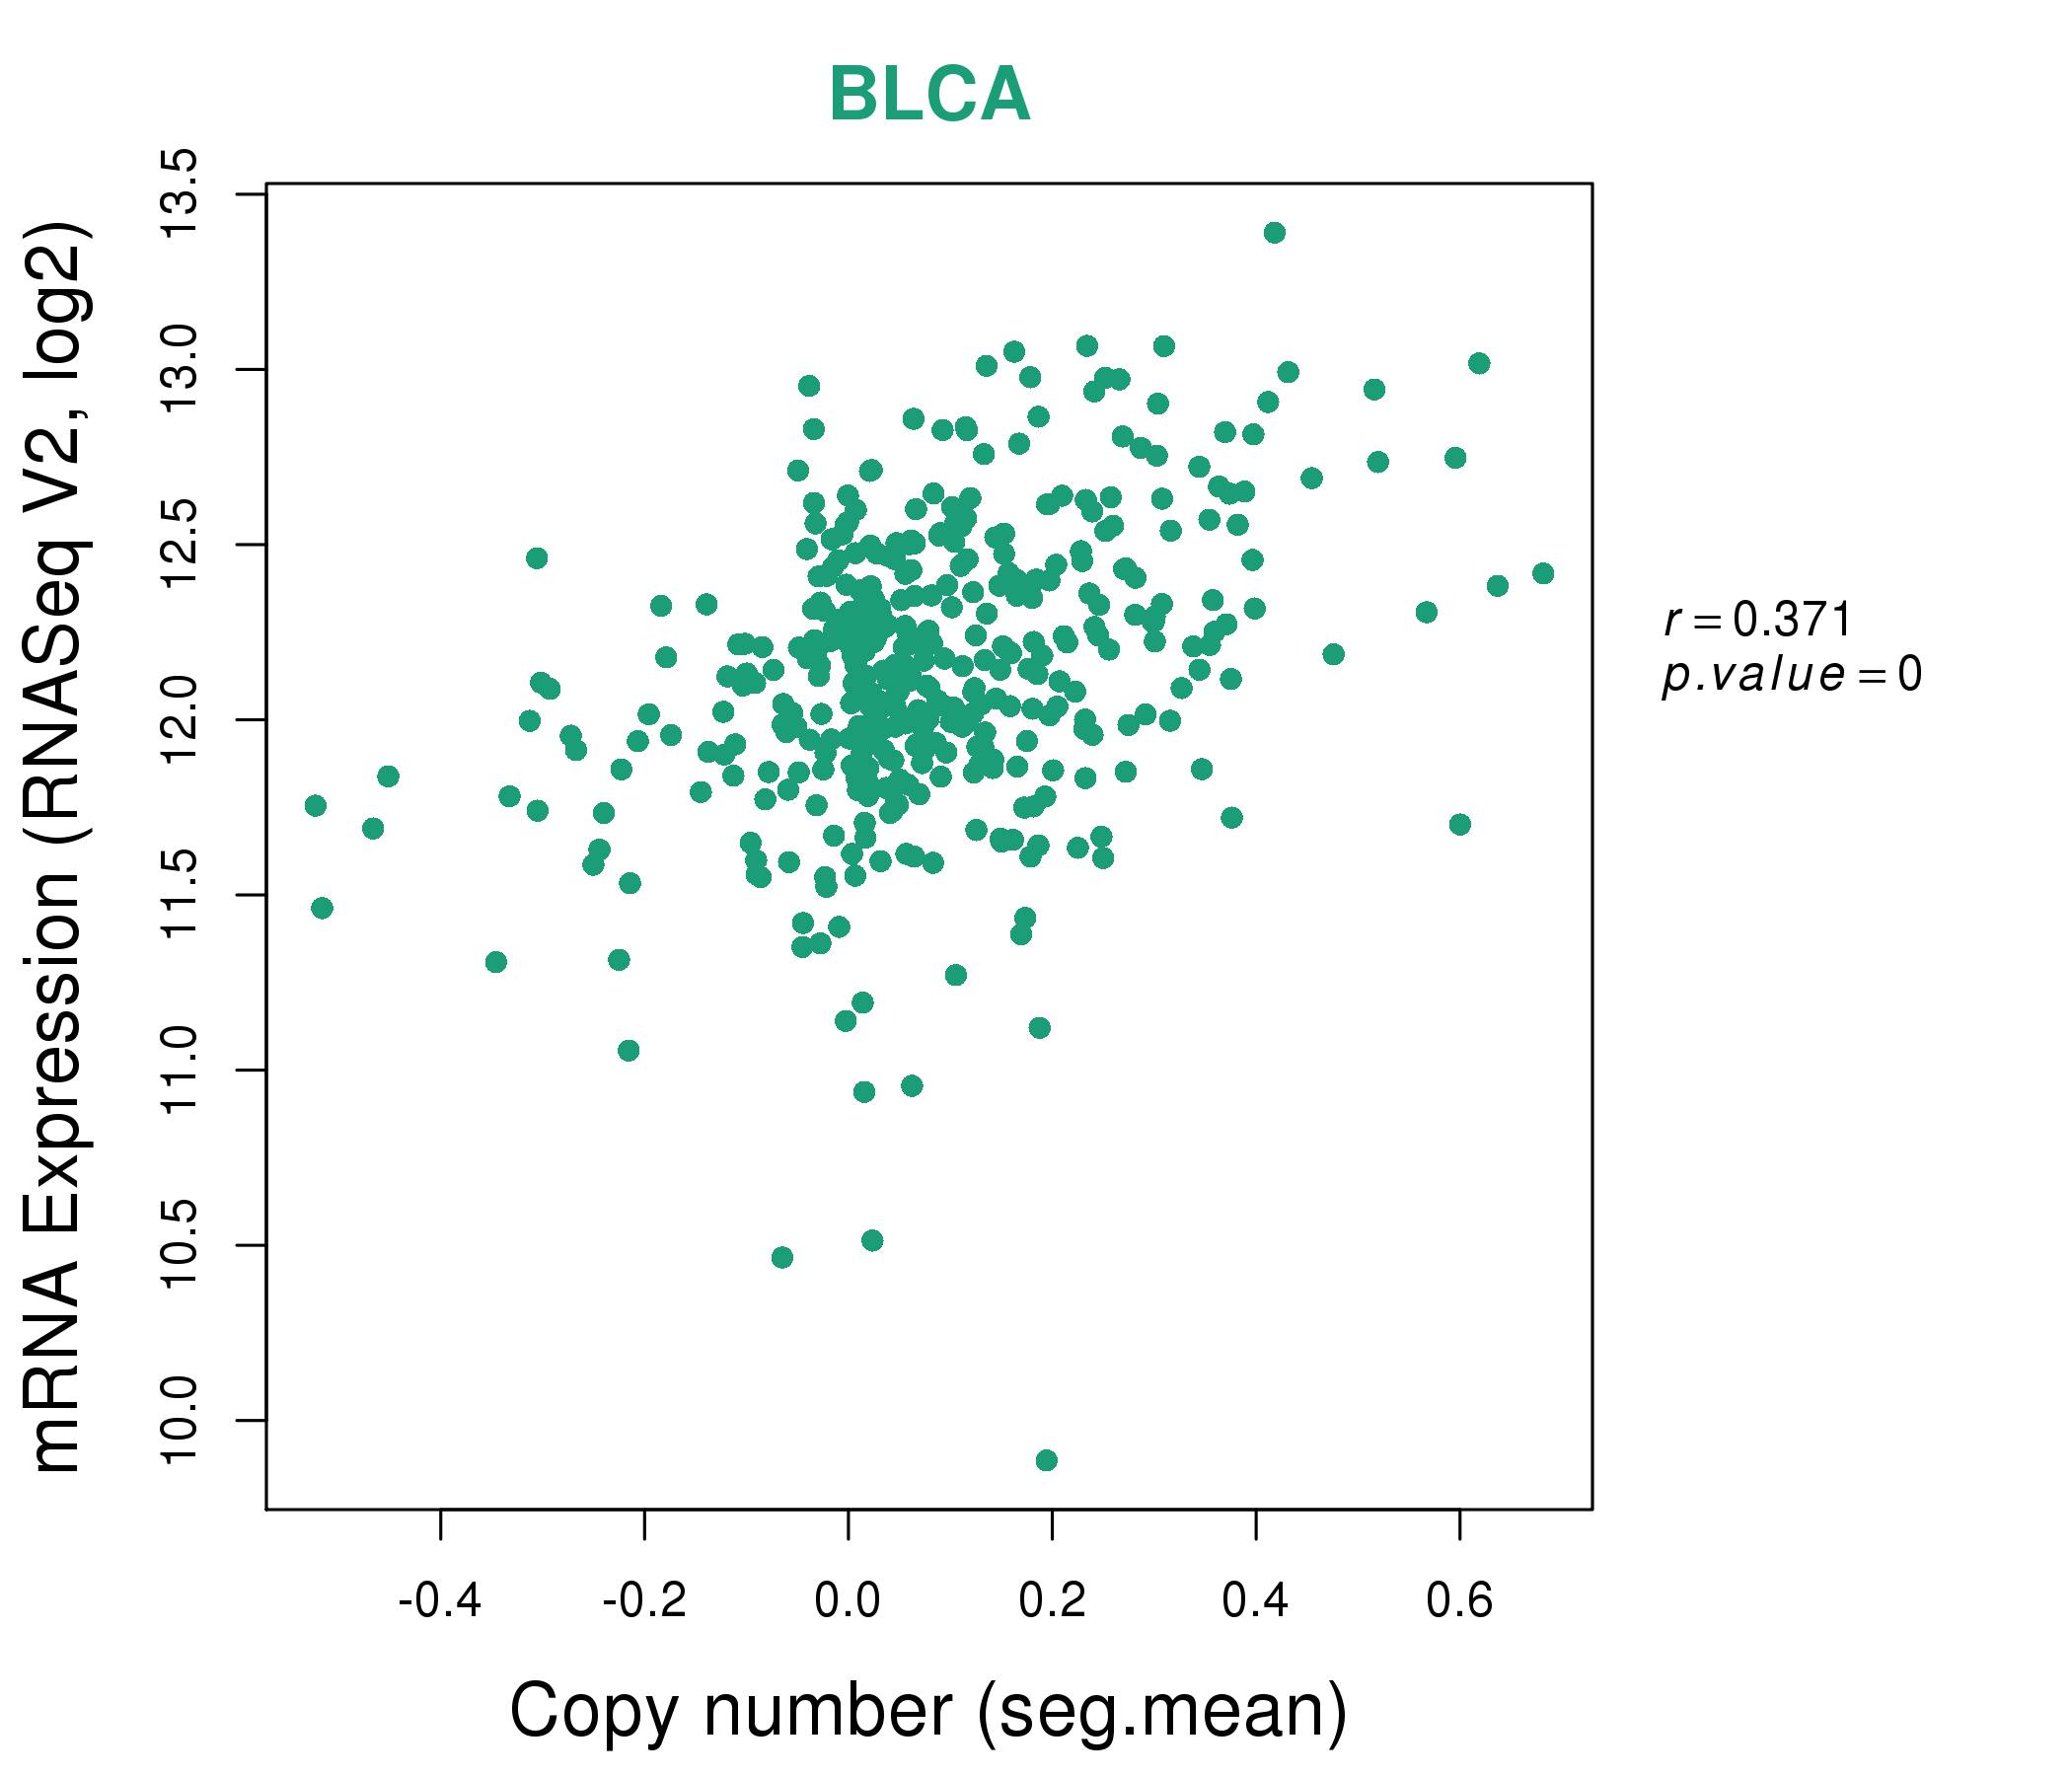
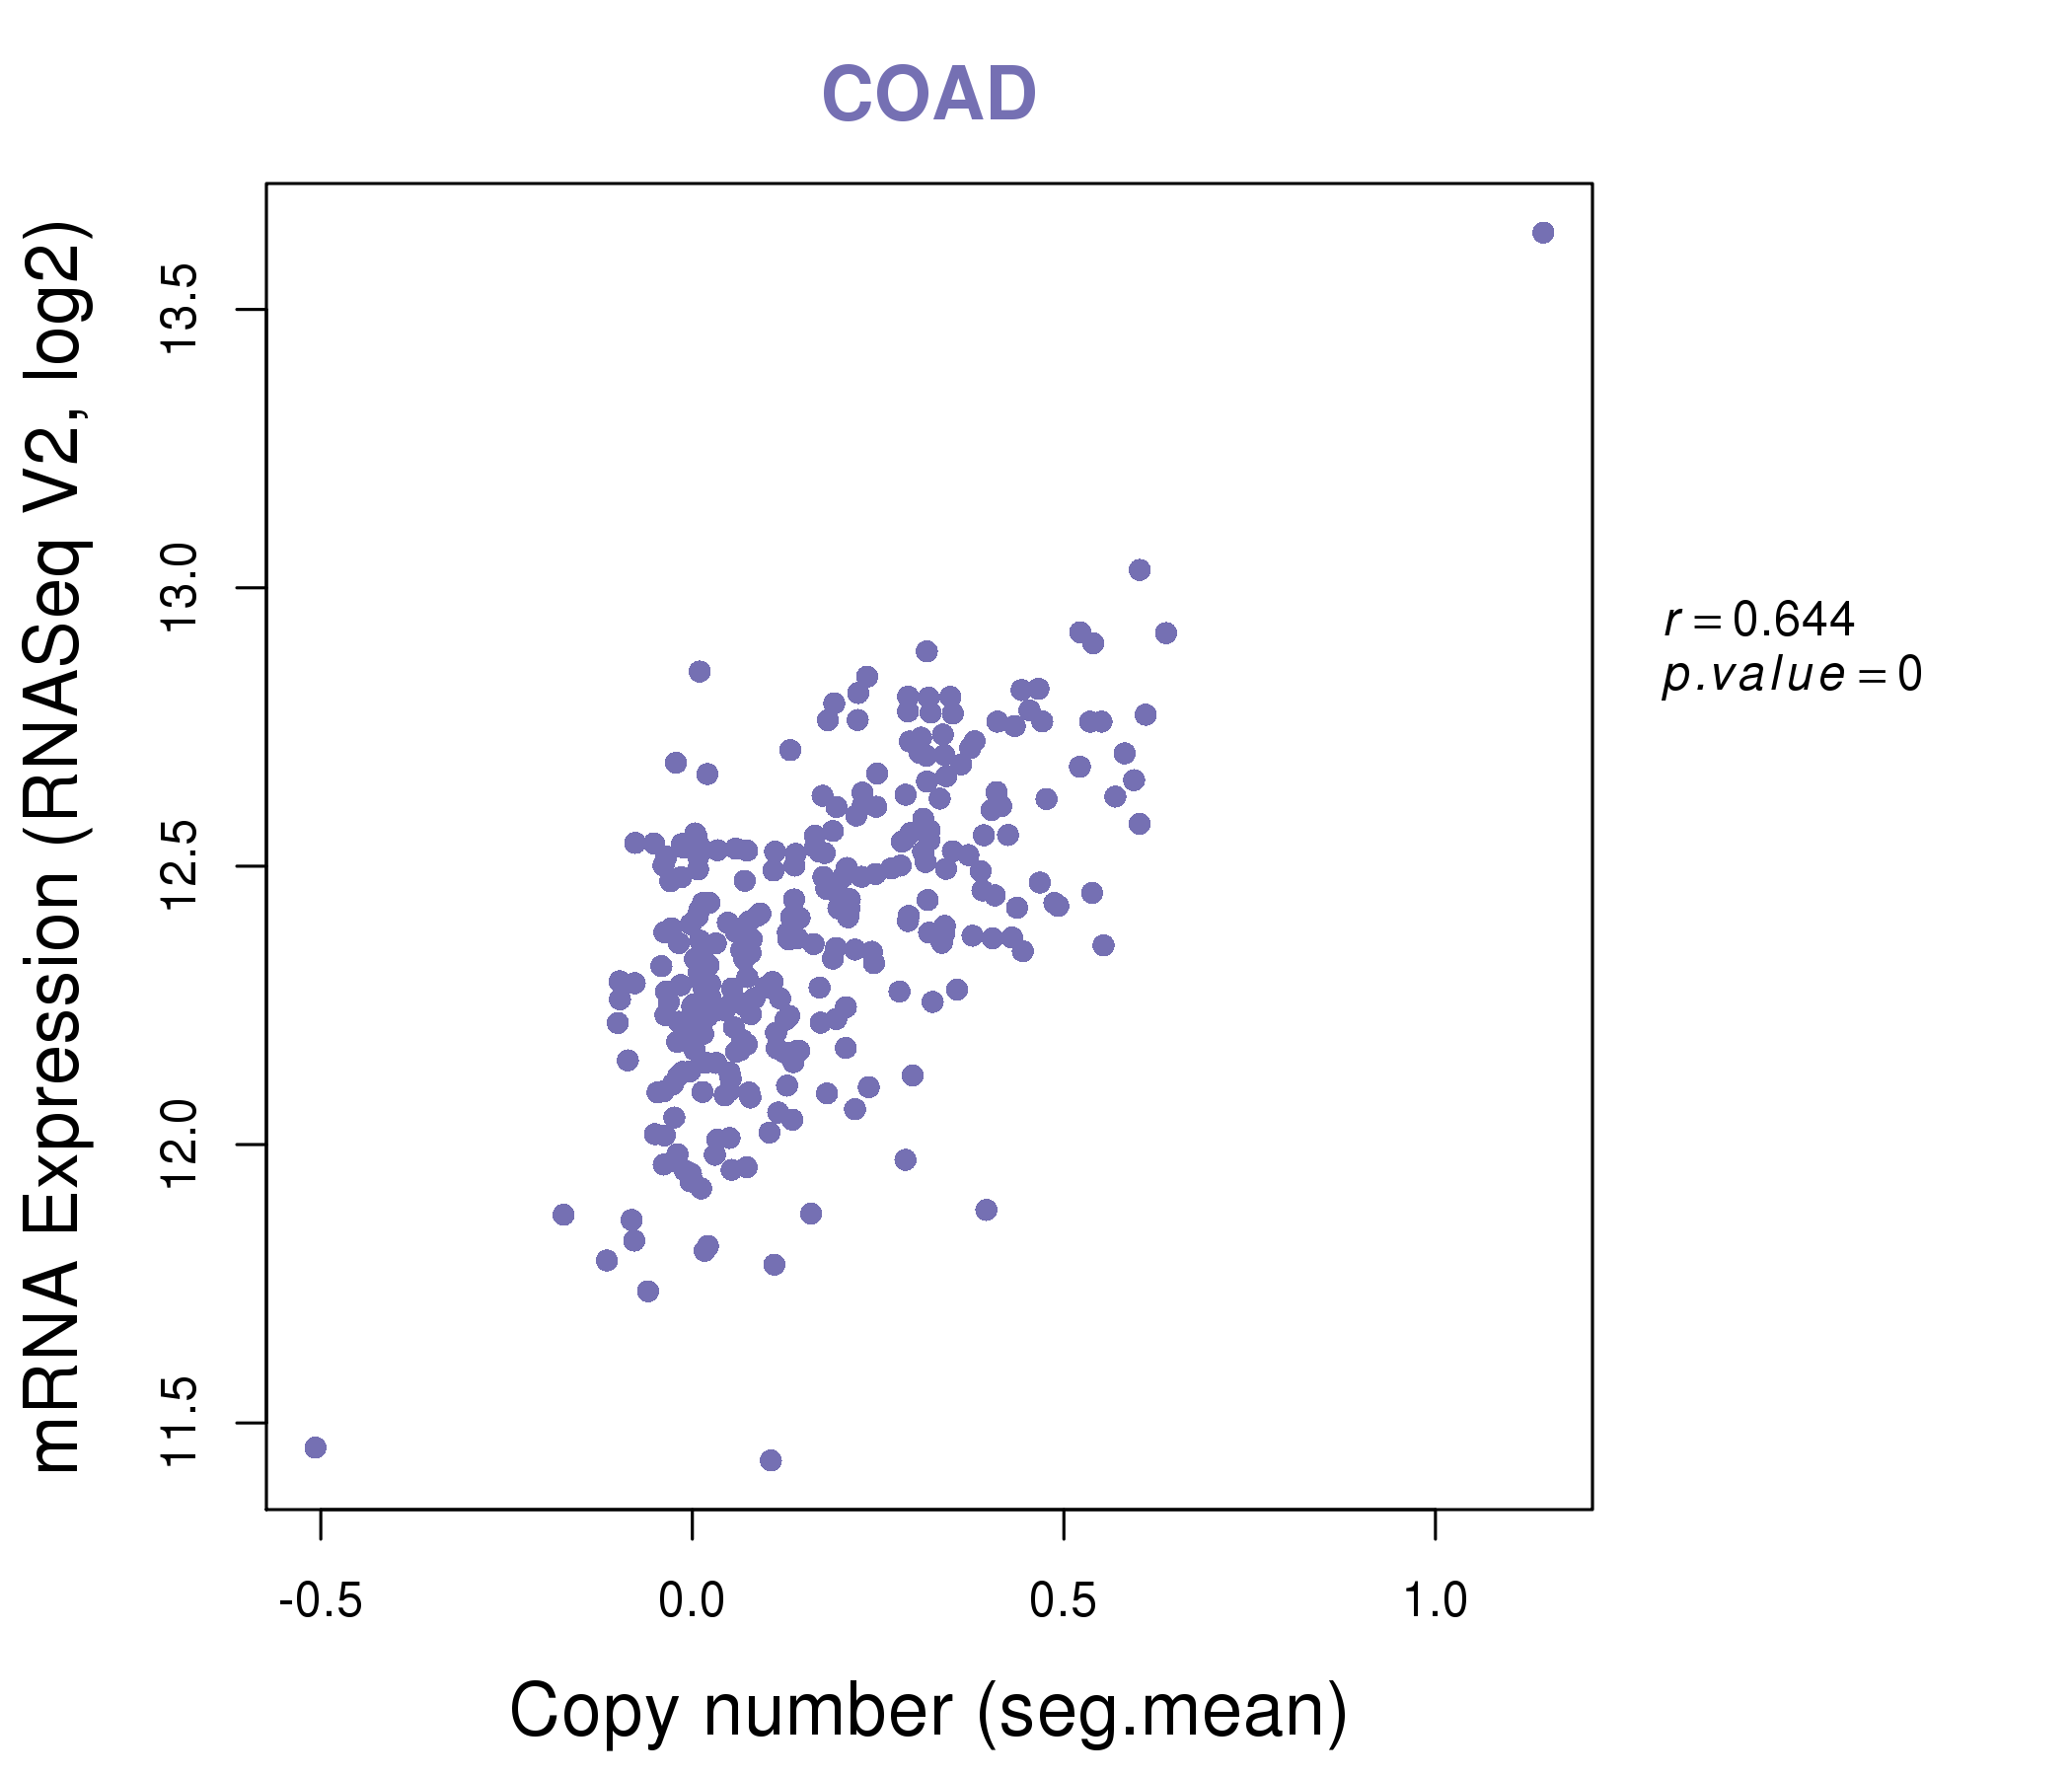
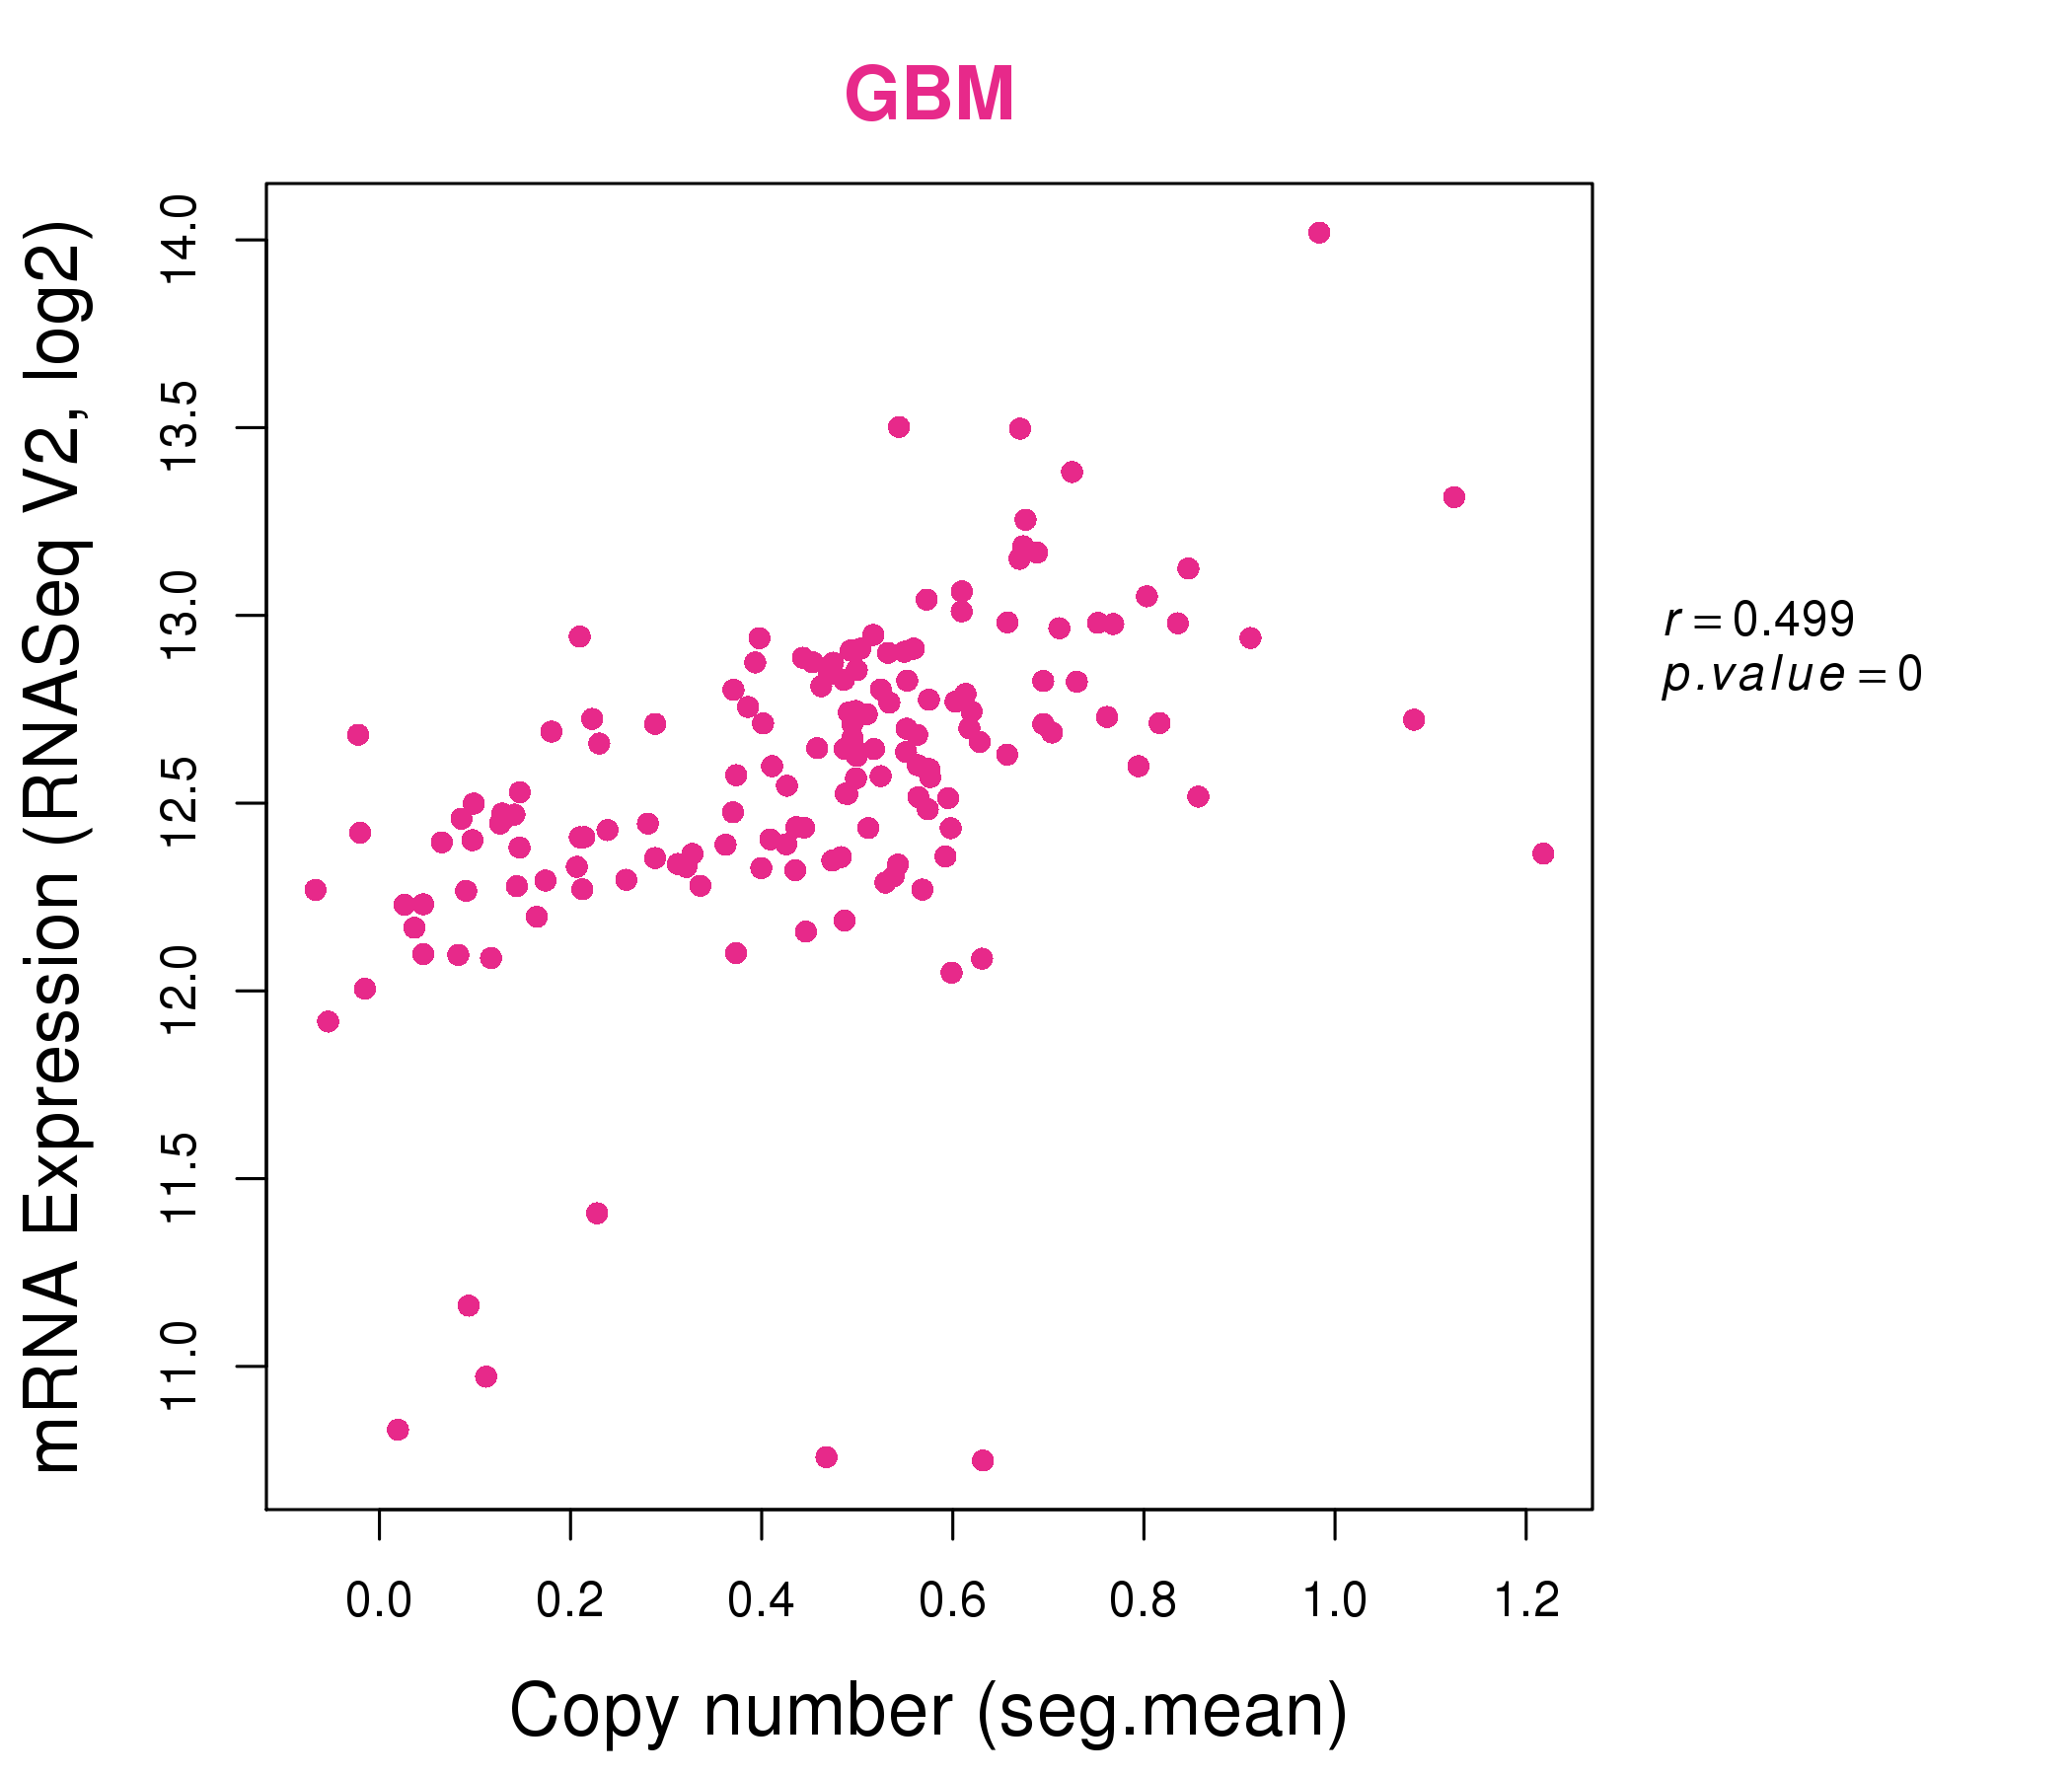
| * Normalized gene expression data of RNASeqV2 was extracted from TCGA using R package TCGA-Assembler. The URLs of all public data files on TCGA DCC data server were gathered at Jan-05-2015. Only eight cancer types have enough normal control samples for differential expression analysis. (t test, adjusted p<0.05 (using Benjamini-Hochberg FDR)) |
 |
| Top |
| * This plots show the correlation between CNV and gene expression. |
: Open all plots for all cancer types
 |
|
 |
|

| Top |
| Gene-Gene Network Information |
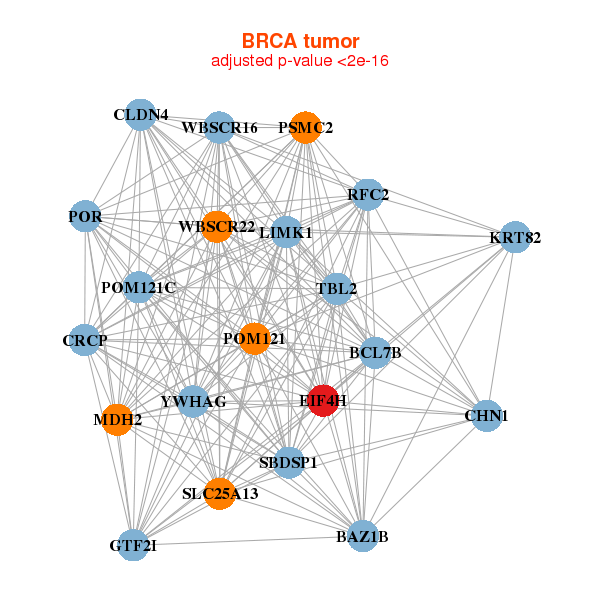
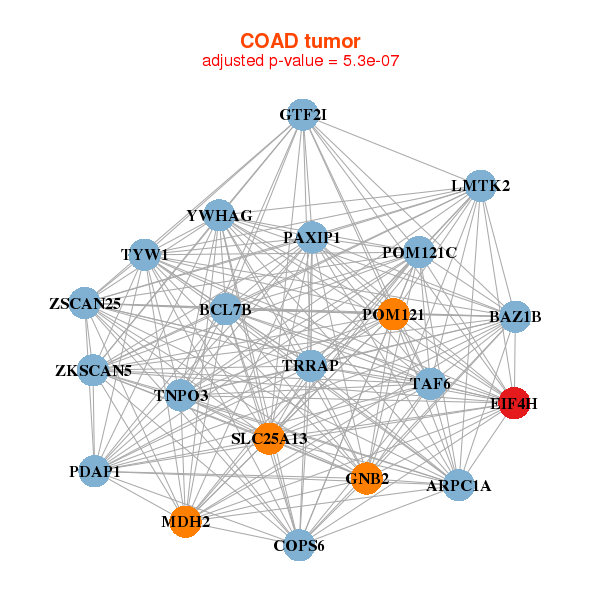
| * Co-Expression network figures were drawn using R package igraph. Only the top 20 genes with the highest correlations were shown. Red circle: input gene, orange circle: cell metabolism gene, sky circle: other gene |
: Open all plots for all cancer types
 |
|
| BAZ1B,BCL7B,CHN1,CLDN4,CRCP,EIF4H,GTF2I, KRT82,LIMK1,MDH2,POM121,POM121C,POR,PSMC2, RFC2,SBDSP1,SLC25A13,TBL2,WBSCR16,WBSCR22,YWHAG | AAMP,AATF,ARFGAP2,ARL6IP4,HYPK,OGFOD3,C6orf47, EIF4H,HARS,HIRIP3,HNRNPUL2,IK,NT5C,NUDC, PDAP1,PPM1G,SART1,SF3B2,TAF15,TSR2,UBXN1 |
 |
|
| ARPC1A,BAZ1B,BCL7B,COPS6,EIF4H,GNB2,GTF2I, LMTK2,MDH2,PAXIP1,PDAP1,POM121,POM121C,SLC25A13, TAF6,TNPO3,TRRAP,TYW1,YWHAG,ZKSCAN5,ZSCAN25 | BRE,C10orf76,COL4A3BP,DDX6,DYNLL2,DYRK1A,EIF4H, HNRNPUL2,JAK1,KIAA1279,KIF1B,LARGE,MAPK1,PAFAH1B1, PARN,PPP2R3A,RAB3GAP1,RAD23B,RYBP,SUN2,TOX4 |
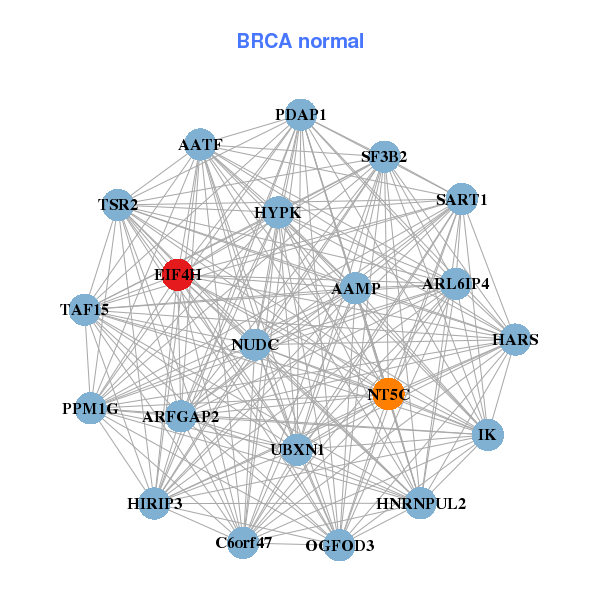
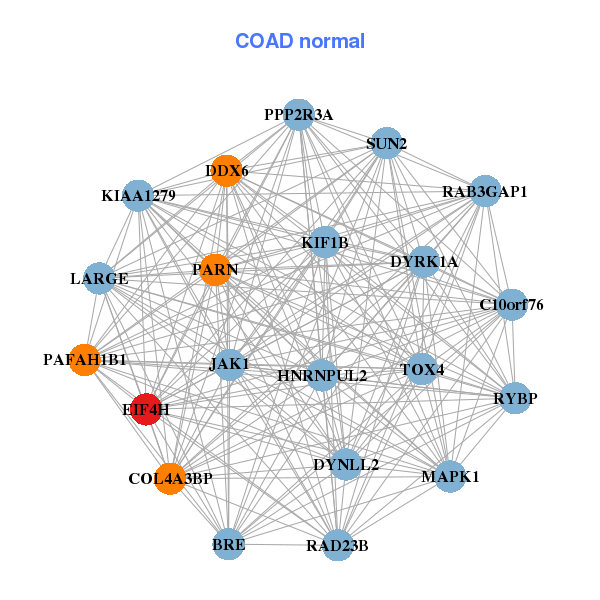
| * Co-Expression network figures were drawn using R package igraph. Only the top 20 genes with the highest correlations were shown. Red circle: input gene, orange circle: cell metabolism gene, sky circle: other gene |
: Open all plots for all cancer types
| Top |
: Open all interacting genes' information including KEGG pathway for all interacting genes from DAVID
| Top |
| Pharmacological Information for EIF4H |
| There's no related Drug. |
| Top |
| Cross referenced IDs for EIF4H |
| * We obtained these cross-references from Uniprot database. It covers 150 different DBs, 18 categories. http://www.uniprot.org/help/cross_references_section |
: Open all cross reference information
|
Copyright © 2016-Present - The Univsersity of Texas Health Science Center at Houston @ |