|
||||||||||||||||||||||||||||||||||||||||||||||||||||||||||||||||||||||||||||||||||||||||||||||||||||||||||||||||||||||||||||||||||||||||||||||||||||||||||||||||||||||||||||||||||||||||||||||||||||||||||||||||||||||||||||||||||||||||||||||||||||||||||||||||||||||||||||||||||||||||||||||||||||||||||||||||||||||||||
| |
| Phenotypic Information (metabolism pathway, cancer, disease, phenome) |
| |
| |
| Gene-Gene Network Information: Co-Expression Network, Interacting Genes & KEGG |
| |
|


| Gene Summary for YWHAB |
| Basic gene info. | Gene symbol | YWHAB |
| Gene name | tyrosine 3-monooxygenase/tryptophan 5-monooxygenase activation protein, beta | |
| Synonyms | GW128|HEL-S-1|HS1|KCIP-1|YWHAA | |
| Cytomap | UCSC genome browser: 20q13.1 | |
| Genomic location | chr20 :43514343-43537161 | |
| Type of gene | protein-coding | |
| RefGenes | NM_003404.4, NM_139323.3, | |
| Ensembl id | ENSG00000166913 | |
| Description | 14-3-3 alpha14-3-3 protein beta/alphabrain protein 14-3-3, beta isoformepididymis secretory protein Li 1protein 1054protein kinase C inhibitor protein 1protein kinase C inhibitor protein-1tyrosine 3-monooxygenase/tryptophan 5-monooxygenase activati | |
| Modification date | 20141207 | |
| dbXrefs | MIM : 601289 | |
| HGNC : HGNC | ||
| Ensembl : ENSG00000166913 | ||
| HPRD : 03184 | ||
| Vega : OTTHUMG00000032549 | ||
| Protein | UniProt: P31946 go to UniProt's Cross Reference DB Table | |
| Expression | CleanEX: HS_YWHAB | |
| BioGPS: 7529 | ||
| Gene Expression Atlas: ENSG00000166913 | ||
| The Human Protein Atlas: ENSG00000166913 | ||
| Pathway | NCI Pathway Interaction Database: YWHAB | |
| KEGG: YWHAB | ||
| REACTOME: YWHAB | ||
| ConsensusPathDB | ||
| Pathway Commons: YWHAB | ||
| Metabolism | MetaCyc: YWHAB | |
| HUMANCyc: YWHAB | ||
| Regulation | Ensembl's Regulation: ENSG00000166913 | |
| miRBase: chr20 :43,514,343-43,537,161 | ||
| TargetScan: NM_003404 | ||
| cisRED: ENSG00000166913 | ||
| Context | iHOP: YWHAB | |
| cancer metabolism search in PubMed: YWHAB | ||
| UCL Cancer Institute: YWHAB | ||
| Assigned class in ccmGDB | A - This gene has a literature evidence and it belongs to cancer gene. | |
| References showing role of YWHAB in cancer cell metabolism | 1. Zhao J, Wen G, Ding M, Pan J-Y, Yu M-L, et al. (2012) Comparative Proteomic Analysis of Colon Cancer Cell HCT-15 in Response to All-Trans Retinoic Acid Treatment. Protein and peptide letters 19: 1272-1280. go to article | |
| Top |
| Phenotypic Information for YWHAB(metabolism pathway, cancer, disease, phenome) |
| Cancer | CGAP: YWHAB |
| Familial Cancer Database: YWHAB | |
| * This gene is included in those cancer gene databases. |
|
|
|
|
|
| . | ||||||||||||||||||||||||||||||||||||||||||||||||||||||||||||||||||||||||||||||||||||||||||||||||||||||||||||||||||||||||||||||||||||||||||||||||||||||||||||||||||||||||||||||||||||||||||||||||||||||||||||||||||||||||||||||||||||||||||||||||||||||||||||||||||||||||||||||||||||||||||||||||||||||||||||||||||||
Oncogene 1 | Significant driver gene in | |||||||||||||||||||||||||||||||||||||||||||||||||||||||||||||||||||||||||||||||||||||||||||||||||||||||||||||||||||||||||||||||||||||||||||||||||||||||||||||||||||||||||||||||||||||||||||||||||||||||||||||||||||||||||||||||||||||||||||||||||||||||||||||||||||||||||||||||||||||||||||||||||||||||||||||||||||||||||
| cf) number; DB name 1 Oncogene; http://nar.oxfordjournals.org/content/35/suppl_1/D721.long, 2 Tumor Suppressor gene; https://bioinfo.uth.edu/TSGene/, 3 Cancer Gene Census; http://www.nature.com/nrc/journal/v4/n3/abs/nrc1299.html, 4 CancerGenes; http://nar.oxfordjournals.org/content/35/suppl_1/D721.long, 5 Network of Cancer Gene; http://ncg.kcl.ac.uk/index.php, 1Therapeutic Vulnerabilities in Cancer; http://cbio.mskcc.org/cancergenomics/statius/ |
| REACTOME_METABOLISM_OF_MRNA REACTOME_METABOLISM_OF_RNA | |
| OMIM | 601289; gene. |
| Orphanet | |
| Disease | KEGG Disease: YWHAB |
| MedGen: YWHAB (Human Medical Genetics with Condition) | |
| ClinVar: YWHAB | |
| Phenotype | MGI: YWHAB (International Mouse Phenotyping Consortium) |
| PhenomicDB: YWHAB | |
| Mutations for YWHAB |
| * Under tables are showing count per each tissue to give us broad intuition about tissue specific mutation patterns.You can go to the detailed page for each mutation database's web site. |
| There's no structural variation information in COSMIC data for this gene. |
| * From mRNA Sanger sequences, Chitars2.0 arranged chimeric transcripts. This table shows YWHAB related fusion information. |
| ID | Head Gene | Tail Gene | Accession | Gene_a | qStart_a | qEnd_a | Chromosome_a | tStart_a | tEnd_a | Gene_a | qStart_a | qEnd_a | Chromosome_a | tStart_a | tEnd_a |
| BQ302015 | YWHAB | 1 | 97 | 20 | 43530306 | 43530402 | YWHAB | 91 | 368 | 20 | 43530376 | 43533663 | |
| BM975208 | COL3A1 | 15 | 528 | 2 | 189875531 | 189876781 | YWHAB | 525 | 747 | 20 | 43514415 | 43530285 | |
| BQ961579 | TSG101 | 1 | 47 | 11 | 18512062 | 18512108 | YWHAB | 44 | 832 | 20 | 43530206 | 43535158 | |
| DB142934 | YWHAB | 1 | 479 | 20 | 43532679 | 43535161 | GJA1 | 479 | 565 | 6 | 121756829 | 121756915 | |
| BU626199 | YWHAB | 2 | 118 | 20 | 43536698 | 43536814 | SLC29A3 | 112 | 642 | 10 | 73115874 | 73122114 | |
| CB242961 | YWHAB | 1 | 203 | 20 | 43534674 | 43535161 | YWHAB | 200 | 318 | 20 | 43533671 | 43534658 | |
| BU675977 | YWHAB | 1 | 149 | 20 | 43536936 | 43537082 | DZIP1 | 130 | 260 | 13 | 96271828 | 96271958 | |
| BF898629 | YWHAB | 1 | 103 | 20 | 43536396 | 43536499 | YWHAB | 98 | 260 | 20 | 43536501 | 43536663 | |
| BE547046 | YWHAB | 9 | 177 | 20 | 43535622 | 43535789 | YWHAB | 173 | 700 | 20 | 43535783 | 43536318 | |
| CN276496 | YWHAB | 1 | 104 | 20 | 43534683 | 43535071 | YWHAB | 100 | 329 | 20 | 43530285 | 43532673 | |
| BC000883 | YWHAB | 28 | 195 | 20 | 43535622 | 43535789 | YWHAB | 191 | 1221 | 20 | 43535783 | 43536814 | |
| Top |
| Mutation type/ Tissue ID | brca | cns | cerv | endome | haematopo | kidn | Lintest | liver | lung | ns | ovary | pancre | prost | skin | stoma | thyro | urina | |||
| Total # sample | 1 | |||||||||||||||||||
| GAIN (# sample) | 1 | |||||||||||||||||||
| LOSS (# sample) |
| cf) Tissue ID; Tissue type (1; Breast, 2; Central_nervous_system, 3; Cervix, 4; Endometrium, 5; Haematopoietic_and_lymphoid_tissue, 6; Kidney, 7; Large_intestine, 8; Liver, 9; Lung, 10; NS, 11; Ovary, 12; Pancreas, 13; Prostate, 14; Skin, 15; Stomach, 16; Thyroid, 17; Urinary_tract) |
| Top |
|
 |
| Top |
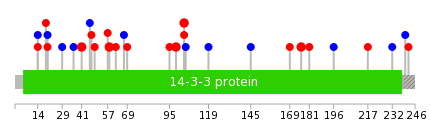
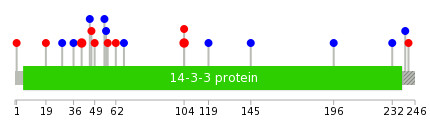
| Stat. for Non-Synonymous SNVs (# total SNVs=18) | (# total SNVs=8) |
 |  |
(# total SNVs=0) | (# total SNVs=0) |
| Top |
| * When you move the cursor on each content, you can see more deailed mutation information on the Tooltip. Those are primary_site,primary_histology,mutation(aa),pubmedID. |
| GRCh37 position | Mutation(aa) | Unique sampleID count |
| chr20:43532645-43532645 | p.D104E | 2 |
| chr20:43530347-43530347 | p.R58L | 2 |
| chr20:43533712-43533712 | p.F176L | 2 |
| chr20:43530295-43530295 | p.E41K | 2 |
| chr20:43532644-43532644 | p.D104G | 1 |
| chr20:43535034-43535034 | p.S232S | 1 |
| chr20:43530312-43530312 | p.L46L | 1 |
| chr20:43535058-43535058 | p.D240D | 1 |
| chr20:43530314-43530314 | p.S47F | 1 |
| chr20:43532648-43532648 | p.K105K | 1 |
| Top |
|
 |
| Point Mutation/ Tissue ID | 1 | 2 | 3 | 4 | 5 | 6 | 7 | 8 | 9 | 10 | 11 | 12 | 13 | 14 | 15 | 16 | 17 | 18 | 19 | 20 |
| # sample | 2 | 1 | 4 | 2 | 2 | 1 | 1 | 1 | 3 | 4 | 2 | |||||||||
| # mutation | 2 | 1 | 4 | 2 | 2 | 1 | 1 | 1 | 3 | 4 | 2 | |||||||||
| nonsynonymous SNV | 2 | 1 | 4 | 1 | 1 | 1 | 1 | 1 | ||||||||||||
| synonymous SNV | 1 | 2 | 1 | 2 | 3 | 2 |
| cf) Tissue ID; Tissue type (1; BLCA[Bladder Urothelial Carcinoma], 2; BRCA[Breast invasive carcinoma], 3; CESC[Cervical squamous cell carcinoma and endocervical adenocarcinoma], 4; COAD[Colon adenocarcinoma], 5; GBM[Glioblastoma multiforme], 6; Glioma Low Grade, 7; HNSC[Head and Neck squamous cell carcinoma], 8; KICH[Kidney Chromophobe], 9; KIRC[Kidney renal clear cell carcinoma], 10; KIRP[Kidney renal papillary cell carcinoma], 11; LAML[Acute Myeloid Leukemia], 12; LUAD[Lung adenocarcinoma], 13; LUSC[Lung squamous cell carcinoma], 14; OV[Ovarian serous cystadenocarcinoma ], 15; PAAD[Pancreatic adenocarcinoma], 16; PRAD[Prostate adenocarcinoma], 17; SKCM[Skin Cutaneous Melanoma], 18:STAD[Stomach adenocarcinoma], 19:THCA[Thyroid carcinoma], 20:UCEC[Uterine Corpus Endometrial Carcinoma]) |
| Top |
| * We represented just top 10 SNVs. When you move the cursor on each content, you can see more deailed mutation information on the Tooltip. Those are primary_site, primary_histology, mutation(aa), pubmedID. |
| Genomic Position | Mutation(aa) | Unique sampleID count |
| chr20:43532645 | p.E41K,YWHAB | 2 |
| chr20:43530295 | p.D104E,YWHAB | 2 |
| chr20:43535034 | p.E19K,YWHAB | 1 |
| chr20:43530339 | p.T196T,YWHAB | 1 |
| chr20:43535058 | p.K29K,YWHAB | 1 |
| chr20:43530342 | p.S232S,YWHAB | 1 |
| chr20:43535062 | p.H36H,YWHAB | 1 |
| chr20:43530343 | p.D240D,YWHAB | 1 |
| chr20:43530177 | p.G242R,YWHAB | 1 |
| chr20:43530358 | p.L46L,YWHAB | 1 |
| * Copy number data were extracted from TCGA using R package TCGA-Assembler. The URLs of all public data files on TCGA DCC data server were gathered on Jan-05-2015. Function ProcessCNAData in TCGA-Assembler package was used to obtain gene-level copy number value which is calculated as the average copy number of the genomic region of a gene. |
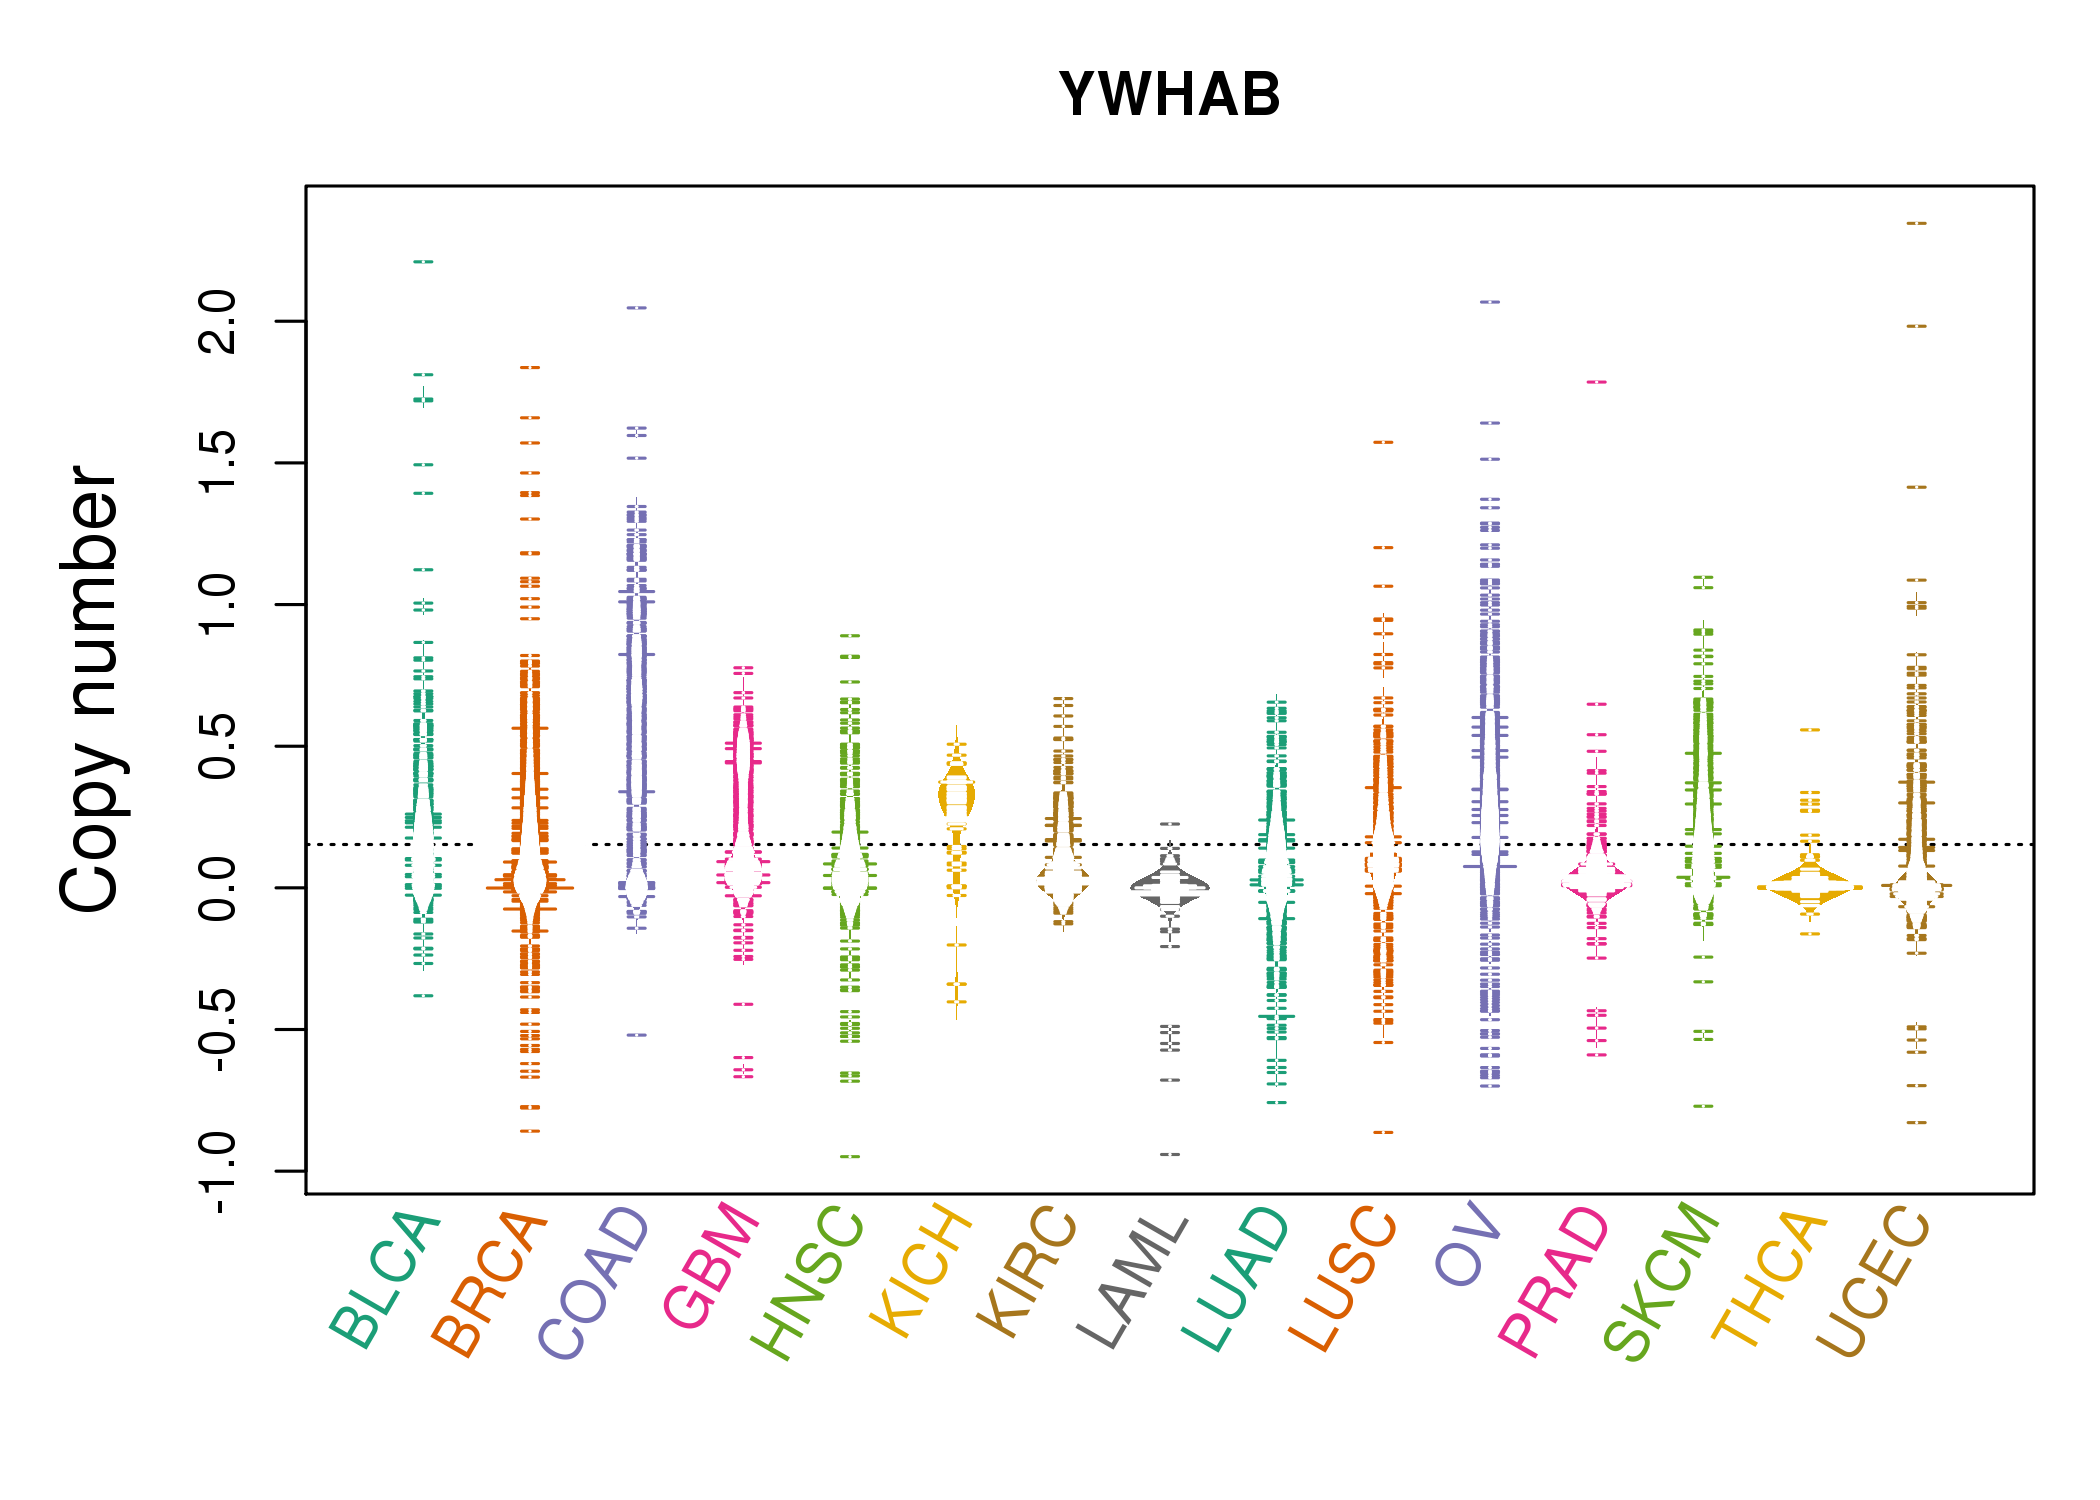 |
| cf) Tissue ID[Tissue type]: BLCA[Bladder Urothelial Carcinoma], BRCA[Breast invasive carcinoma], CESC[Cervical squamous cell carcinoma and endocervical adenocarcinoma], COAD[Colon adenocarcinoma], GBM[Glioblastoma multiforme], Glioma Low Grade, HNSC[Head and Neck squamous cell carcinoma], KICH[Kidney Chromophobe], KIRC[Kidney renal clear cell carcinoma], KIRP[Kidney renal papillary cell carcinoma], LAML[Acute Myeloid Leukemia], LUAD[Lung adenocarcinoma], LUSC[Lung squamous cell carcinoma], OV[Ovarian serous cystadenocarcinoma ], PAAD[Pancreatic adenocarcinoma], PRAD[Prostate adenocarcinoma], SKCM[Skin Cutaneous Melanoma], STAD[Stomach adenocarcinoma], THCA[Thyroid carcinoma], UCEC[Uterine Corpus Endometrial Carcinoma] |
| Top |
| Gene Expression for YWHAB |
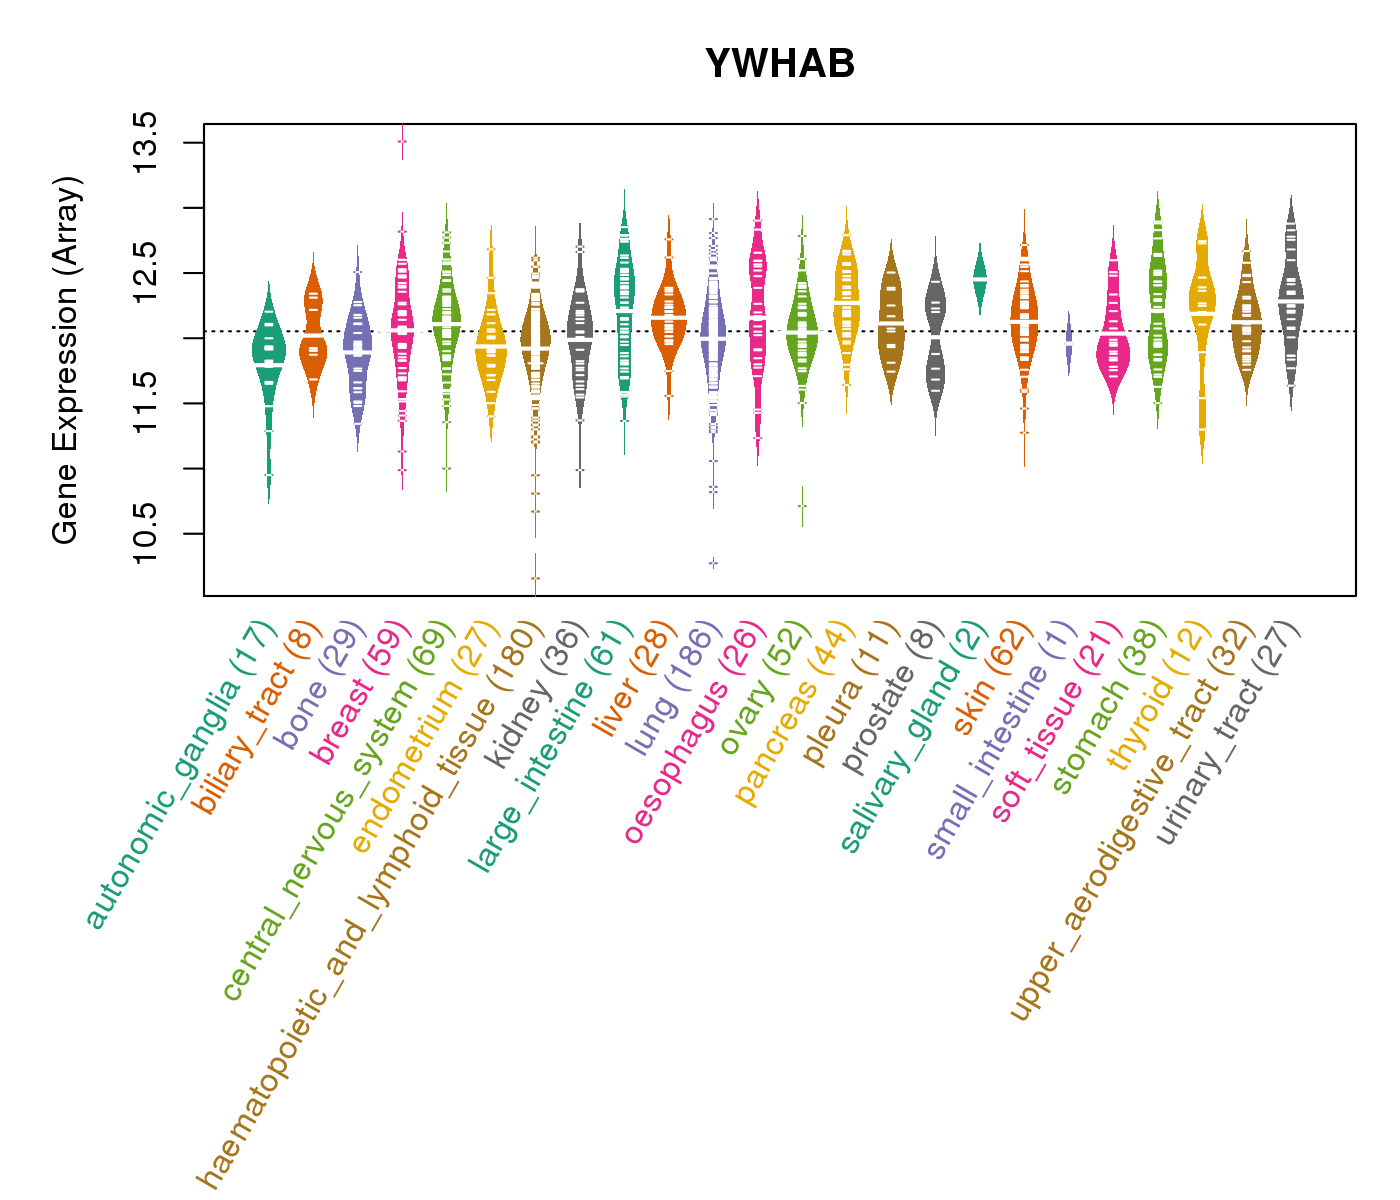
| * CCLE gene expression data were extracted from CCLE_Expression_Entrez_2012-10-18.res: Gene-centric RMA-normalized mRNA expression data. |
 |
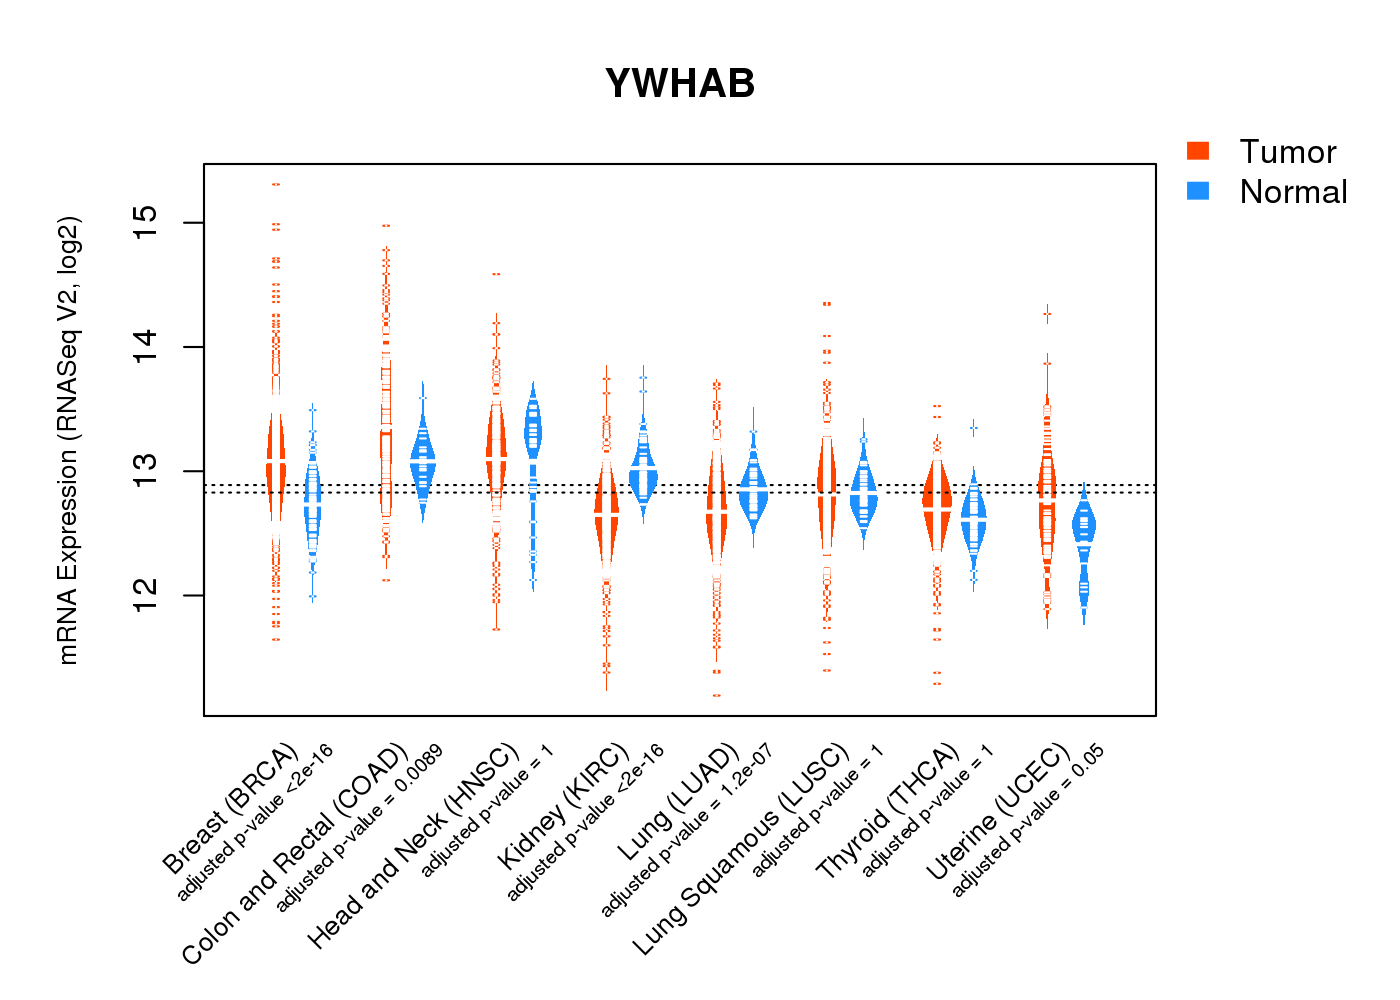
| * Normalized gene expression data of RNASeqV2 was extracted from TCGA using R package TCGA-Assembler. The URLs of all public data files on TCGA DCC data server were gathered at Jan-05-2015. Only eight cancer types have enough normal control samples for differential expression analysis. (t test, adjusted p<0.05 (using Benjamini-Hochberg FDR)) |
 |
| Top |
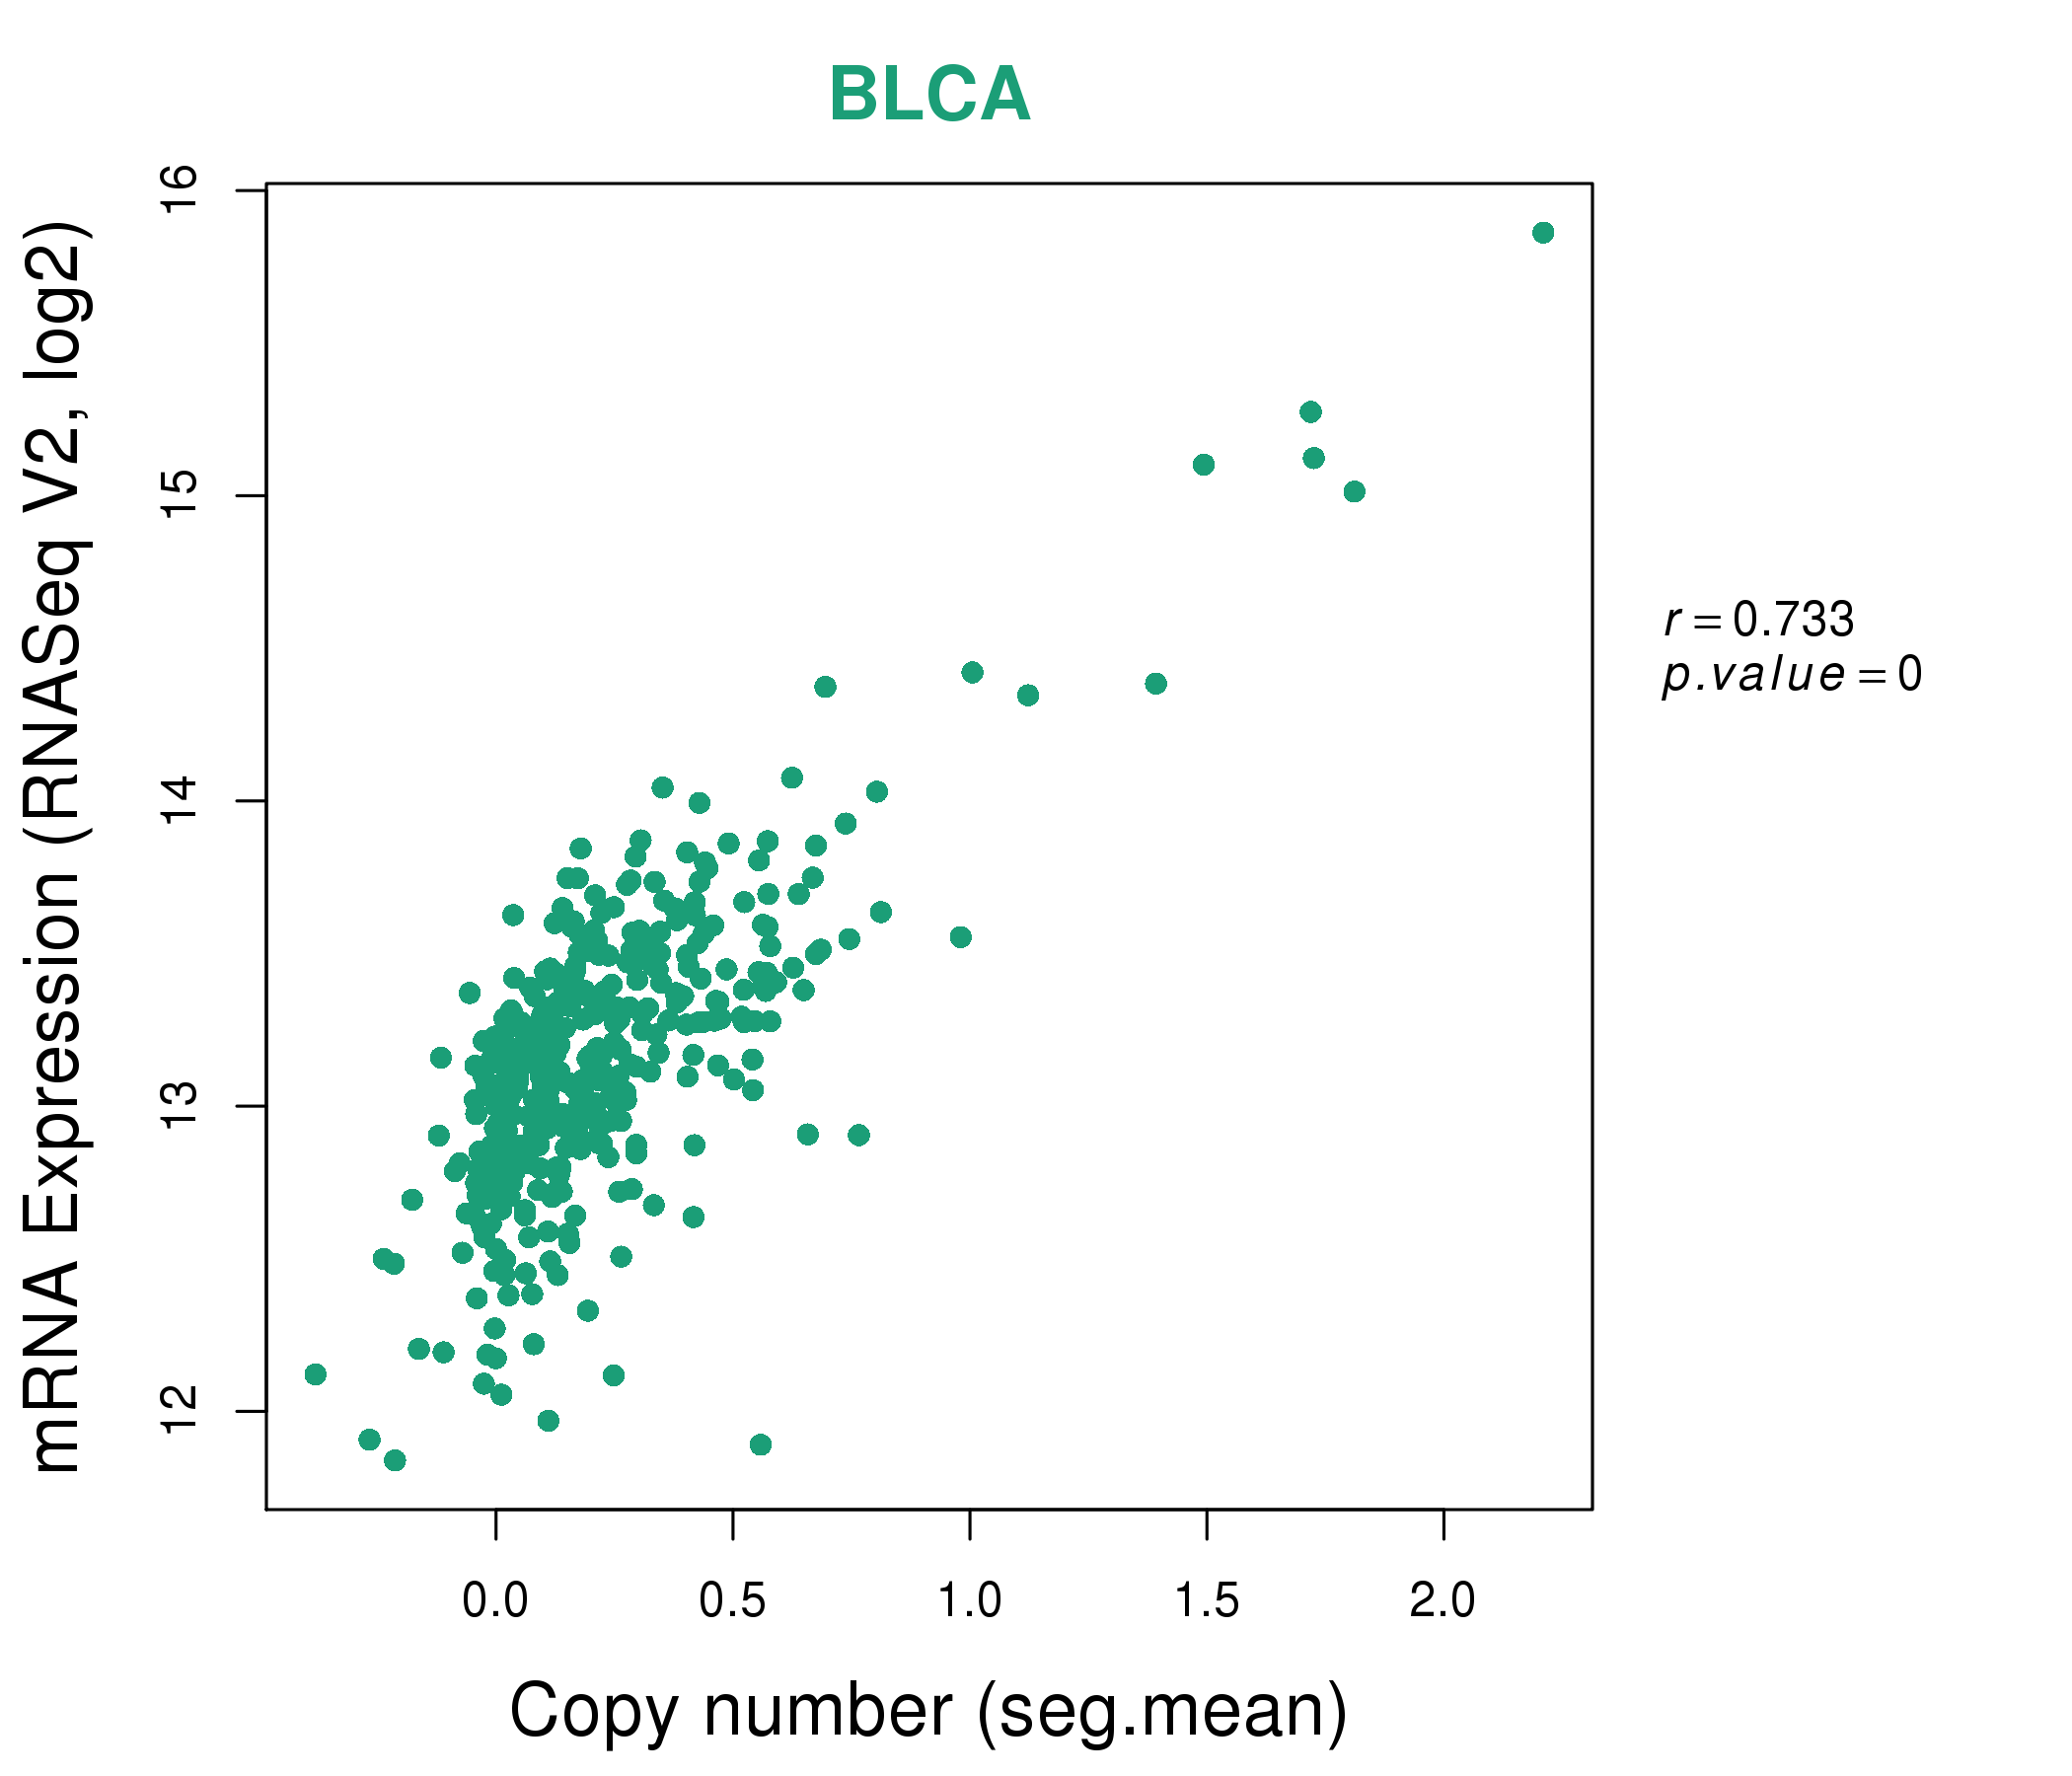
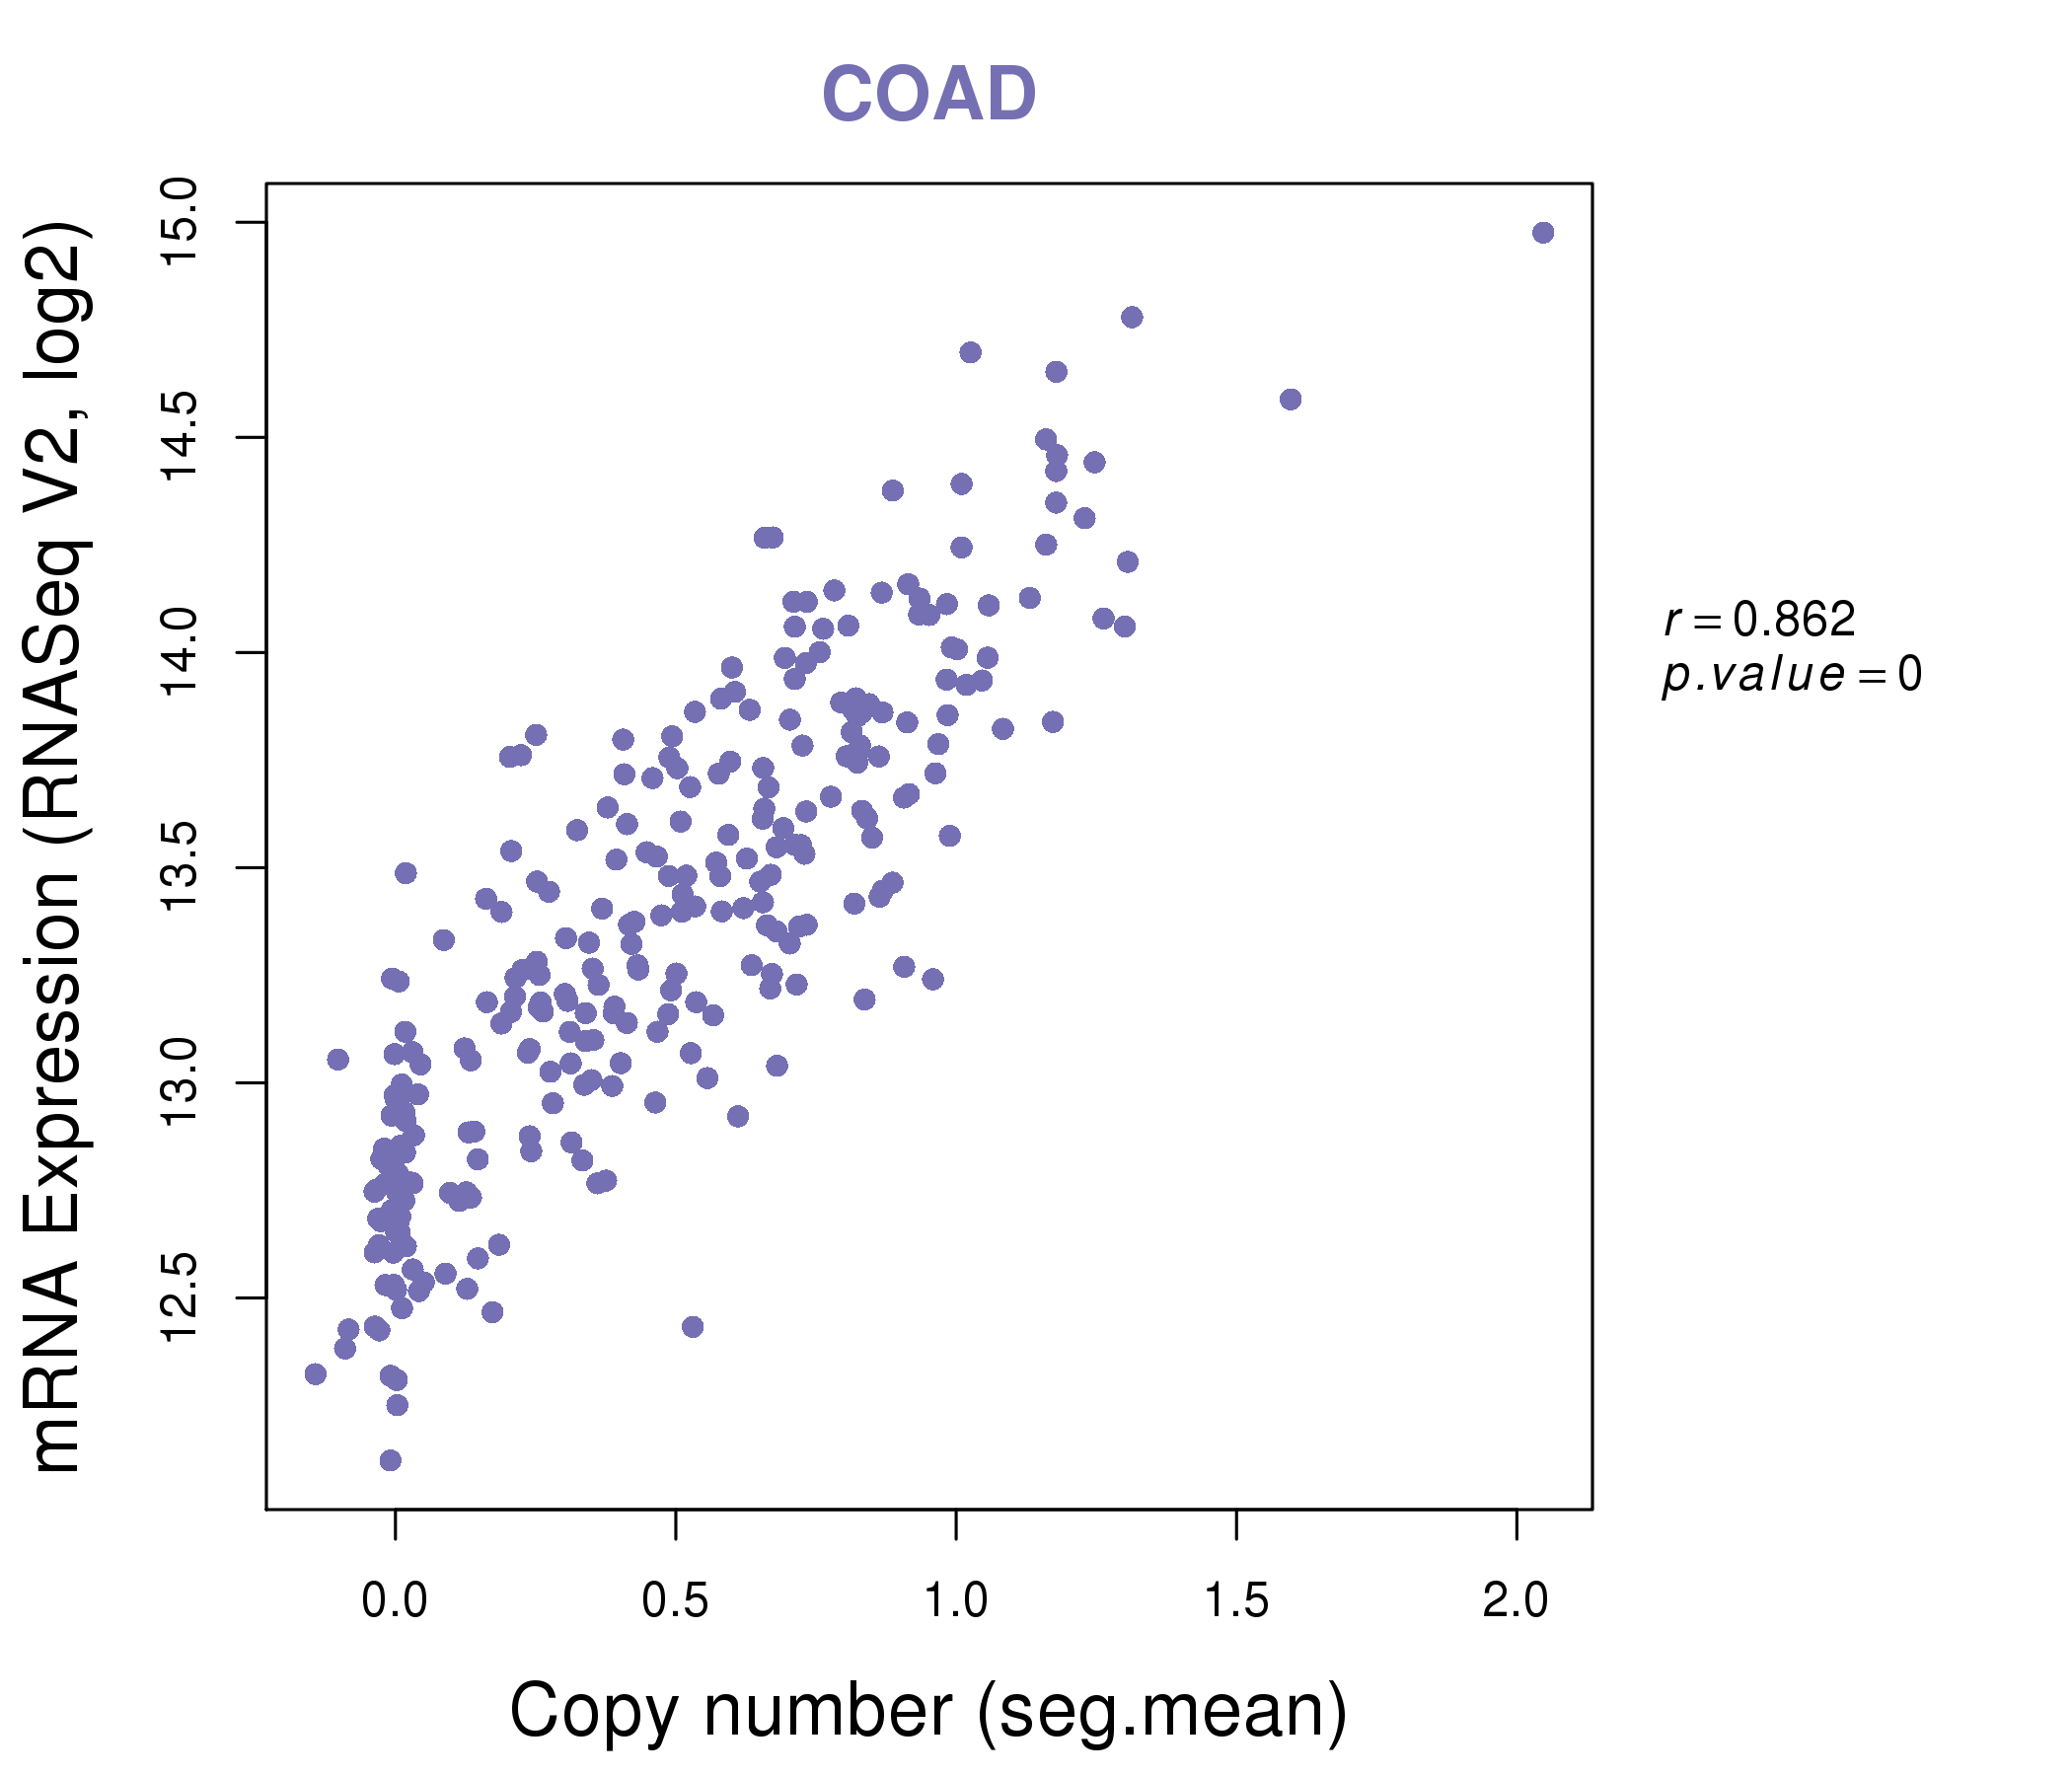
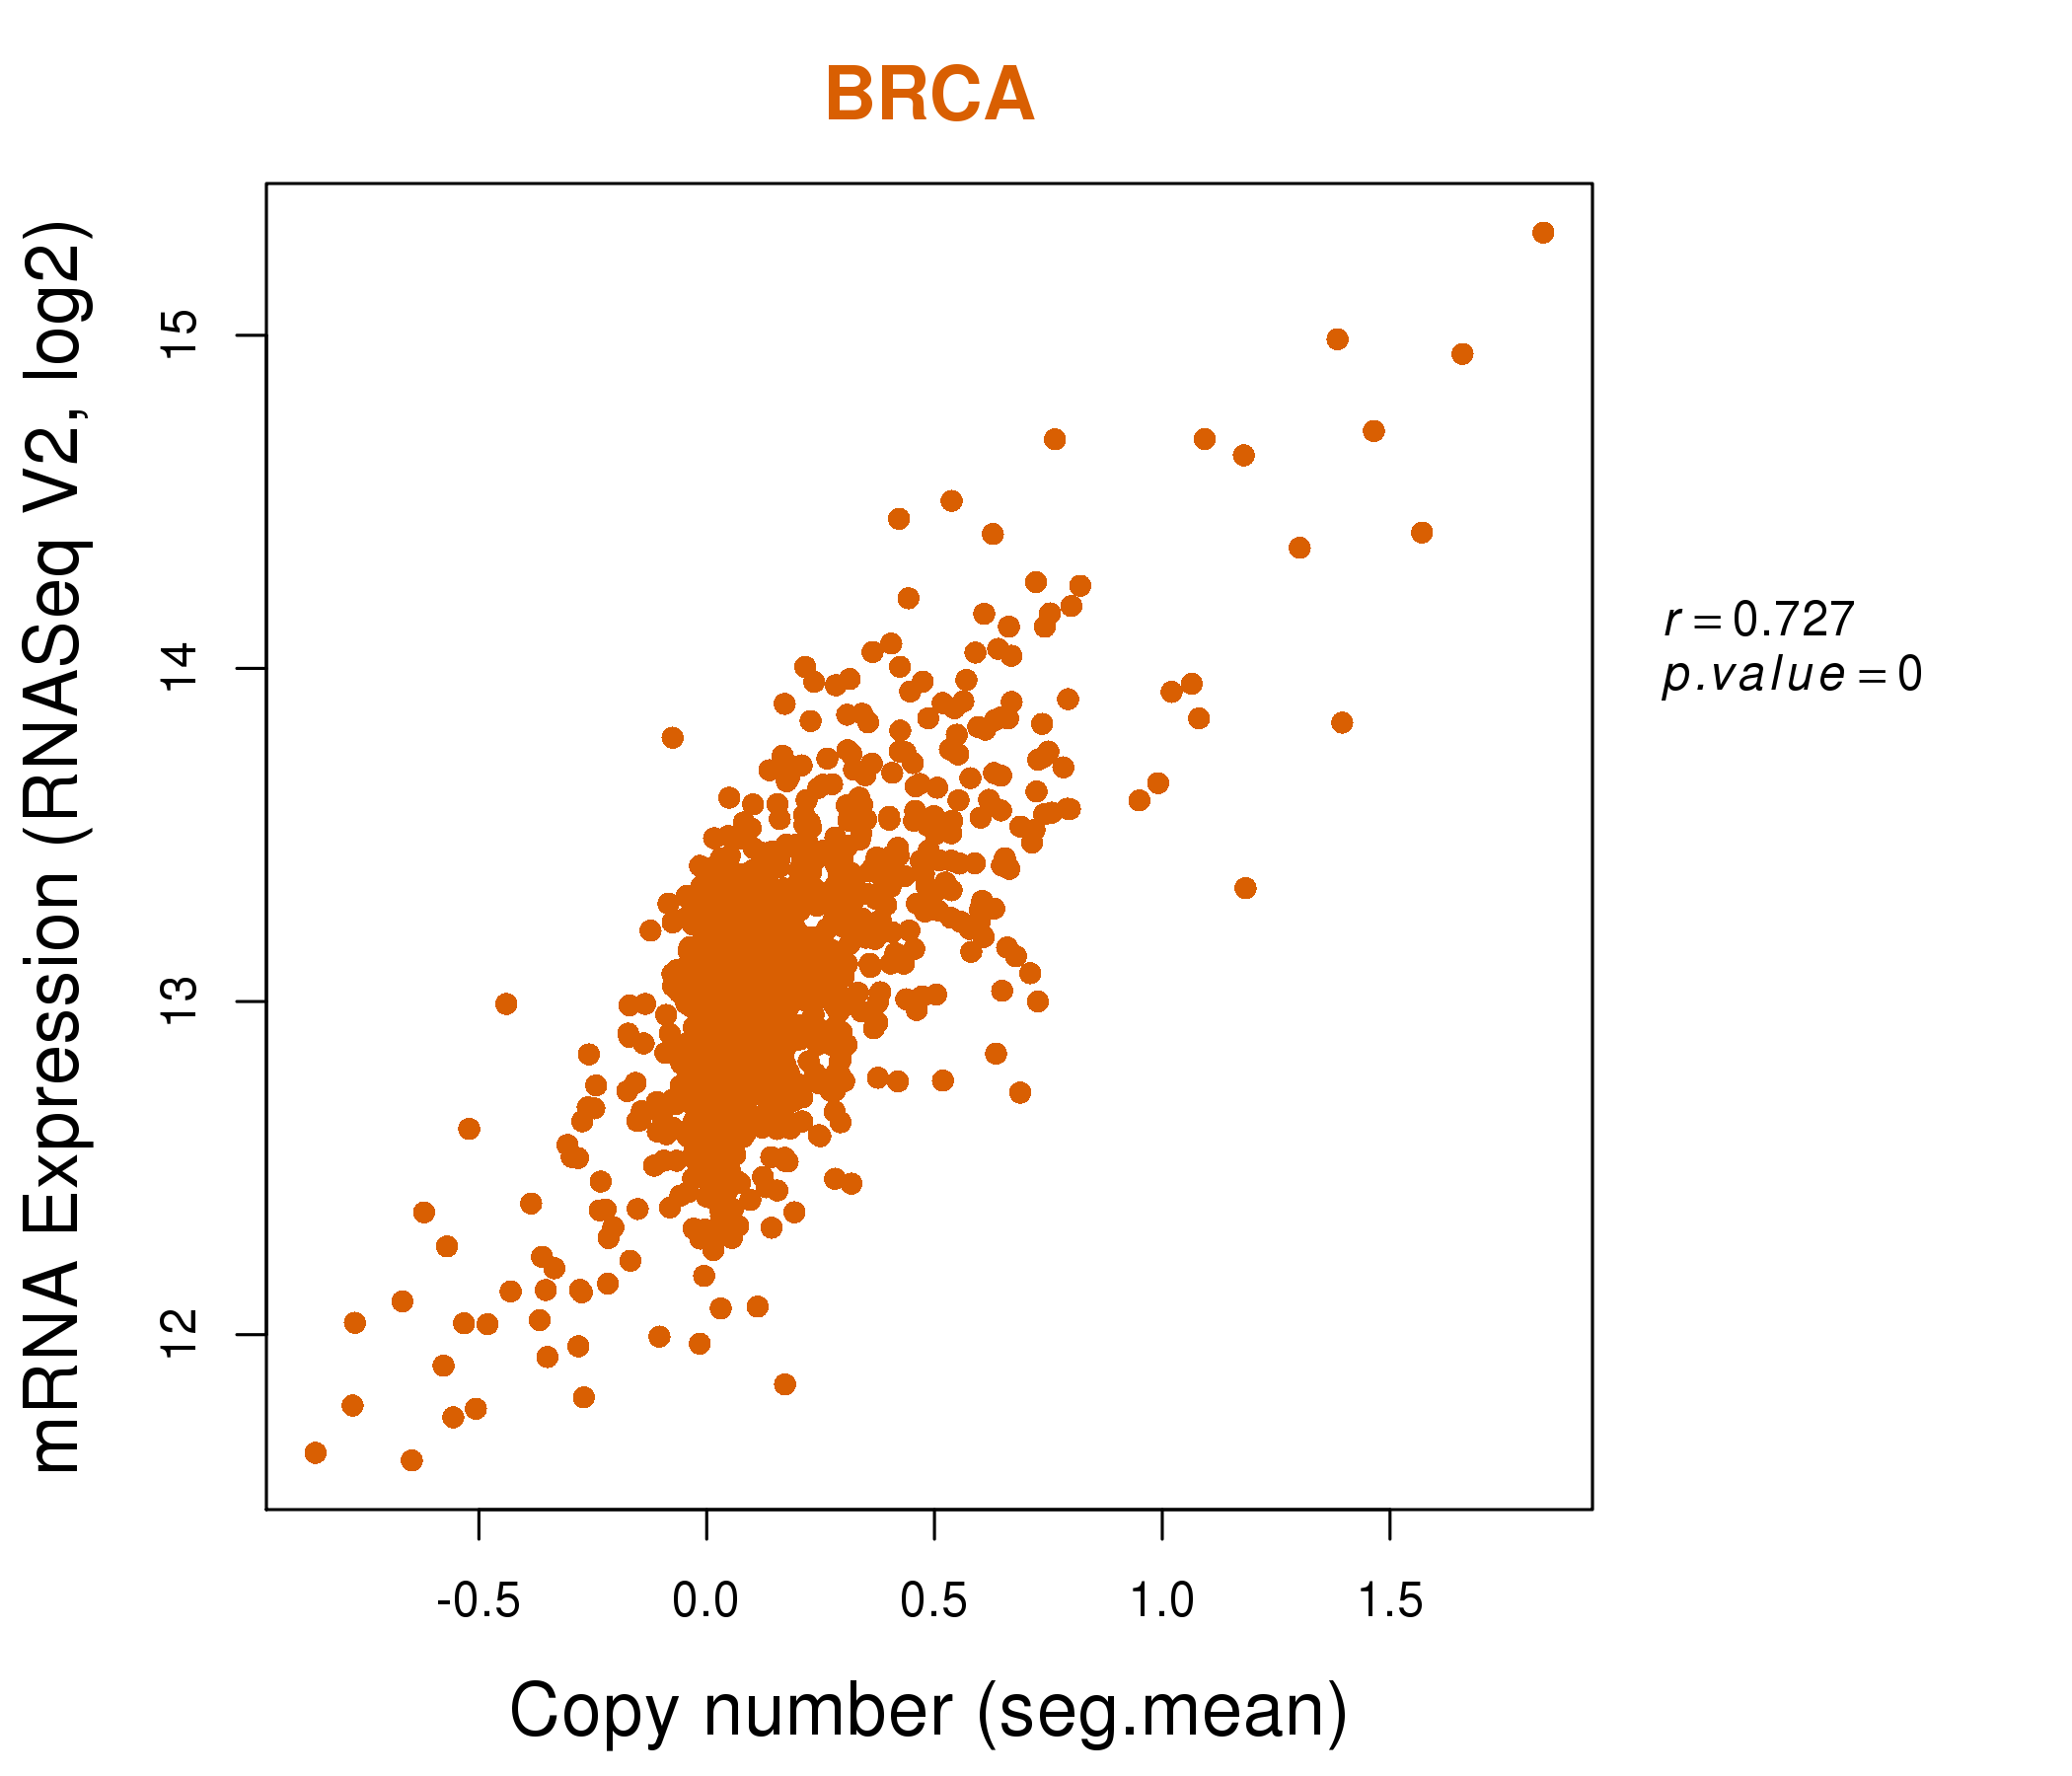
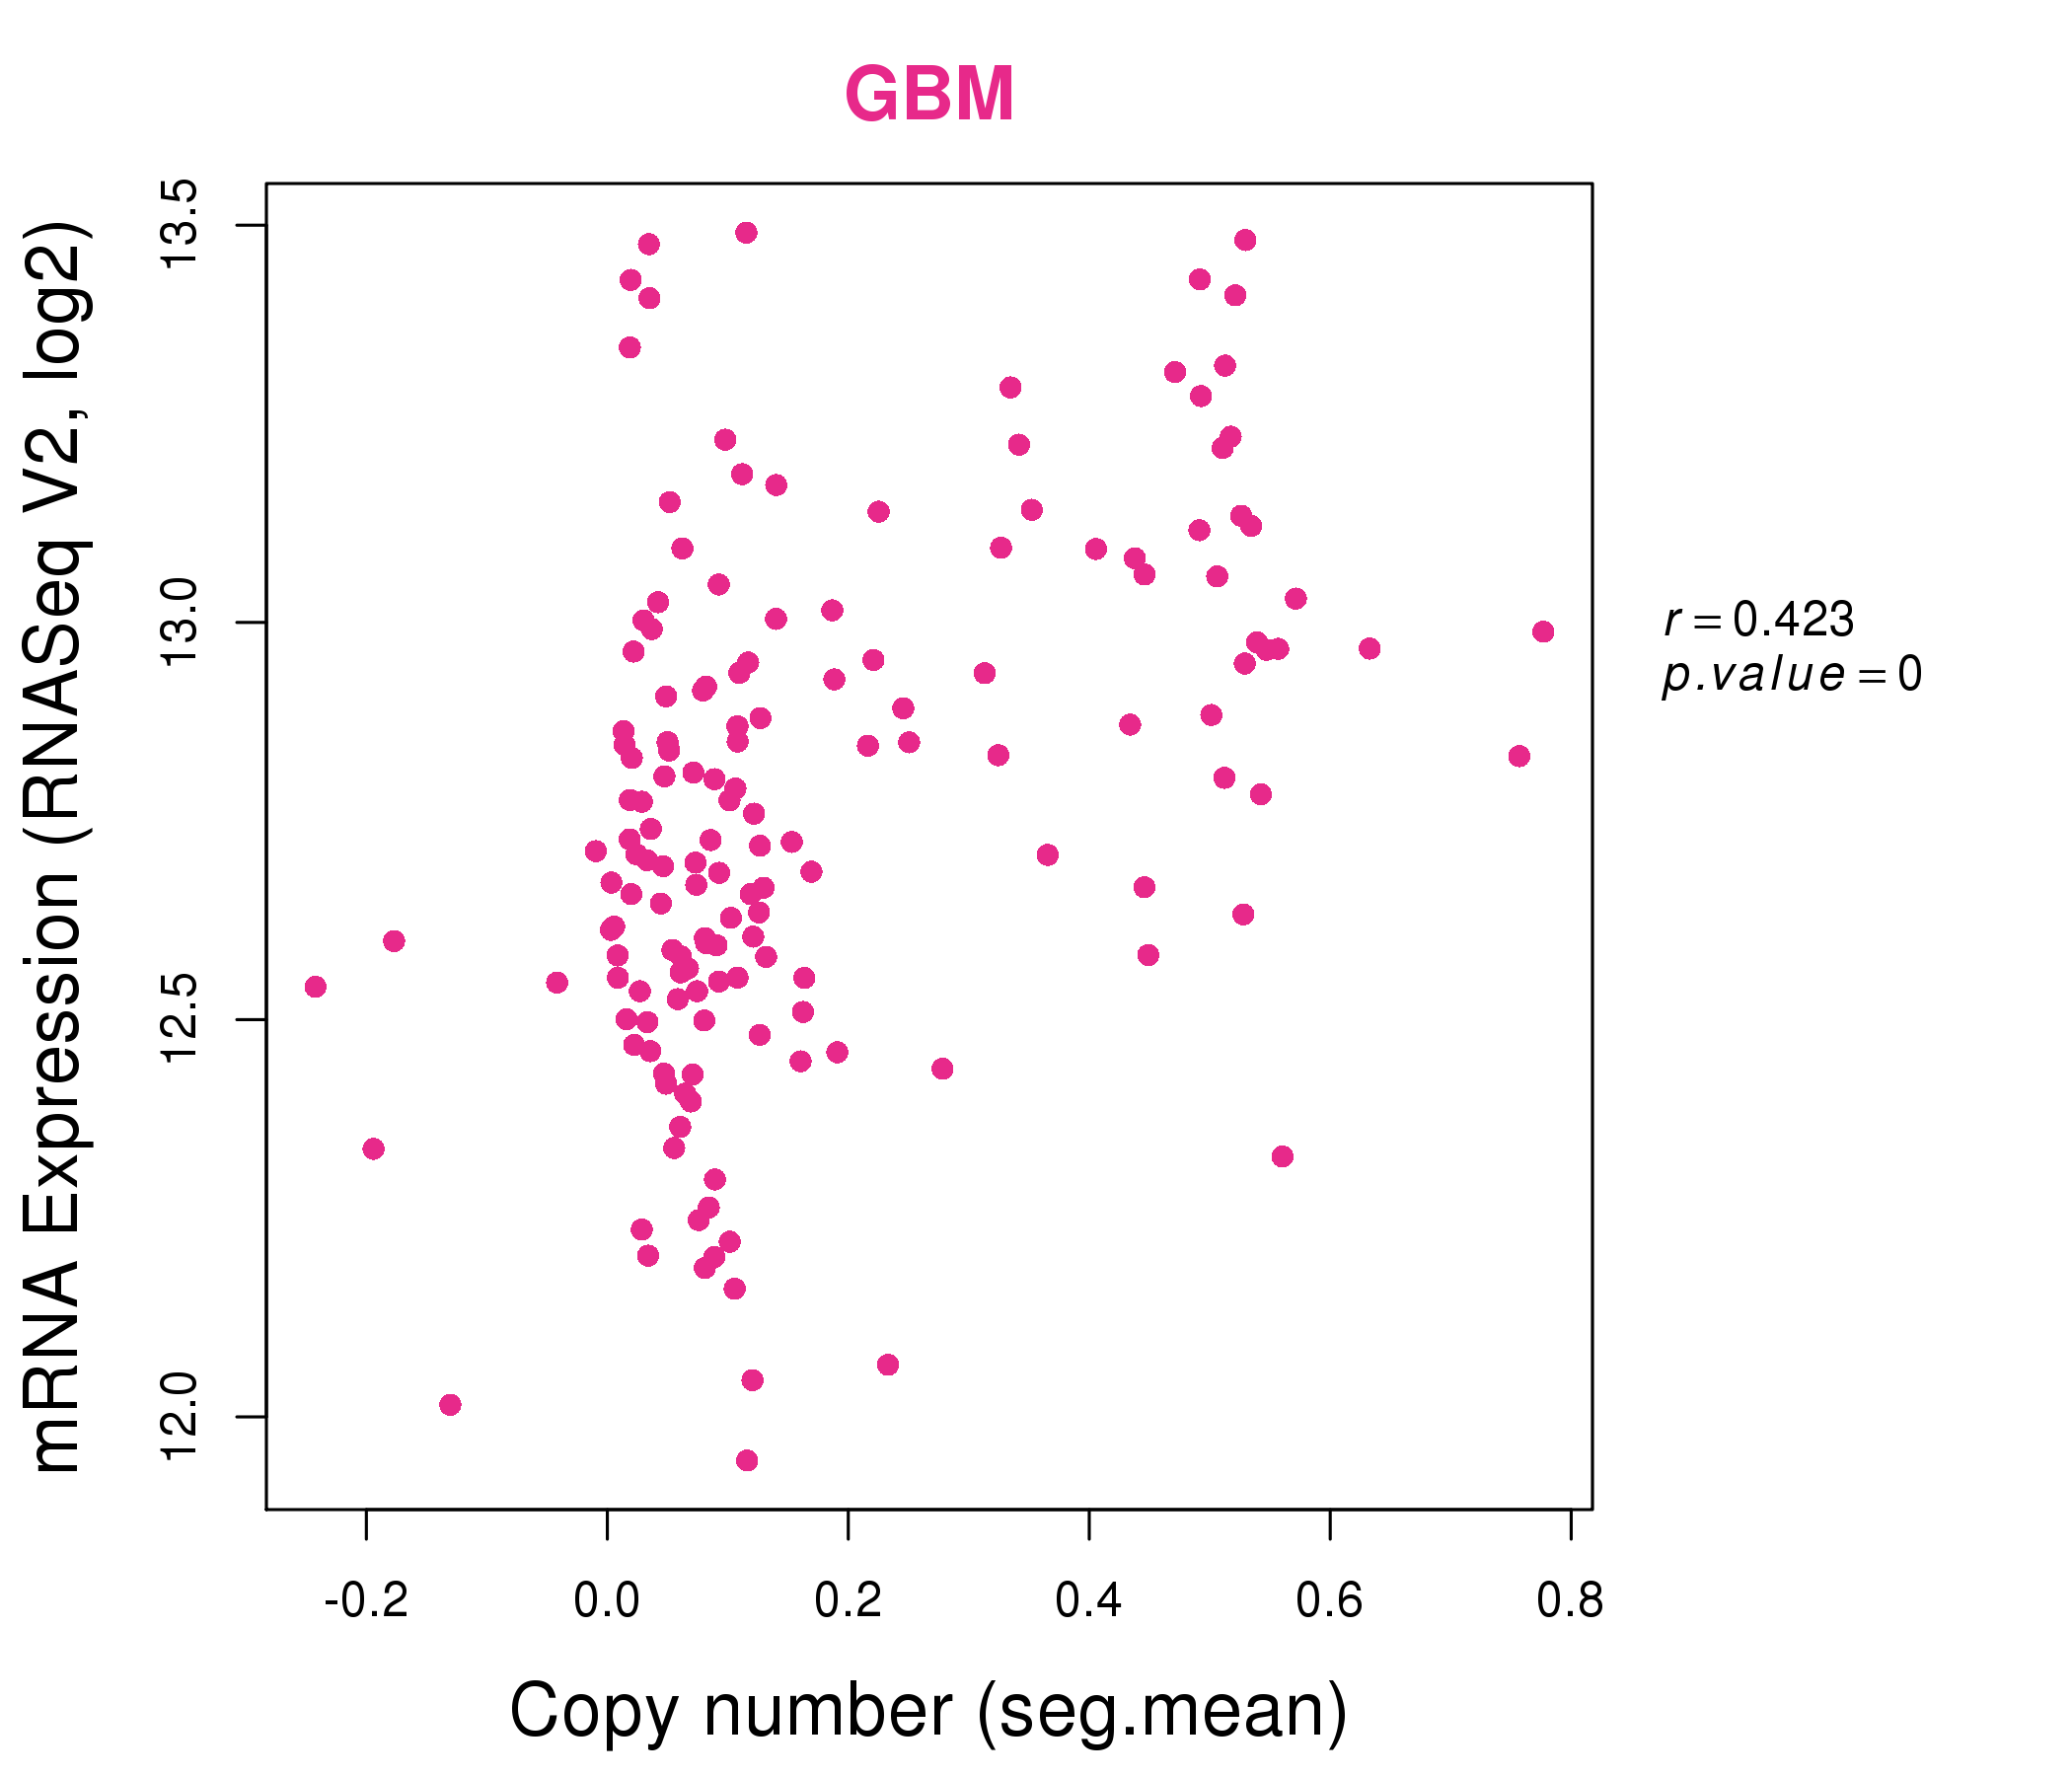
| * This plots show the correlation between CNV and gene expression. |
: Open all plots for all cancer types
 |
|
 |
|
| Top |
| Gene-Gene Network Information |
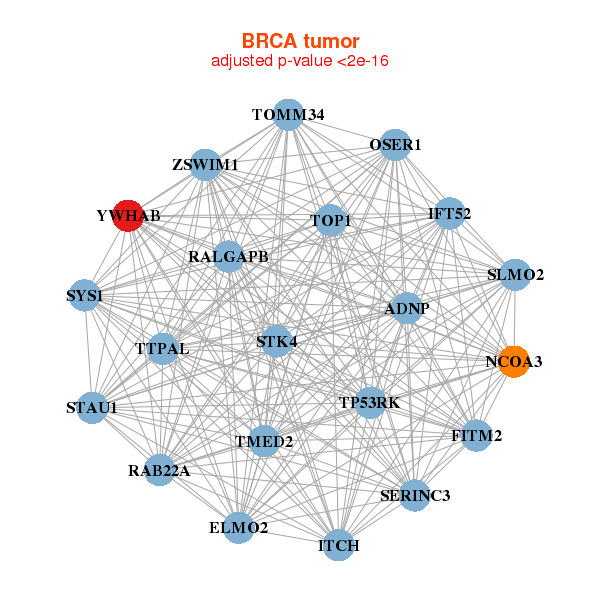
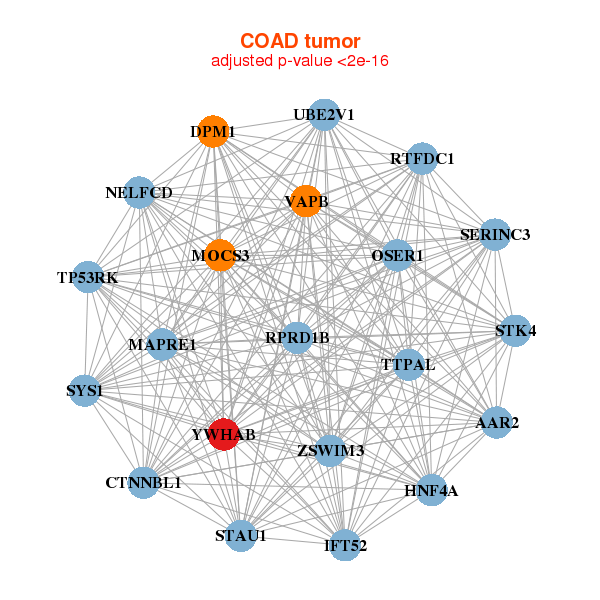
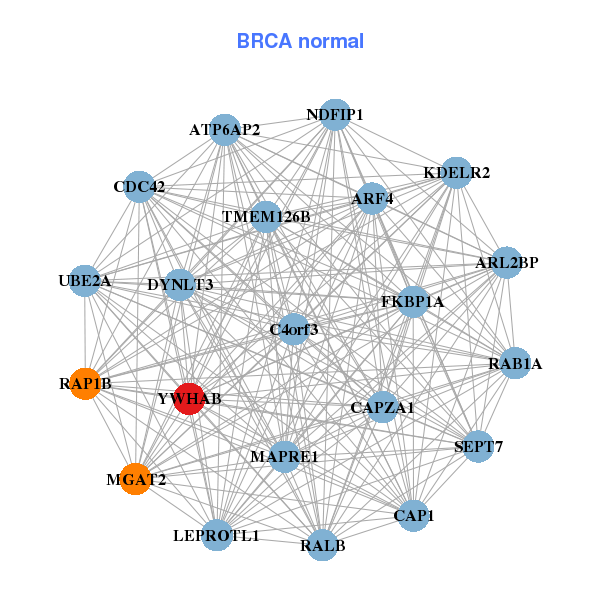
| * Co-Expression network figures were drawn using R package igraph. Only the top 20 genes with the highest correlations were shown. Red circle: input gene, orange circle: cell metabolism gene, sky circle: other gene |
: Open all plots for all cancer types
 |
|
| ADNP,OSER1,ELMO2,FITM2,IFT52,ITCH,NCOA3, RAB22A,RALGAPB,SERINC3,SLMO2,STAU1,STK4,SYS1, TMED2,TOMM34,TOP1,TP53RK,TTPAL,YWHAB,ZSWIM1 | ARF4,ARL2BP,ATP6AP2,C4orf3,CAP1,CAPZA1,CDC42, DYNLT3,FKBP1A,KDELR2,LEPROTL1,MAPRE1,MGAT2,NDFIP1, RAB1A,RALB,RAP1B,SEPT7,TMEM126B,UBE2A,YWHAB |
 |
|
| OSER1,AAR2,RTFDC1,CTNNBL1,DPM1,HNF4A,IFT52, MAPRE1,MOCS3,RPRD1B,SERINC3,STAU1,STK4,SYS1, NELFCD,TP53RK,TTPAL,UBE2V1,VAPB,YWHAB,ZSWIM3 | ACTR2,ALAS1,CAB39,CCDC68,CEACAM1,DLG3,DSC2, ABHD17C,GCNT3,GPD2,KIF16B,KRT20,NIPA2,NT5C2, PPP2R1B,RAB14,RAC1,RALA,STX3,VDAC1,YWHAB |
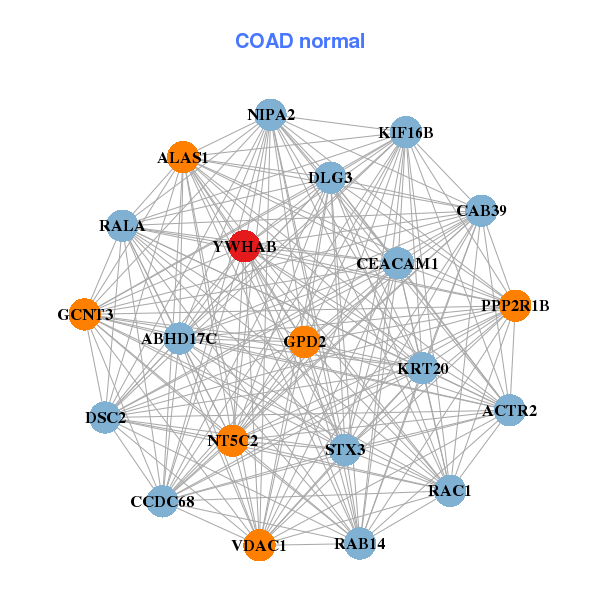
| * Co-Expression network figures were drawn using R package igraph. Only the top 20 genes with the highest correlations were shown. Red circle: input gene, orange circle: cell metabolism gene, sky circle: other gene |
: Open all plots for all cancer types
| Top |
: Open all interacting genes' information including KEGG pathway for all interacting genes from DAVID
| Top |
| Pharmacological Information for YWHAB |
| There's no related Drug. |
| Top |
| Cross referenced IDs for YWHAB |
| * We obtained these cross-references from Uniprot database. It covers 150 different DBs, 18 categories. http://www.uniprot.org/help/cross_references_section |
: Open all cross reference information
|
Copyright © 2016-Present - The Univsersity of Texas Health Science Center at Houston @ |