|
||||||||||||||||||||
| |
| Phenotypic Information (metabolism pathway, cancer, disease, phenome) |
| |
| |
| Gene-Gene Network Information: Co-Expression Network, Interacting Genes & KEGG |
| |
|


| Gene Summary for ZFP36 |
| Basic gene info. | Gene symbol | ZFP36 |
| Gene name | ZFP36 ring finger protein | |
| Synonyms | G0S24|GOS24|NUP475|RNF162A|TIS11|TTP|zfp-36 | |
| Cytomap | UCSC genome browser: 19q13.1 | |
| Genomic location | chr19 :39897486-39900045 | |
| Type of gene | protein-coding | |
| RefGenes | NM_003407.3, | |
| Ensembl id | ENSG00000128016 | |
| Description | G0/G1 switch regulatory protein 24growth factor-inducible nuclear protein NUP475tristetraprolintristetraprolinezinc finger protein 36 homologzinc finger protein 36, C3H type, homologzinc finger protein, C3H type, 36 homolog | |
| Modification date | 20141207 | |
| dbXrefs | MIM : 190700 | |
| HGNC : HGNC | ||
| Ensembl : ENSG00000128016 | ||
| HPRD : 01835 | ||
| Vega : OTTHUMG00000182970 | ||
| Protein | UniProt: P26651 go to UniProt's Cross Reference DB Table | |
| Expression | CleanEX: HS_ZFP36 | |
| BioGPS: 7538 | ||
| Gene Expression Atlas: ENSG00000128016 | ||
| The Human Protein Atlas: ENSG00000128016 | ||
| Pathway | NCI Pathway Interaction Database: ZFP36 | |
| KEGG: ZFP36 | ||
| REACTOME: ZFP36 | ||
| ConsensusPathDB | ||
| Pathway Commons: ZFP36 | ||
| Metabolism | MetaCyc: ZFP36 | |
| HUMANCyc: ZFP36 | ||
| Regulation | Ensembl's Regulation: ENSG00000128016 | |
| miRBase: chr19 :39,897,486-39,900,045 | ||
| TargetScan: NM_003407 | ||
| cisRED: ENSG00000128016 | ||
| Context | iHOP: ZFP36 | |
| cancer metabolism search in PubMed: ZFP36 | ||
| UCL Cancer Institute: ZFP36 | ||
| Assigned class in ccmGDB | B - This gene belongs to cancer gene. | |
| Top |
| Phenotypic Information for ZFP36(metabolism pathway, cancer, disease, phenome) |
| Cancer | CGAP: ZFP36 |
| Familial Cancer Database: ZFP36 | |
| * This gene is included in those cancer gene databases. |
|
|
|
|
|
| . | ||||||||||||||
Oncogene 1 | Significant driver gene in | |||||||||||||||||||
| cf) number; DB name 1 Oncogene; http://nar.oxfordjournals.org/content/35/suppl_1/D721.long, 2 Tumor Suppressor gene; https://bioinfo.uth.edu/TSGene/, 3 Cancer Gene Census; http://www.nature.com/nrc/journal/v4/n3/abs/nrc1299.html, 4 CancerGenes; http://nar.oxfordjournals.org/content/35/suppl_1/D721.long, 5 Network of Cancer Gene; http://ncg.kcl.ac.uk/index.php, 1Therapeutic Vulnerabilities in Cancer; http://cbio.mskcc.org/cancergenomics/statius/ |
| REACTOME_METABOLISM_OF_MRNA REACTOME_METABOLISM_OF_RNA | |
| OMIM | 190700; gene. |
| Orphanet | |
| Disease | KEGG Disease: ZFP36 |
| MedGen: ZFP36 (Human Medical Genetics with Condition) | |
| ClinVar: ZFP36 | |
| Phenotype | MGI: ZFP36 (International Mouse Phenotyping Consortium) |
| PhenomicDB: ZFP36 | |
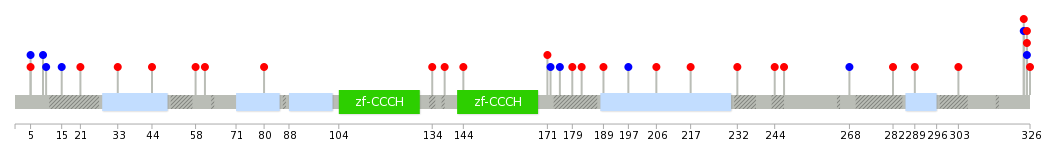
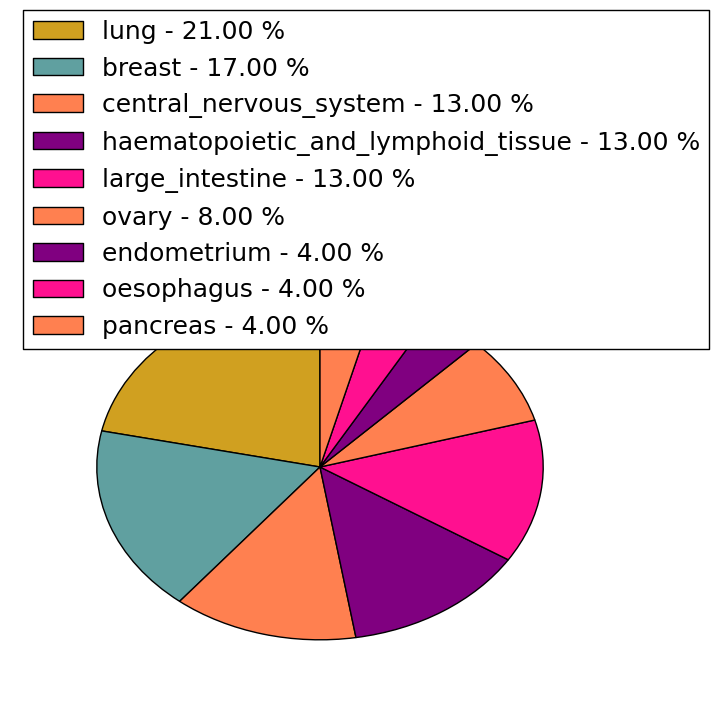
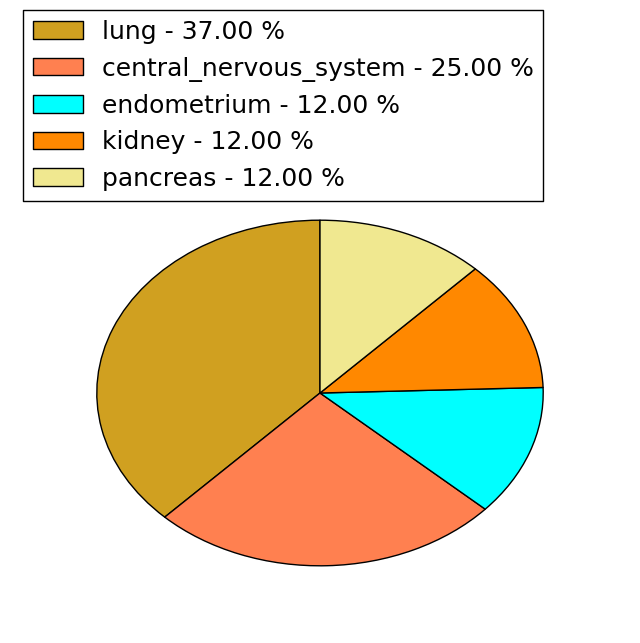
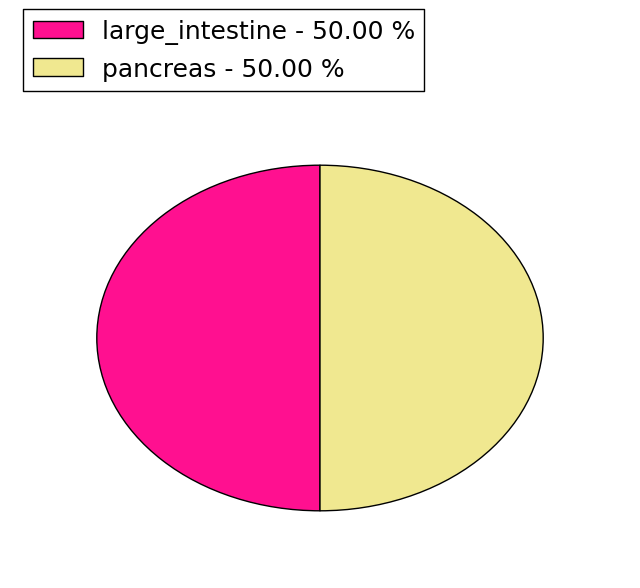
| Mutations for ZFP36 |
| * Under tables are showing count per each tissue to give us broad intuition about tissue specific mutation patterns.You can go to the detailed page for each mutation database's web site. |
| - Statistics for Tissue and Mutation type | Top |
 |
| - For Inter-chromosomal Variations |
| There's no inter-chromosomal structural variation. |
| - For Intra-chromosomal Variations |
| * Intra-chromosomal variantions includes 'intrachromosomal amplicon to amplicon', 'intrachromosomal amplicon to non-amplified dna', 'intrachromosomal deletion', 'intrachromosomal fold-back inversion', 'intrachromosomal inversion', 'intrachromosomal tandem duplication', 'Intrachromosomal unknown type', 'intrachromosomal with inverted orientation', 'intrachromosomal with non-inverted orientation'. |
 |
| Sample | Symbol_a | Chr_a | Start_a | End_a | Symbol_b | Chr_b | Start_b | End_b |
| ovary | ZFP36 | chr19 | 39898319 | 39898339 | ZFP36 | chr19 | 39898378 | 39898398 |
| pancreas | ZFP36 | chr19 | 39899401 | 39899421 | chr19 | 39901891 | 39901911 |
| cf) Tissue number; Tissue name (1;Breast, 2;Central_nervous_system, 3;Haematopoietic_and_lymphoid_tissue, 4;Large_intestine, 5;Liver, 6;Lung, 7;Ovary, 8;Pancreas, 9;Prostate, 10;Skin, 11;Soft_tissue, 12;Upper_aerodigestive_tract) |
| * From mRNA Sanger sequences, Chitars2.0 arranged chimeric transcripts. This table shows ZFP36 related fusion information. |
| ID | Head Gene | Tail Gene | Accession | Gene_a | qStart_a | qEnd_a | Chromosome_a | tStart_a | tEnd_a | Gene_a | qStart_a | qEnd_a | Chromosome_a | tStart_a | tEnd_a |
| AI927524 | FUT5 | 1 | 116 | 19 | 5894691 | 5894806 | ZFP36 | 113 | 357 | 19 | 39898797 | 39899042 | |
| BF930057 | ZFP36 | 24 | 332 | 19 | 39899509 | 39899819 | YY1AP1 | 329 | 549 | 1 | 155629534 | 155629754 | |
| AM287184 | MYC | 1 | 1432 | 8 | 128749879 | 128751310 | ZFP36 | 1431 | 1646 | 19 | 39898260 | 39898475 | |
| BF853292 | ATP1A1 | 1 | 102 | 1 | 116943296 | 116943397 | ZFP36 | 99 | 202 | 19 | 39898812 | 39898915 | |
| BF511918 | PAK4 | 18 | 68 | 19 | 39669996 | 39670046 | ZFP36 | 62 | 197 | 19 | 39898643 | 39898778 | |
| BF094229 | SLC12A8 | 23 | 184 | 3 | 124990872 | 124991033 | ZFP36 | 175 | 356 | 19 | 39899528 | 39899709 | |
| BM990034 | PSMB7 | 18 | 224 | 9 | 127115749 | 127115955 | ZFP36 | 222 | 621 | 19 | 39899603 | 39900002 | |
| Top |
| There's no copy number variation information in COSMIC data for this gene. |
| Top |
|
 |
| Top |
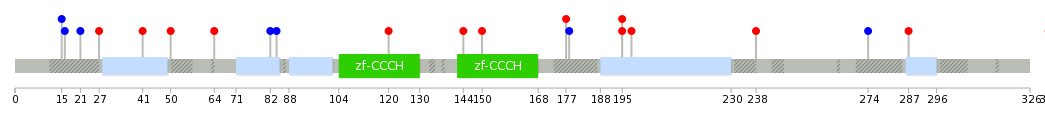
| Stat. for Non-Synonymous SNVs (# total SNVs=23) | (# total SNVs=8) |
 |  |
(# total SNVs=2) | (# total SNVs=0) |
 |
| Top |
| * When you move the cursor on each content, you can see more deailed mutation information on the Tooltip. Those are primary_site,primary_histology,mutation(aa),pubmedID. |
| GRCh37 position | Mutation(aa) | Unique sampleID count |
| chr19:39898924-39898924 | p.G189D | 1 |
| chr19:39897559-39897559 | p.A5A | 1 |
| chr19:39899266-39899266 | p.V303G | 1 |
| chr19:39898547-39898547 | p.G64fs*>263 | 1 |
| chr19:39898949-39898949 | p.S197S | 1 |
| chr19:39898382-39898382 | p.? | 1 |
| chr19:39899329-39899329 | p.V324D | 1 |
| chr19:39898596-39898596 | p.A80S | 1 |
| chr19:39898975-39898975 | p.P206L | 1 |
| chr19:39898385-39898385 | p.S9S | 1 |
| Top |
|
 |
| Point Mutation/ Tissue ID | 1 | 2 | 3 | 4 | 5 | 6 | 7 | 8 | 9 | 10 | 11 | 12 | 13 | 14 | 15 | 16 | 17 | 18 | 19 | 20 |
| # sample | 1 | 1 | 1 | 4 | 1 | 5 | 1 | 1 | 1 | 1 | 1 | 1 | 1 | |||||||
| # mutation | 1 | 1 | 1 | 4 | 1 | 5 | 1 | 1 | 1 | 1 | 1 | 1 | 2 | |||||||
| nonsynonymous SNV | 1 | 1 | 1 | 3 | 3 | 1 | 1 | 1 | 1 | 1 | ||||||||||
| synonymous SNV | 1 | 1 | 2 | 1 | 1 | 1 |
| cf) Tissue ID; Tissue type (1; BLCA[Bladder Urothelial Carcinoma], 2; BRCA[Breast invasive carcinoma], 3; CESC[Cervical squamous cell carcinoma and endocervical adenocarcinoma], 4; COAD[Colon adenocarcinoma], 5; GBM[Glioblastoma multiforme], 6; Glioma Low Grade, 7; HNSC[Head and Neck squamous cell carcinoma], 8; KICH[Kidney Chromophobe], 9; KIRC[Kidney renal clear cell carcinoma], 10; KIRP[Kidney renal papillary cell carcinoma], 11; LAML[Acute Myeloid Leukemia], 12; LUAD[Lung adenocarcinoma], 13; LUSC[Lung squamous cell carcinoma], 14; OV[Ovarian serous cystadenocarcinoma ], 15; PAAD[Pancreatic adenocarcinoma], 16; PRAD[Prostate adenocarcinoma], 17; SKCM[Skin Cutaneous Melanoma], 18:STAD[Stomach adenocarcinoma], 19:THCA[Thyroid carcinoma], 20:UCEC[Uterine Corpus Endometrial Carcinoma]) |
| Top |
| * We represented just top 10 SNVs. When you move the cursor on each content, you can see more deailed mutation information on the Tooltip. Those are primary_site, primary_histology, mutation(aa), pubmedID. |
| Genomic Position | Mutation(aa) | Unique sampleID count |
| chr19:39898388 | p.L16L | 1 |
| chr19:39898869 | p.F238L | 1 |
| chr19:39898403 | p.P21P | 1 |
| chr19:39898874 | p.L274L | 1 |
| chr19:39898420 | p.S27Y | 1 |
| chr19:39898923 | p.P287T | 1 |
| chr19:39898462 | p.S41L | 1 |
| chr19:39898924 | p.E332K | 1 |
| chr19:39898488 | p.D50Y | 1 |
| chr19:39898933 | p.S64T | 1 |
| * Copy number data were extracted from TCGA using R package TCGA-Assembler. The URLs of all public data files on TCGA DCC data server were gathered on Jan-05-2015. Function ProcessCNAData in TCGA-Assembler package was used to obtain gene-level copy number value which is calculated as the average copy number of the genomic region of a gene. |
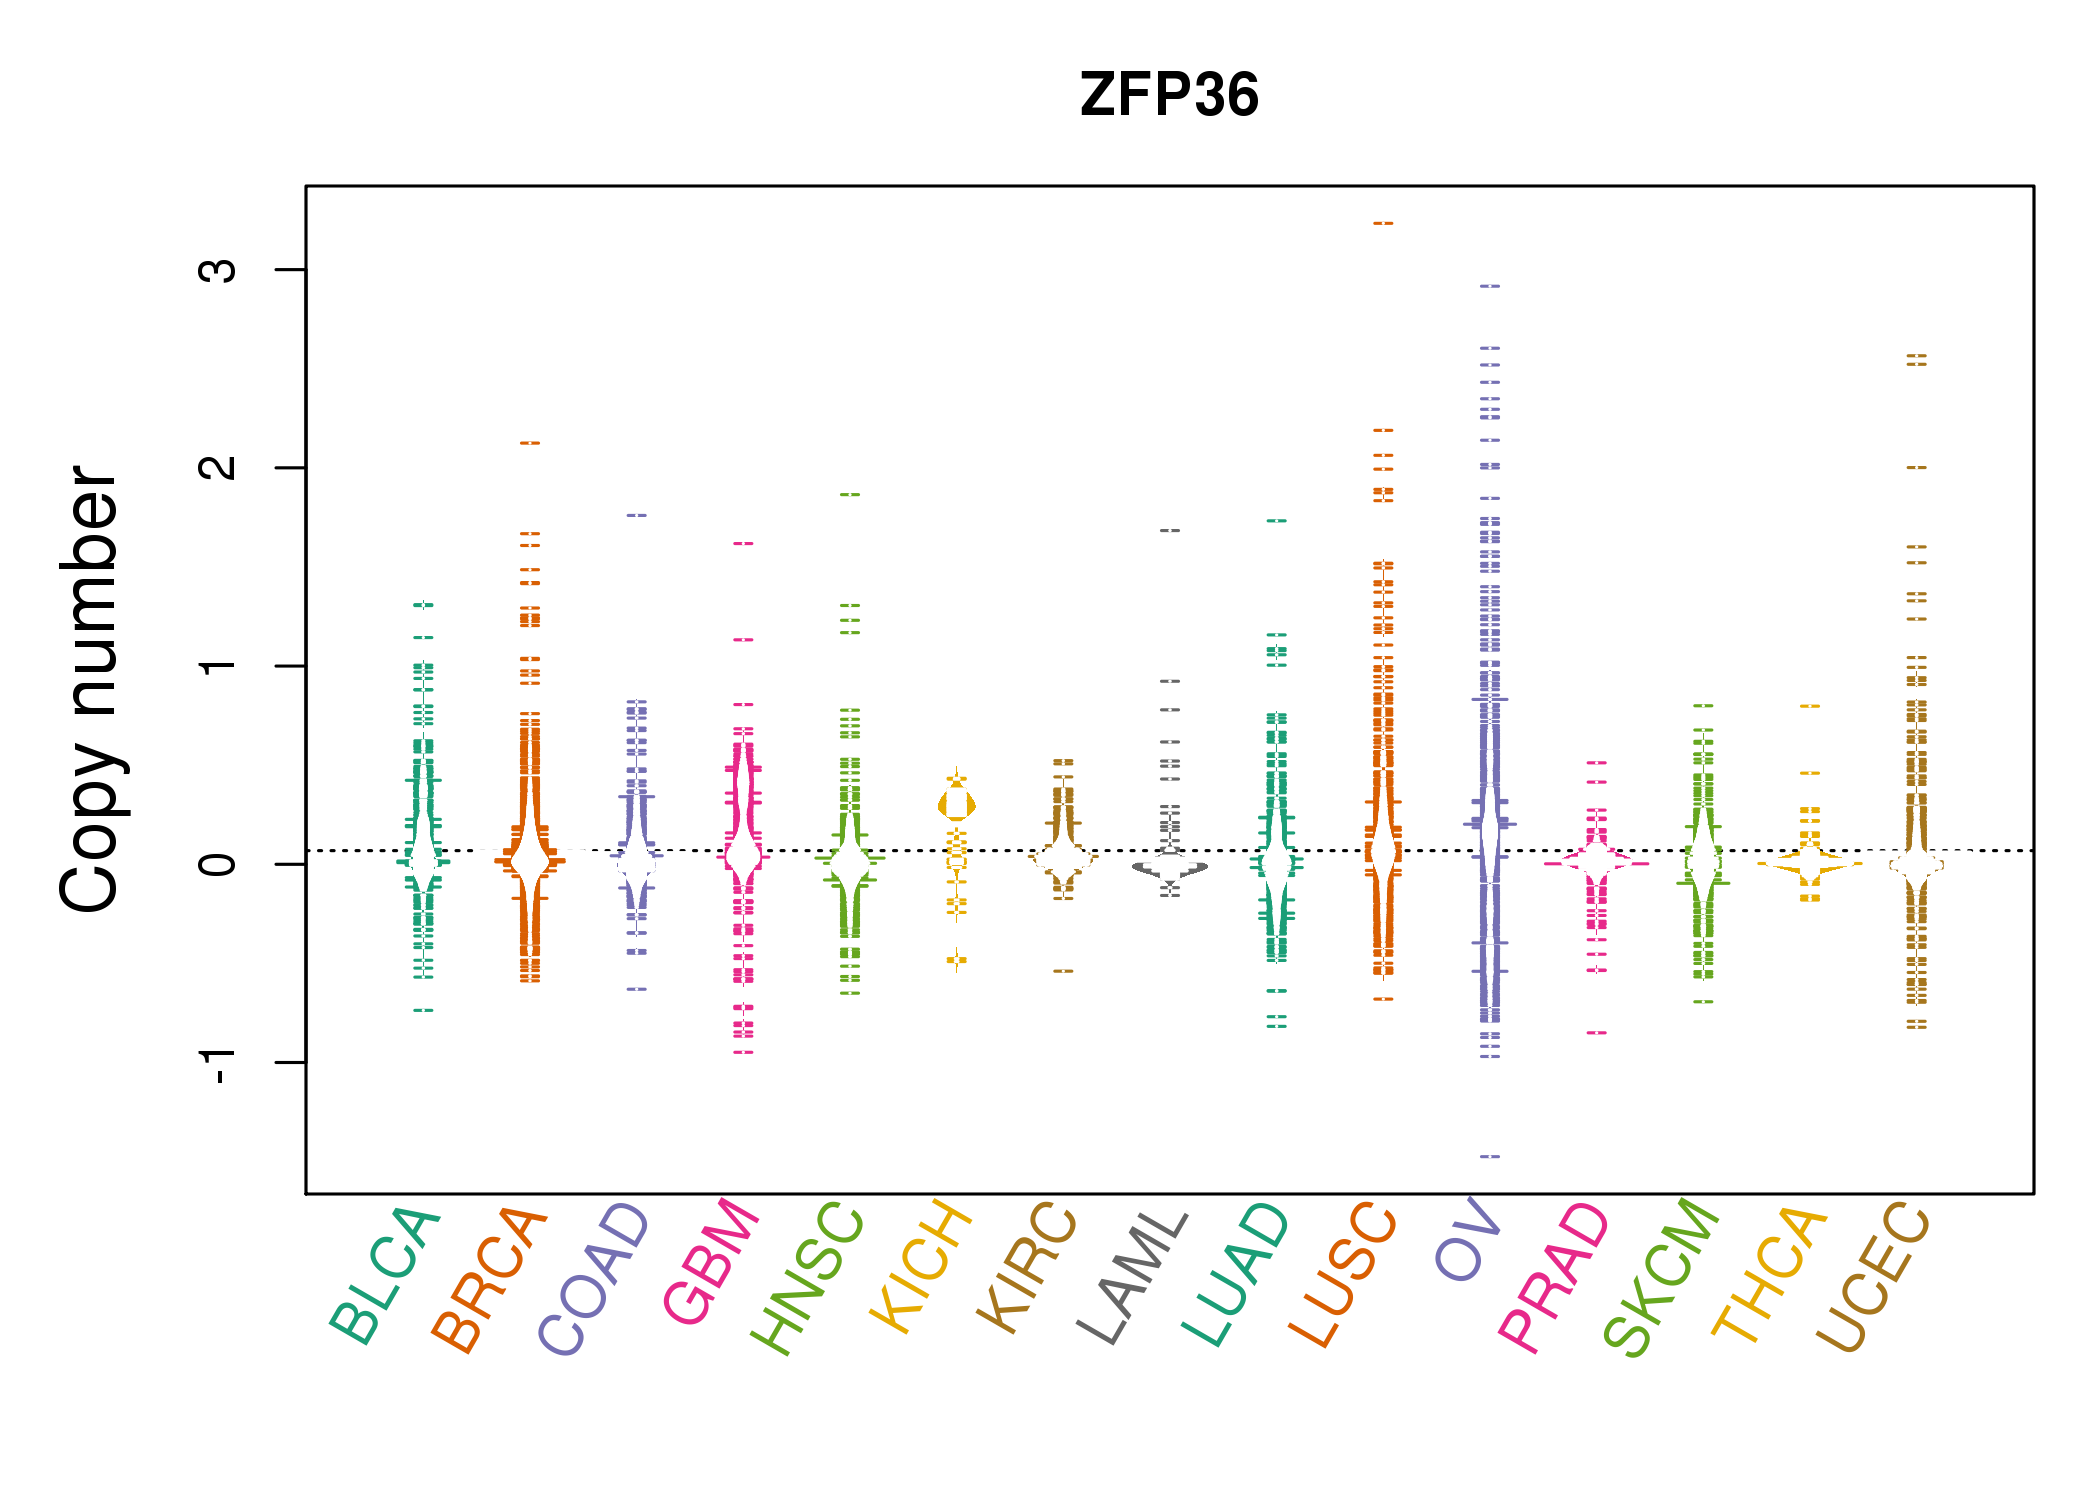 |
| cf) Tissue ID[Tissue type]: BLCA[Bladder Urothelial Carcinoma], BRCA[Breast invasive carcinoma], CESC[Cervical squamous cell carcinoma and endocervical adenocarcinoma], COAD[Colon adenocarcinoma], GBM[Glioblastoma multiforme], Glioma Low Grade, HNSC[Head and Neck squamous cell carcinoma], KICH[Kidney Chromophobe], KIRC[Kidney renal clear cell carcinoma], KIRP[Kidney renal papillary cell carcinoma], LAML[Acute Myeloid Leukemia], LUAD[Lung adenocarcinoma], LUSC[Lung squamous cell carcinoma], OV[Ovarian serous cystadenocarcinoma ], PAAD[Pancreatic adenocarcinoma], PRAD[Prostate adenocarcinoma], SKCM[Skin Cutaneous Melanoma], STAD[Stomach adenocarcinoma], THCA[Thyroid carcinoma], UCEC[Uterine Corpus Endometrial Carcinoma] |
| Top |
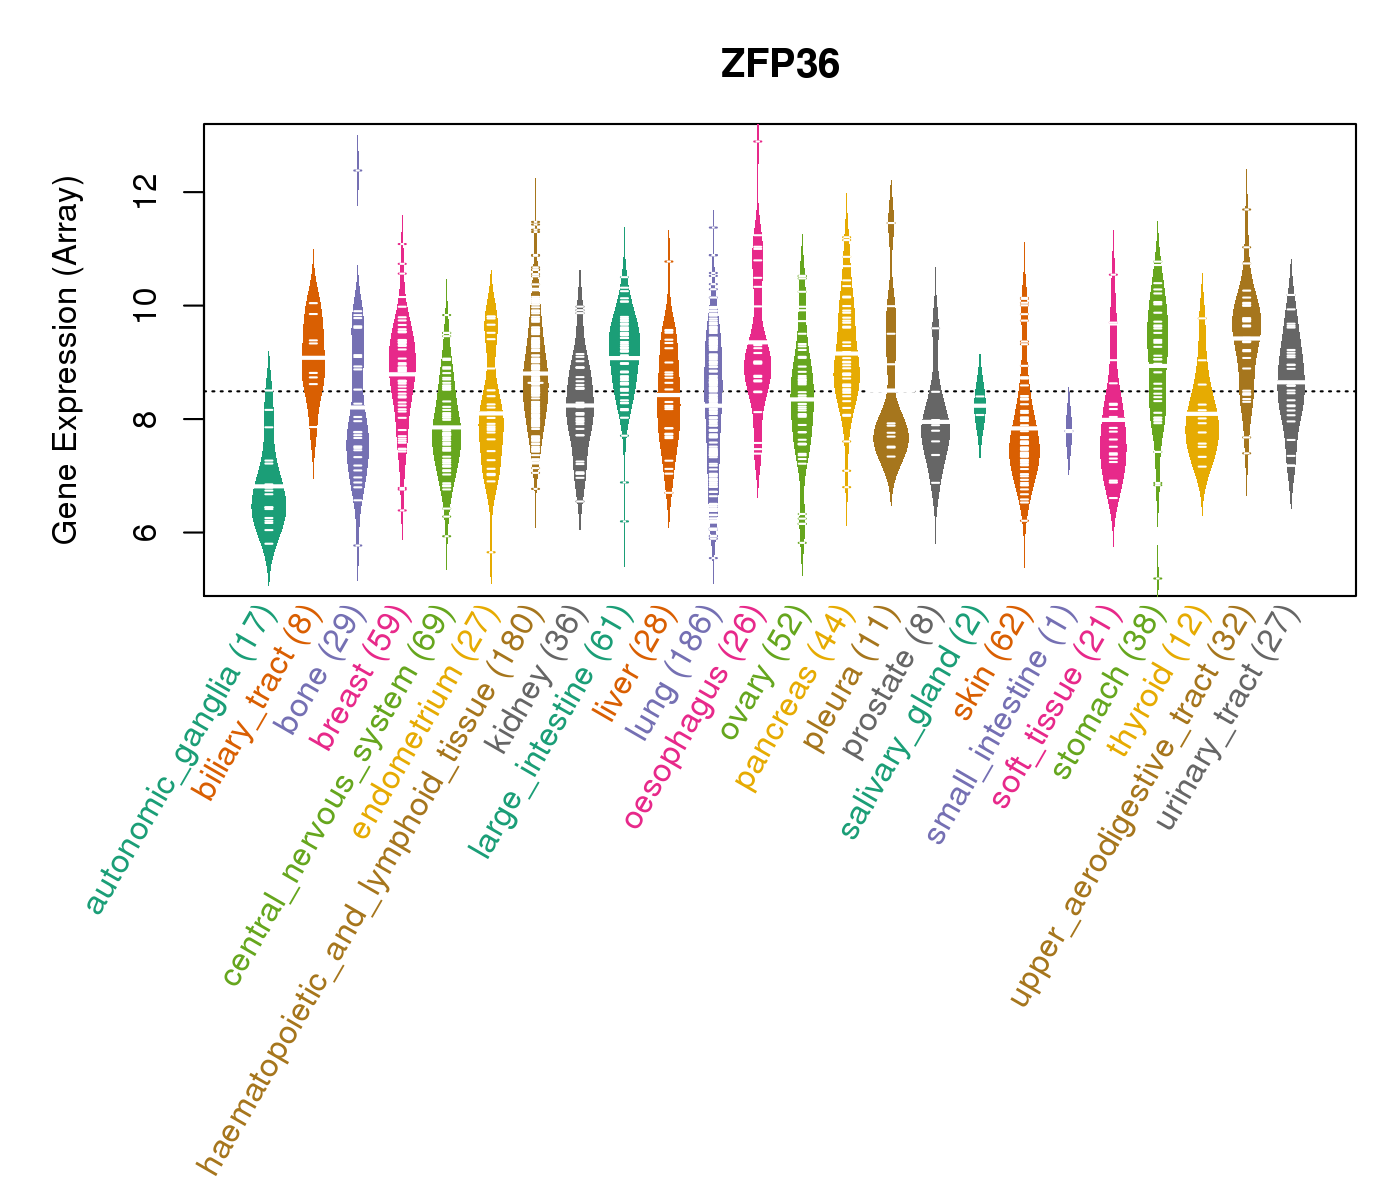
| Gene Expression for ZFP36 |
| * CCLE gene expression data were extracted from CCLE_Expression_Entrez_2012-10-18.res: Gene-centric RMA-normalized mRNA expression data. |
 |
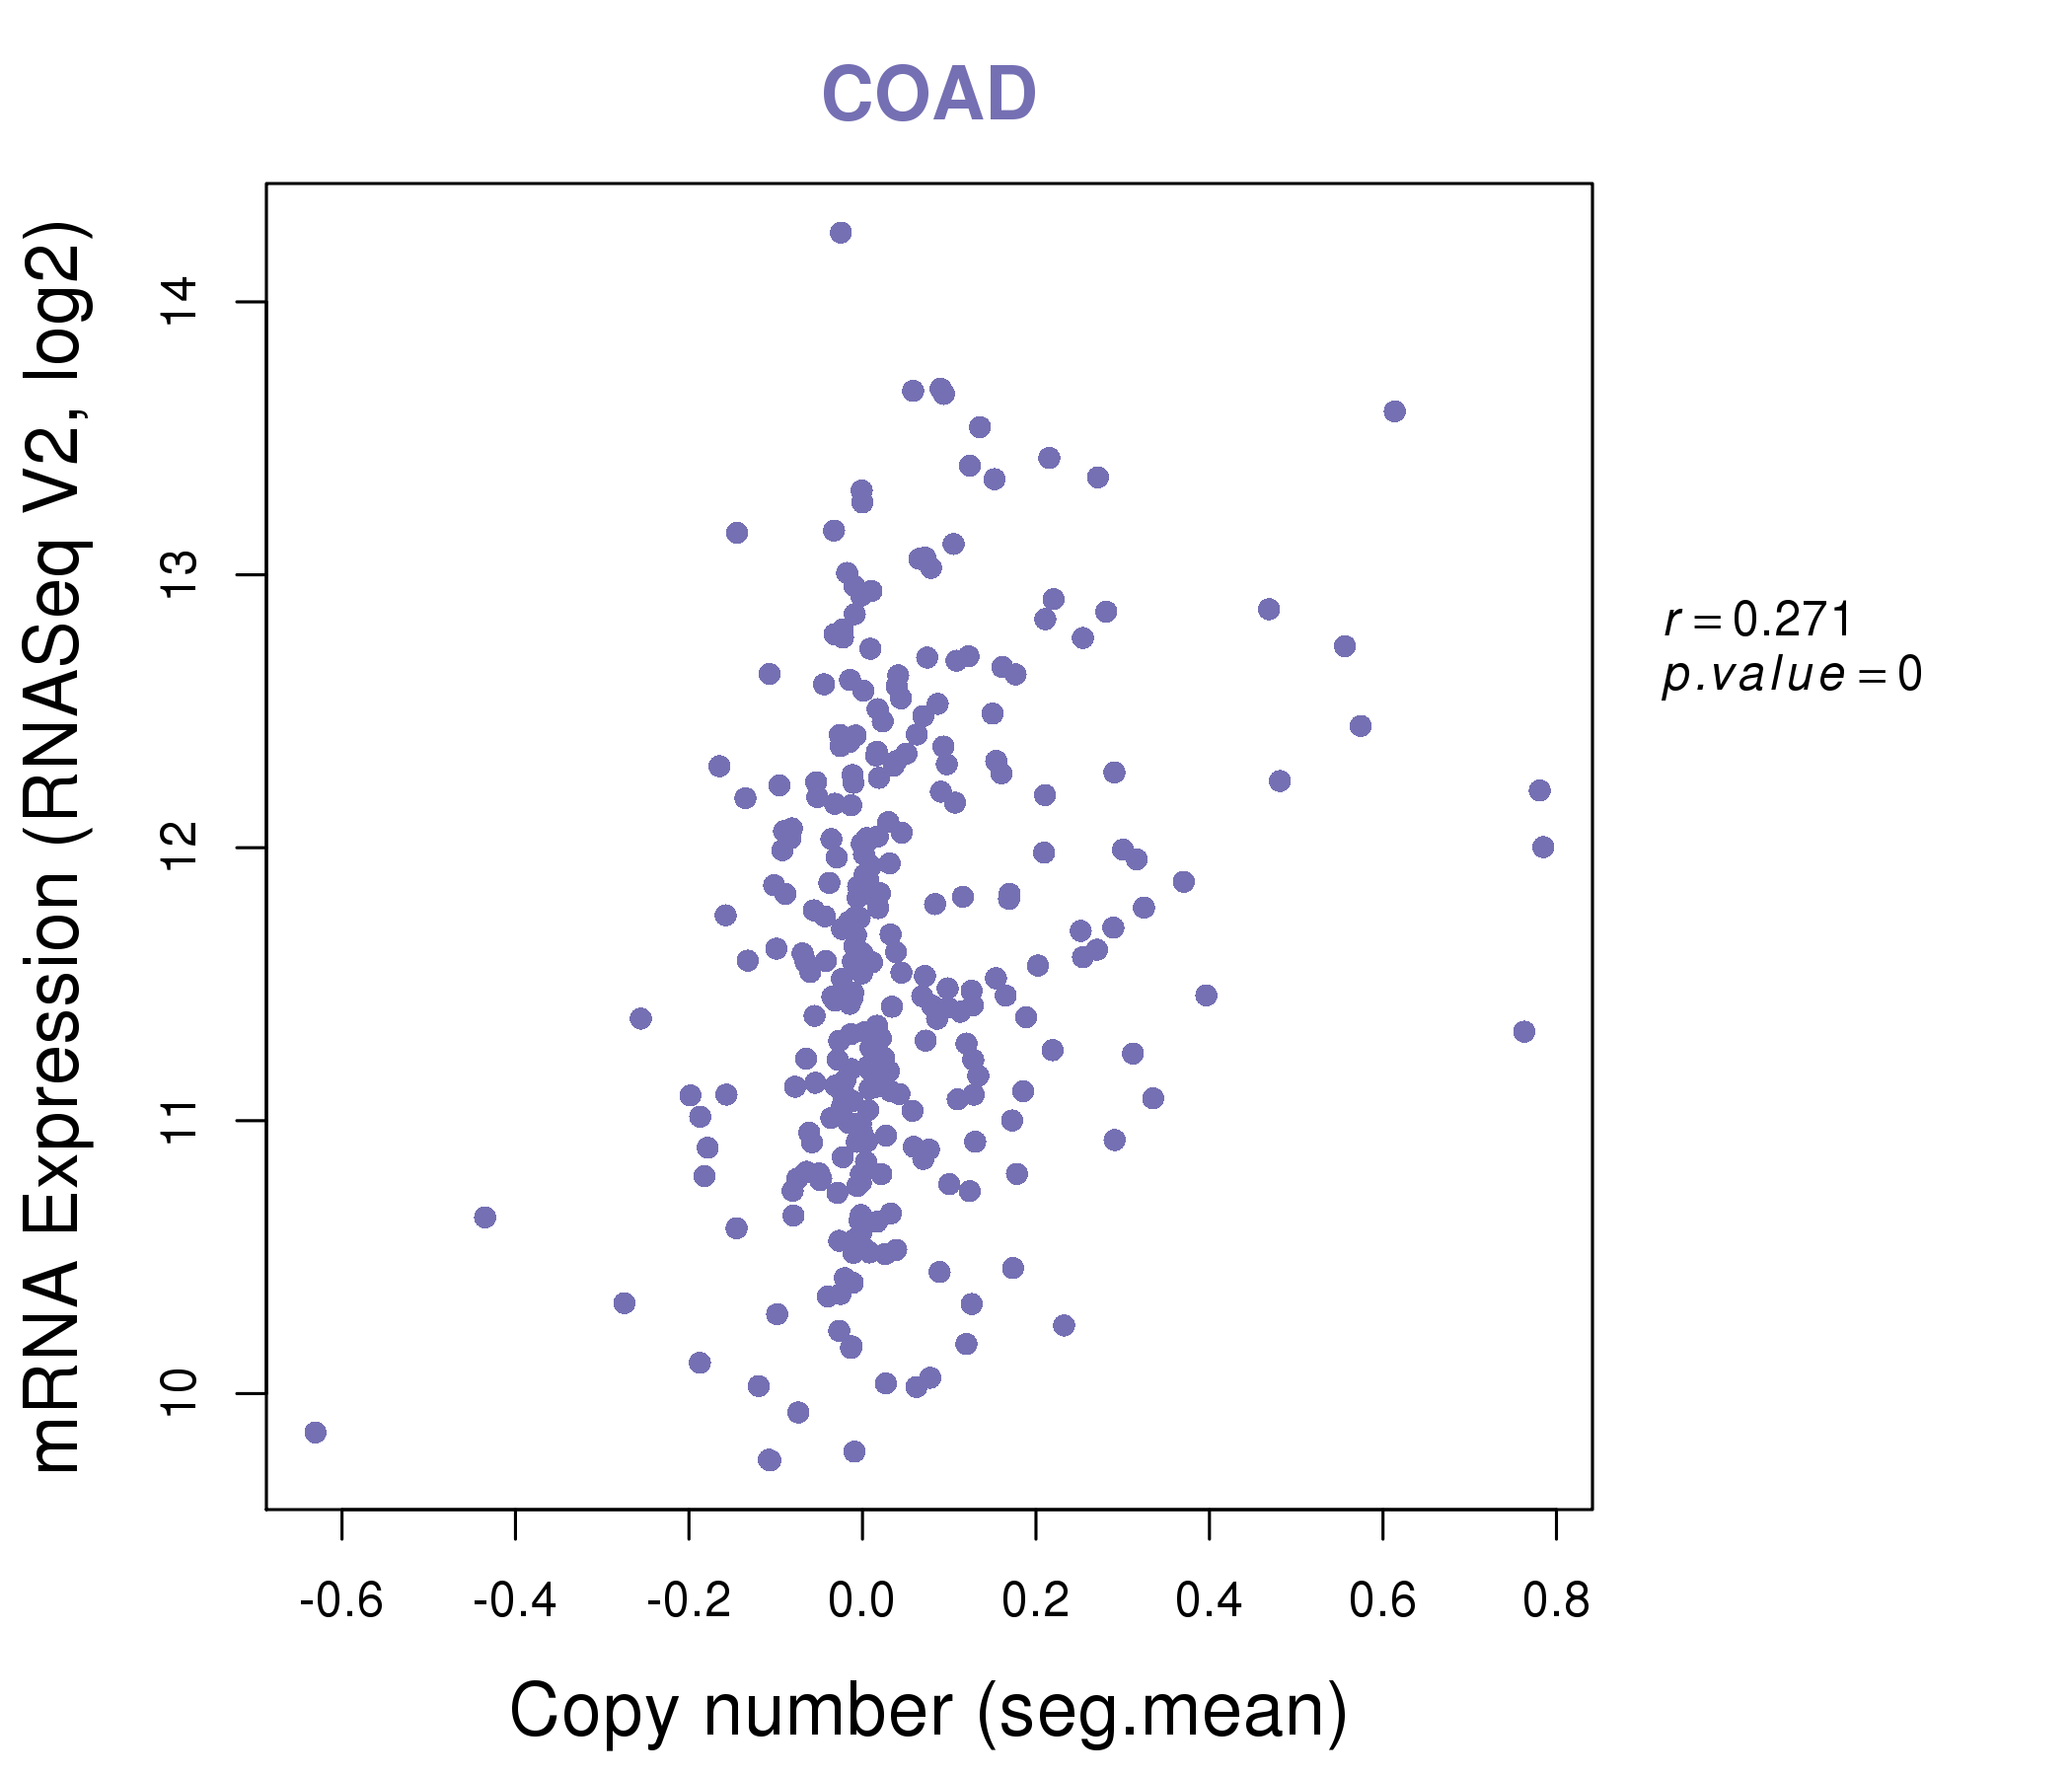
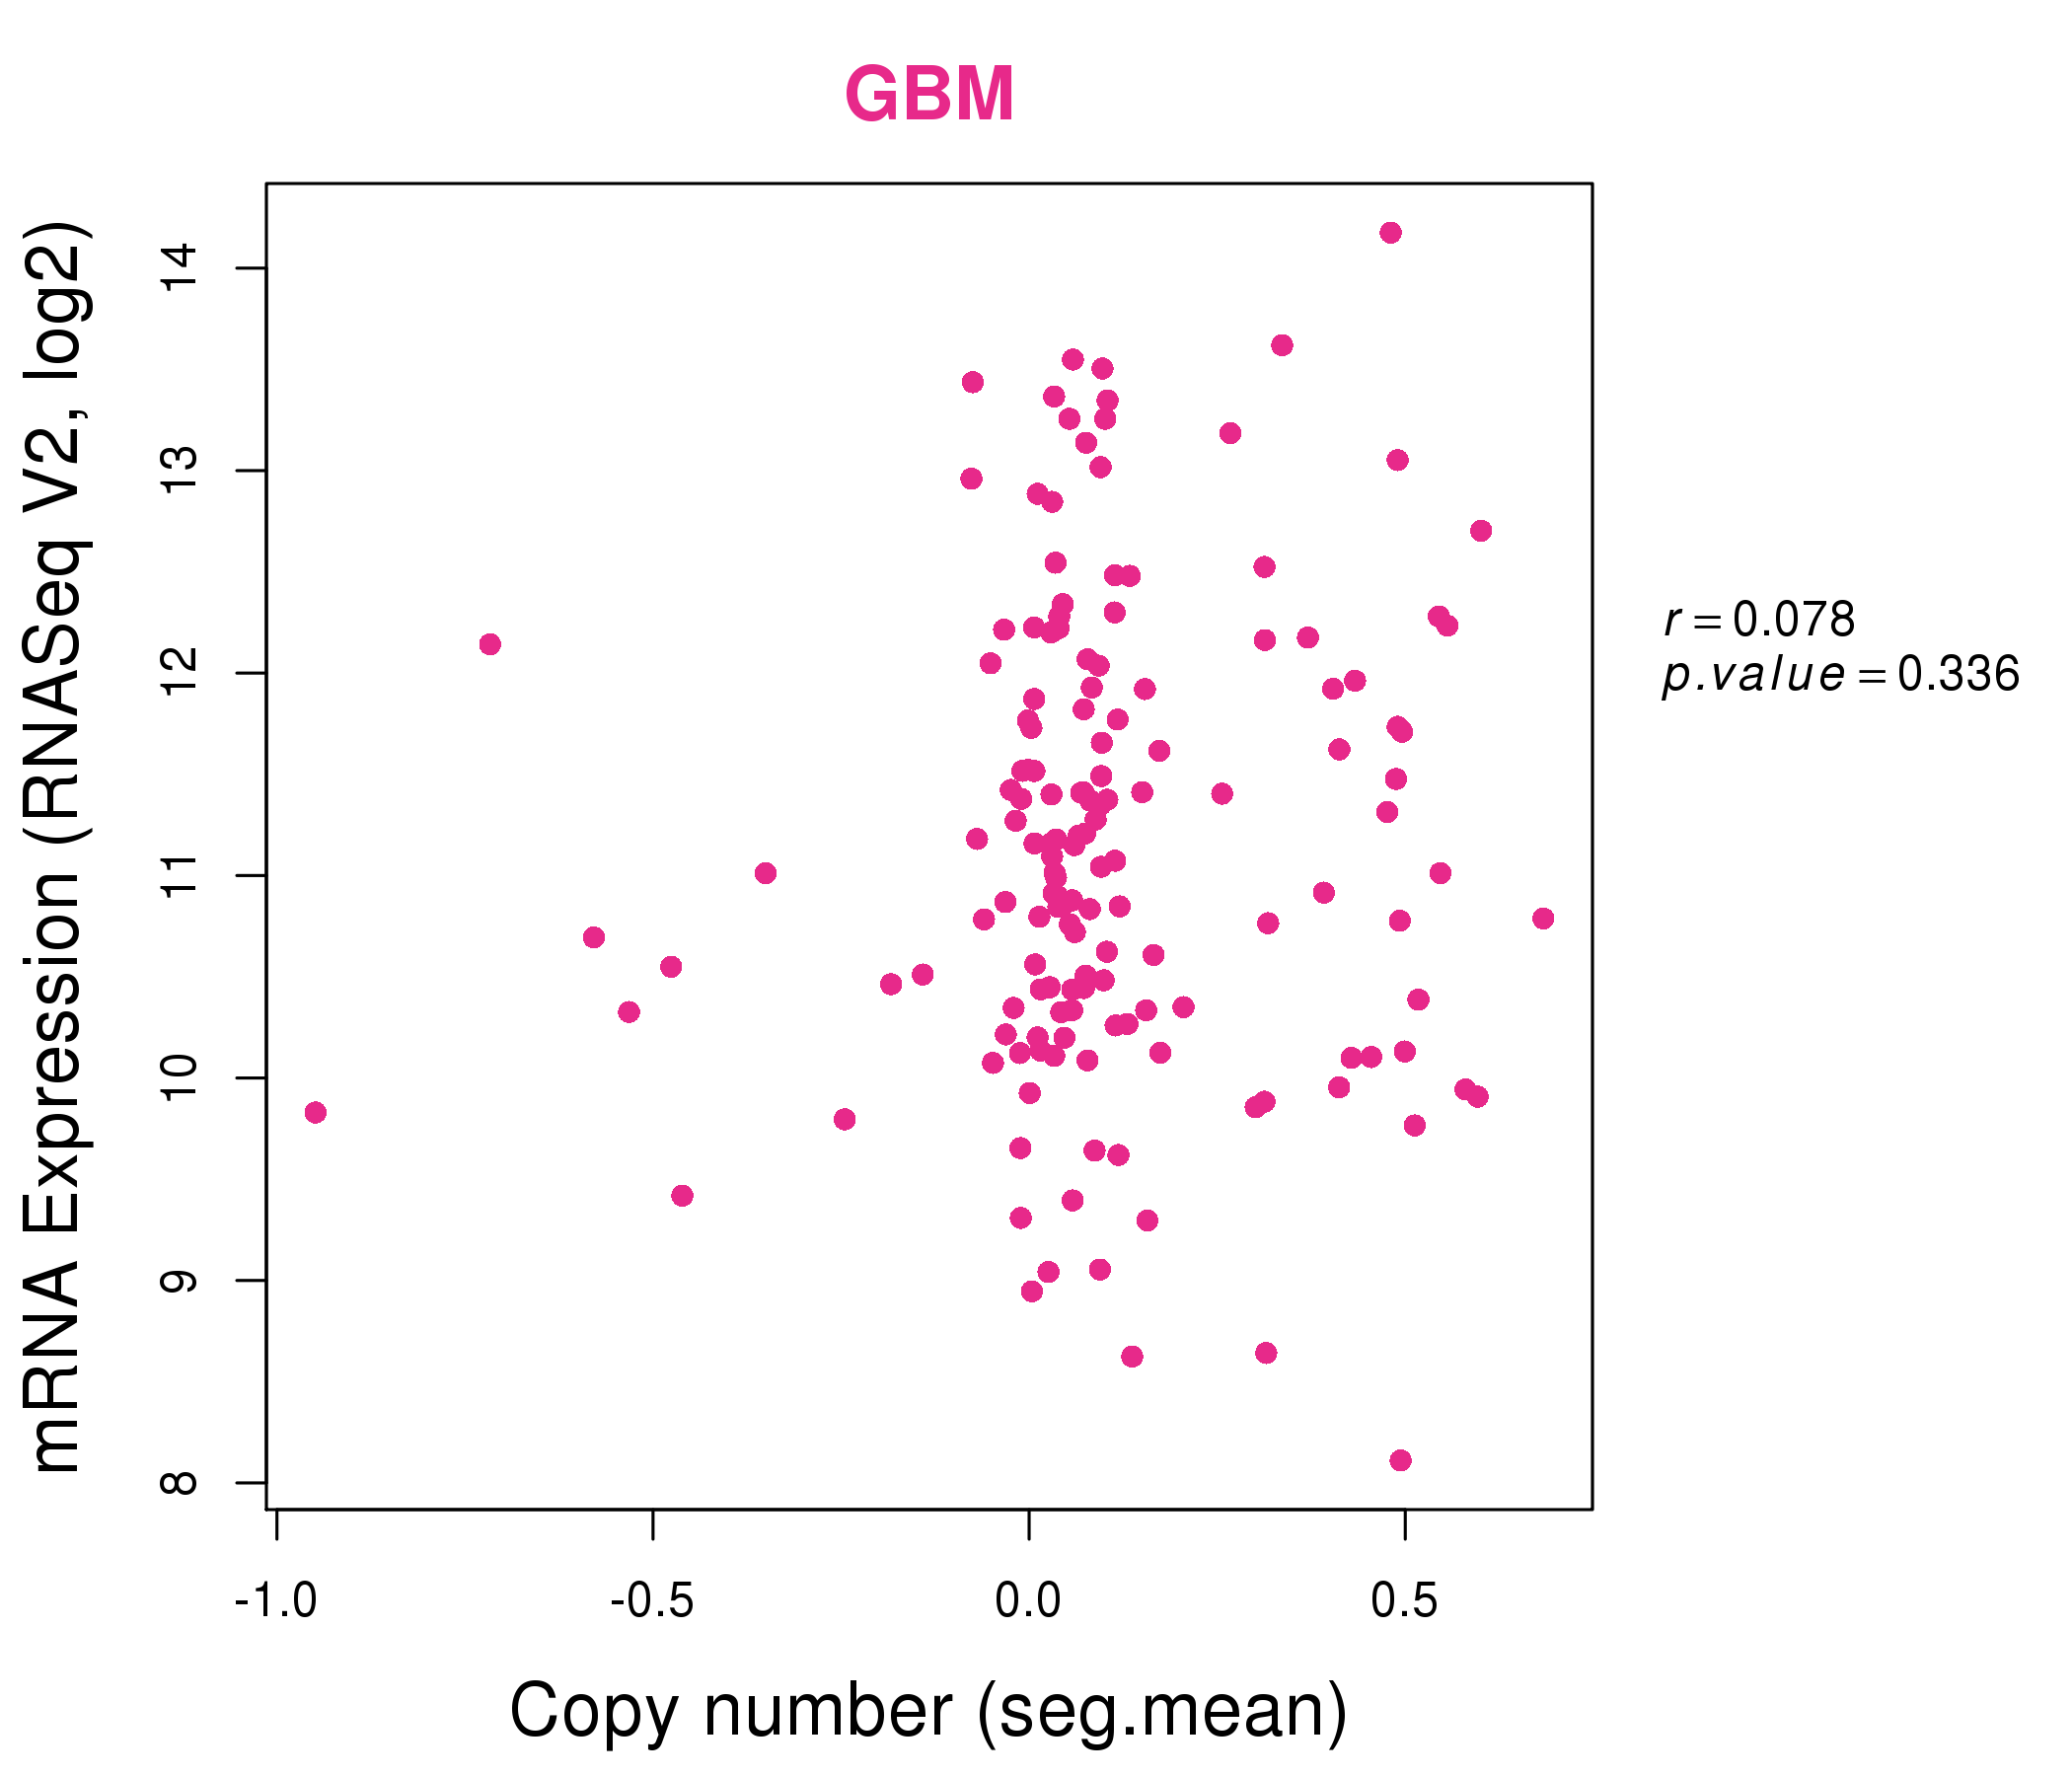
| * Normalized gene expression data of RNASeqV2 was extracted from TCGA using R package TCGA-Assembler. The URLs of all public data files on TCGA DCC data server were gathered at Jan-05-2015. Only eight cancer types have enough normal control samples for differential expression analysis. (t test, adjusted p<0.05 (using Benjamini-Hochberg FDR)) |
 |
| Top |
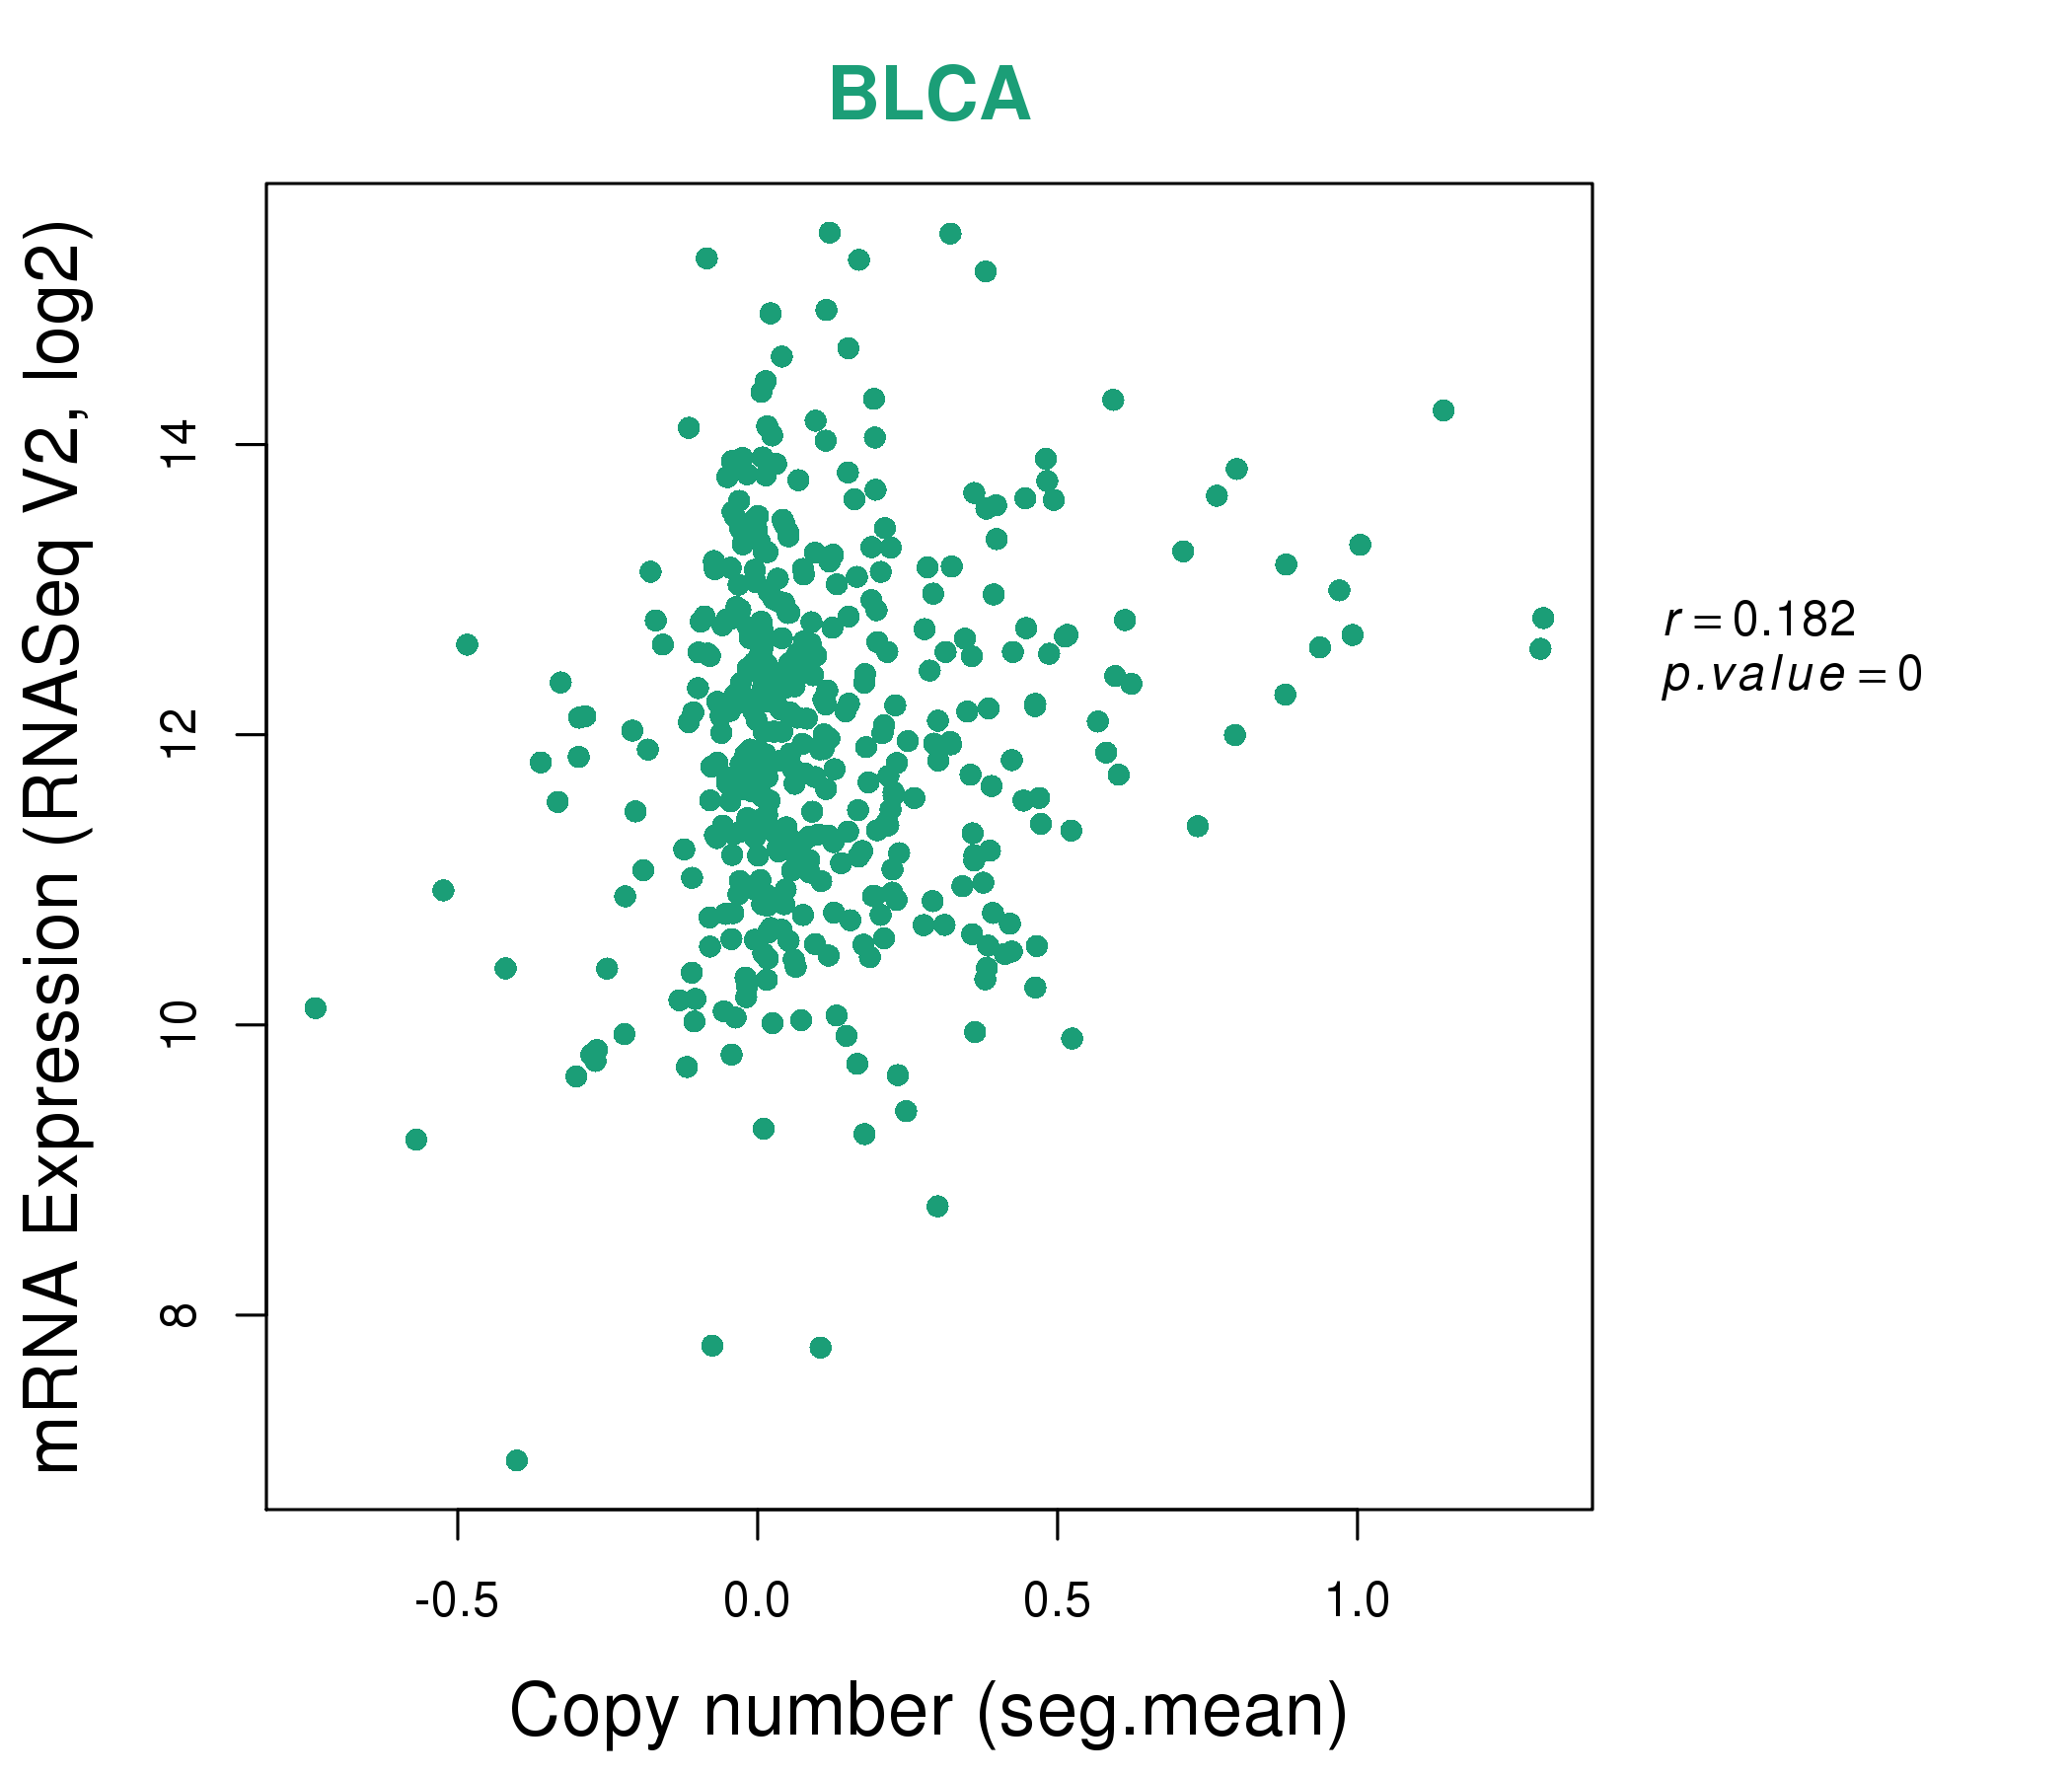
| * This plots show the correlation between CNV and gene expression. |
: Open all plots for all cancer types
 |
|
 |
|

| Top |
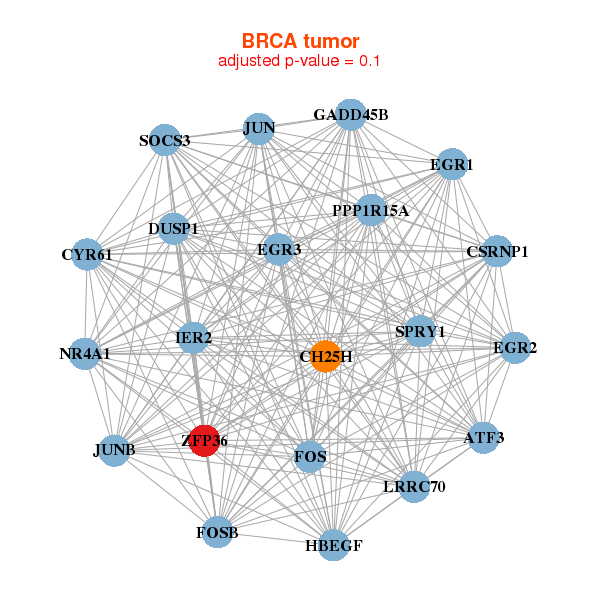
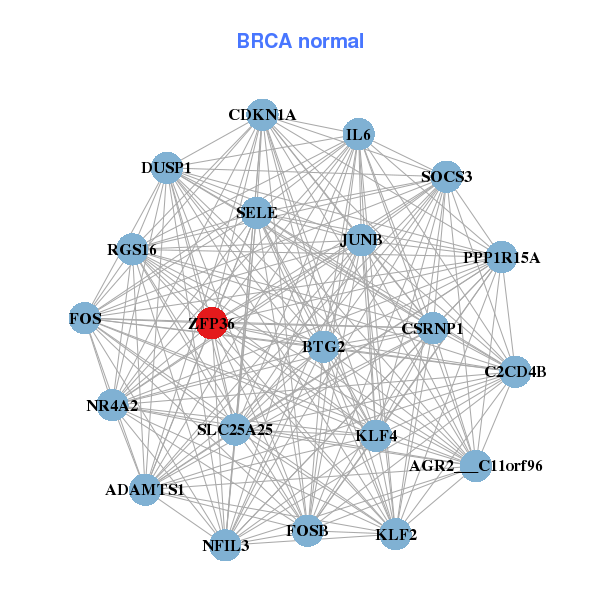
| Gene-Gene Network Information |
| * Co-Expression network figures were drawn using R package igraph. Only the top 20 genes with the highest correlations were shown. Red circle: input gene, orange circle: cell metabolism gene, sky circle: other gene |
: Open all plots for all cancer types
 |
|
| CYR61,EGR1,EVC,GAS7,GEM,GLI2,GPR124, ITPRIP,JUN,LRP1,MFAP4,PEAR1,PHLDB1,PODN, RHOJ,TGFB3,TSHZ3,YAP1,ZFP36,ZFP36L1,ZFP36L2 | ATF3,BCL10,CHIC2,CXCL2,DUSP1,DUSP5,EGR1, FOS,ID2,LPAR6,NFKBIZ,NR4A2,PTGS2,RAB2B, SERTAD2,TBPL1,TMEM170A,TNFSF10,TUBD1,TUBE1,ZFP36L1 |
 |
|
| ATXN1,BICC1,BMPR2,ELK3,FAM26E,FILIP1L,GEM, HIVEP2,ISLR,PPP1R18,KLF7,LCA5,LRRC32,LTBP1, MFRP,RUNX1,SULF1,TSHZ3,ZFP36L1,ZNF362,ZNF532 | CHST3,DLG2,DZIP1,EFS,HSPA12A,IPW,MPPED2, NCAM1,NLGN2,NLGN3,NPR2,PEG3,PLXNB3,PRIMA1, SCN2B,SLC4A3,TCF7L1,TRO,WASF1,WHAMMP2,ZFP36L1 |
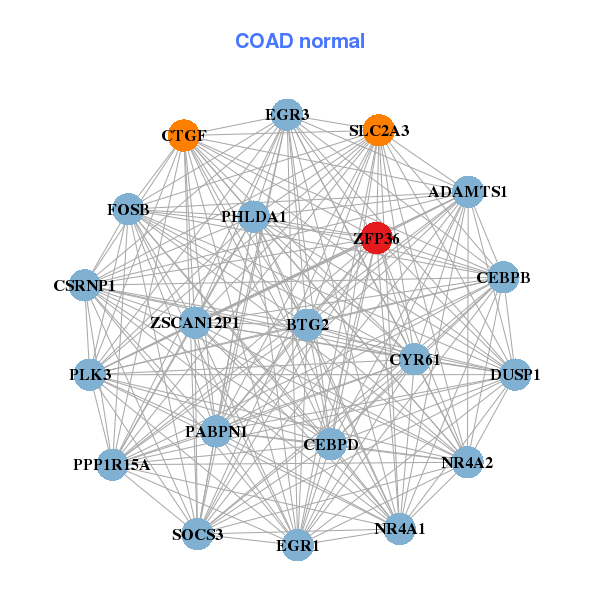
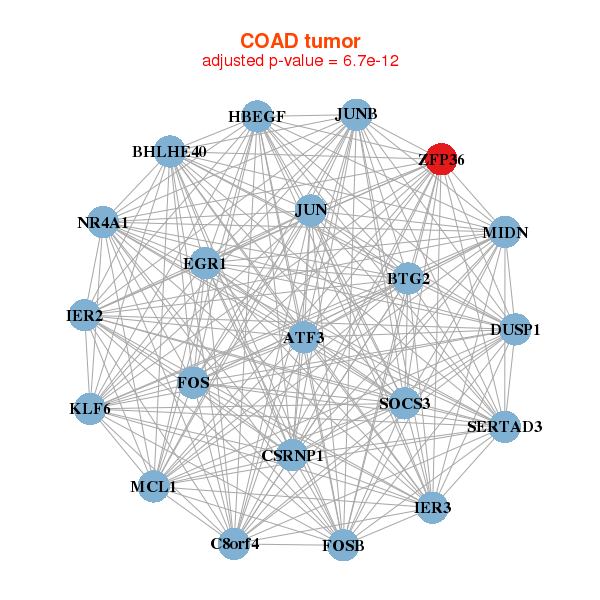
| * Co-Expression network figures were drawn using R package igraph. Only the top 20 genes with the highest correlations were shown. Red circle: input gene, orange circle: cell metabolism gene, sky circle: other gene |
: Open all plots for all cancer types
| Top |
: Open all interacting genes' information including KEGG pathway for all interacting genes from DAVID
| Top |
| Pharmacological Information for ZFP36 |
| There's no related Drug. |
| Top |
| Cross referenced IDs for ZFP36 |
| * We obtained these cross-references from Uniprot database. It covers 150 different DBs, 18 categories. http://www.uniprot.org/help/cross_references_section |
: Open all cross reference information
|
Copyright © 2016-Present - The Univsersity of Texas Health Science Center at Houston @ |