|
|||||||||||||||||||||||||||||||||||||||||||||||||||||||||||||||||||||||||||||||||||||||||||||||||||||||||||||||||||||||||||||||||||||||||||||||||||||||||||||||||||||||||||||||||||||||||||||||||||||||||||||||||||||||||||||||||||||||||||||||||||||||||||||||||||||||||||||||||||||||||||||||||||||||||||||||||||||||||||||||||||||||||||||||||||||||||||||||||||||||||||||||||||||||||||||||||||||||||||||||||||||||||||||||||||||||||||||||||||||||||||||||||||||||||||||||||
| |
| Phenotypic Information (metabolism pathway, cancer, disease, phenome) |
| |
| |
| Gene-Gene Network Information: Co-Expression Network, Interacting Genes & KEGG |
| |
|


| Gene Summary for CA1 |
| Top |
| Phenotypic Information for CA1(metabolism pathway, cancer, disease, phenome) |
| Cancer | CGAP: CA1 |
| Familial Cancer Database: CA1 | |
| * This gene is included in those cancer gene databases. |
|
|
|
|
|
|
| |||||||||||||||||||||||||||||||||||||||||||||||||||||||||||||||||||||||||||||||||||||||||||||||||||||||||||||||||||||||||||||||||||||||||||||||||||||||||||||||||||||||||||||||||||||||||||||||||||||||||||||||||||||||||||||||||||||||||||||||||||||||||||||||||||||||||||||||||||||||||||||||||||||||||||||||||||||||||||||||||||||||||||||||||||||||||||||||||||||||||||||||||||||||||||||||||||||||||||||||||||||||||||||||||||||||||||||||||||||||||||||||||||||||||||
Oncogene 1 | Significant driver gene in | ||||||||||||||||||||||||||||||||||||||||||||||||||||||||||||||||||||||||||||||||||||||||||||||||||||||||||||||||||||||||||||||||||||||||||||||||||||||||||||||||||||||||||||||||||||||||||||||||||||||||||||||||||||||||||||||||||||||||||||||||||||||||||||||||||||||||||||||||||||||||||||||||||||||||||||||||||||||||||||||||||||||||||||||||||||||||||||||||||||||||||||||||||||||||||||||||||||||||||||||||||||||||||||||||||||||||||||||||||||||||||||||||||||||||||||||||
| cf) number; DB name 1 Oncogene; http://nar.oxfordjournals.org/content/35/suppl_1/D721.long, 2 Tumor Suppressor gene; https://bioinfo.uth.edu/TSGene/, 3 Cancer Gene Census; http://www.nature.com/nrc/journal/v4/n3/abs/nrc1299.html, 4 CancerGenes; http://nar.oxfordjournals.org/content/35/suppl_1/D721.long, 5 Network of Cancer Gene; http://ncg.kcl.ac.uk/index.php, 1Therapeutic Vulnerabilities in Cancer; http://cbio.mskcc.org/cancergenomics/statius/ |
| KEGG_NITROGEN_METABOLISM | |
| OMIM | |
| Orphanet | |
| Disease | KEGG Disease: CA1 |
| MedGen: CA1 (Human Medical Genetics with Condition) | |
| ClinVar: CA1 | |
| Phenotype | MGI: CA1 (International Mouse Phenotyping Consortium) |
| PhenomicDB: CA1 | |
| Mutations for CA1 |
| * Under tables are showing count per each tissue to give us broad intuition about tissue specific mutation patterns.You can go to the detailed page for each mutation database's web site. |
| - Statistics for Tissue and Mutation type | Top |
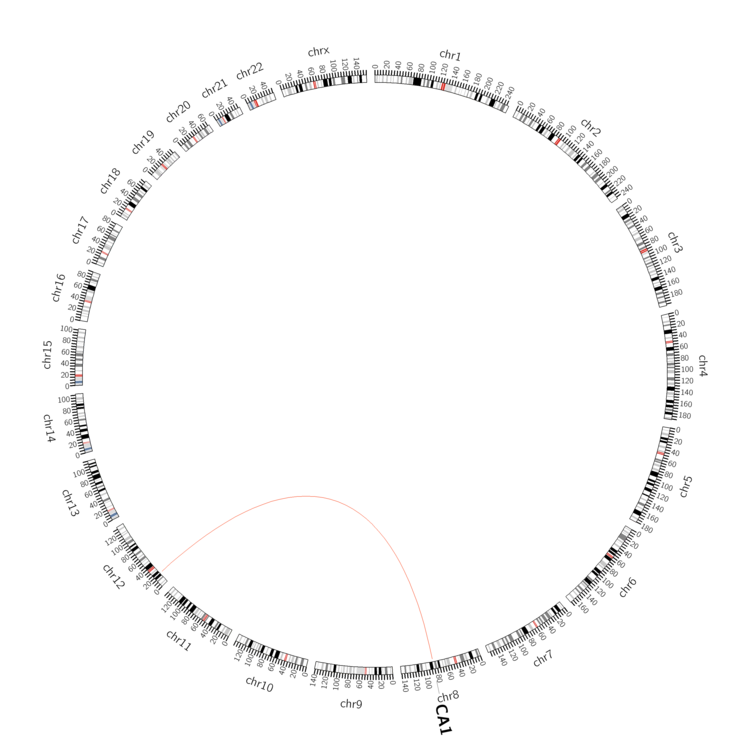 |
| - For Inter-chromosomal Variations |
| * Inter-chromosomal variantions includes 'interchromosomal amplicon to amplicon', 'interchromosomal amplicon to non-amplified dna', 'interchromosomal insertion', 'Interchromosomal unknown type'. |
 |
| - For Intra-chromosomal Variations |
| There's no intra-chromosomal structural variation. |
| Sample | Symbol_a | Chr_a | Start_a | End_a | Symbol_b | Chr_b | Start_b | End_b |
| ovary | CA1 | chr8 | 86252756 | 86252776 | chr12 | 19854678 | 19854698 |
| cf) Tissue number; Tissue name (1;Breast, 2;Central_nervous_system, 3;Haematopoietic_and_lymphoid_tissue, 4;Large_intestine, 5;Liver, 6;Lung, 7;Ovary, 8;Pancreas, 9;Prostate, 10;Skin, 11;Soft_tissue, 12;Upper_aerodigestive_tract) |
| * From mRNA Sanger sequences, Chitars2.0 arranged chimeric transcripts. This table shows CA1 related fusion information. |
| ID | Head Gene | Tail Gene | Accession | Gene_a | qStart_a | qEnd_a | Chromosome_a | tStart_a | tEnd_a | Gene_a | qStart_a | qEnd_a | Chromosome_a | tStart_a | tEnd_a |
| Top |
| Mutation type/ Tissue ID | brca | cns | cerv | endome | haematopo | kidn | Lintest | liver | lung | ns | ovary | pancre | prost | skin | stoma | thyro | urina | |||
| Total # sample | 1 | |||||||||||||||||||
| GAIN (# sample) | 1 | |||||||||||||||||||
| LOSS (# sample) |
| cf) Tissue ID; Tissue type (1; Breast, 2; Central_nervous_system, 3; Cervix, 4; Endometrium, 5; Haematopoietic_and_lymphoid_tissue, 6; Kidney, 7; Large_intestine, 8; Liver, 9; Lung, 10; NS, 11; Ovary, 12; Pancreas, 13; Prostate, 14; Skin, 15; Stomach, 16; Thyroid, 17; Urinary_tract) |
| Top |
|
 |
| Top |
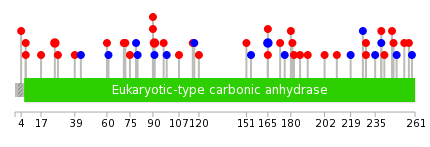
| Stat. for Non-Synonymous SNVs (# total SNVs=30) | (# total SNVs=11) |
 |  |
(# total SNVs=2) | (# total SNVs=1) |
 |  |
| Top |
| * When you move the cursor on each content, you can see more deailed mutation information on the Tooltip. Those are primary_site,primary_histology,mutation(aa),pubmedID. |
| GRCh37 position | Mutation(aa) | Unique sampleID count |
| chr8:86250541-86250541 | p.E59* | 3 |
| chr8:86249257-86249257 | p.L91F | 2 |
| chr8:86250640-86250640 | p.G26R | 2 |
| chr8:86244737-86244737 | p.L165L | 2 |
| chr8:86250533-86250533 | p.I61I | 1 |
| chr8:86242031-86242031 | p.L186F | 1 |
| chr8:86245760-86245761 | p.L148fs*6 | 1 |
| chr8:86253854-86253854 | p.P4Q | 1 |
| chr8:86240858-86240858 | p.A239A | 1 |
| chr8:86250536-86250536 | p.I60M | 1 |
| Top |
|
 |
| Point Mutation/ Tissue ID | 1 | 2 | 3 | 4 | 5 | 6 | 7 | 8 | 9 | 10 | 11 | 12 | 13 | 14 | 15 | 16 | 17 | 18 | 19 | 20 |
| # sample | 2 | 1 | 1 | 1 | 8 | 1 | 1 | 9 | 2 | 6 | ||||||||||
| # mutation | 2 | 1 | 1 | 1 | 8 | 1 | 1 | 9 | 2 | 6 | ||||||||||
| nonsynonymous SNV | 1 | 1 | 1 | 5 | 1 | 7 | 1 | 4 | ||||||||||||
| synonymous SNV | 1 | 1 | 3 | 1 | 2 | 1 | 2 |
| cf) Tissue ID; Tissue type (1; BLCA[Bladder Urothelial Carcinoma], 2; BRCA[Breast invasive carcinoma], 3; CESC[Cervical squamous cell carcinoma and endocervical adenocarcinoma], 4; COAD[Colon adenocarcinoma], 5; GBM[Glioblastoma multiforme], 6; Glioma Low Grade, 7; HNSC[Head and Neck squamous cell carcinoma], 8; KICH[Kidney Chromophobe], 9; KIRC[Kidney renal clear cell carcinoma], 10; KIRP[Kidney renal papillary cell carcinoma], 11; LAML[Acute Myeloid Leukemia], 12; LUAD[Lung adenocarcinoma], 13; LUSC[Lung squamous cell carcinoma], 14; OV[Ovarian serous cystadenocarcinoma ], 15; PAAD[Pancreatic adenocarcinoma], 16; PRAD[Prostate adenocarcinoma], 17; SKCM[Skin Cutaneous Melanoma], 18:STAD[Stomach adenocarcinoma], 19:THCA[Thyroid carcinoma], 20:UCEC[Uterine Corpus Endometrial Carcinoma]) |
| Top |
| * We represented just top 10 SNVs. When you move the cursor on each content, you can see more deailed mutation information on the Tooltip. Those are primary_site, primary_histology, mutation(aa), pubmedID. |
| Genomic Position | Mutation(aa) | Unique sampleID count |
| chr8:86245846 | p.S116R,CA1 | 1 |
| chr8:86250640 | p.H7N,CA1 | 1 |
| chr8:86242048 | p.S116I,CA1 | 1 |
| chr8:86249177 | p.A117A,CA1 | 1 |
| chr8:86250676 | p.F114F,CA1 | 1 |
| chr8:86242059 | p.L91L,CA1 | 1 |
| chr8:86249255 | p.V106V,CA1 | 1 |
| chr8:86253845 | p.R90S,CA1 | 1 |
| chr8:86242062 | p.R90G,CA1 | 1 |
| chr8:86249258 | p.P89R,CA1 | 1 |
| * Copy number data were extracted from TCGA using R package TCGA-Assembler. The URLs of all public data files on TCGA DCC data server were gathered on Jan-05-2015. Function ProcessCNAData in TCGA-Assembler package was used to obtain gene-level copy number value which is calculated as the average copy number of the genomic region of a gene. |
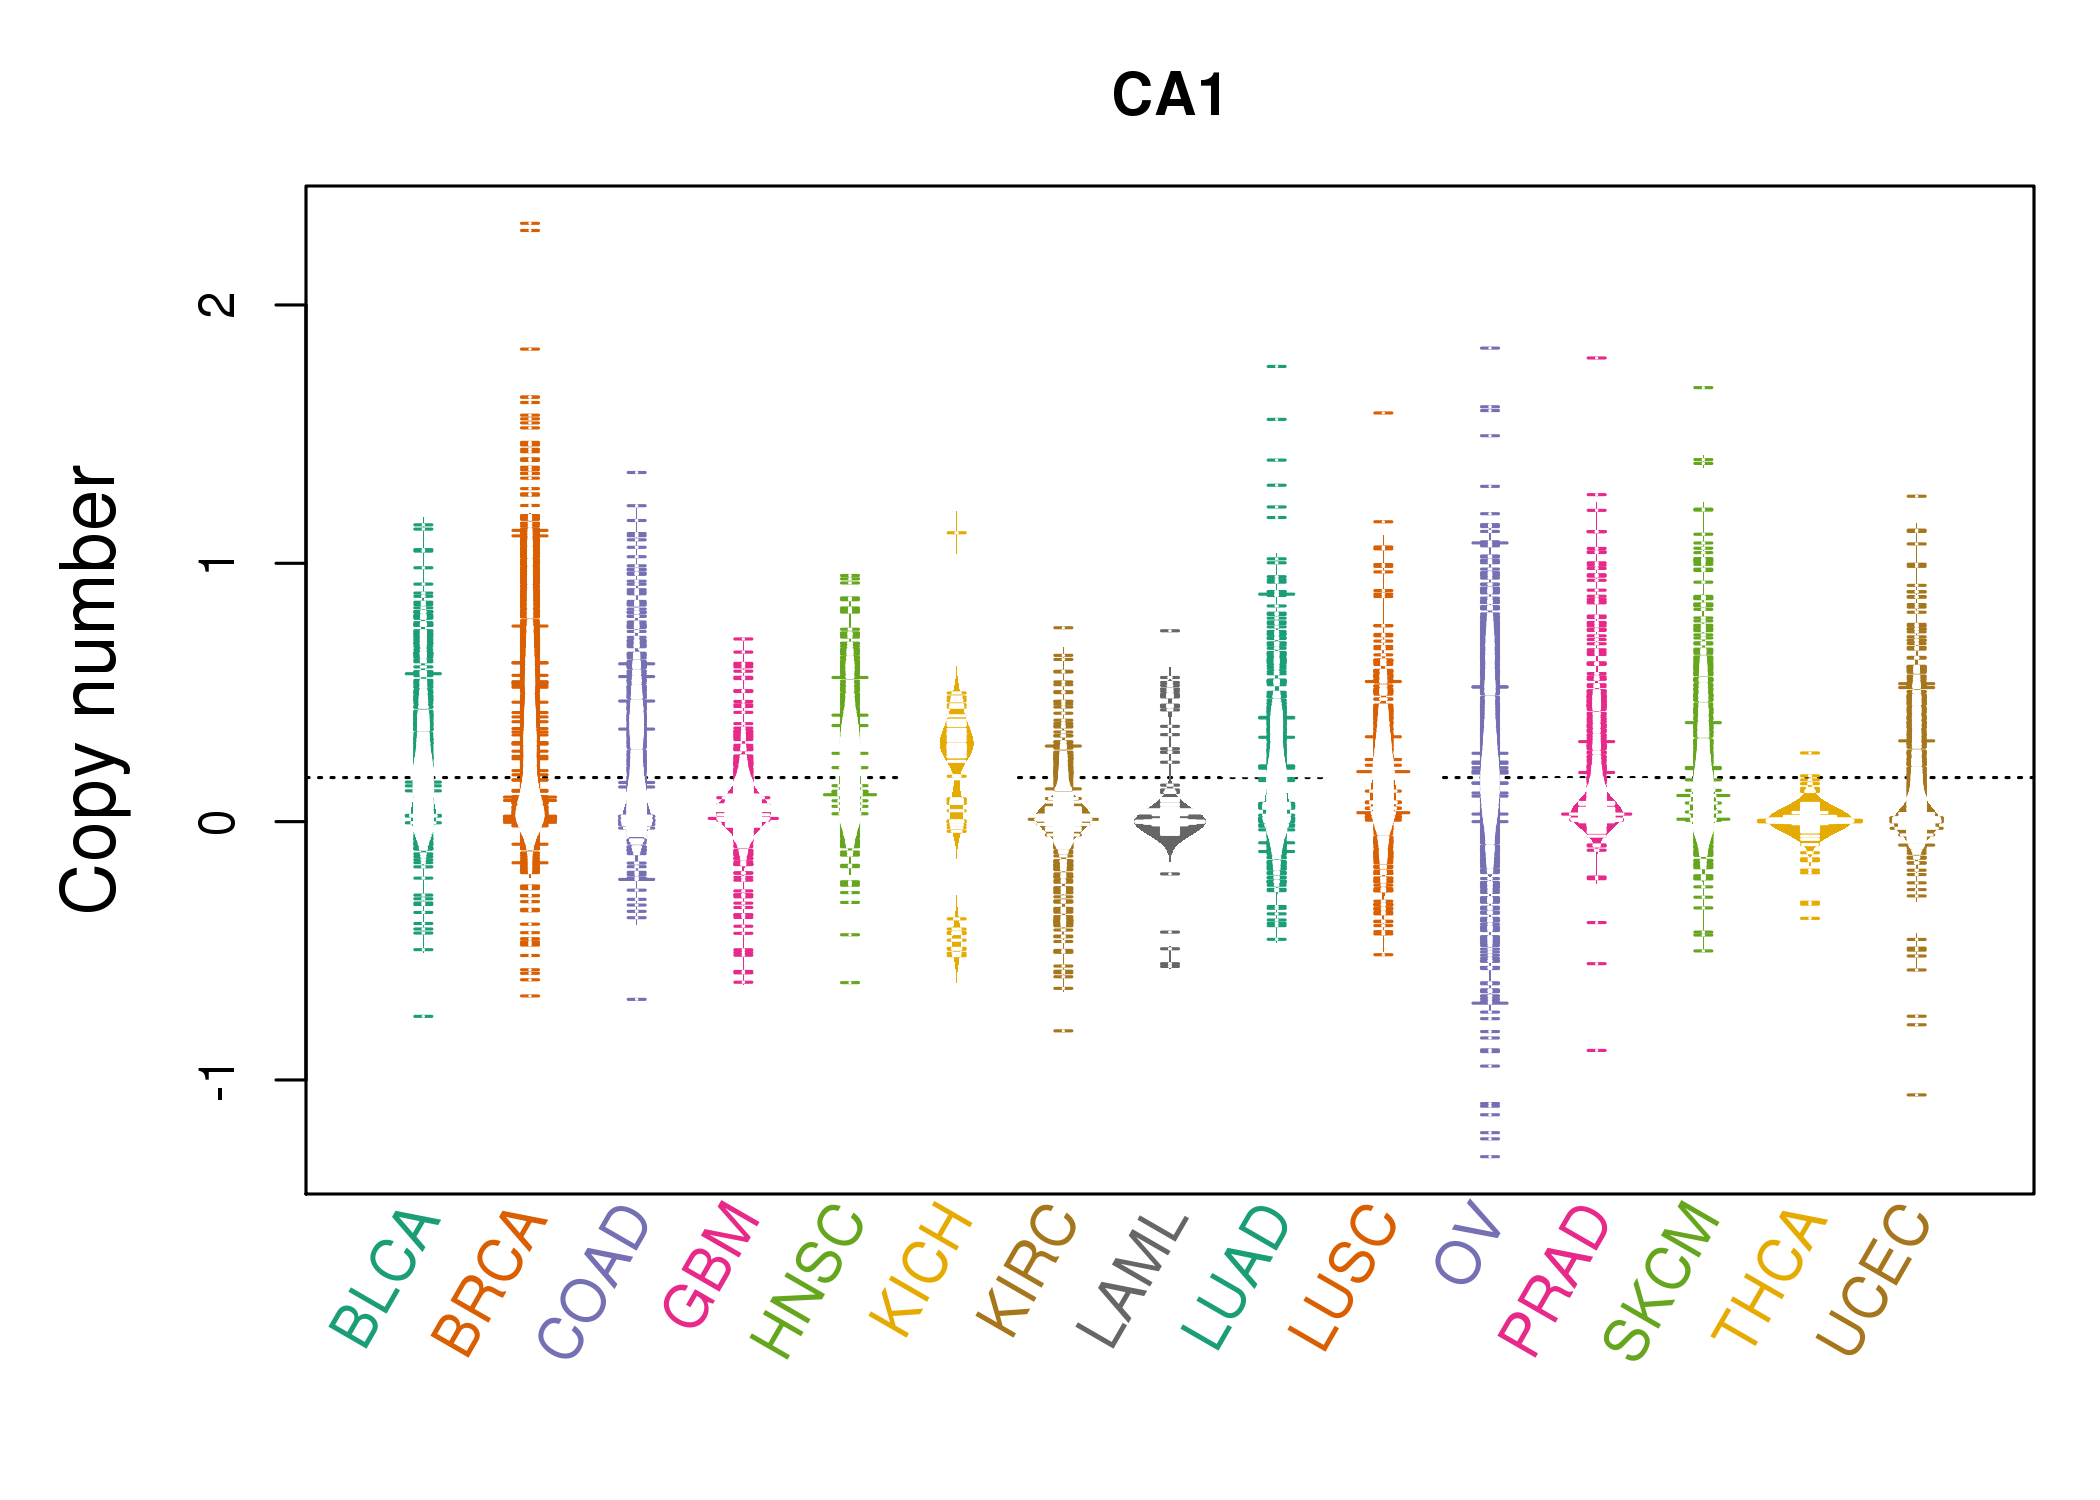 |
| cf) Tissue ID[Tissue type]: BLCA[Bladder Urothelial Carcinoma], BRCA[Breast invasive carcinoma], CESC[Cervical squamous cell carcinoma and endocervical adenocarcinoma], COAD[Colon adenocarcinoma], GBM[Glioblastoma multiforme], Glioma Low Grade, HNSC[Head and Neck squamous cell carcinoma], KICH[Kidney Chromophobe], KIRC[Kidney renal clear cell carcinoma], KIRP[Kidney renal papillary cell carcinoma], LAML[Acute Myeloid Leukemia], LUAD[Lung adenocarcinoma], LUSC[Lung squamous cell carcinoma], OV[Ovarian serous cystadenocarcinoma ], PAAD[Pancreatic adenocarcinoma], PRAD[Prostate adenocarcinoma], SKCM[Skin Cutaneous Melanoma], STAD[Stomach adenocarcinoma], THCA[Thyroid carcinoma], UCEC[Uterine Corpus Endometrial Carcinoma] |
| Top |
| Gene Expression for CA1 |
| * CCLE gene expression data were extracted from CCLE_Expression_Entrez_2012-10-18.res: Gene-centric RMA-normalized mRNA expression data. |
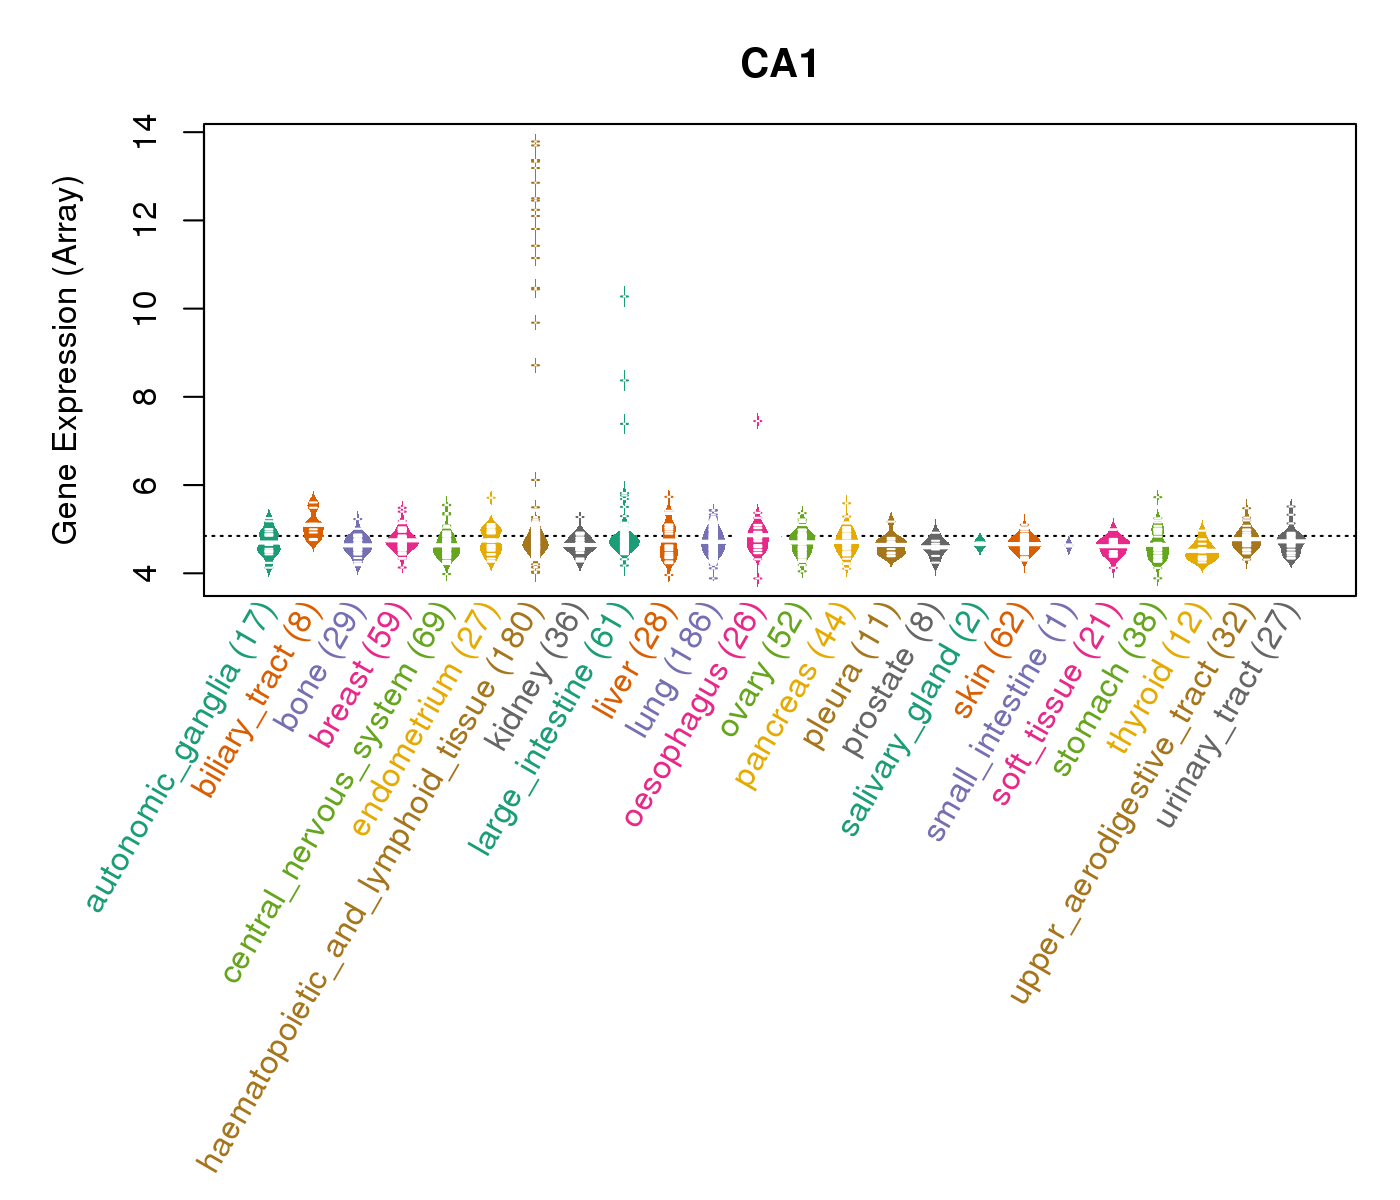 |
| * Normalized gene expression data of RNASeqV2 was extracted from TCGA using R package TCGA-Assembler. The URLs of all public data files on TCGA DCC data server were gathered at Jan-05-2015. Only eight cancer types have enough normal control samples for differential expression analysis. (t test, adjusted p<0.05 (using Benjamini-Hochberg FDR)) |
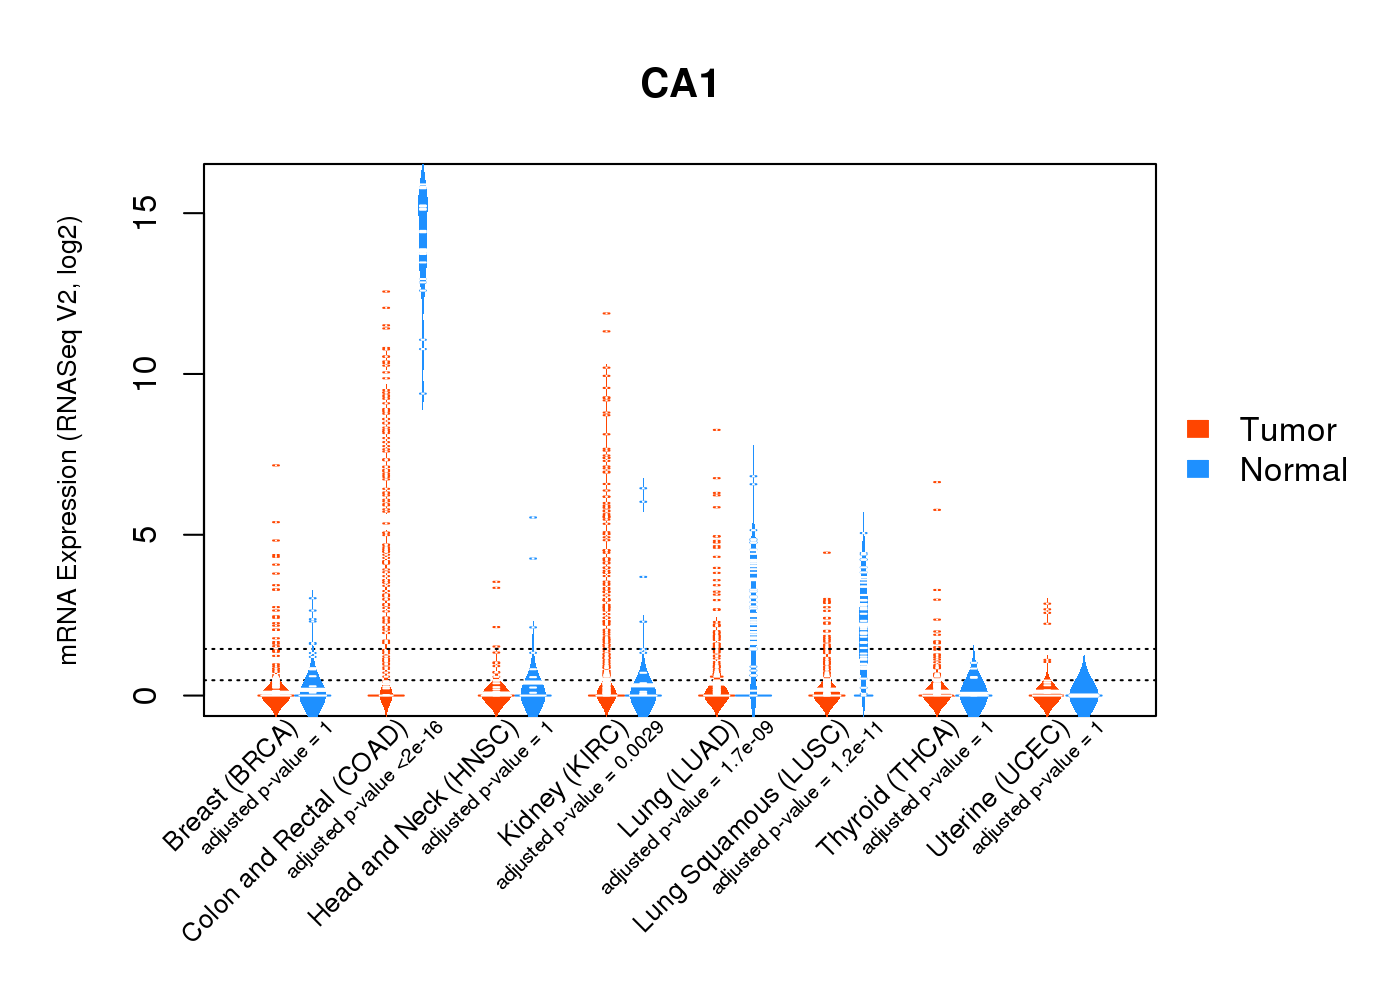 |
| Top |
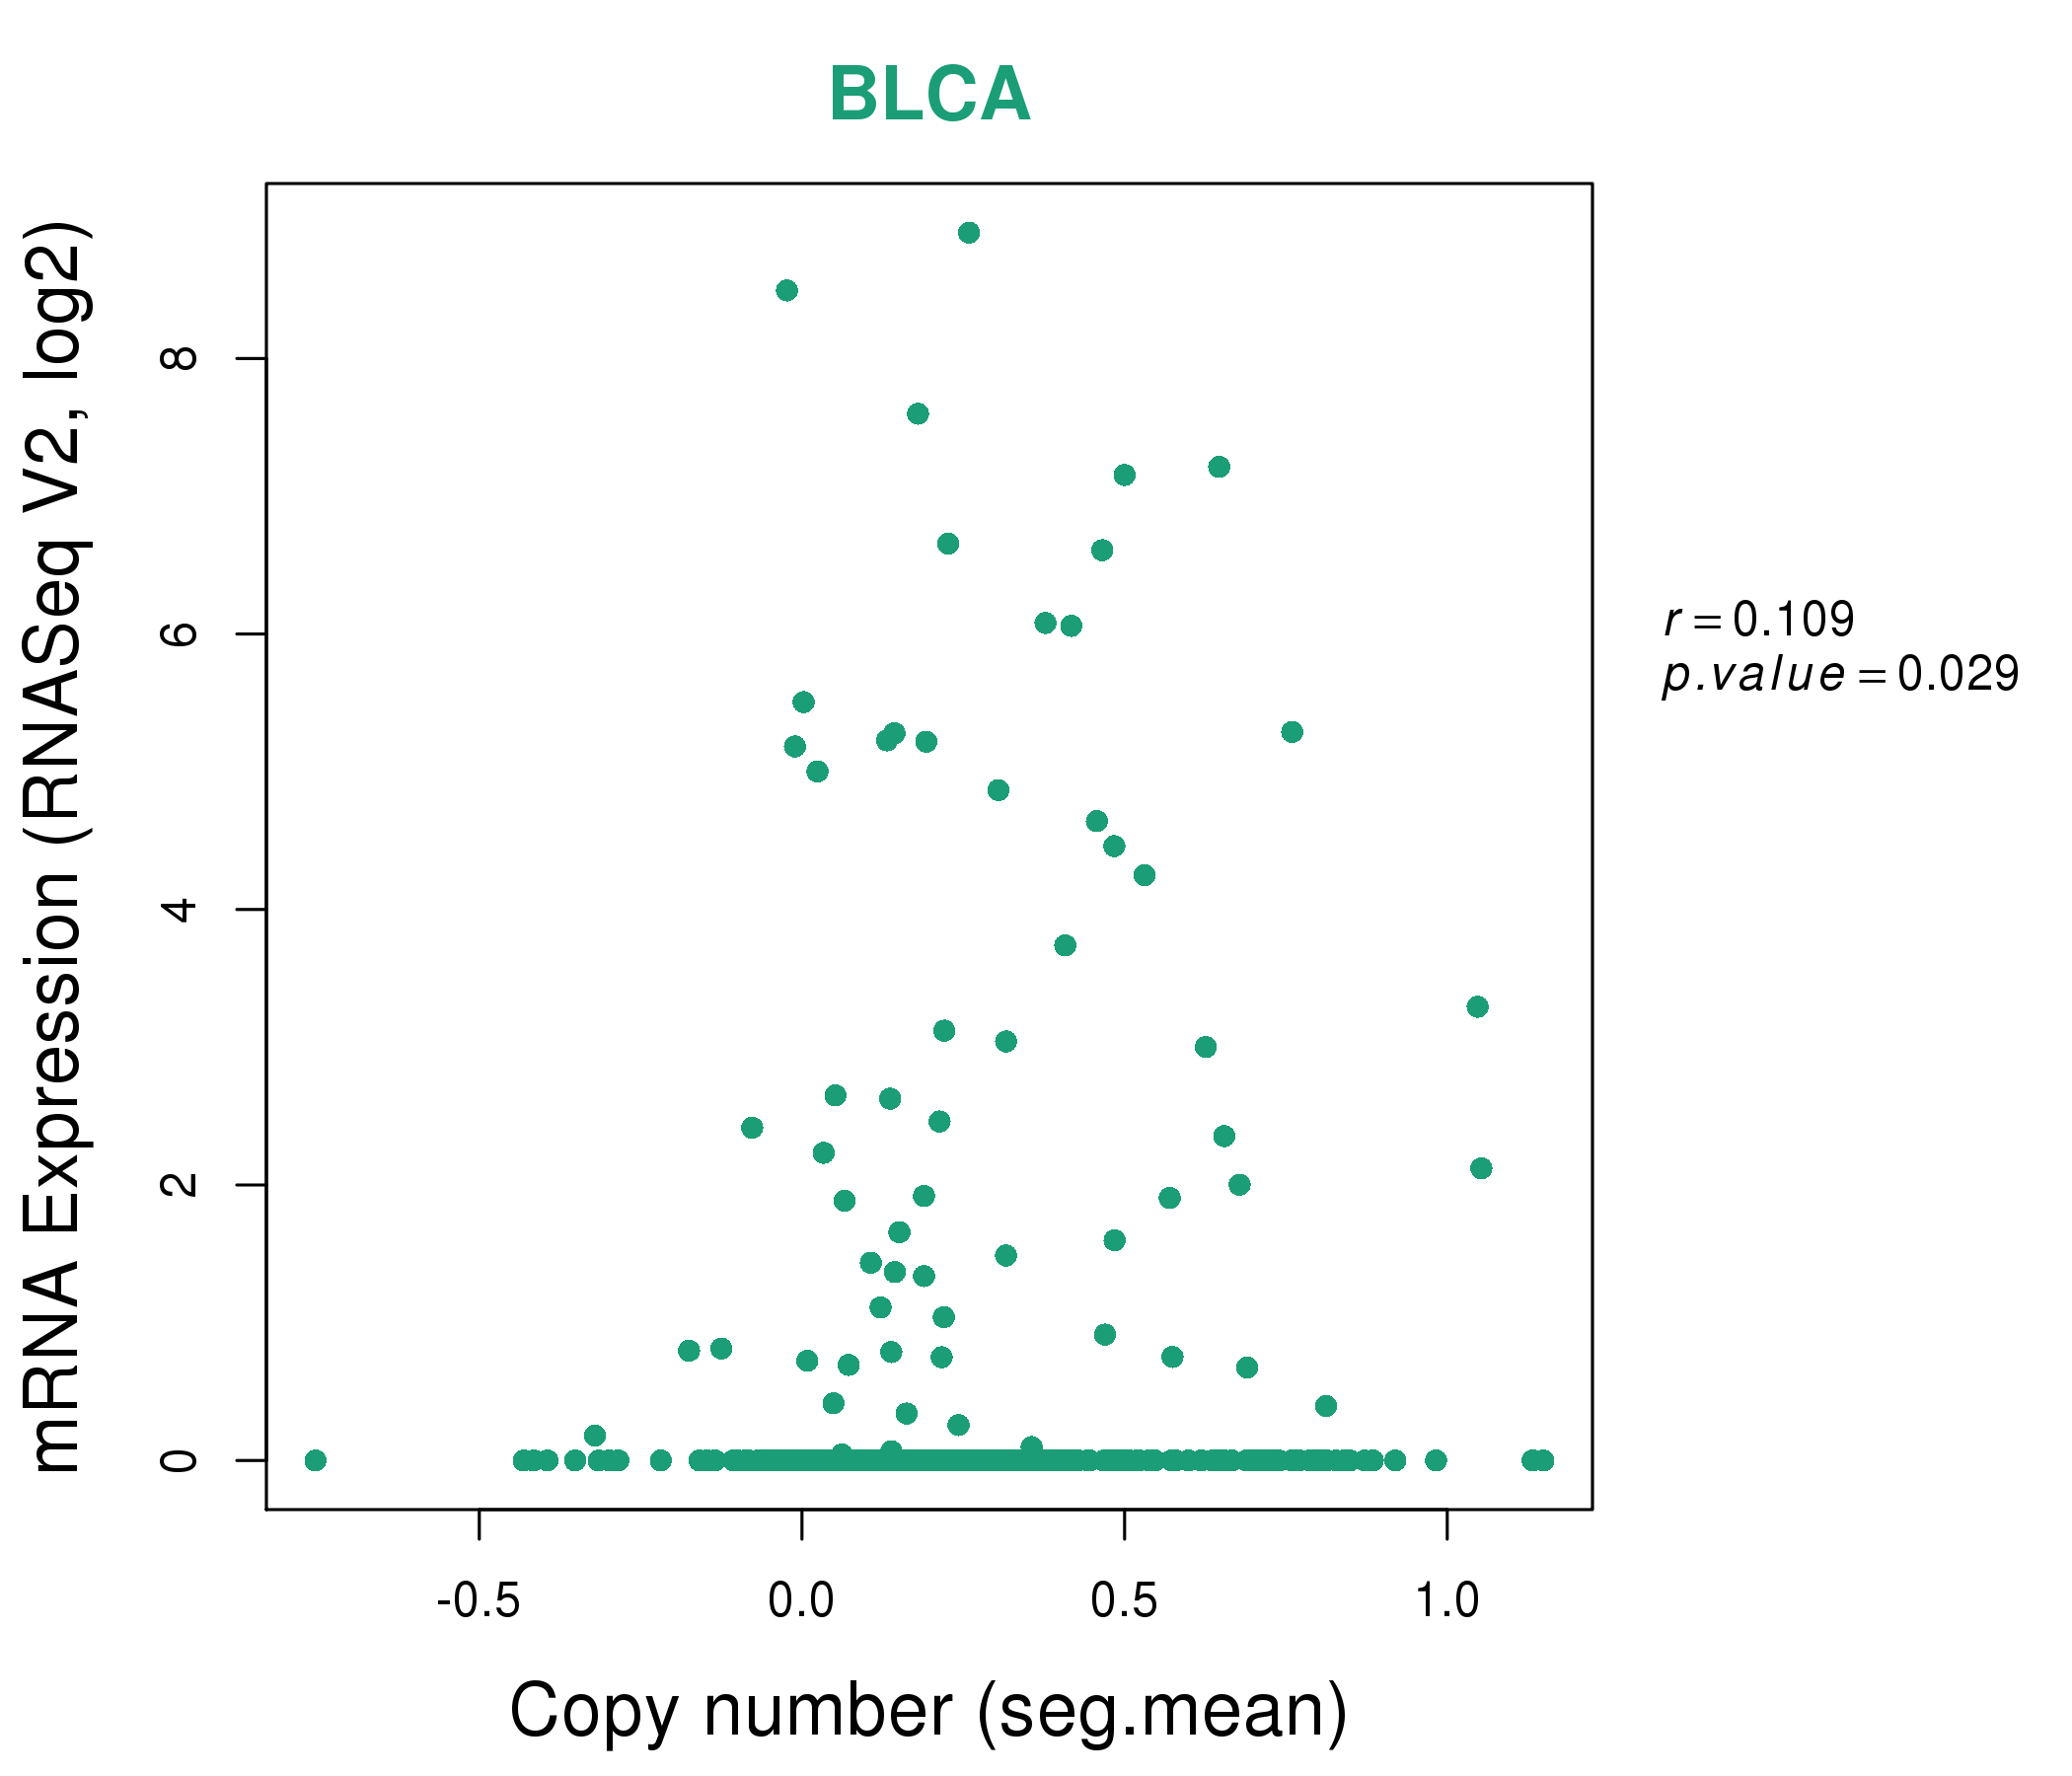
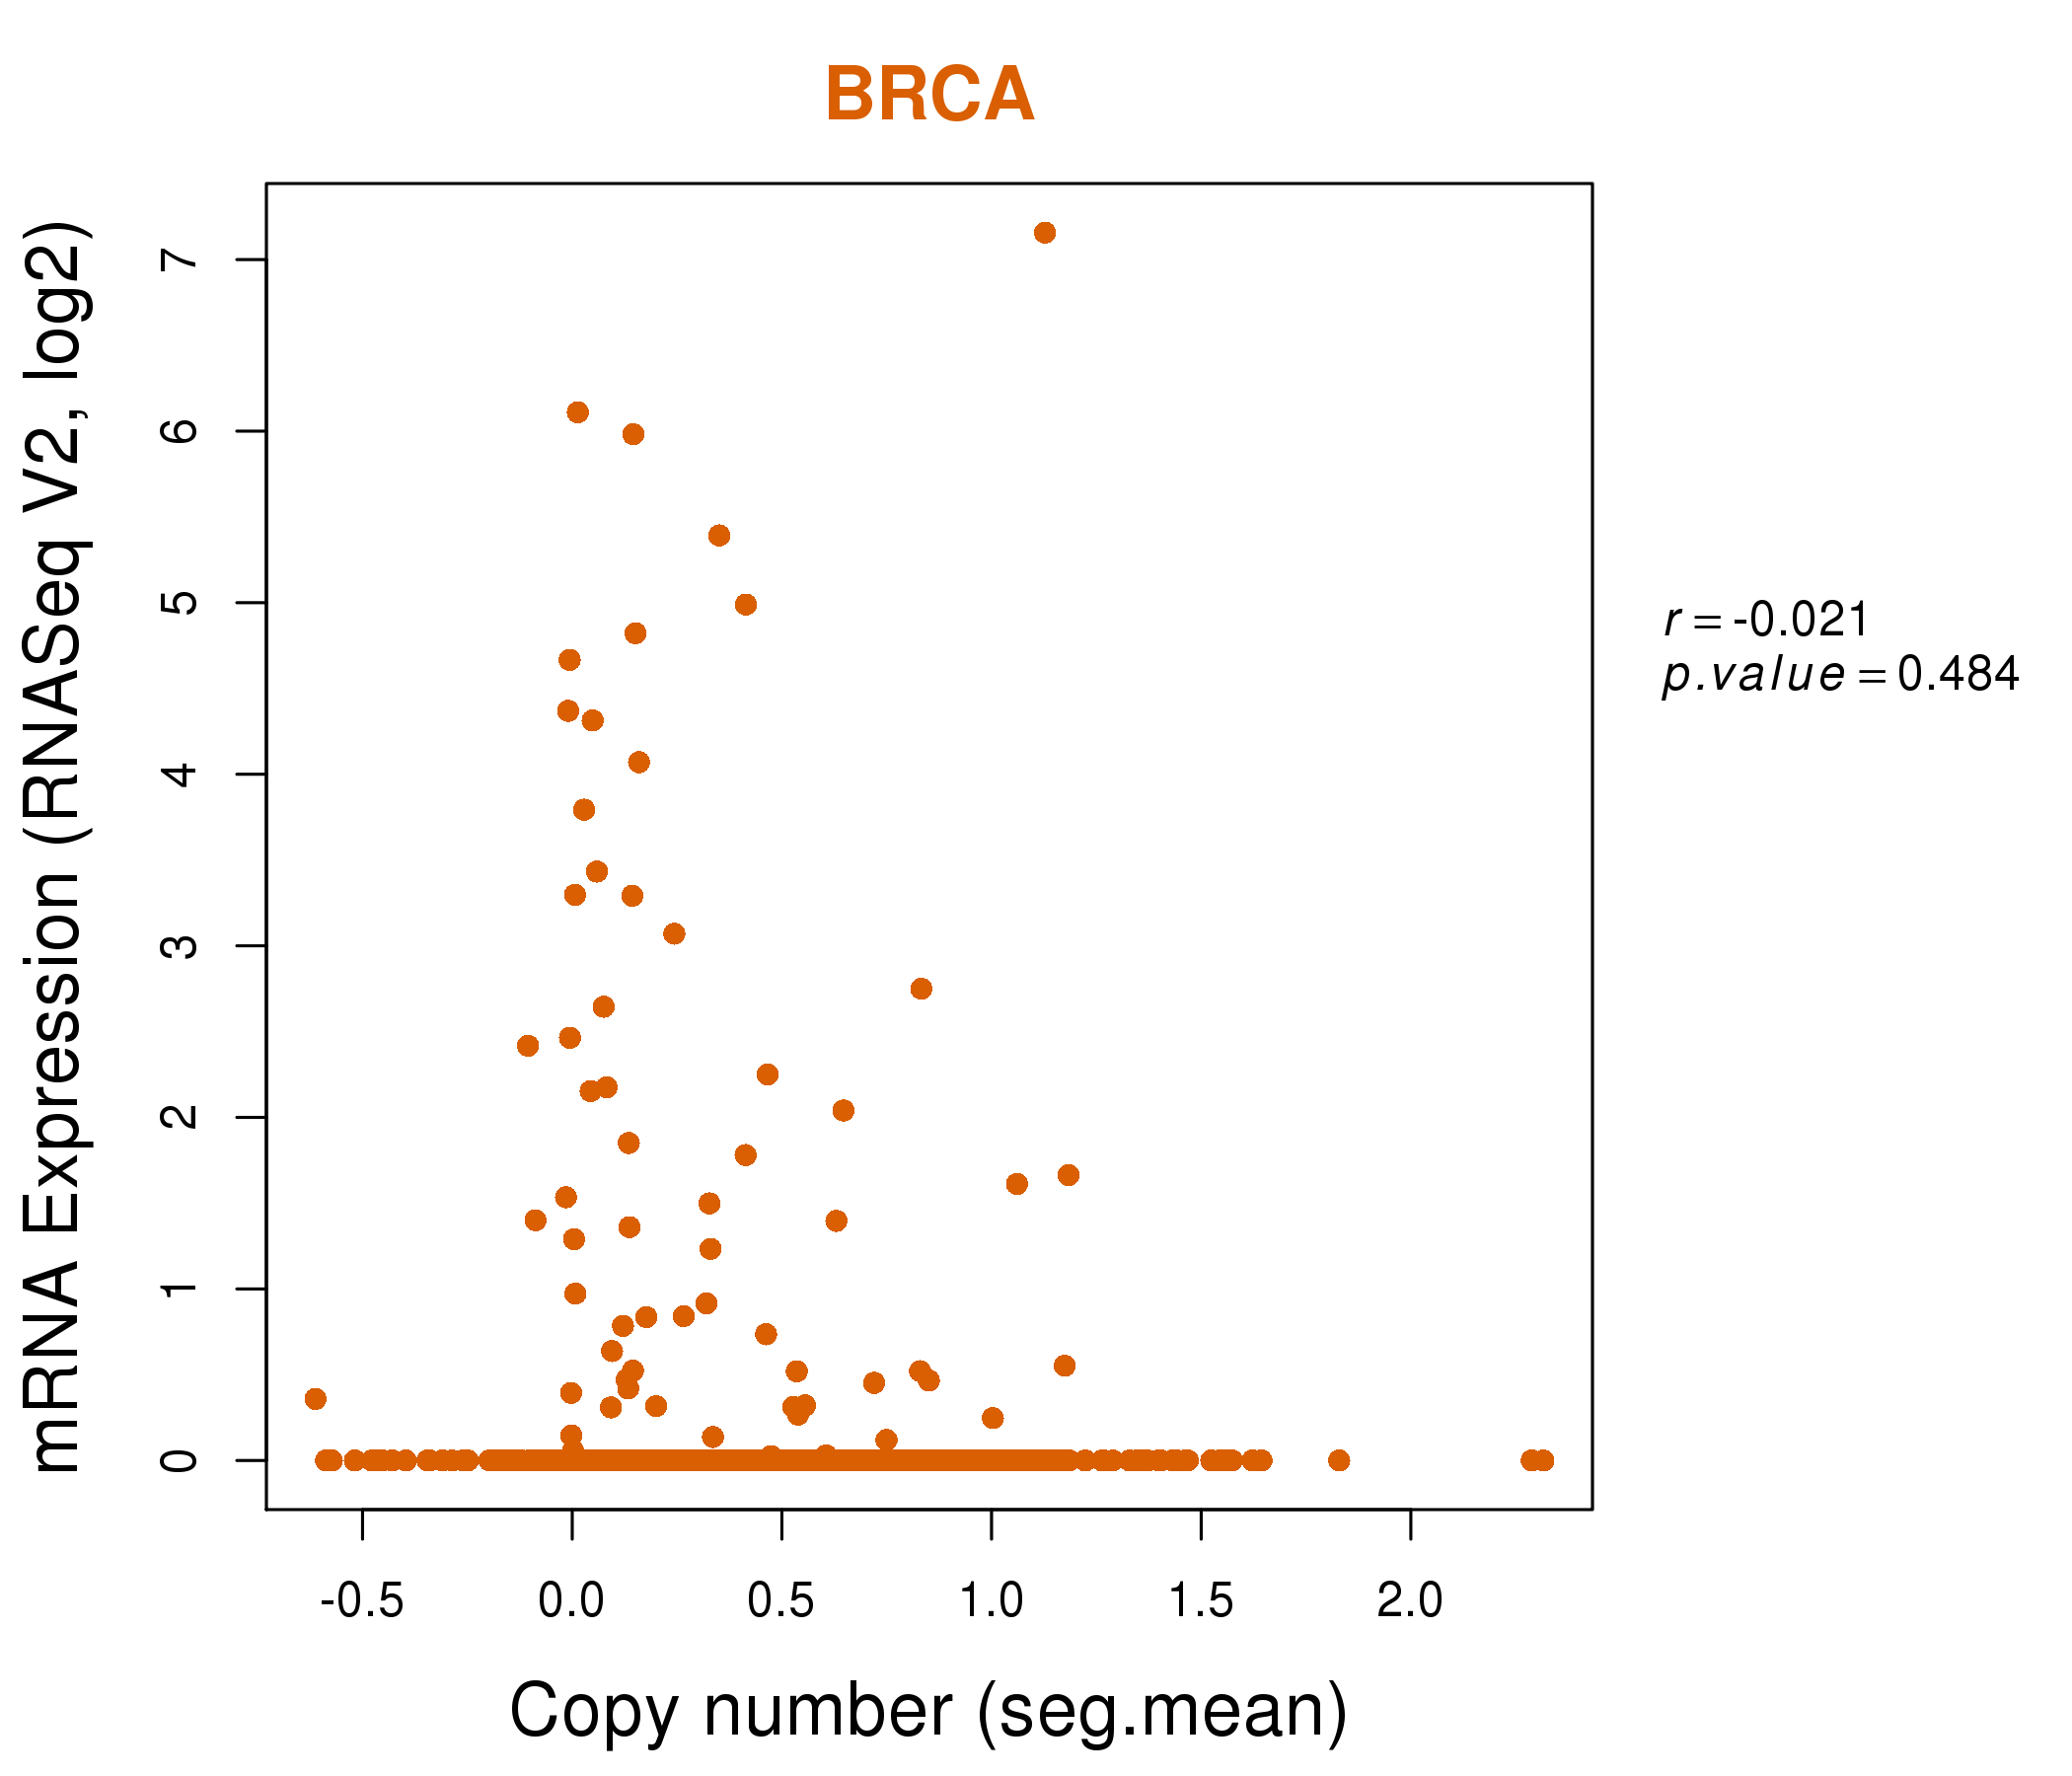
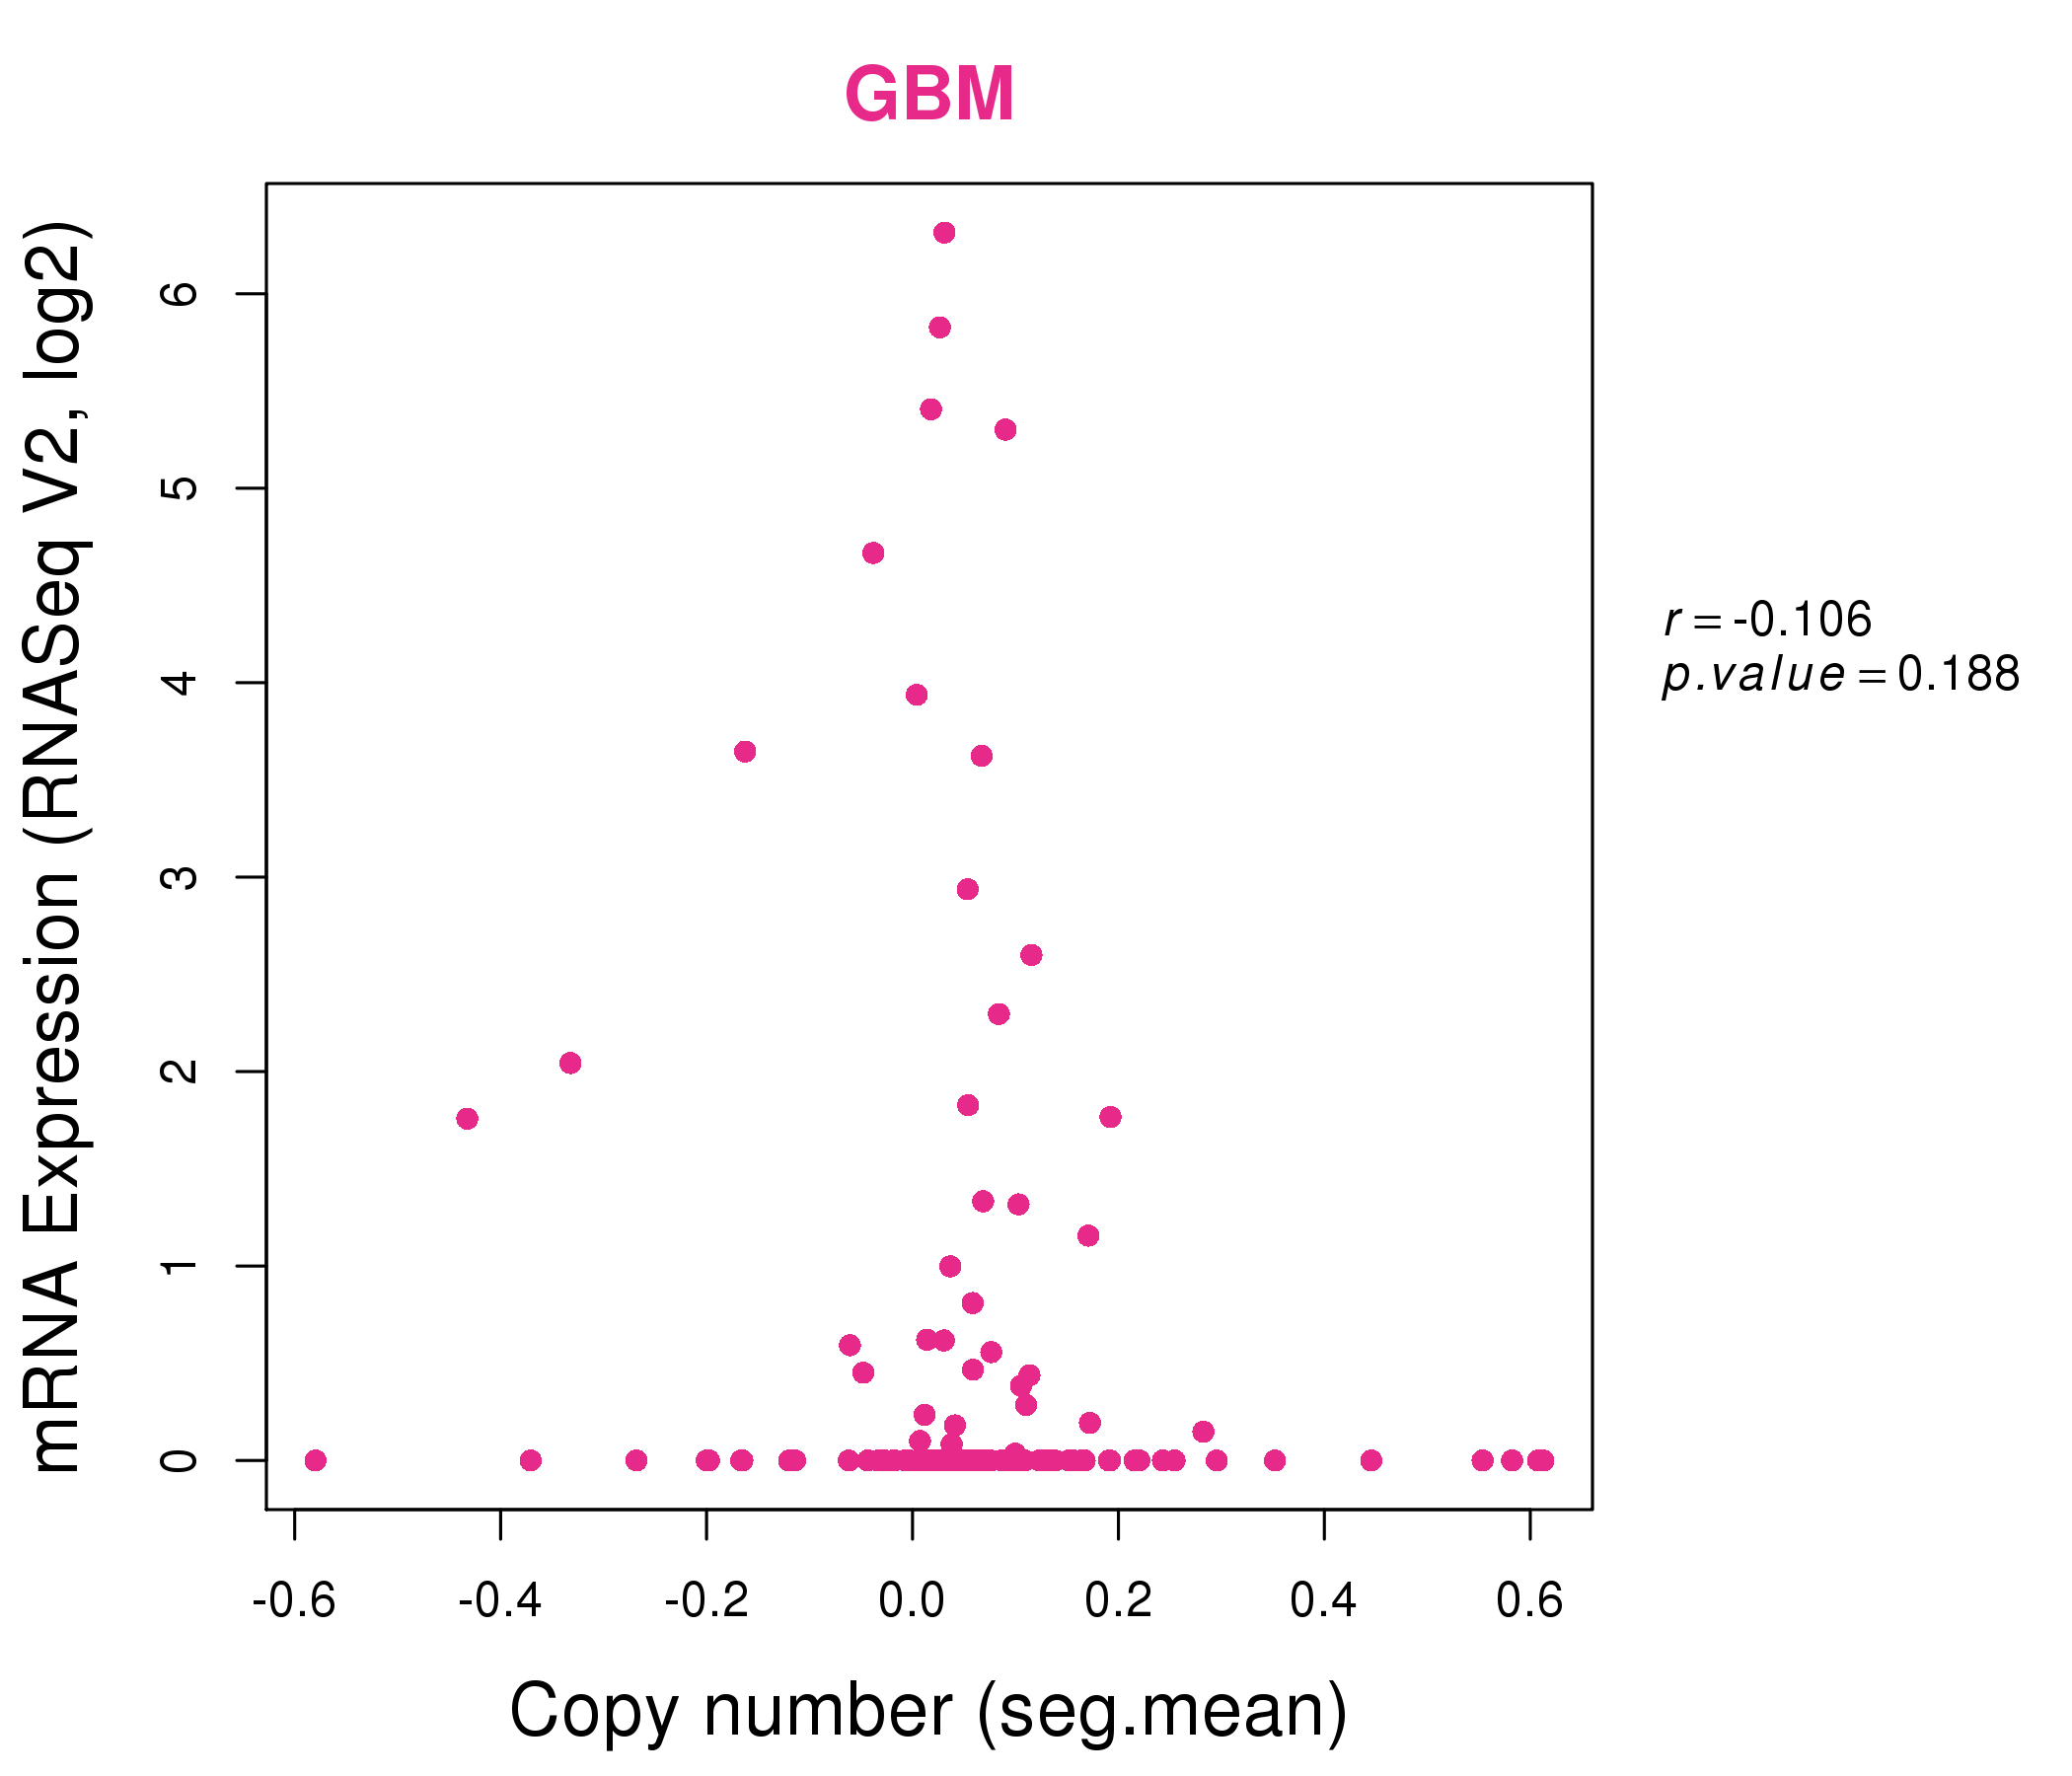
| * This plots show the correlation between CNV and gene expression. |
: Open all plots for all cancer types
 |
|
 |
|
| Top |
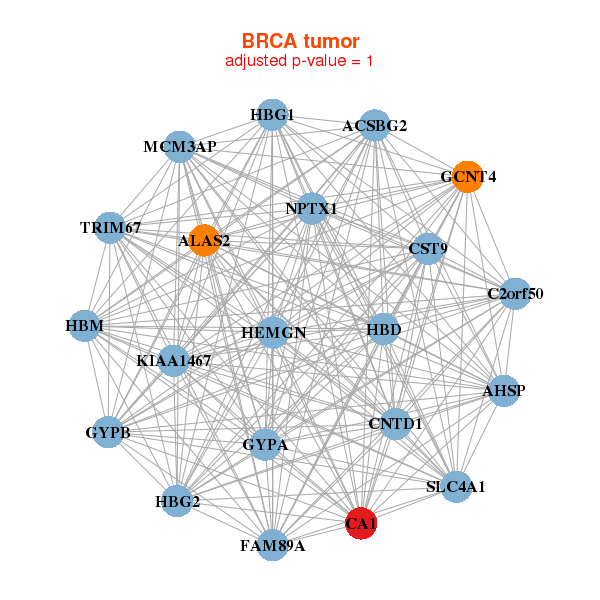
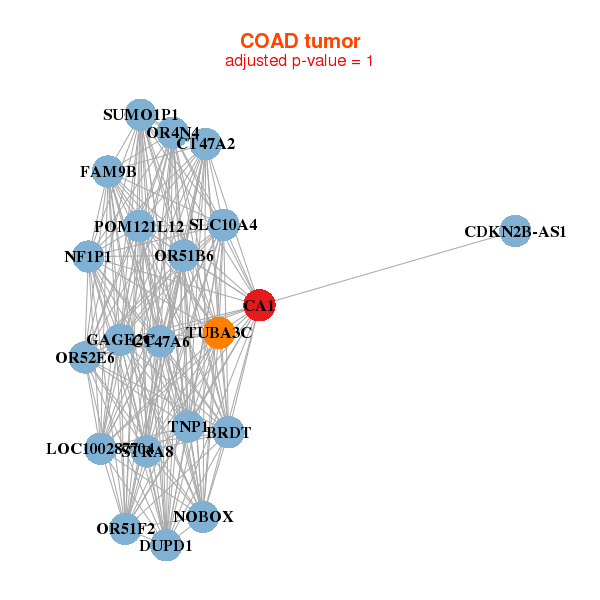
| Gene-Gene Network Information |
| * Co-Expression network figures were drawn using R package igraph. Only the top 20 genes with the highest correlations were shown. Red circle: input gene, orange circle: cell metabolism gene, sky circle: other gene |
: Open all plots for all cancer types
 |
| ||||
| ABHD12,ABHD14A,ADIRF,CA14,CYB5D2,DUSP15,EML2, FLJ45983,HPN,LOC100190938,LOC284276,NDUFS8,NHLRC4,NPRL2, OR5M3,OR5M8,OR5R1,P4HTM,SERPINI1,SFXN2,TEX264 | RBFOX1,AMPD1,ANKRD23,ASB16,ASB4,ASB5,CA14, CACNG1,CALML6,CAPN3,CLCN1,CMYA5,FITM1,JPH1, MYOZ3,OBSCN,PFKM,RYR1,SRPK3,TMEM38A,UCP3 | ||||
 |
| ||||
| ABCA7,ABCC11,ASIC3,ARMC7,CA14,CLCN1,CSTB, DGKA,DMBX1,ENDOV,KIF14,LOC100131691,OR4C3,PRICKLE4, ROPN1B,RUSC1,SLC44A2,SLC45A3,SLC47A2,SNX24,TDRD12 | ASIC1,ARHGEF4,ATP1A2,BVES,NPR3,CA14,CAMK2G, DACT3,DNAJB5,KCTD8,KY,LDB3,MYOM1,PDLIM7, PLCD4,PNCK,PYGM,SMTN,TGFB1I1,THBS4,TPM2 |
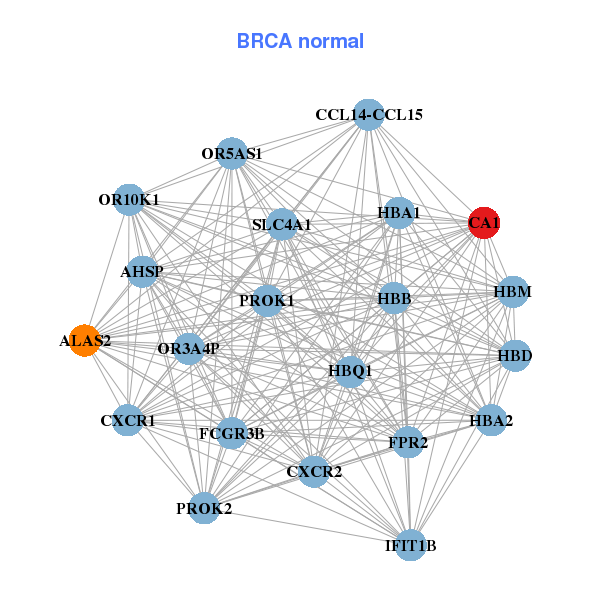

| * Co-Expression network figures were drawn using R package igraph. Only the top 20 genes with the highest correlations were shown. Red circle: input gene, orange circle: cell metabolism gene, sky circle: other gene |
: Open all plots for all cancer types
| Top |
: Open all interacting genes' information including KEGG pathway for all interacting genes from DAVID
| Top |
| Pharmacological Information for CA1 |
| DB Category | DB Name | DB's ID and Url link |
| * Gene Centered Interaction Network. |
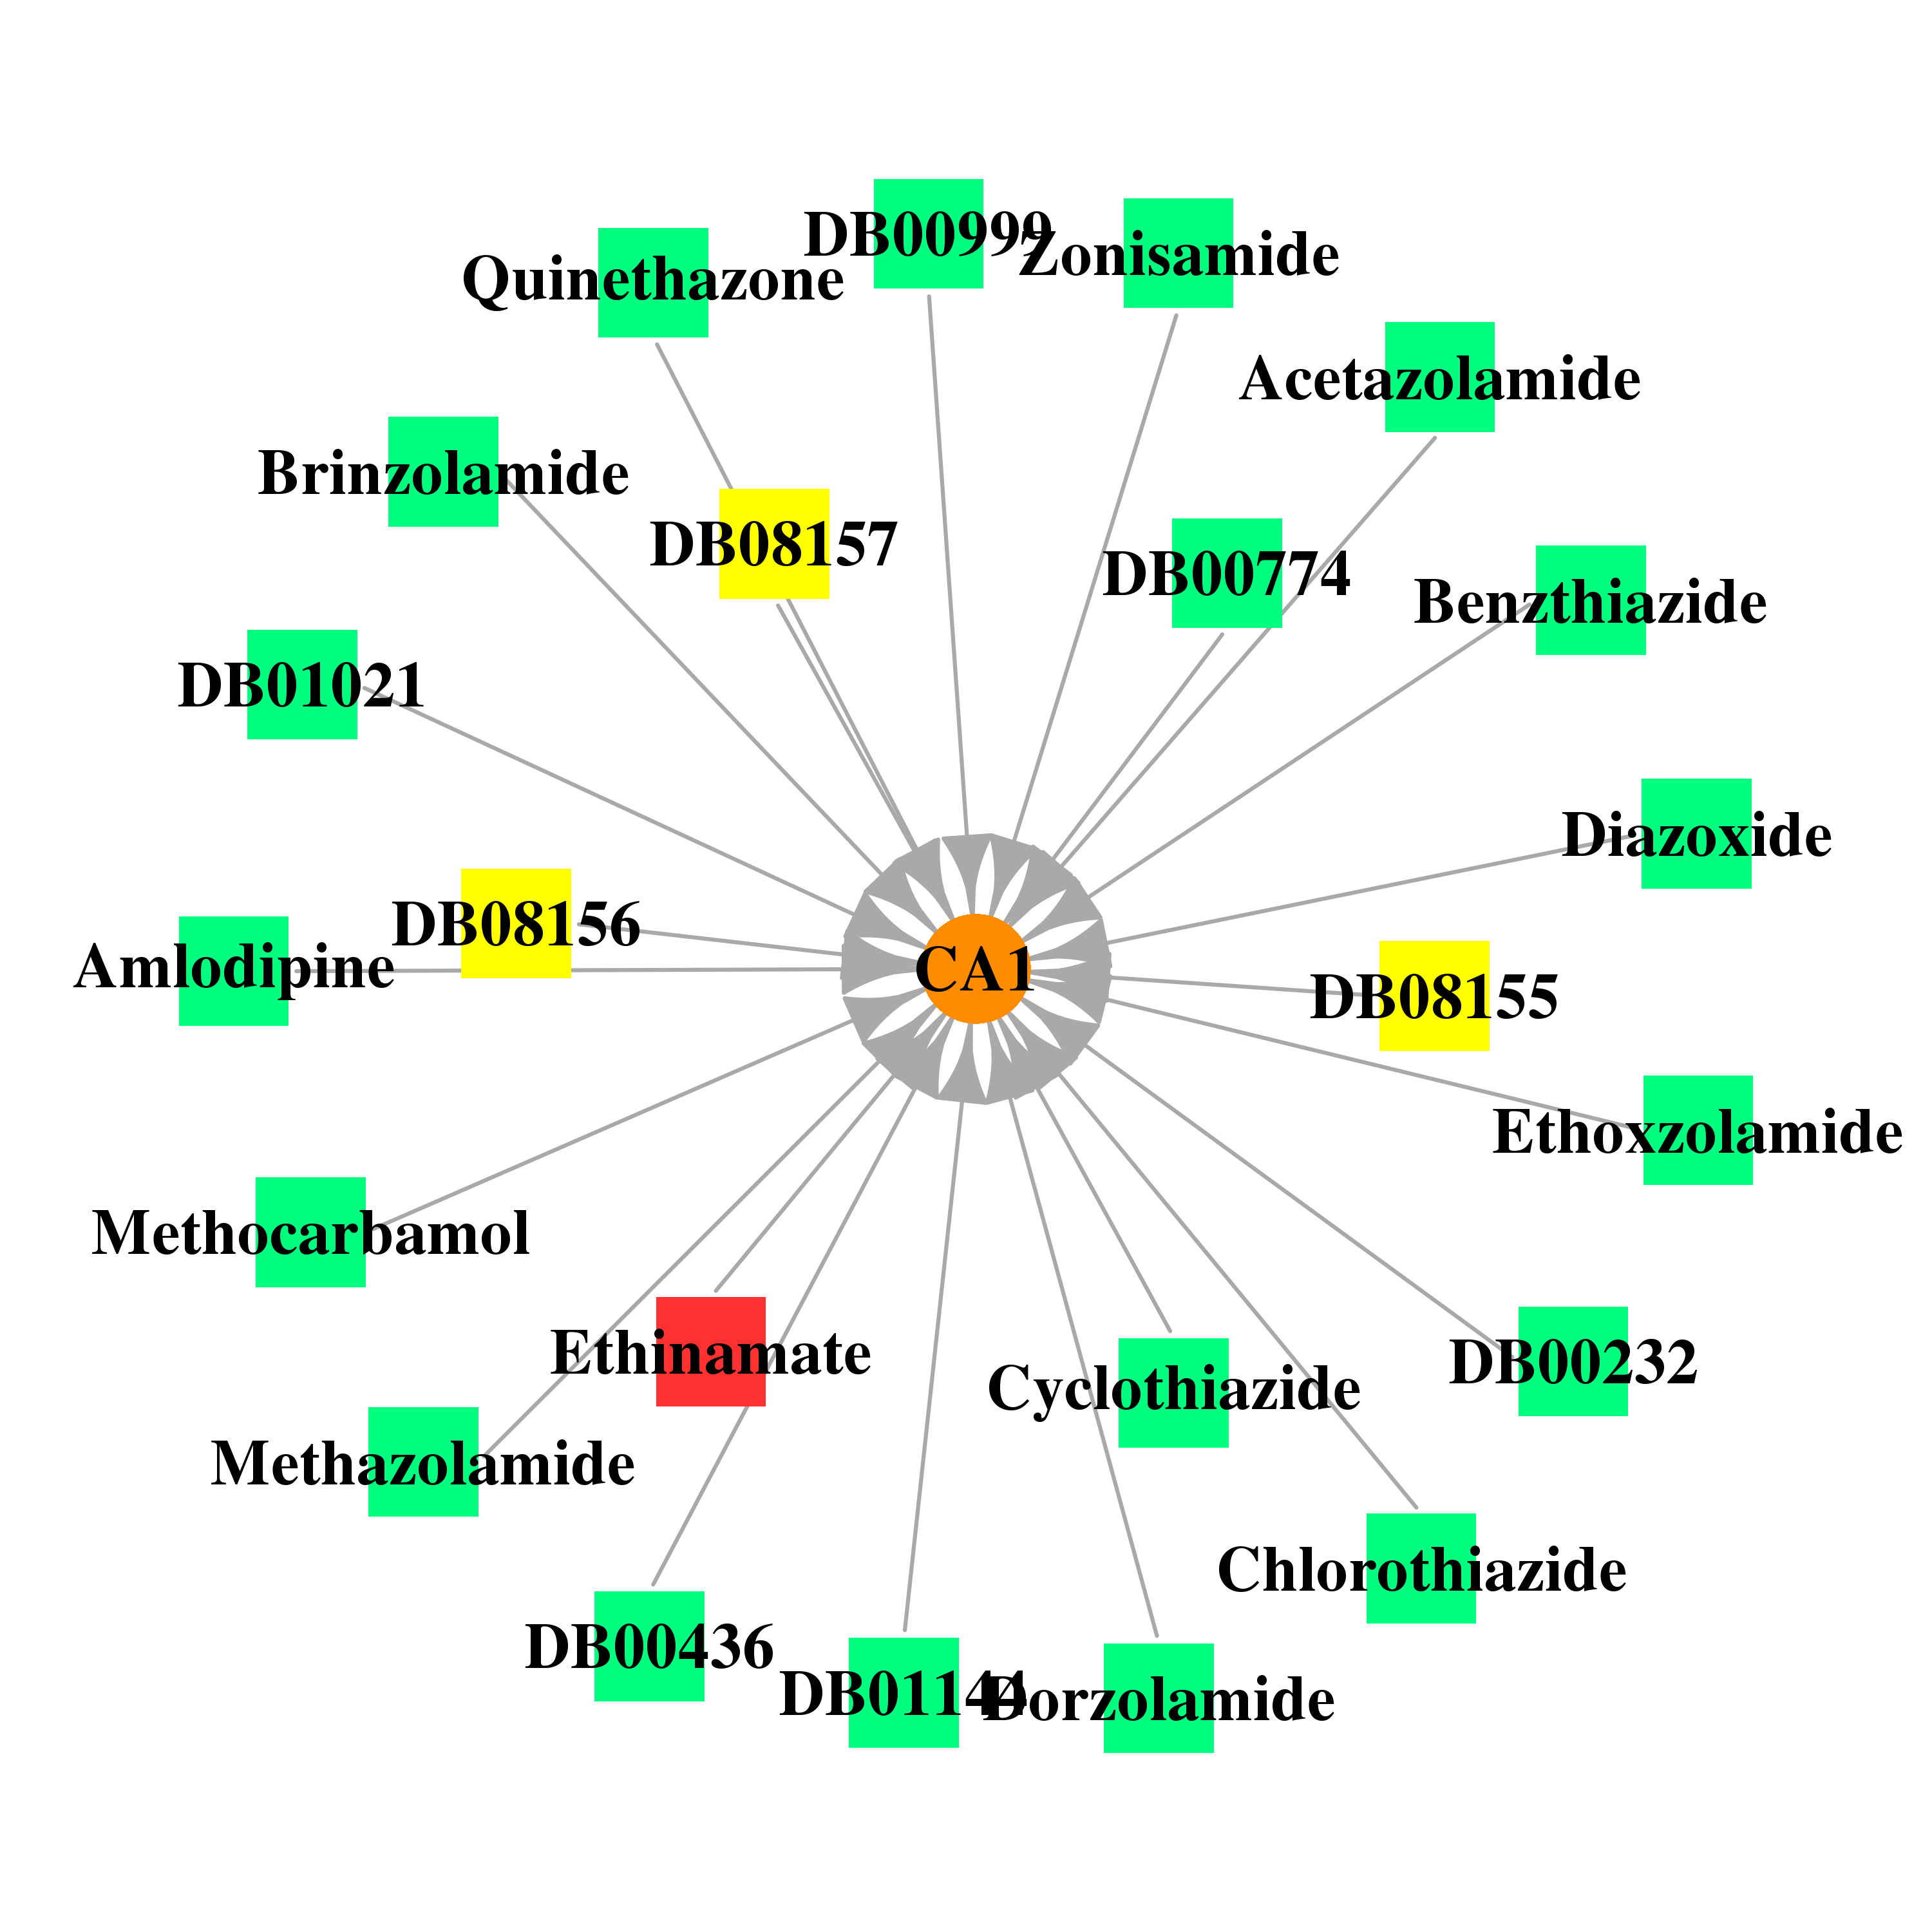 |
| * Drug Centered Interaction Network. |
| DrugBank ID | Target Name | Drug Groups | Generic Name | Drug Centered Network | Drug Structure |
| DB00232 | carbonic anhydrase I | approved | Methyclothiazide | 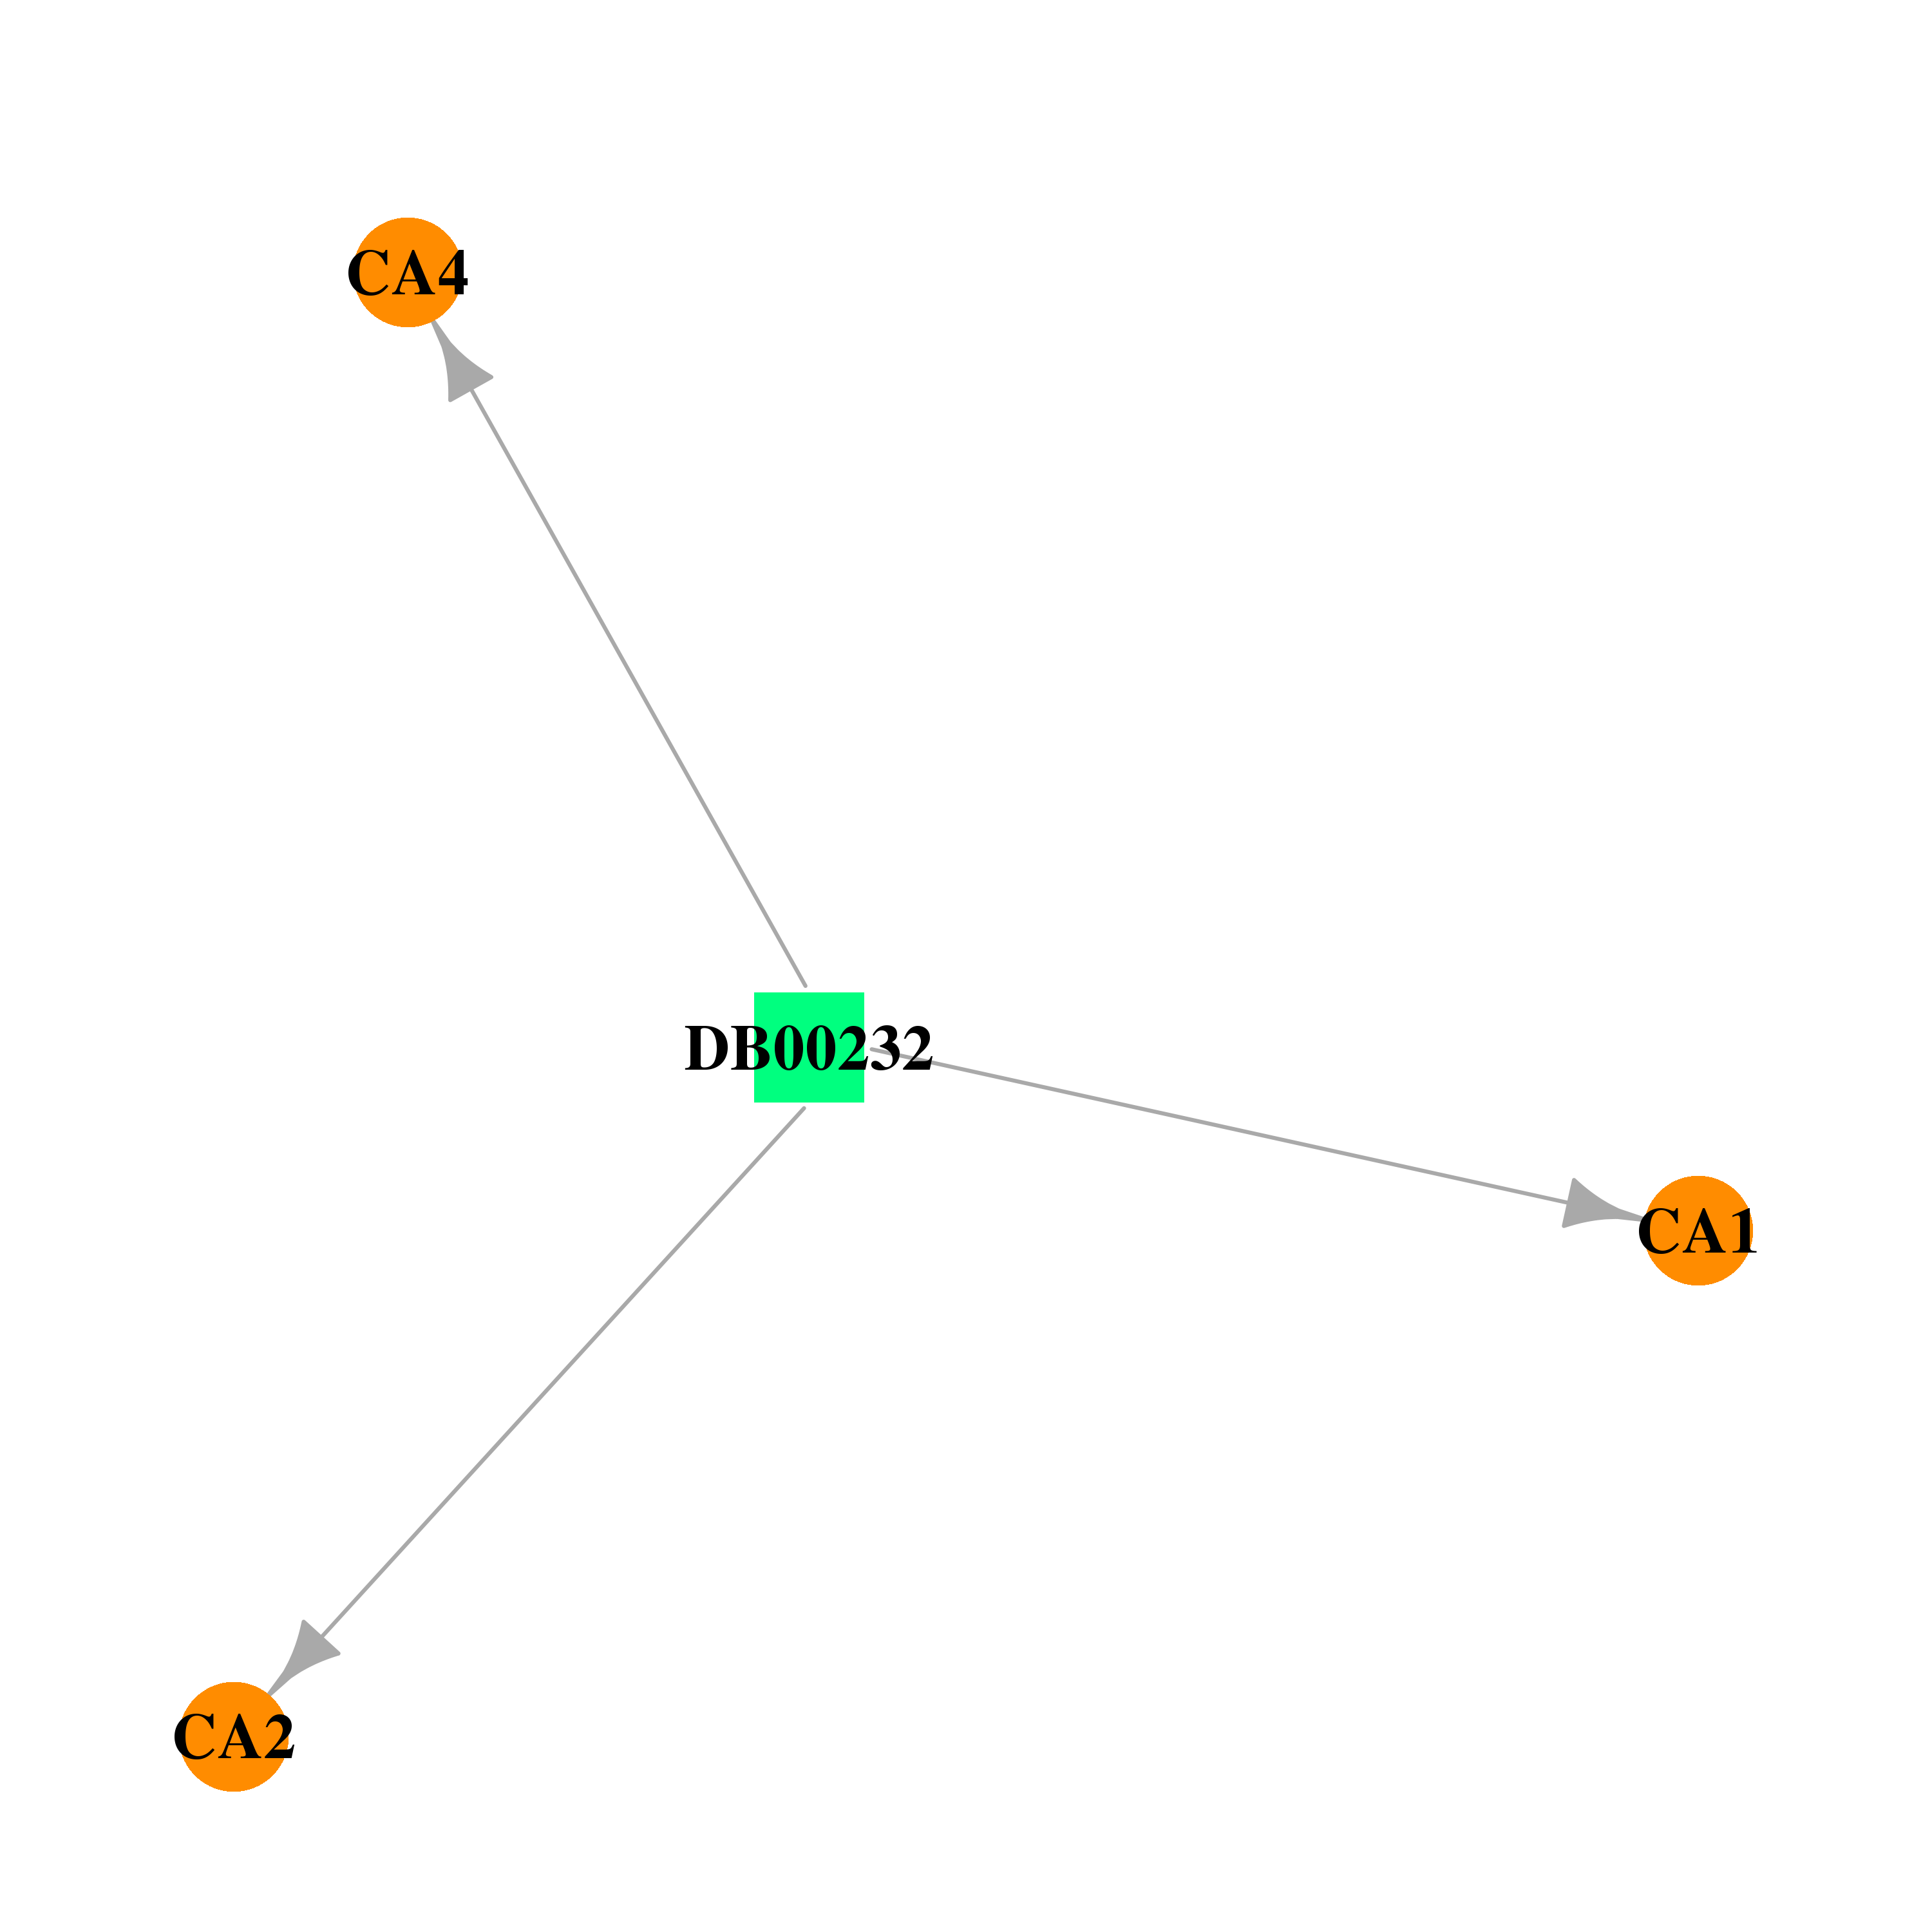 |  |
| DB00311 | carbonic anhydrase I | approved | Ethoxzolamide |  |  |
| DB00381 | carbonic anhydrase I | approved | Amlodipine |  |  |
| DB00423 | carbonic anhydrase I | approved | Methocarbamol |  |  |
| DB00436 | carbonic anhydrase I | approved | Bendroflumethiazide | 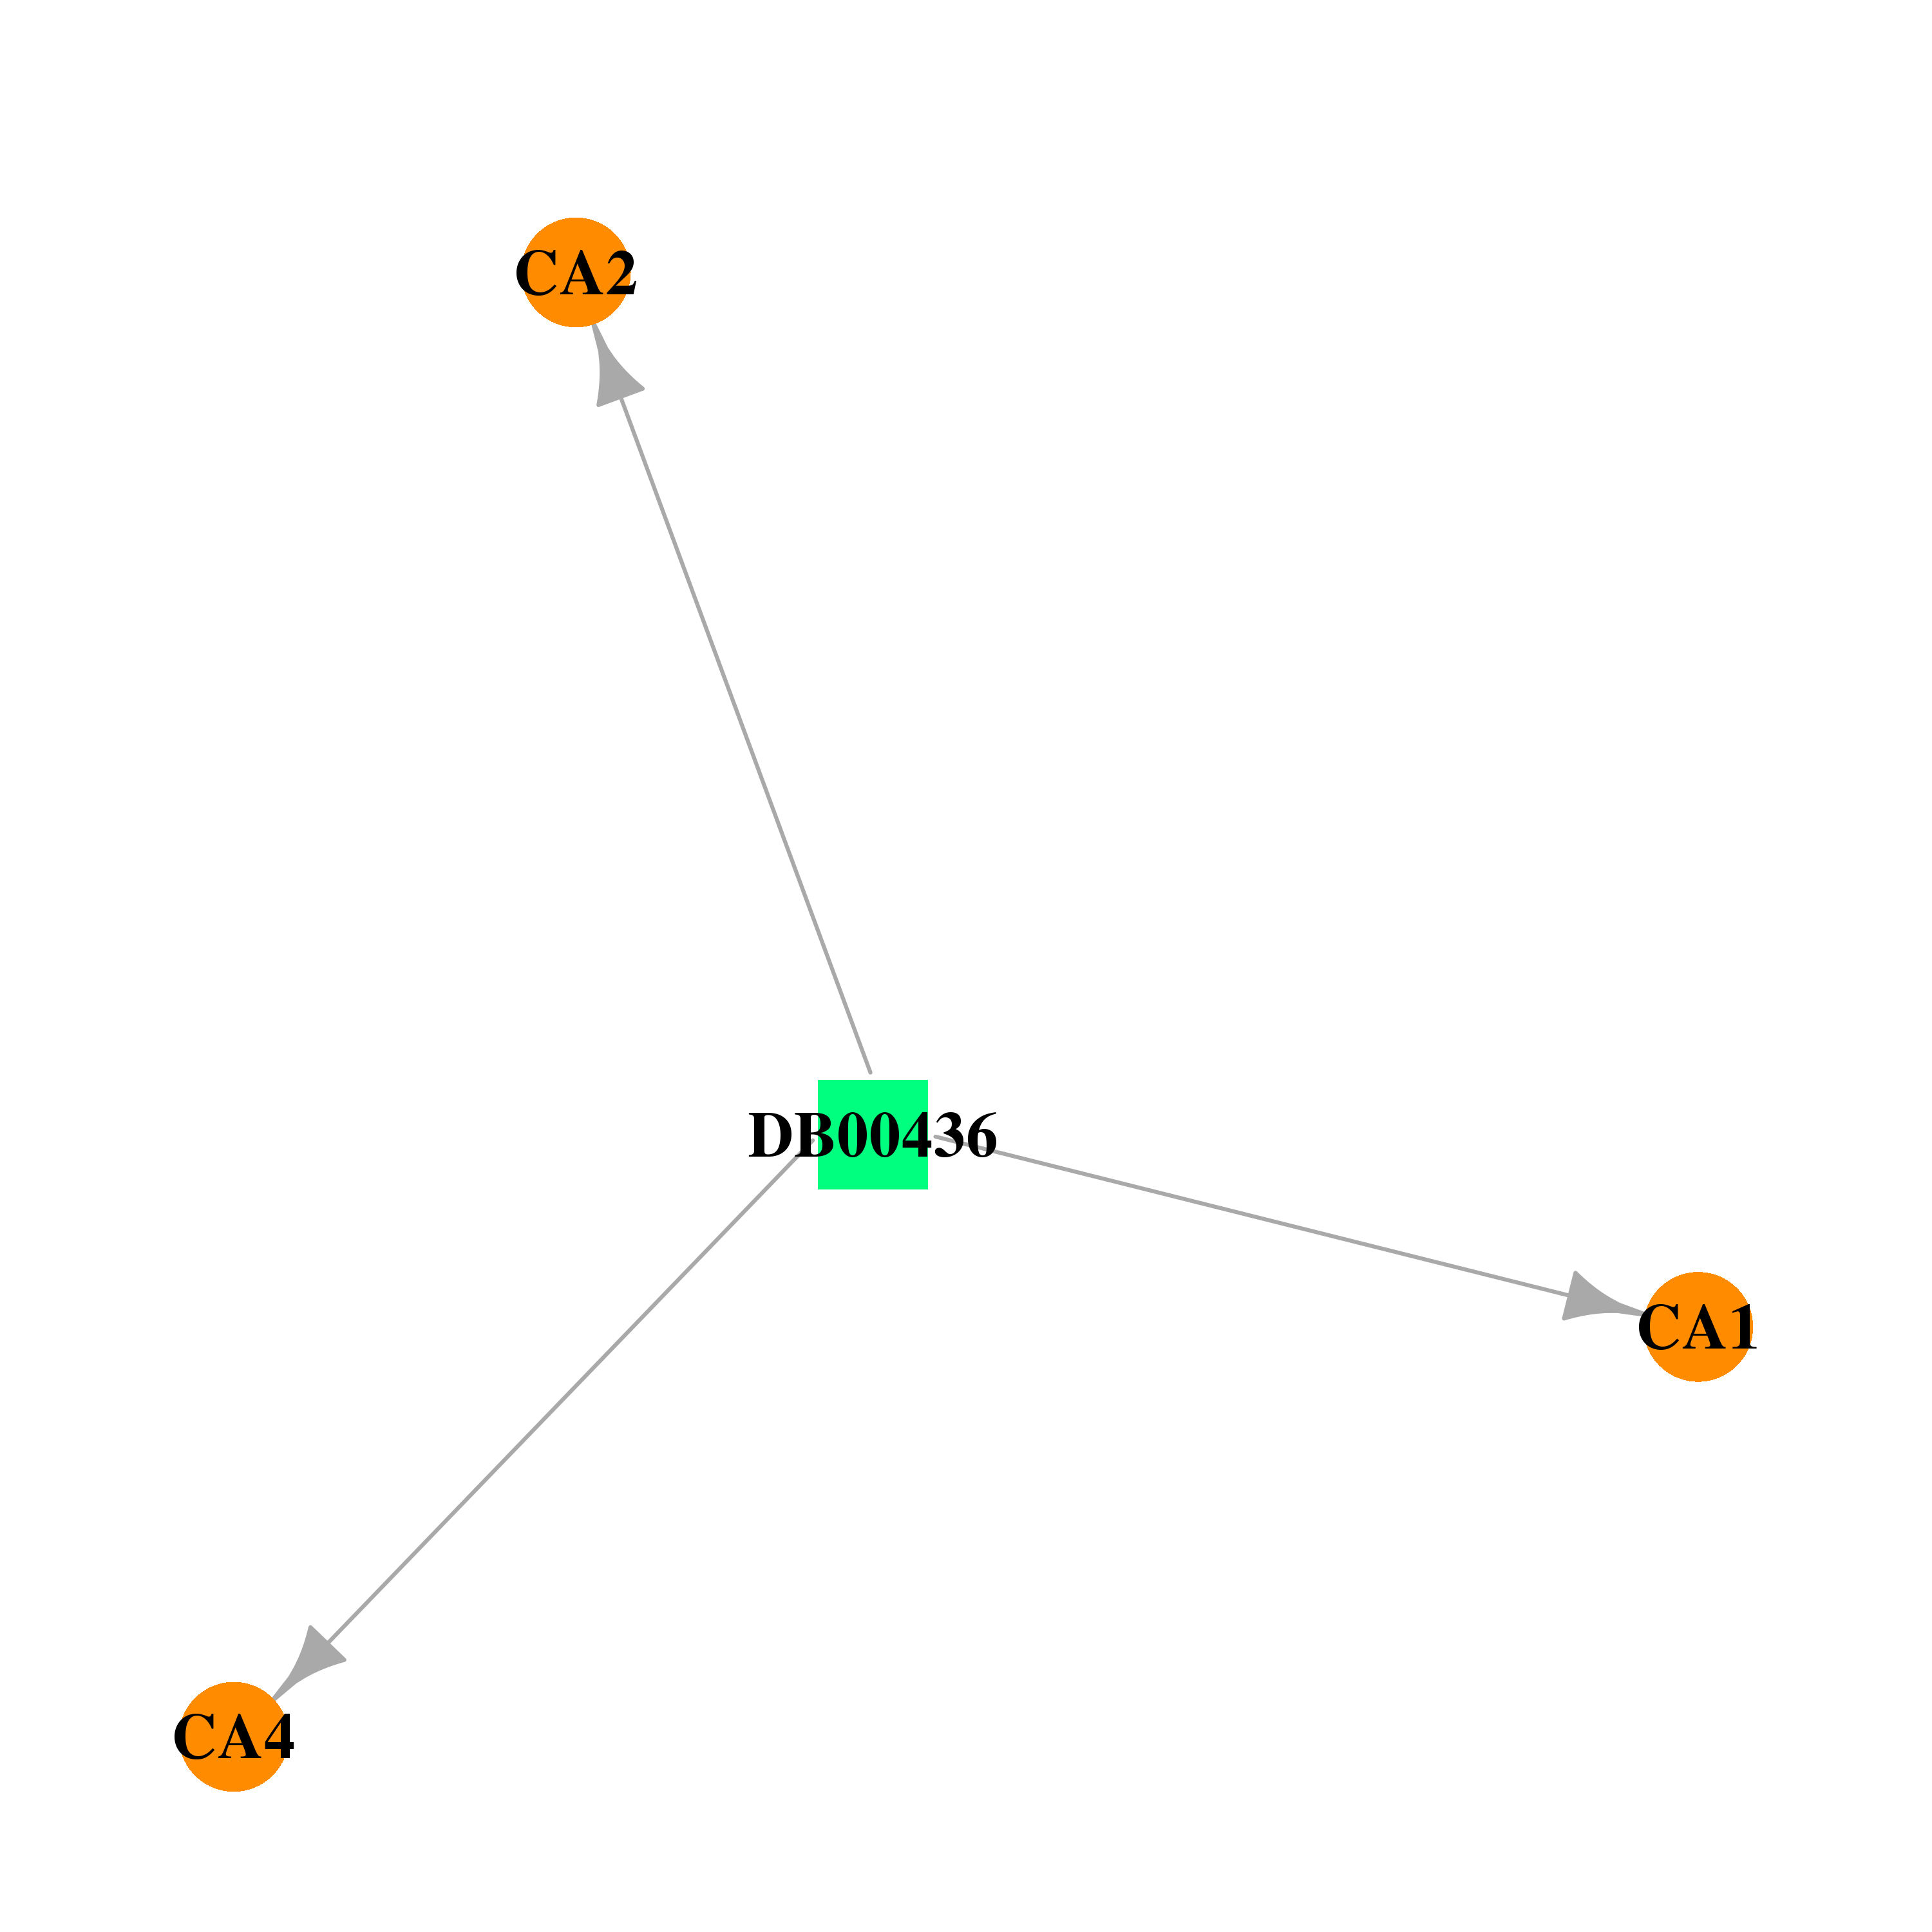 | 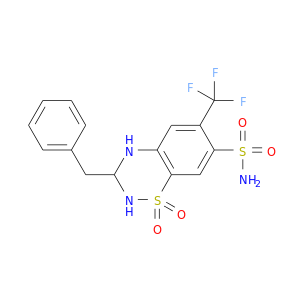 |
| DB00562 | carbonic anhydrase I | approved | Benzthiazide |  | 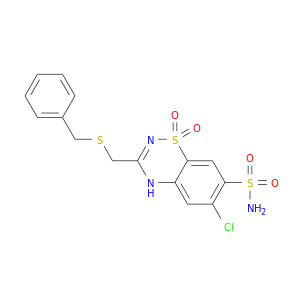 |
| DB00606 | carbonic anhydrase I | approved | Cyclothiazide | 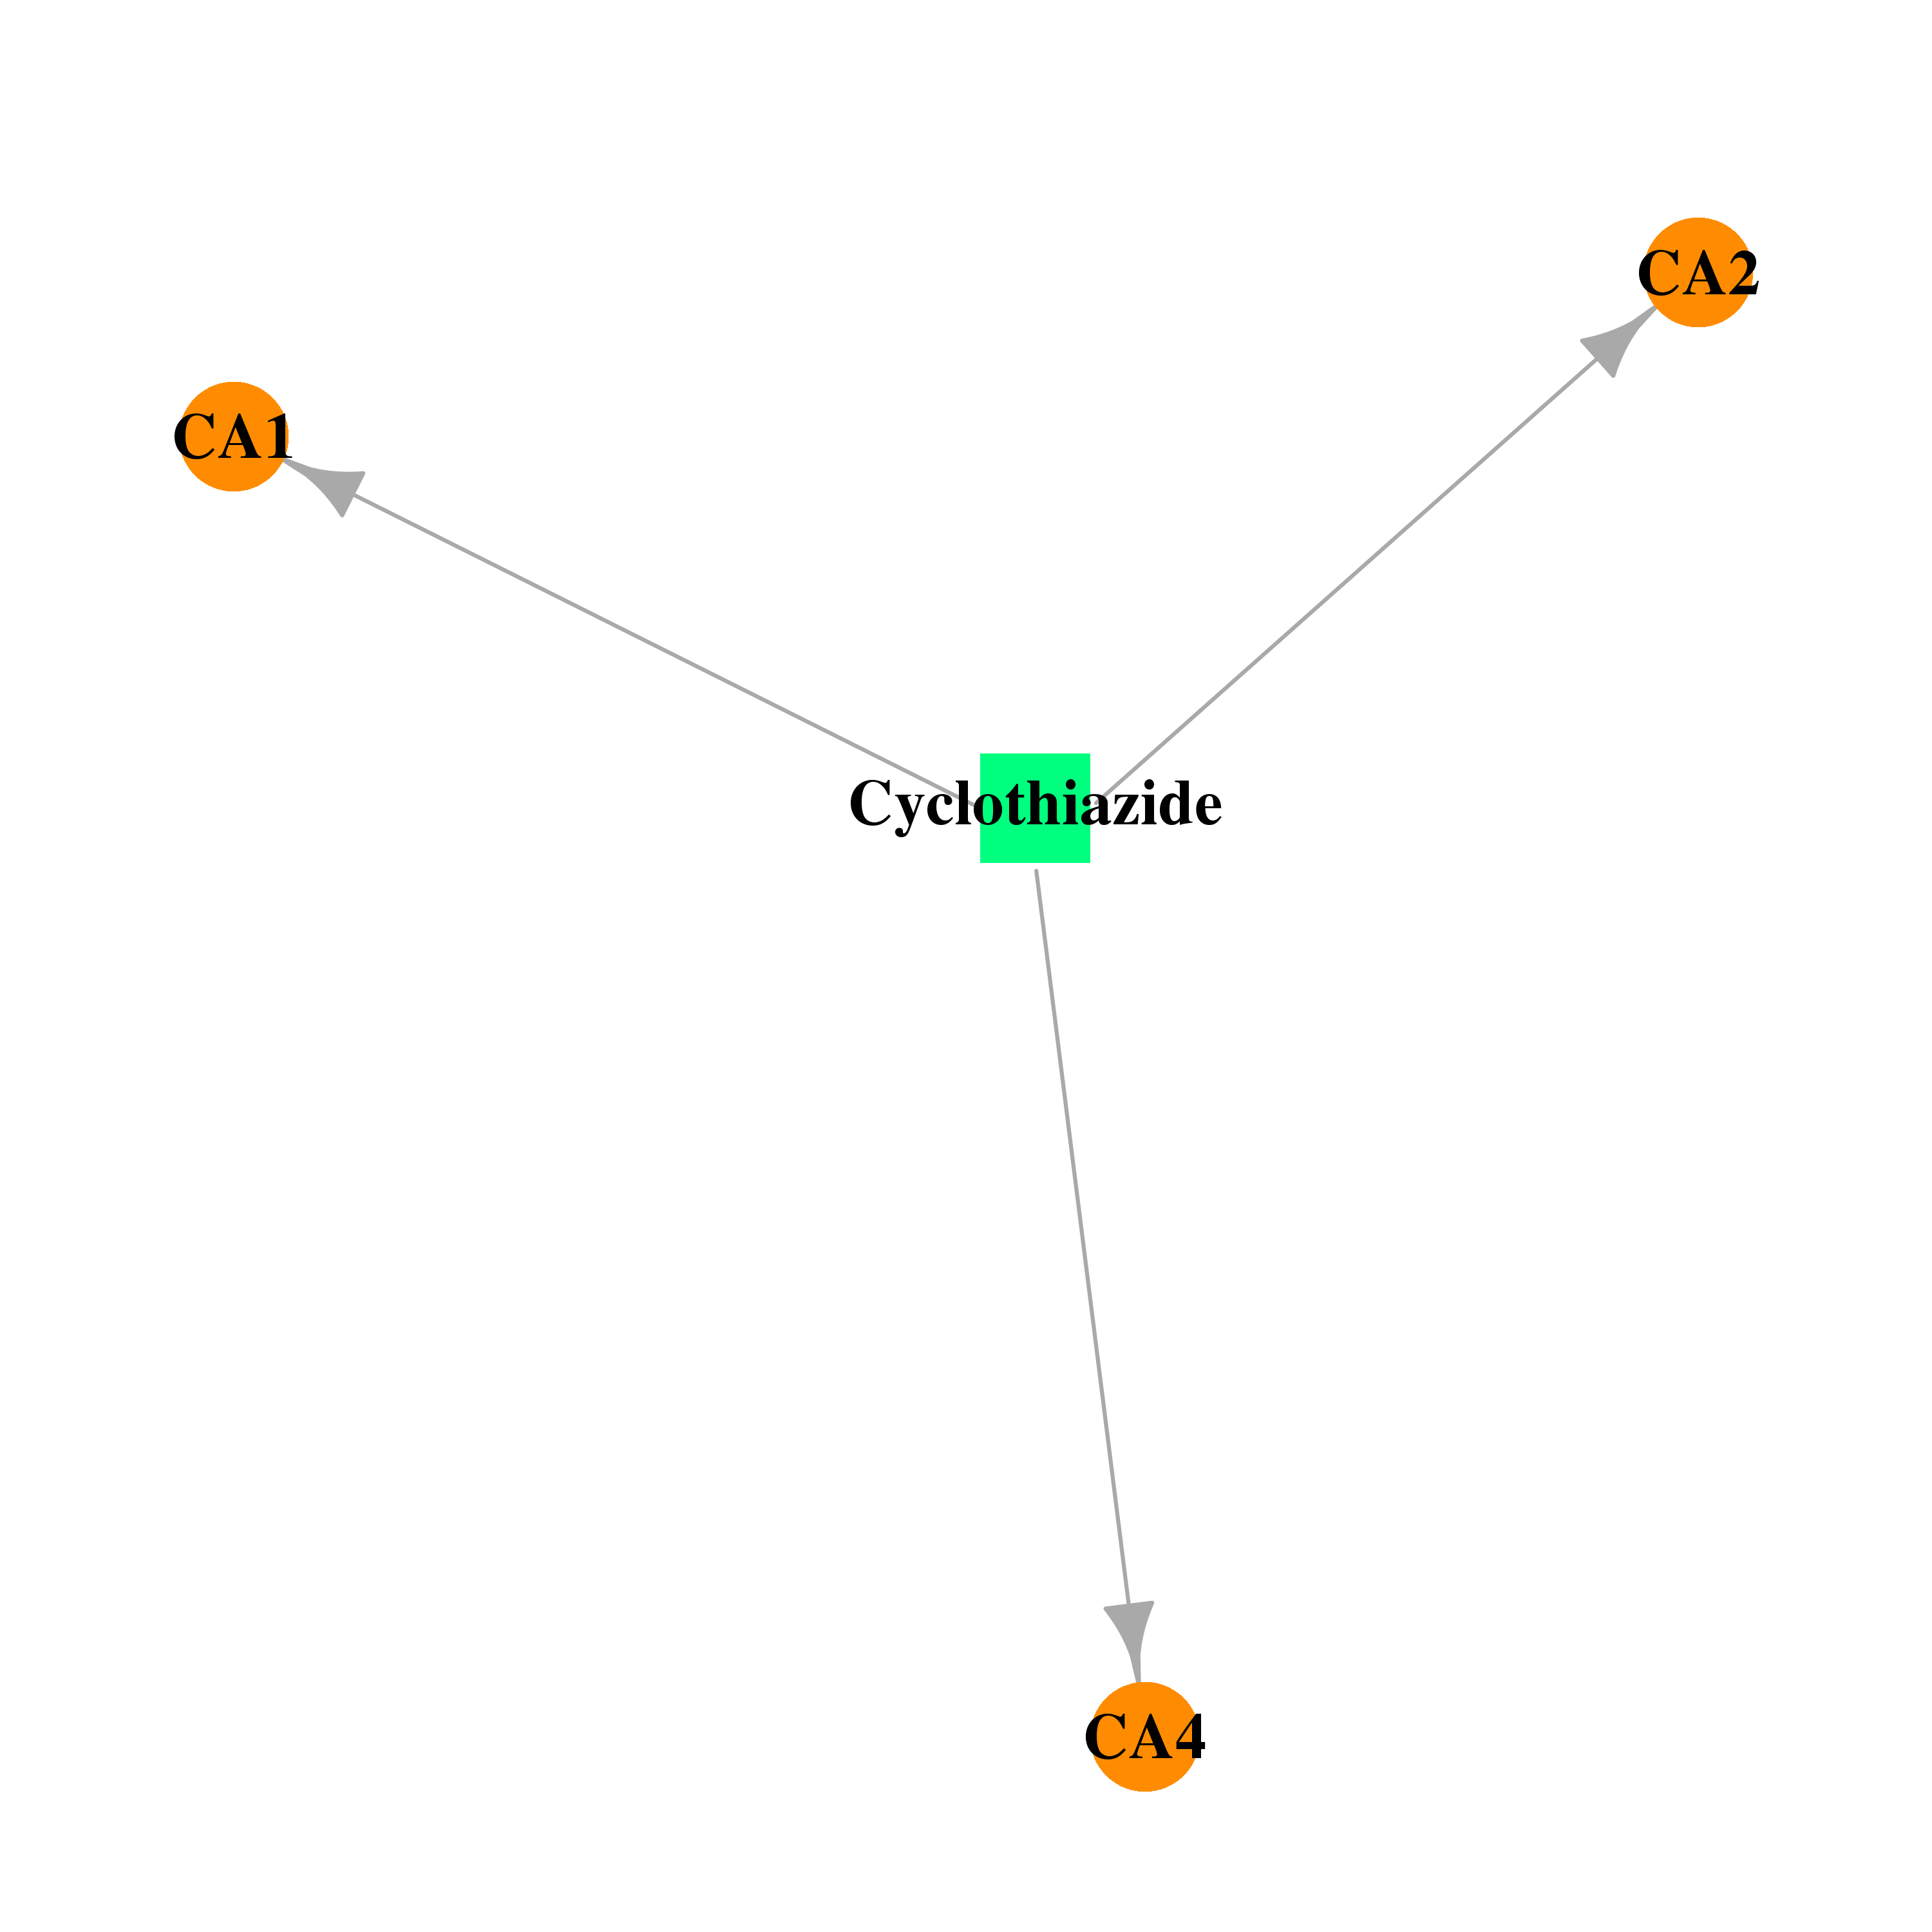 |  |
| DB00703 | carbonic anhydrase I | approved | Methazolamide | 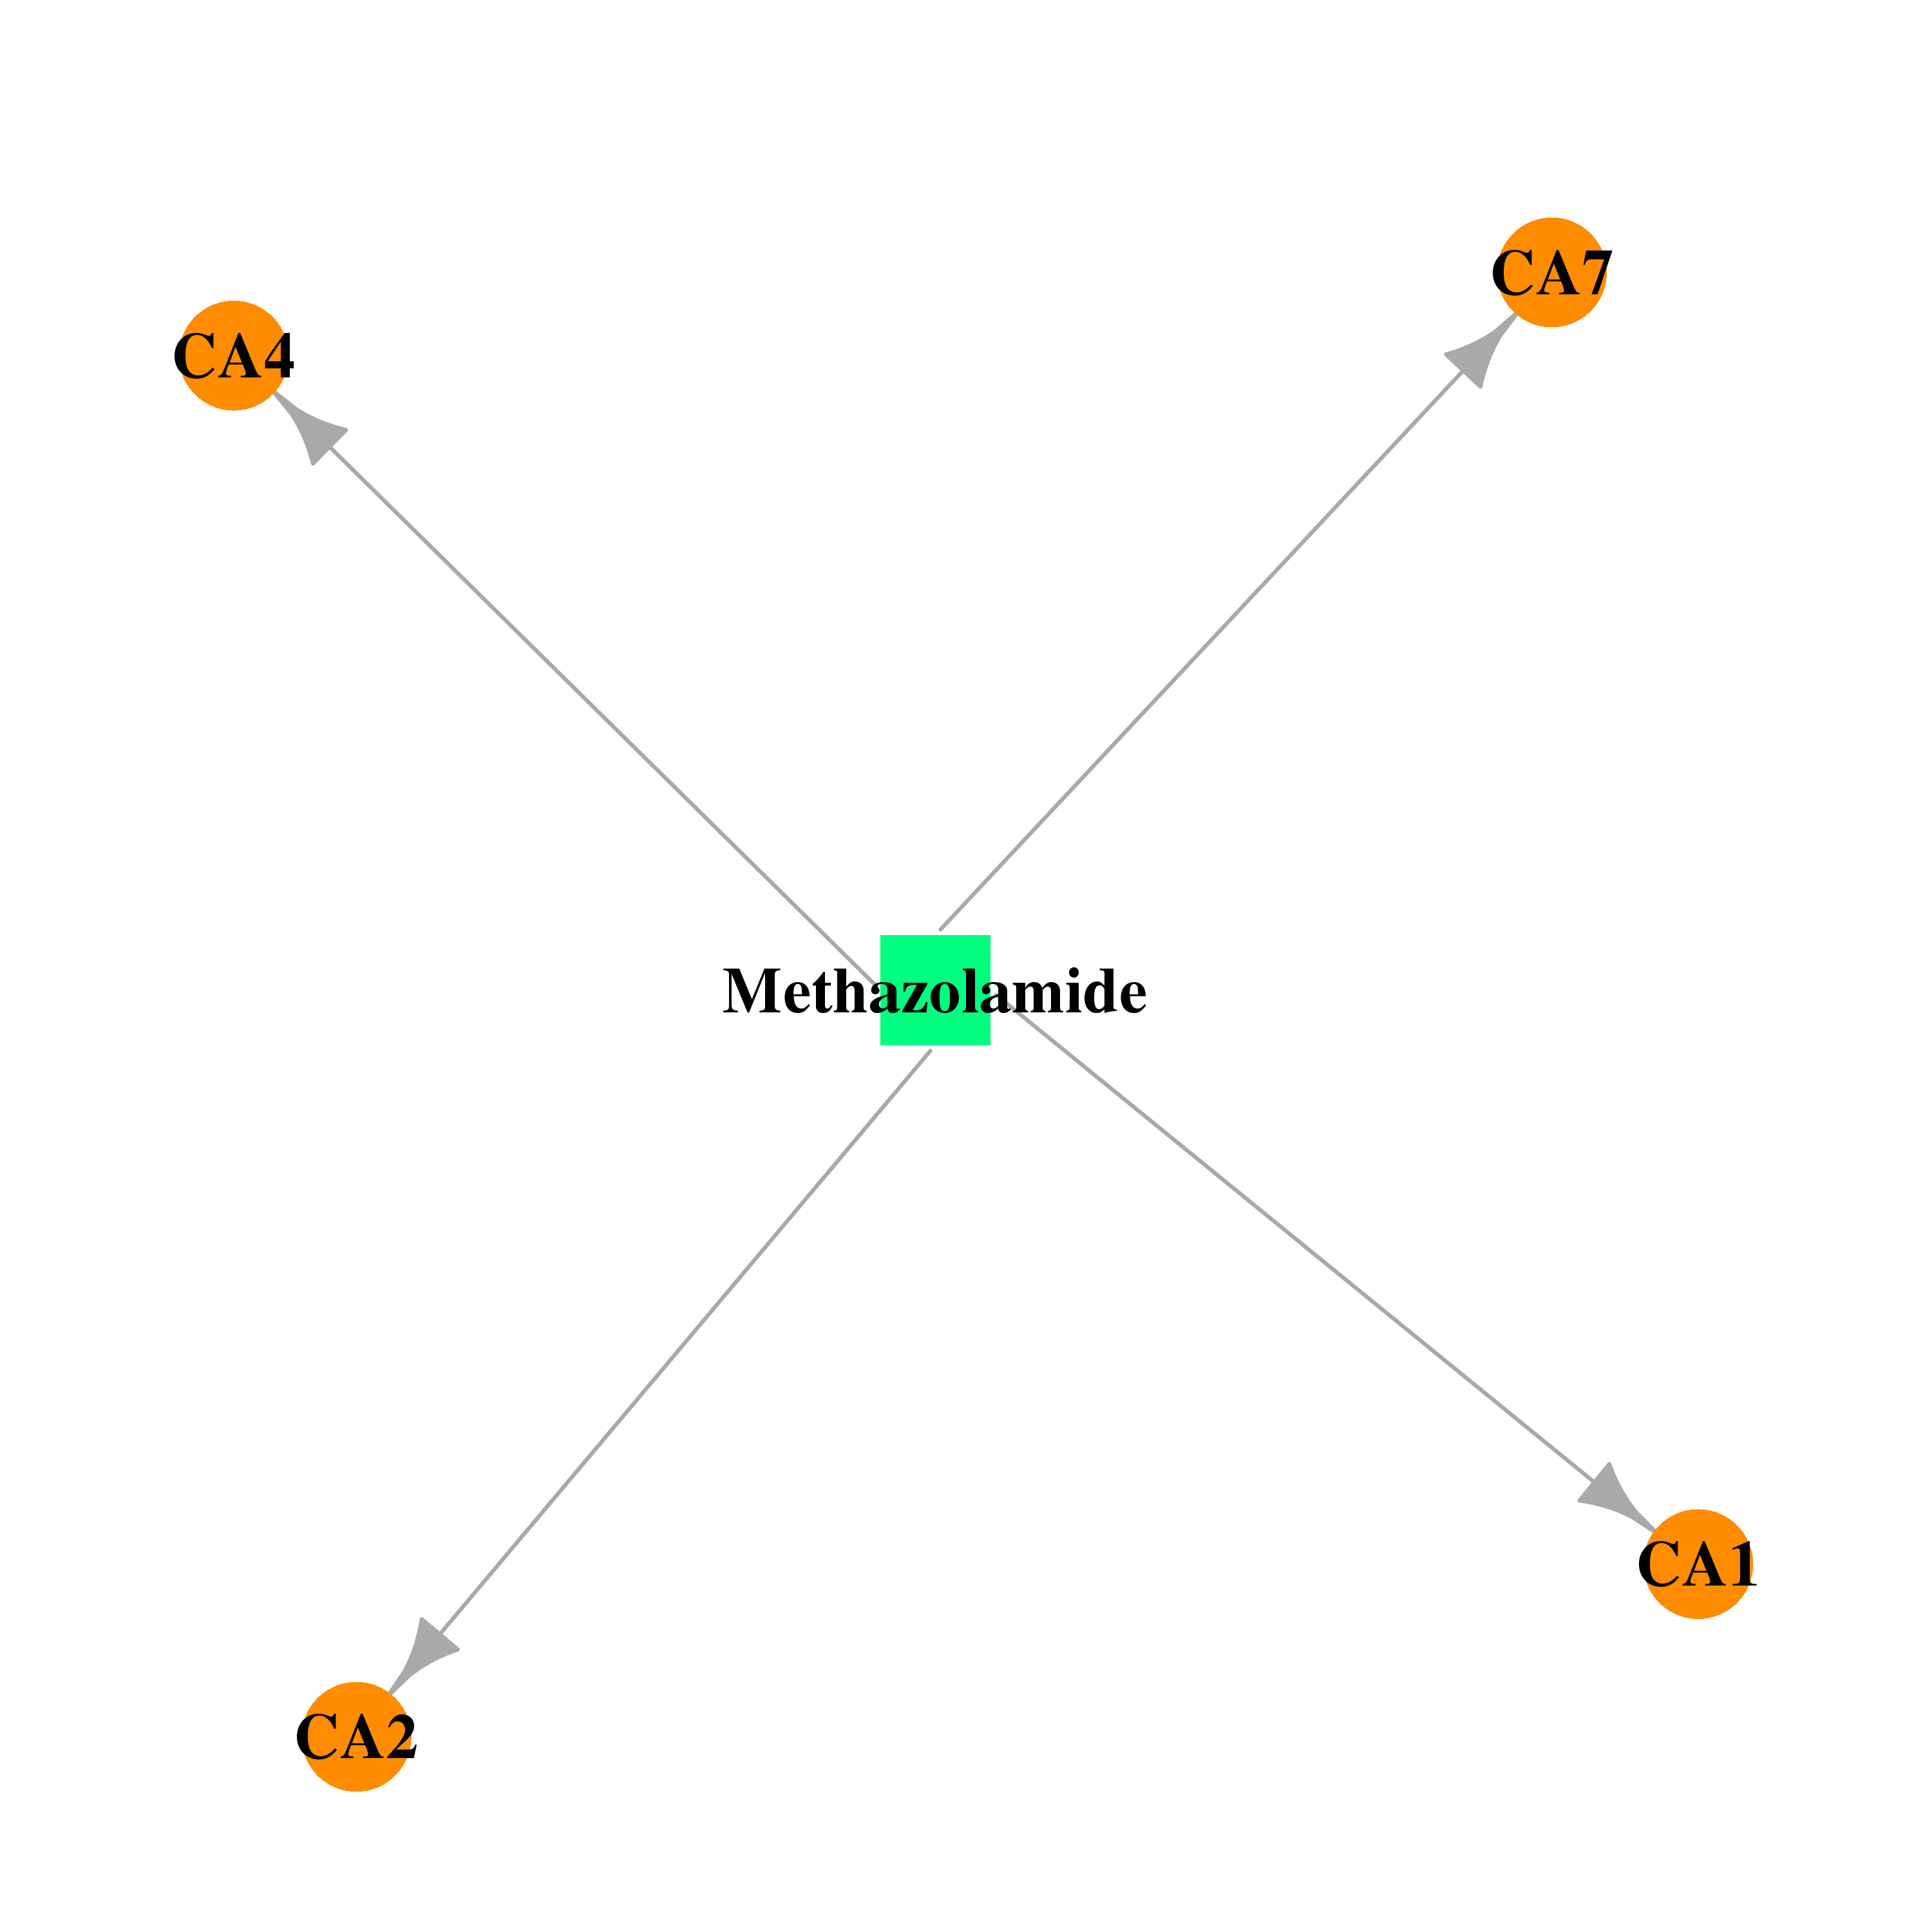 |  |
| DB00774 | carbonic anhydrase I | approved | Hydroflumethiazide | 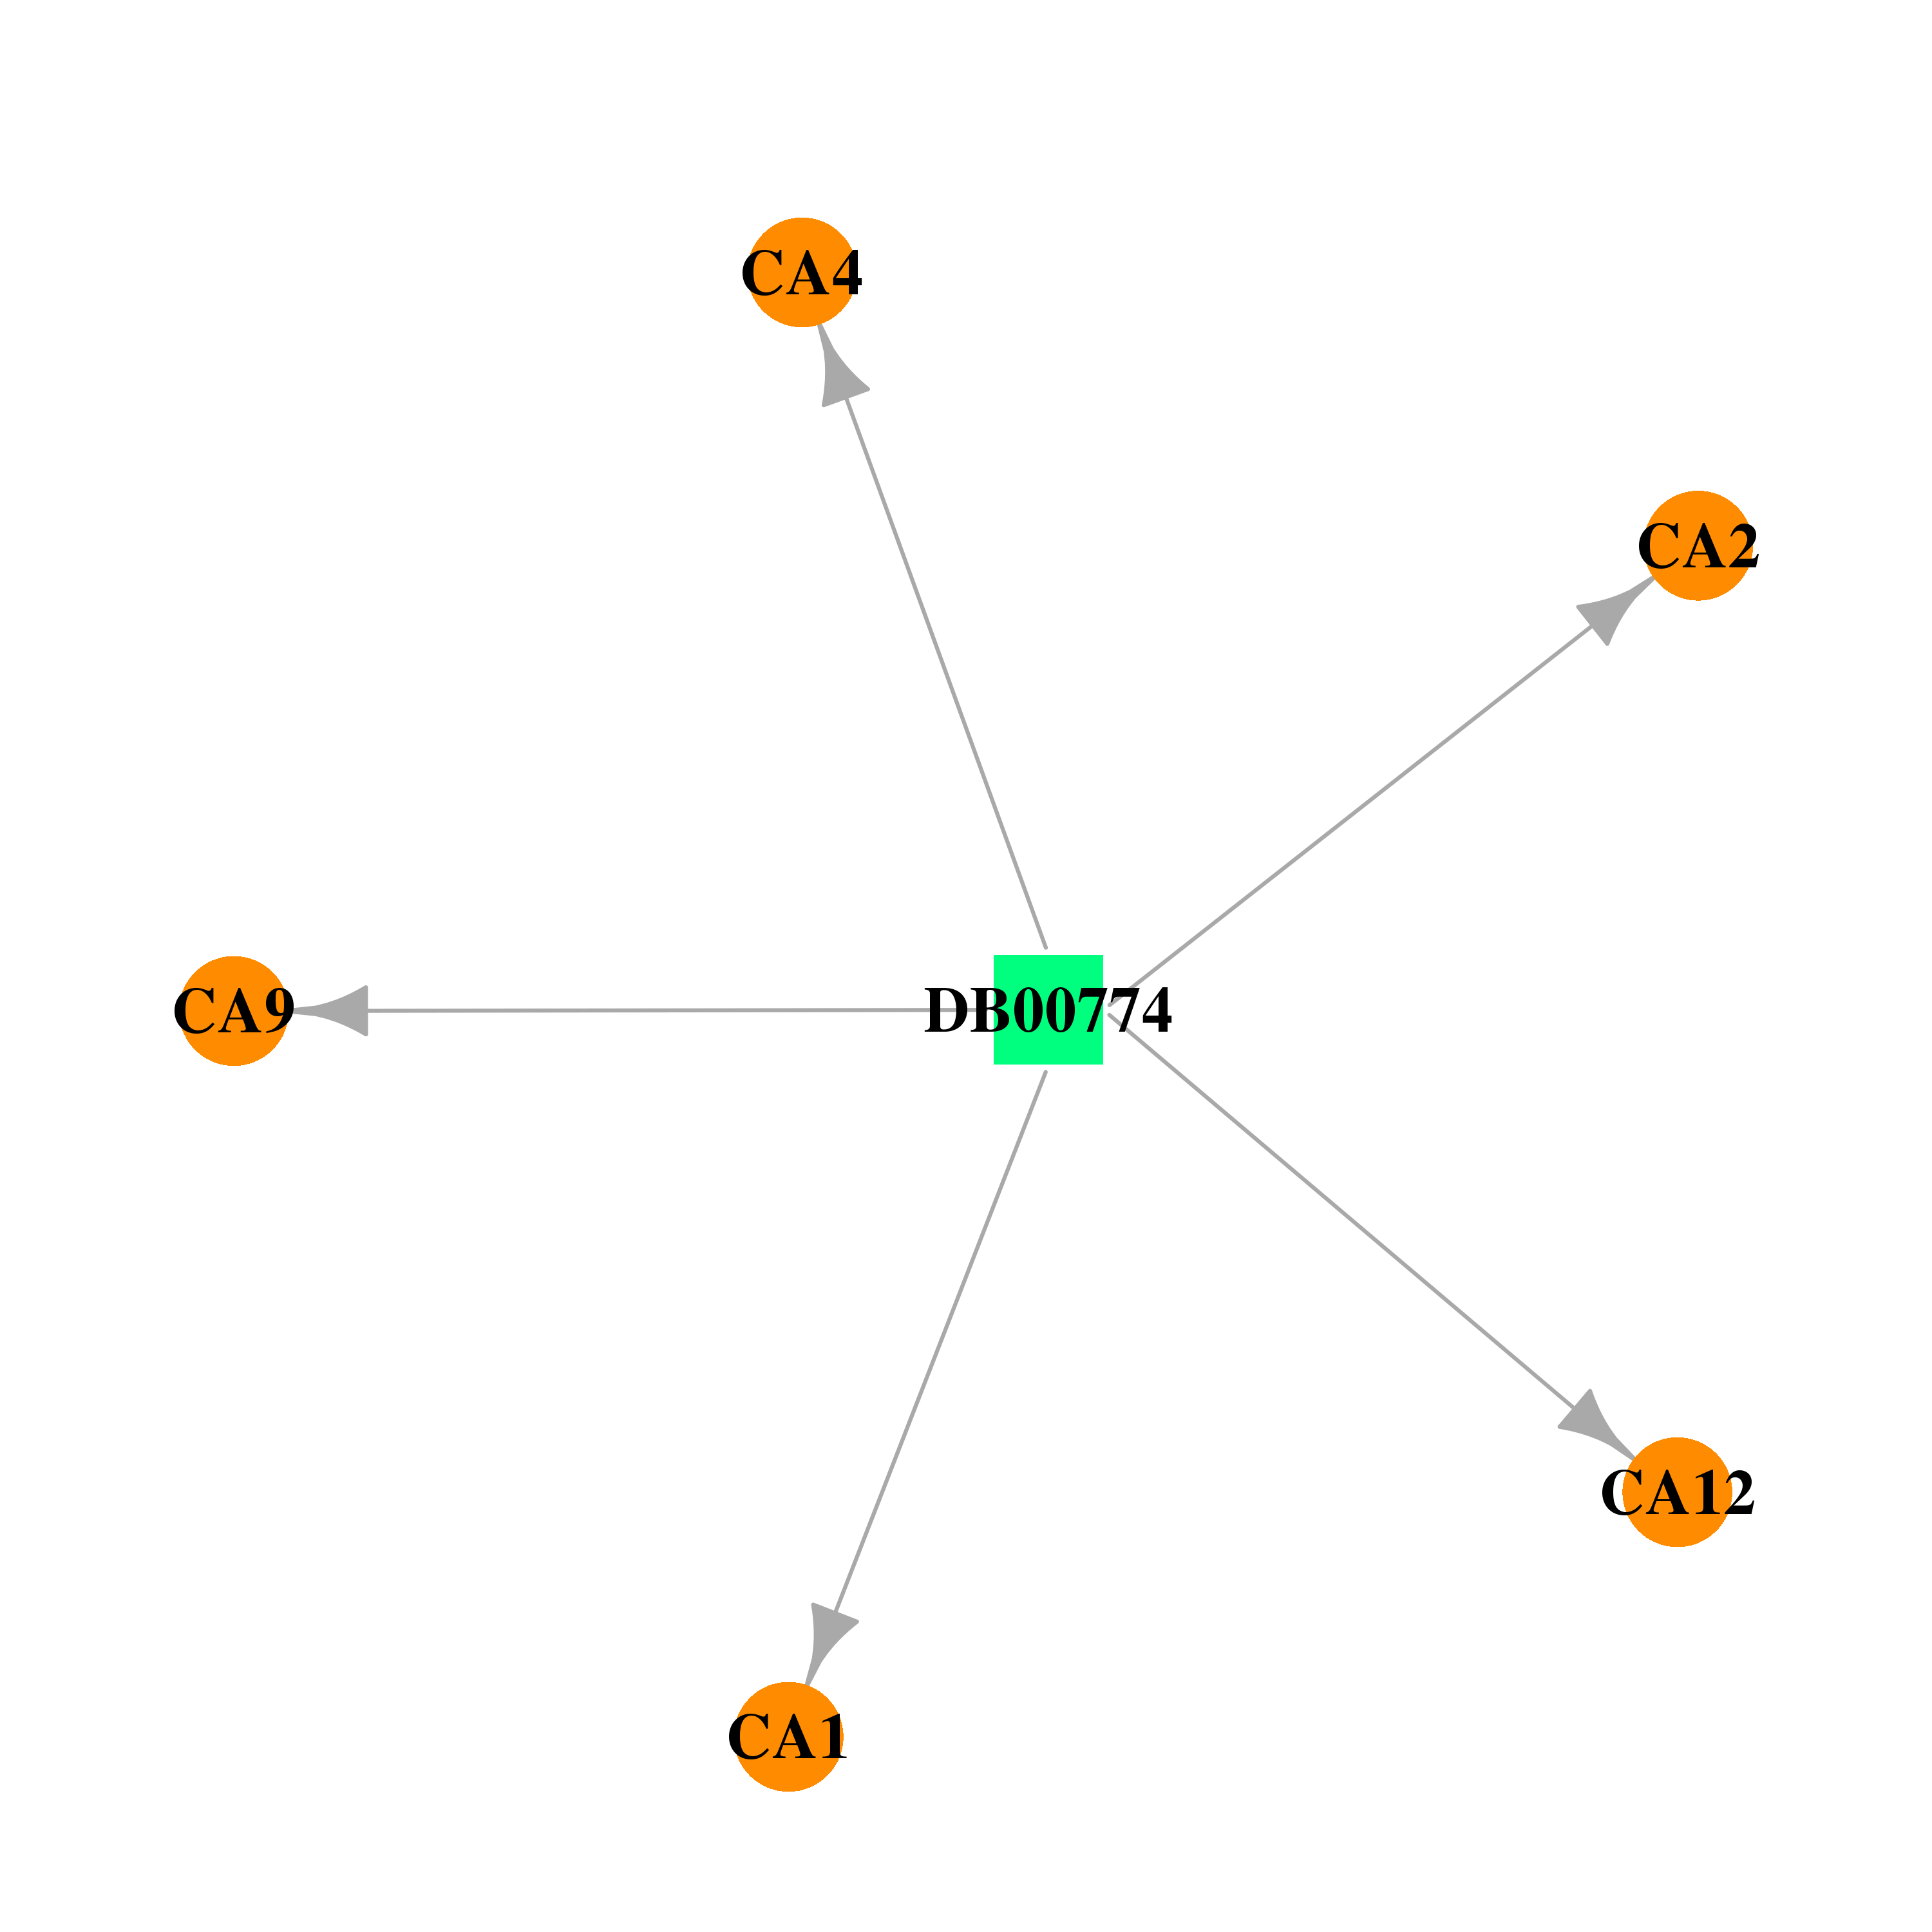 |  |
| DB00819 | carbonic anhydrase I | approved | Acetazolamide | 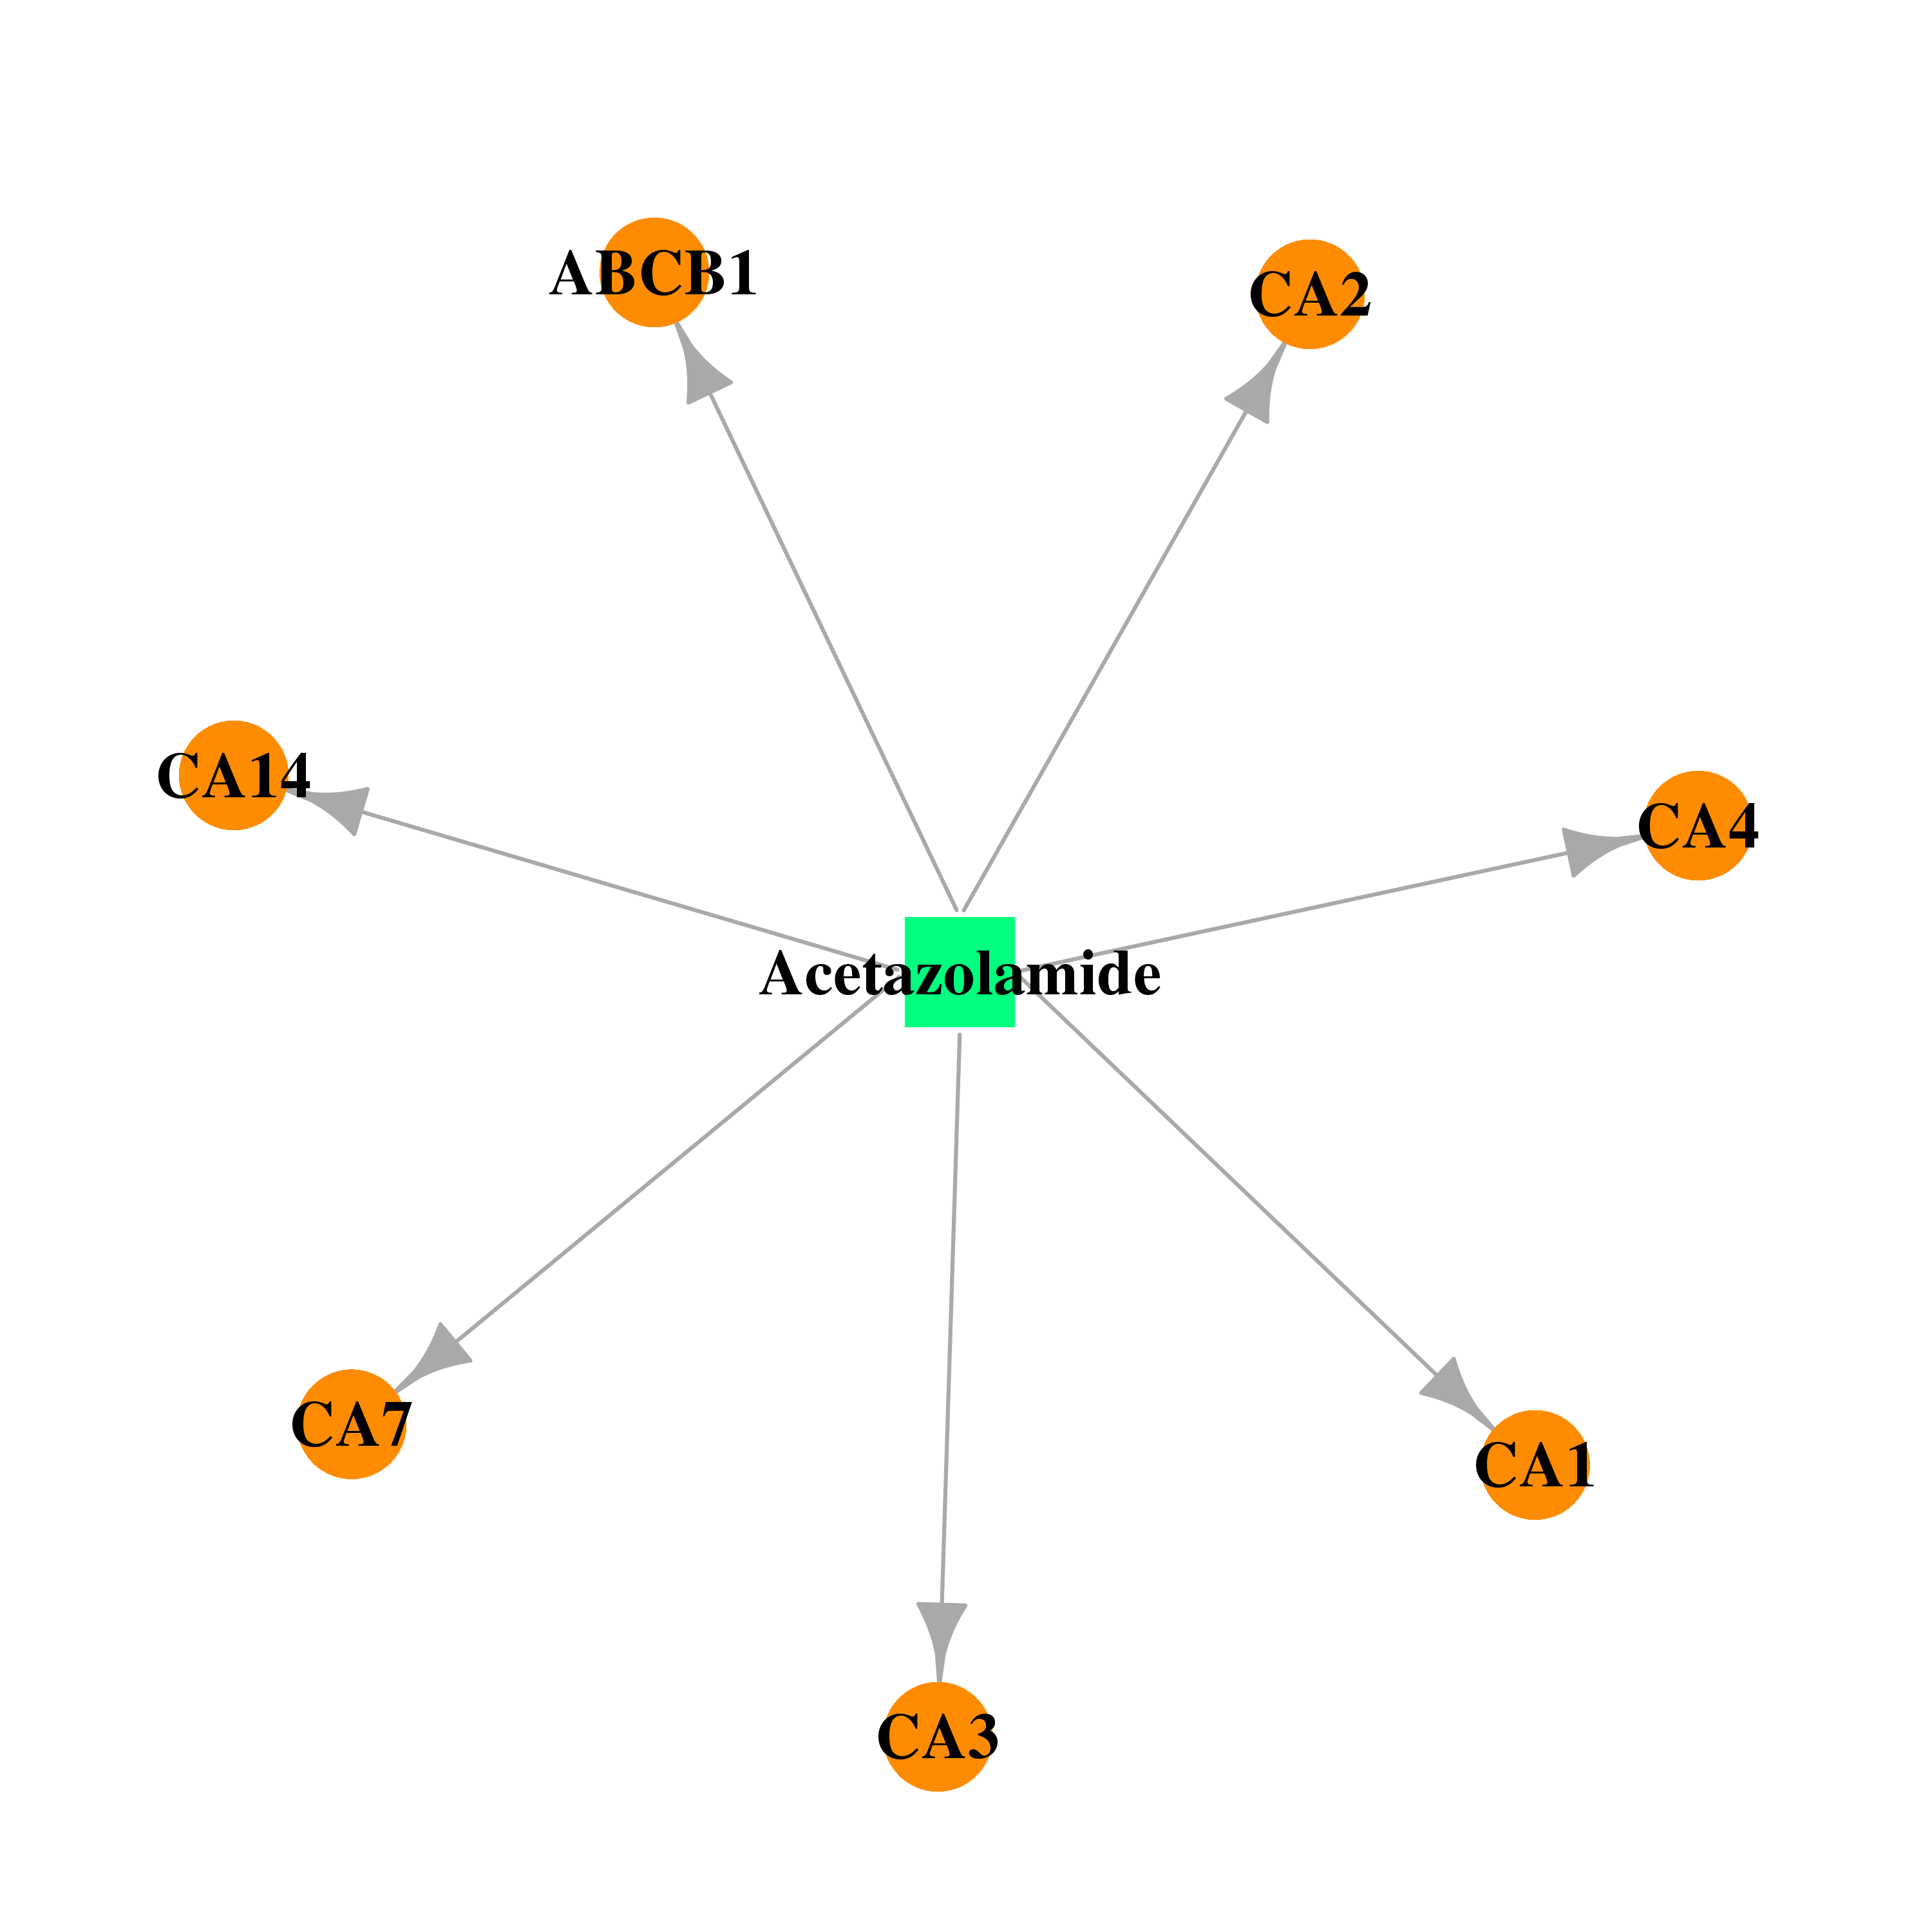 |  |
| DB00869 | carbonic anhydrase I | approved | Dorzolamide | 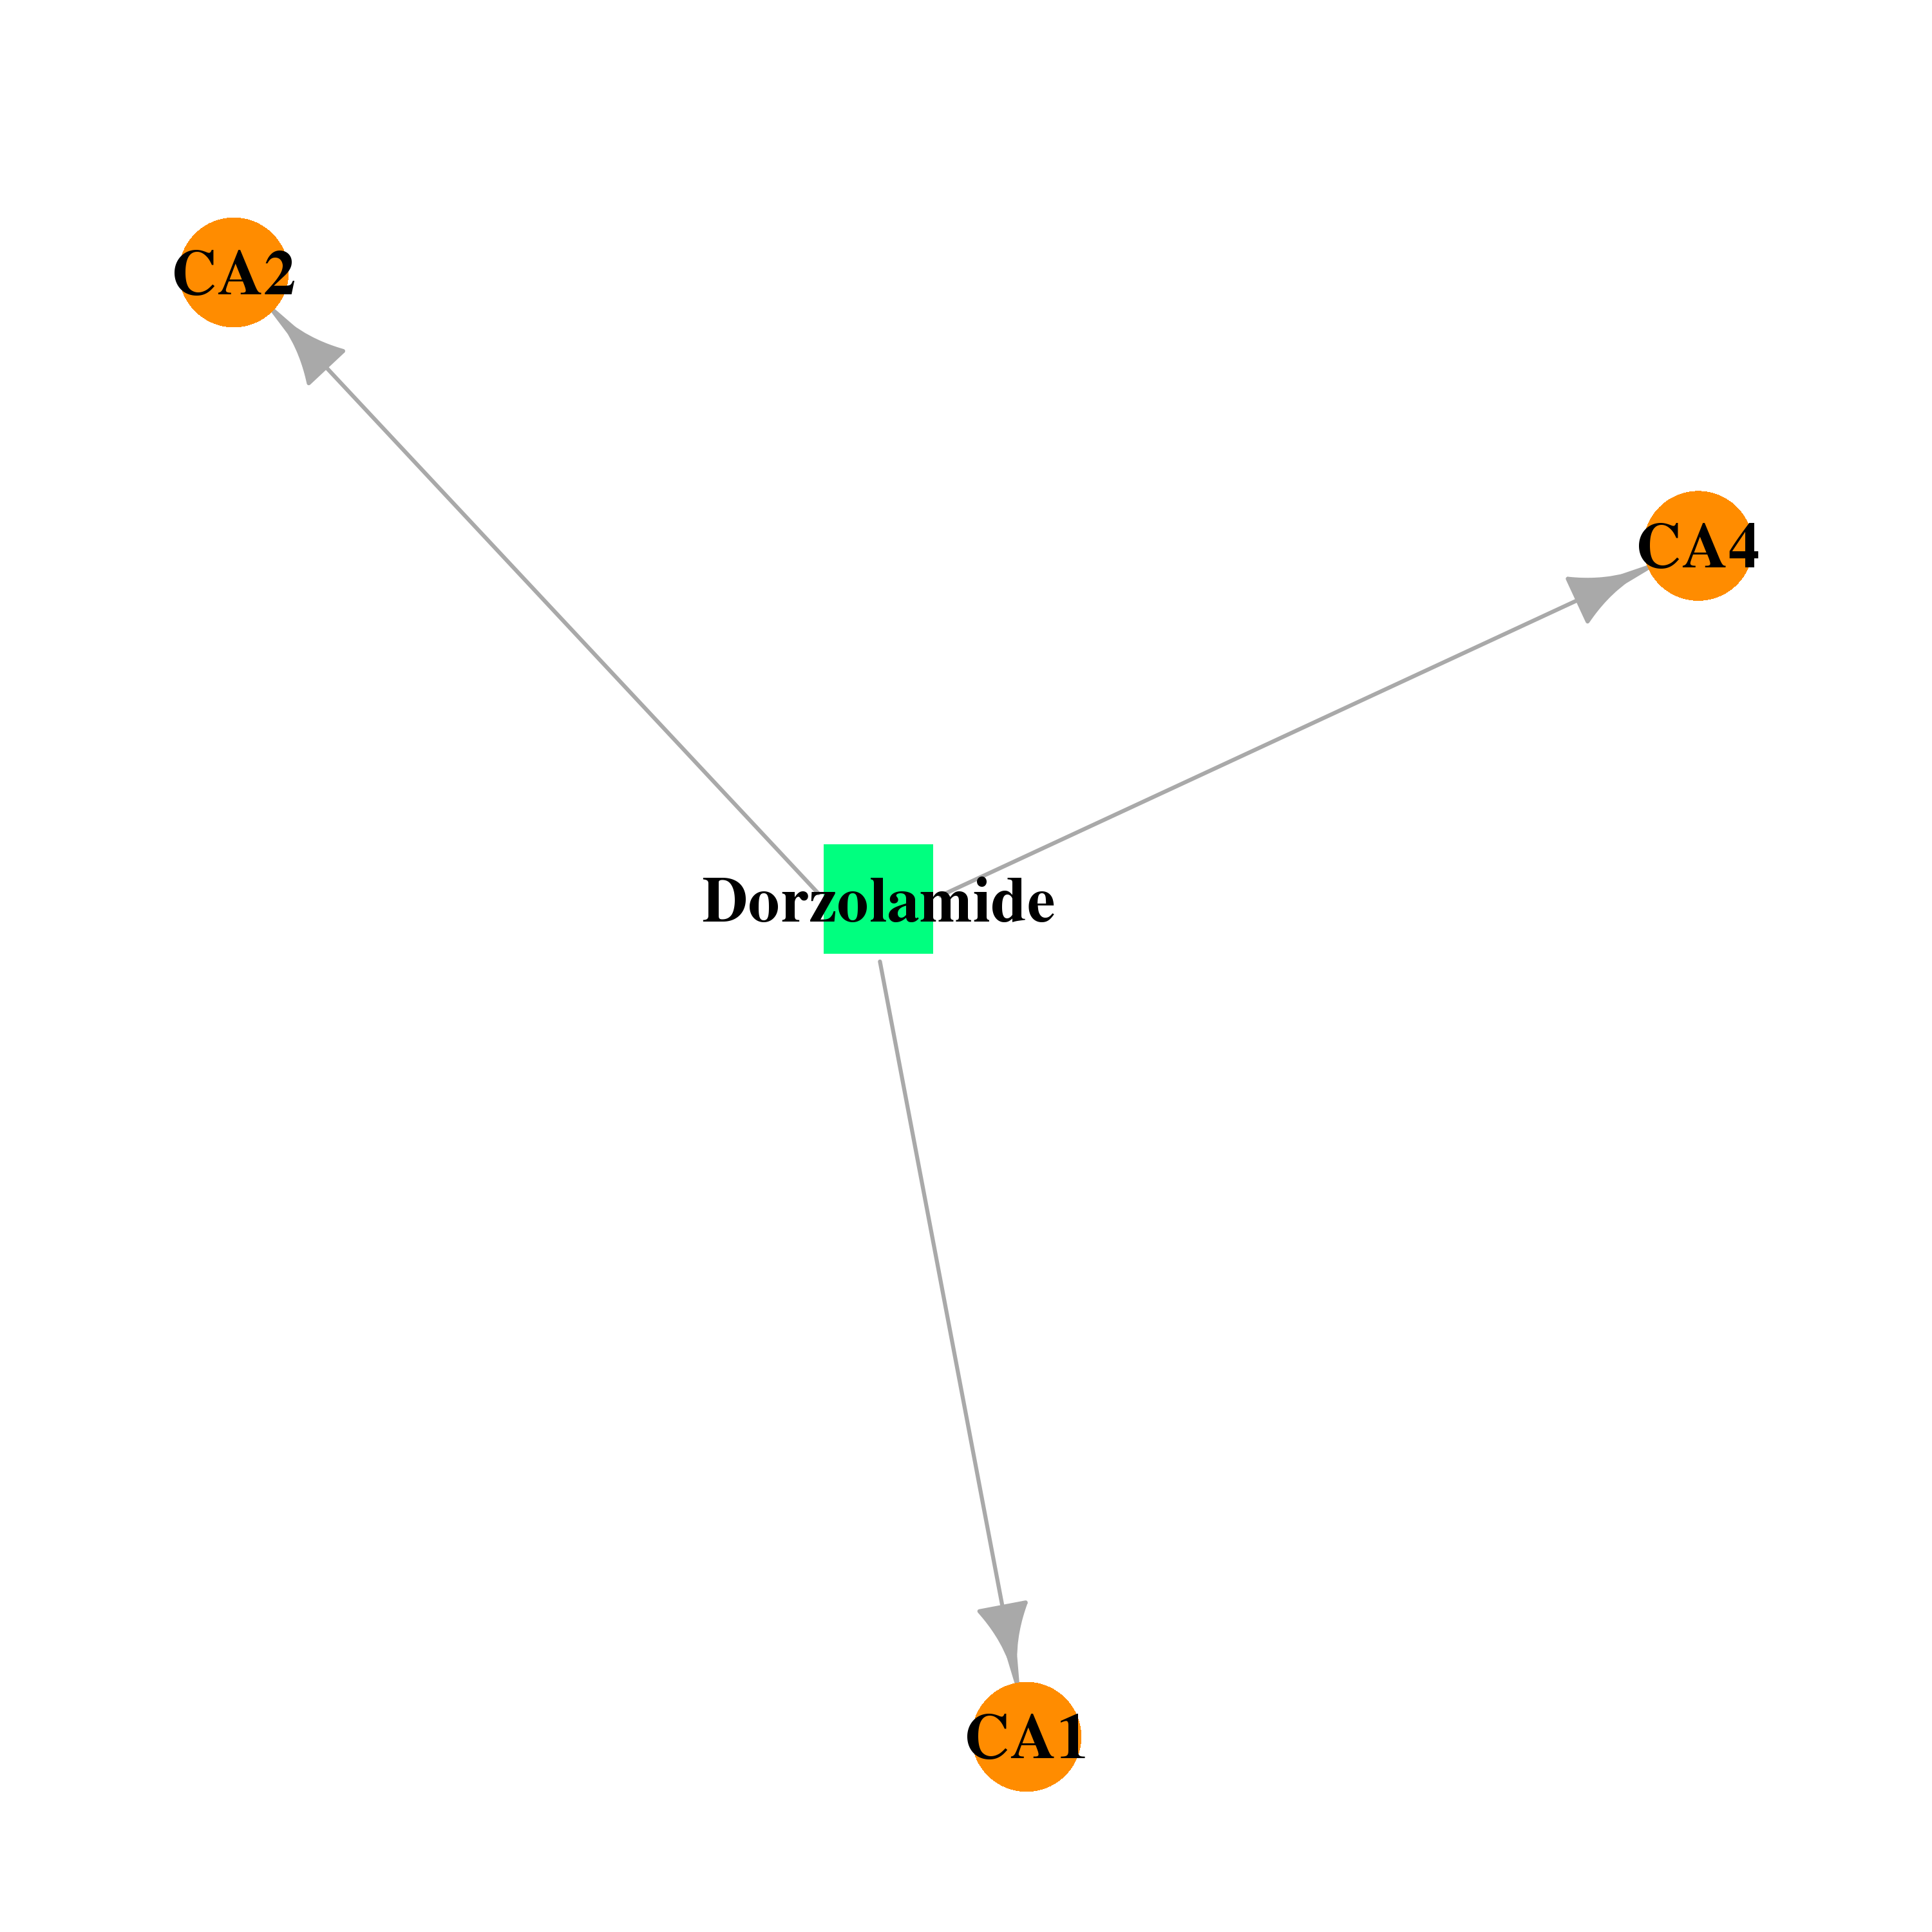 |  |
| DB00880 | carbonic anhydrase I | approved | Chlorothiazide | 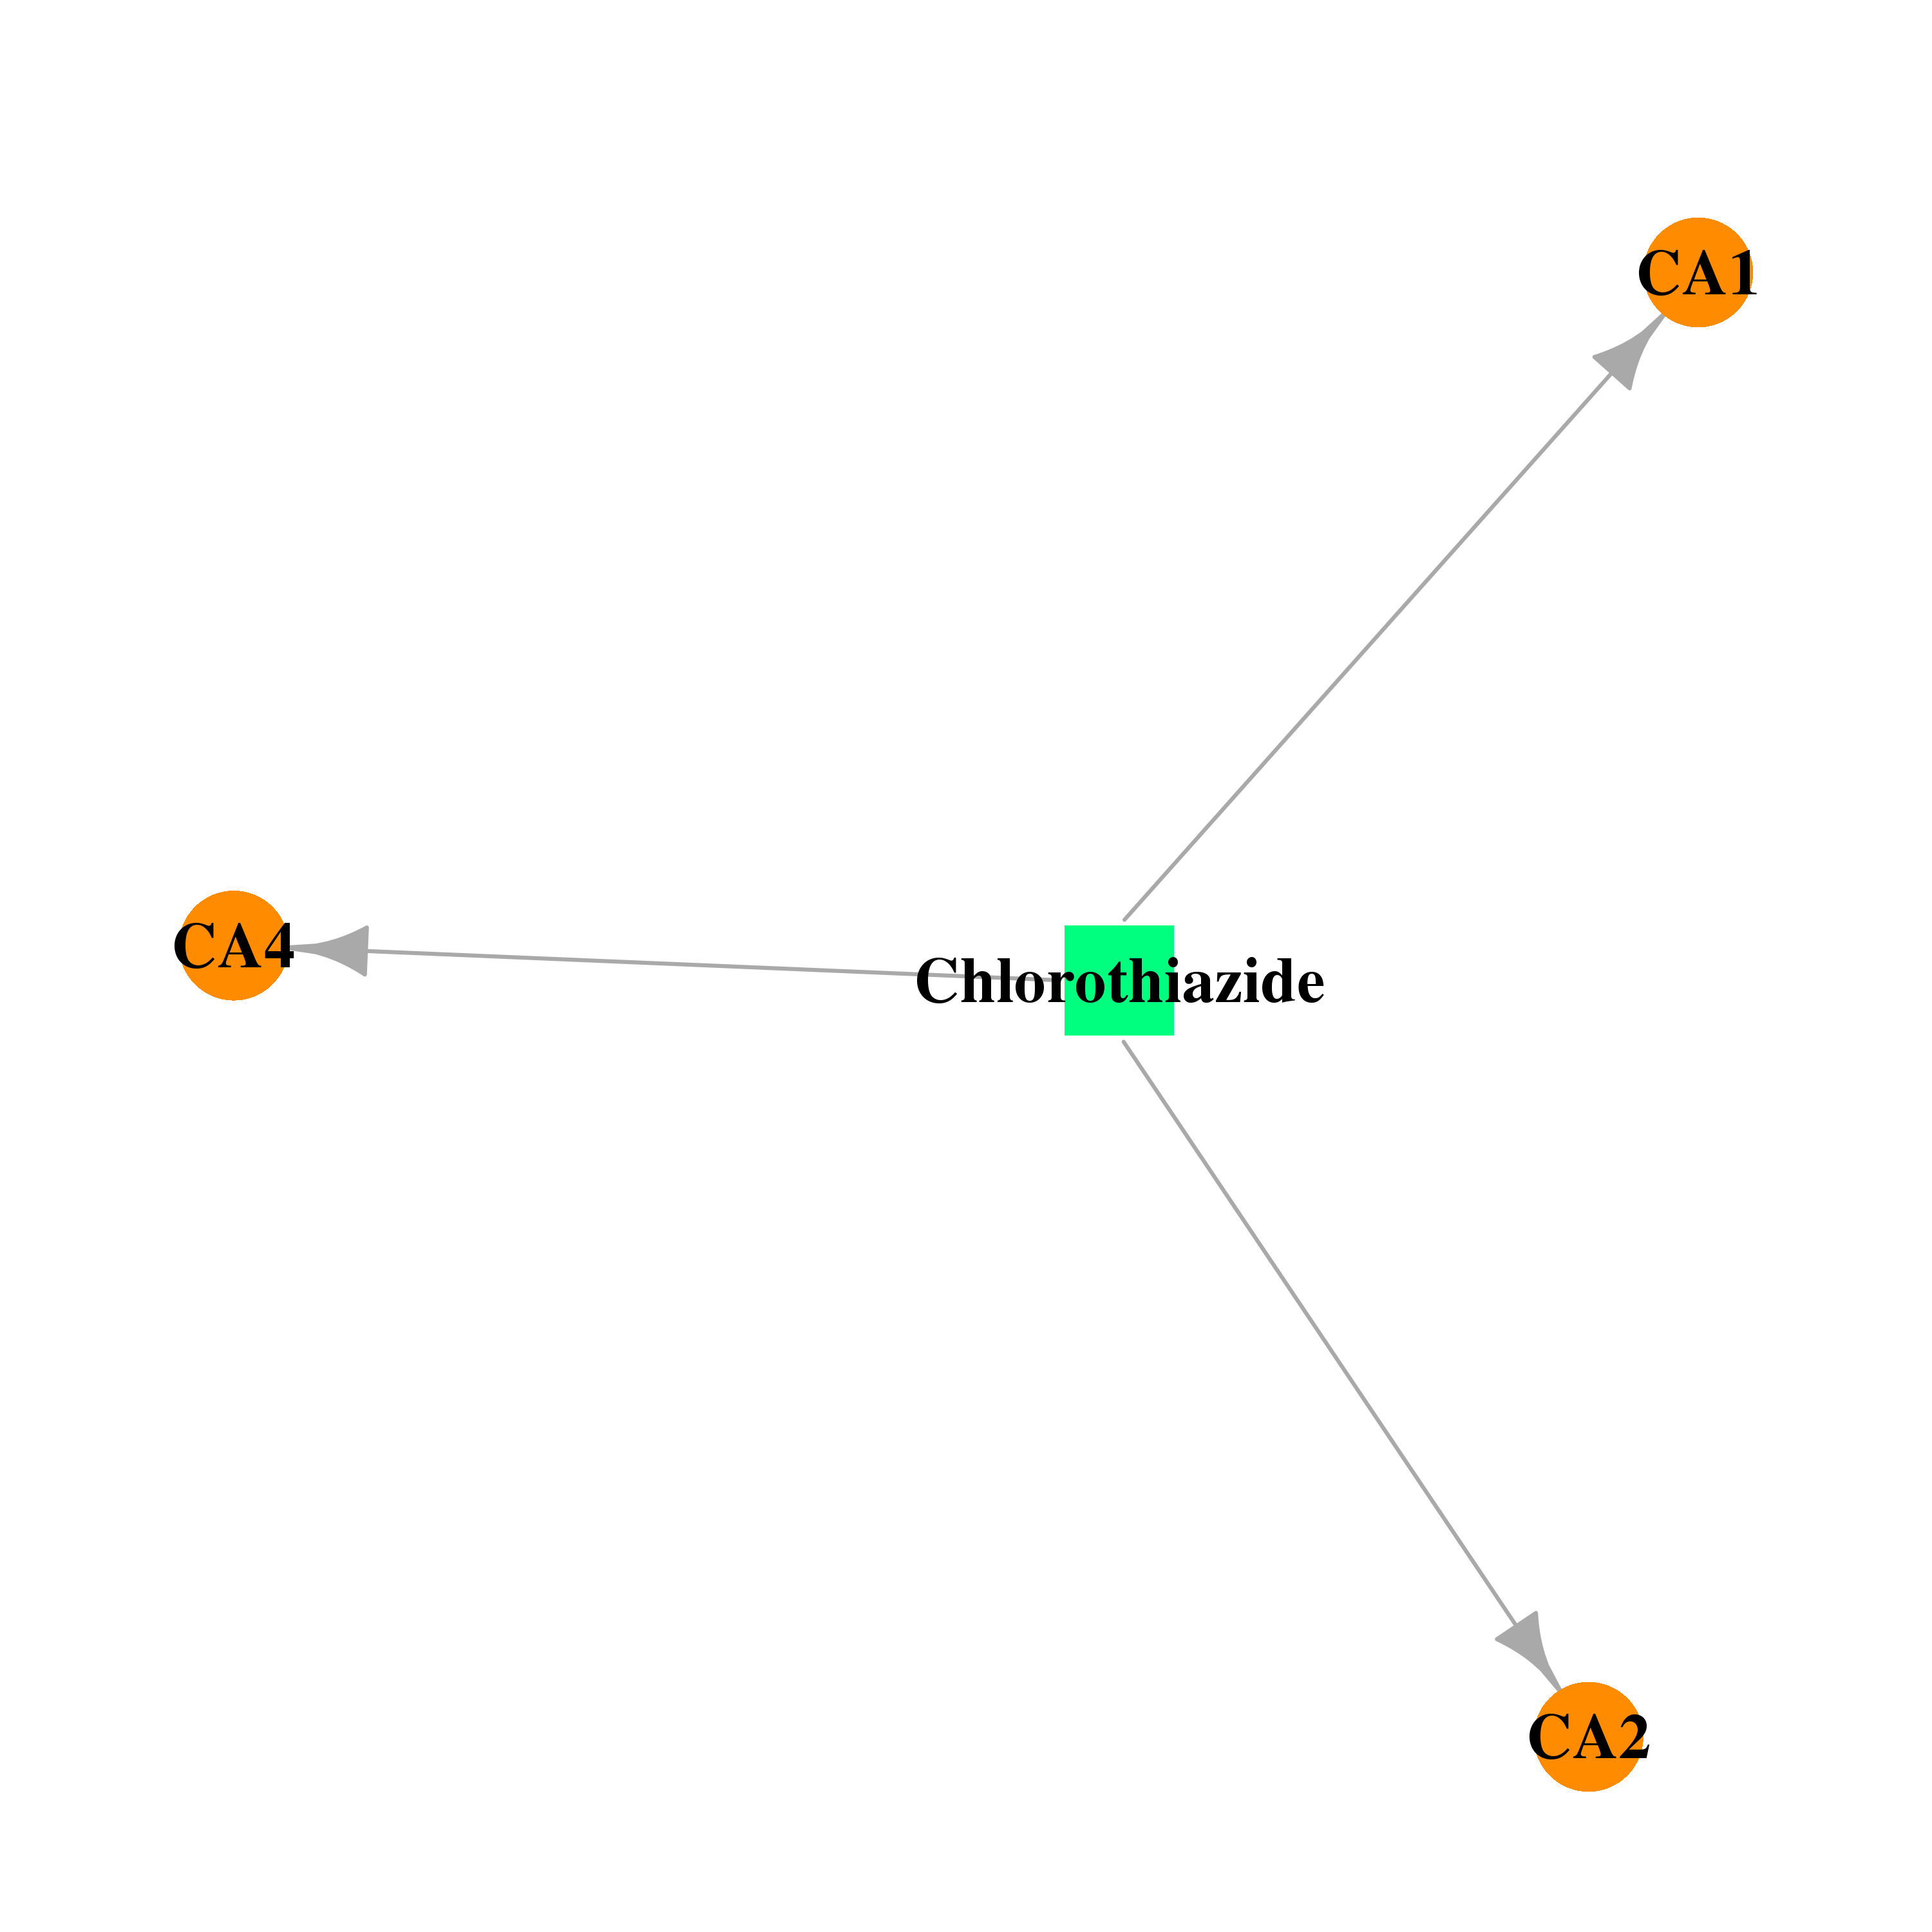 |  |
| DB00909 | carbonic anhydrase I | approved; investigational | Zonisamide | 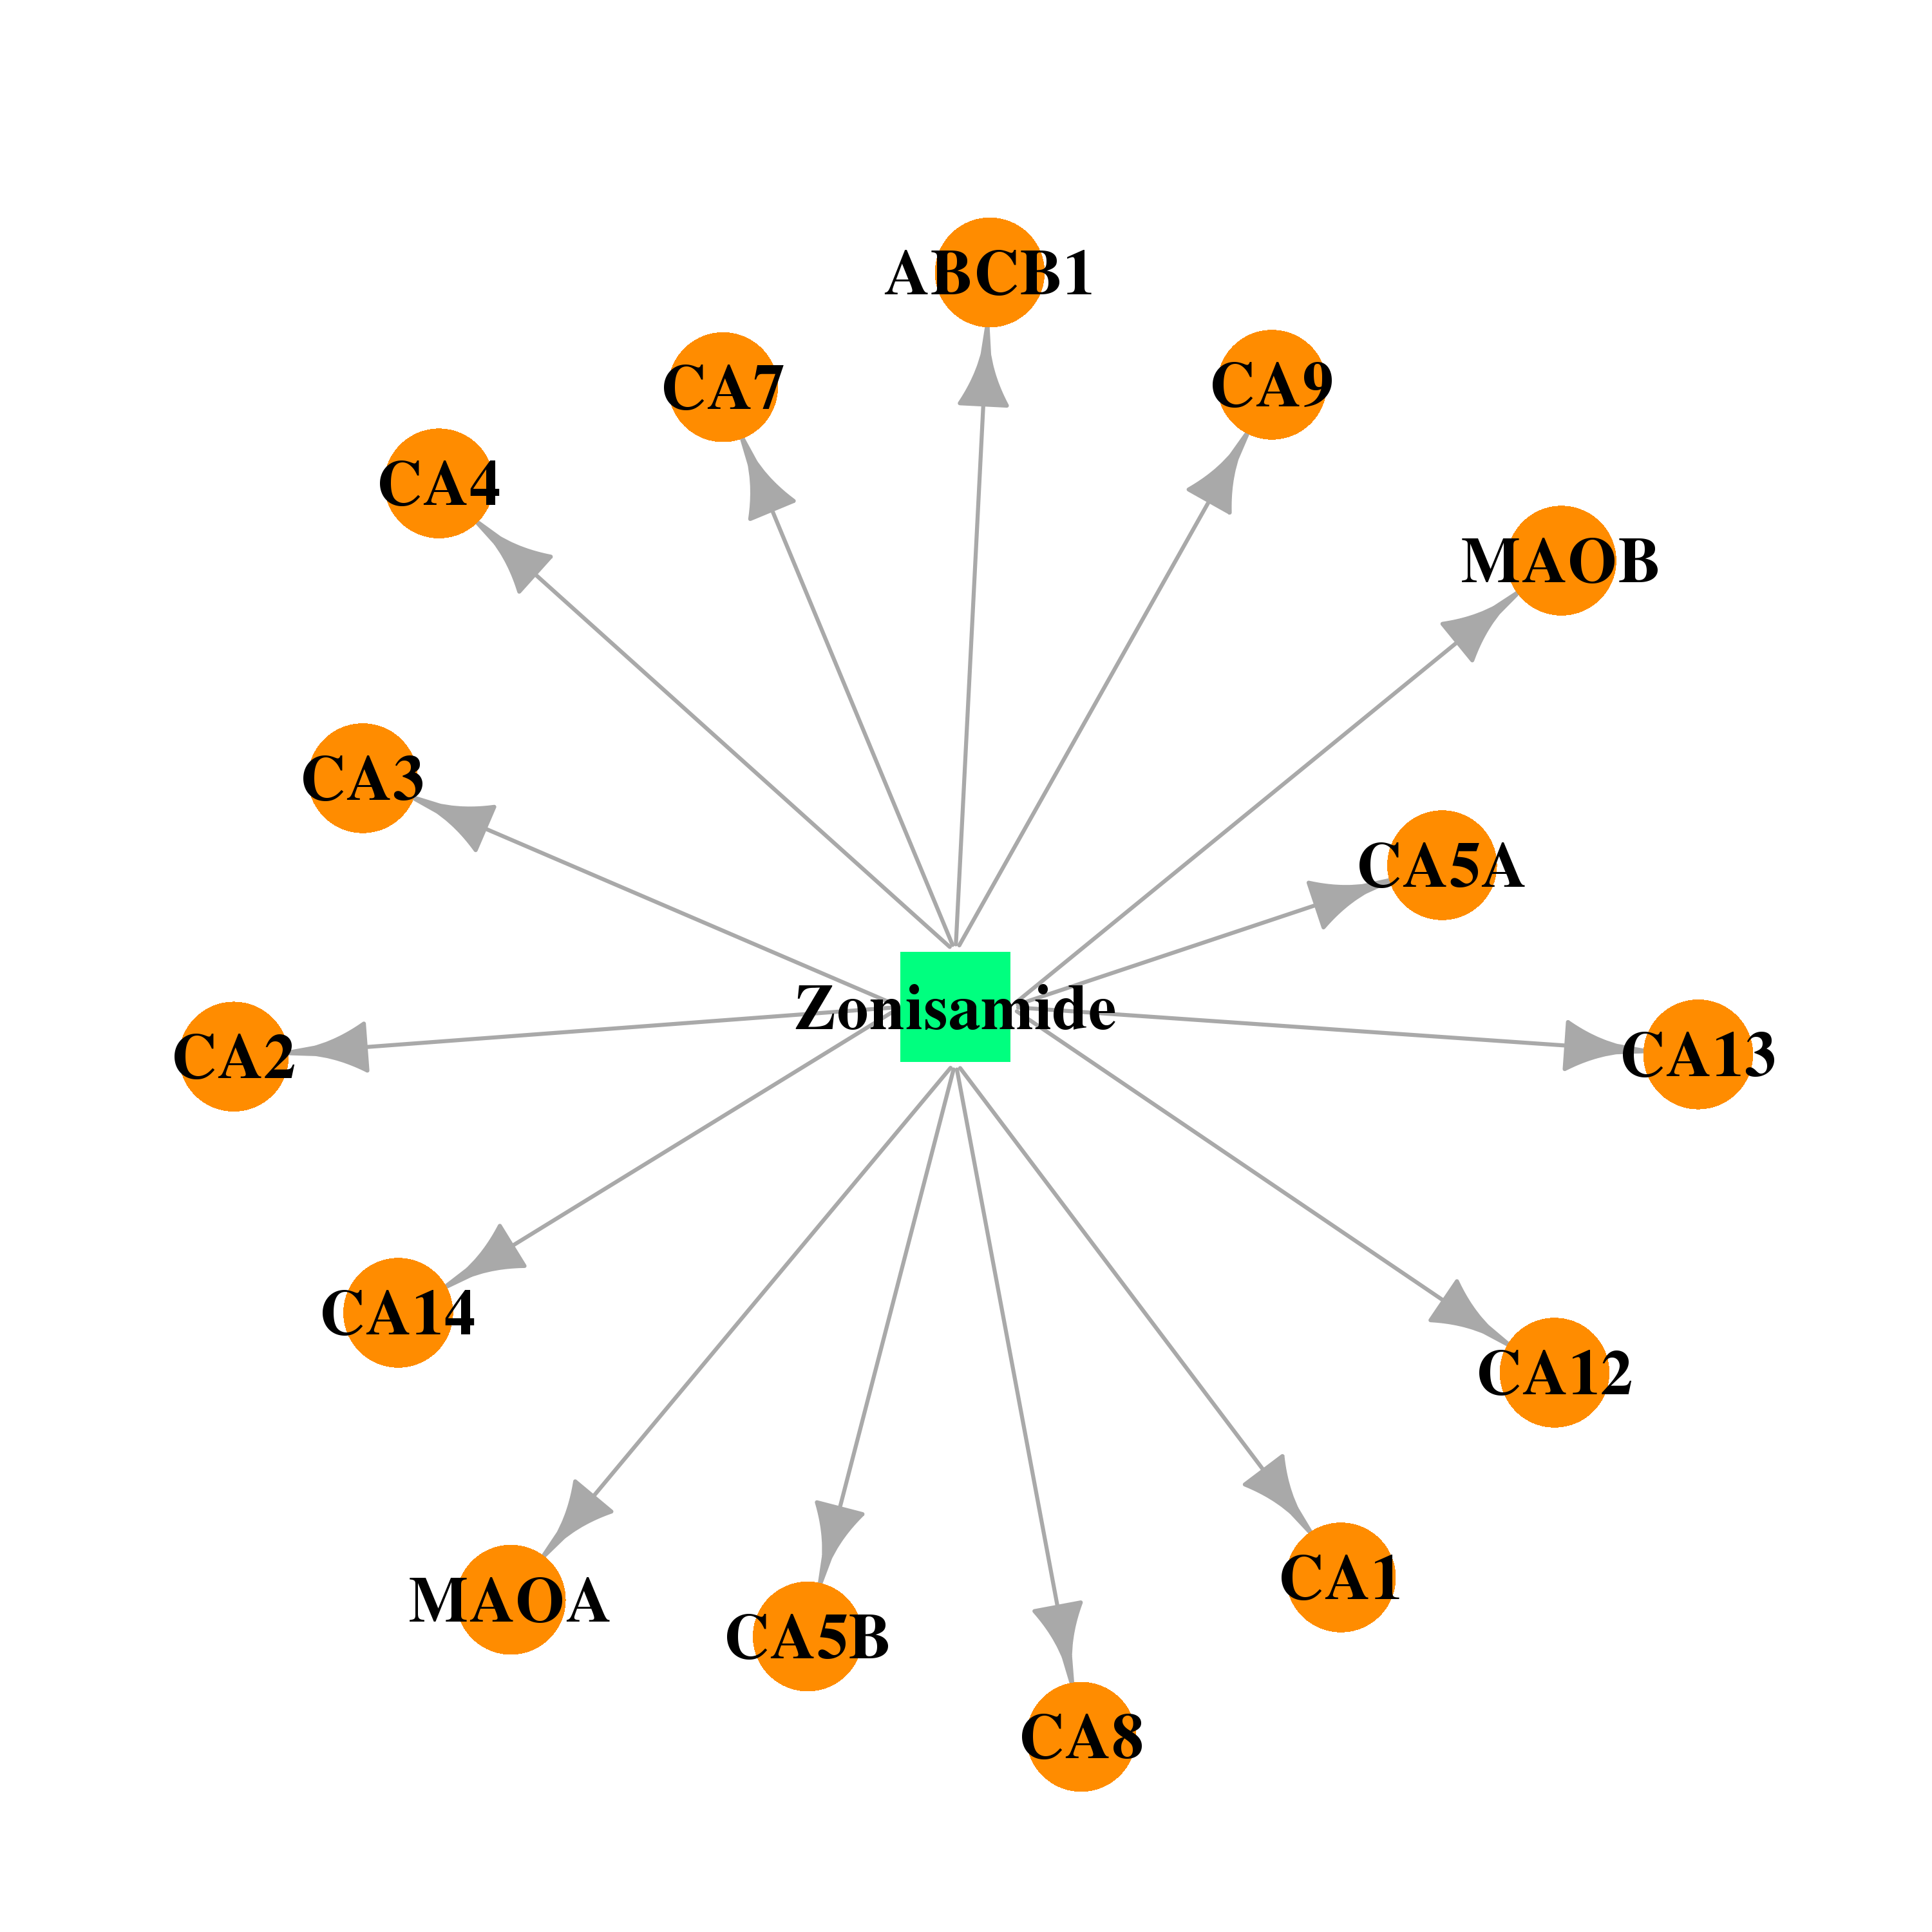 |  |
| DB00999 | carbonic anhydrase I | approved | Hydrochlorothiazide | 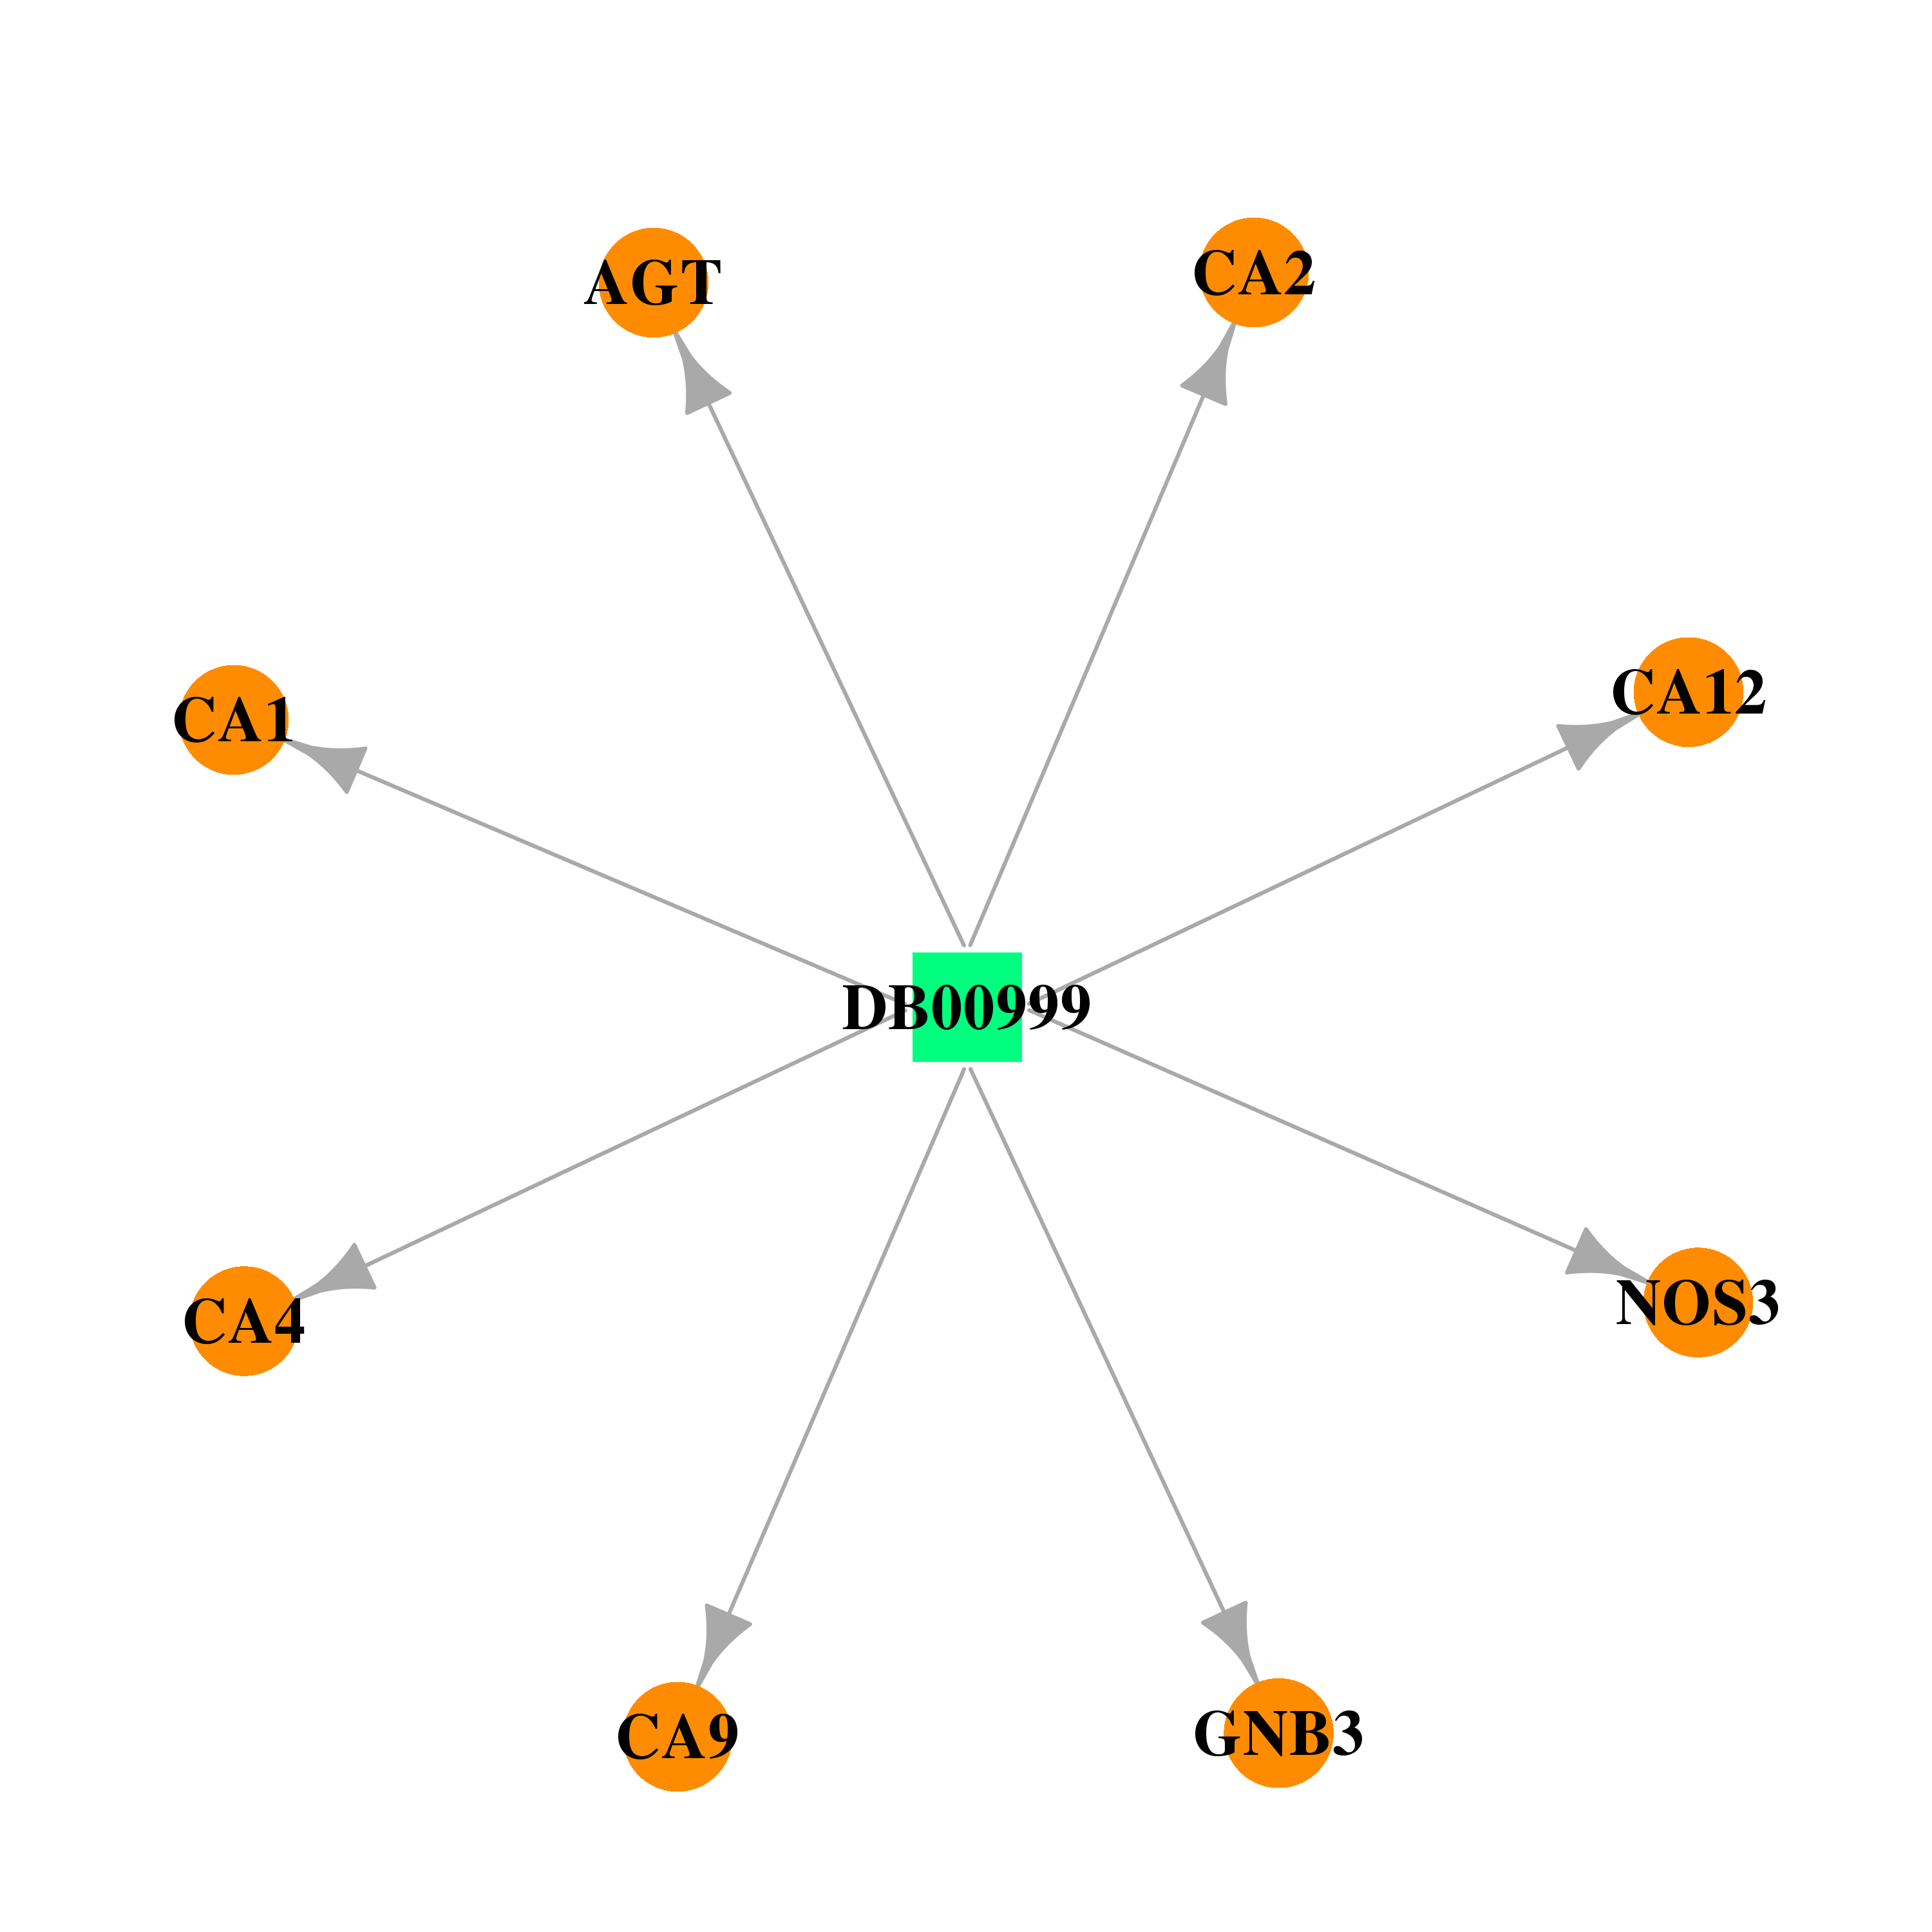 | 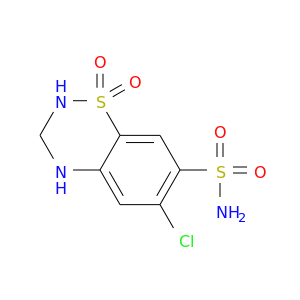 |
| DB01021 | carbonic anhydrase I | approved | Trichlormethiazide | 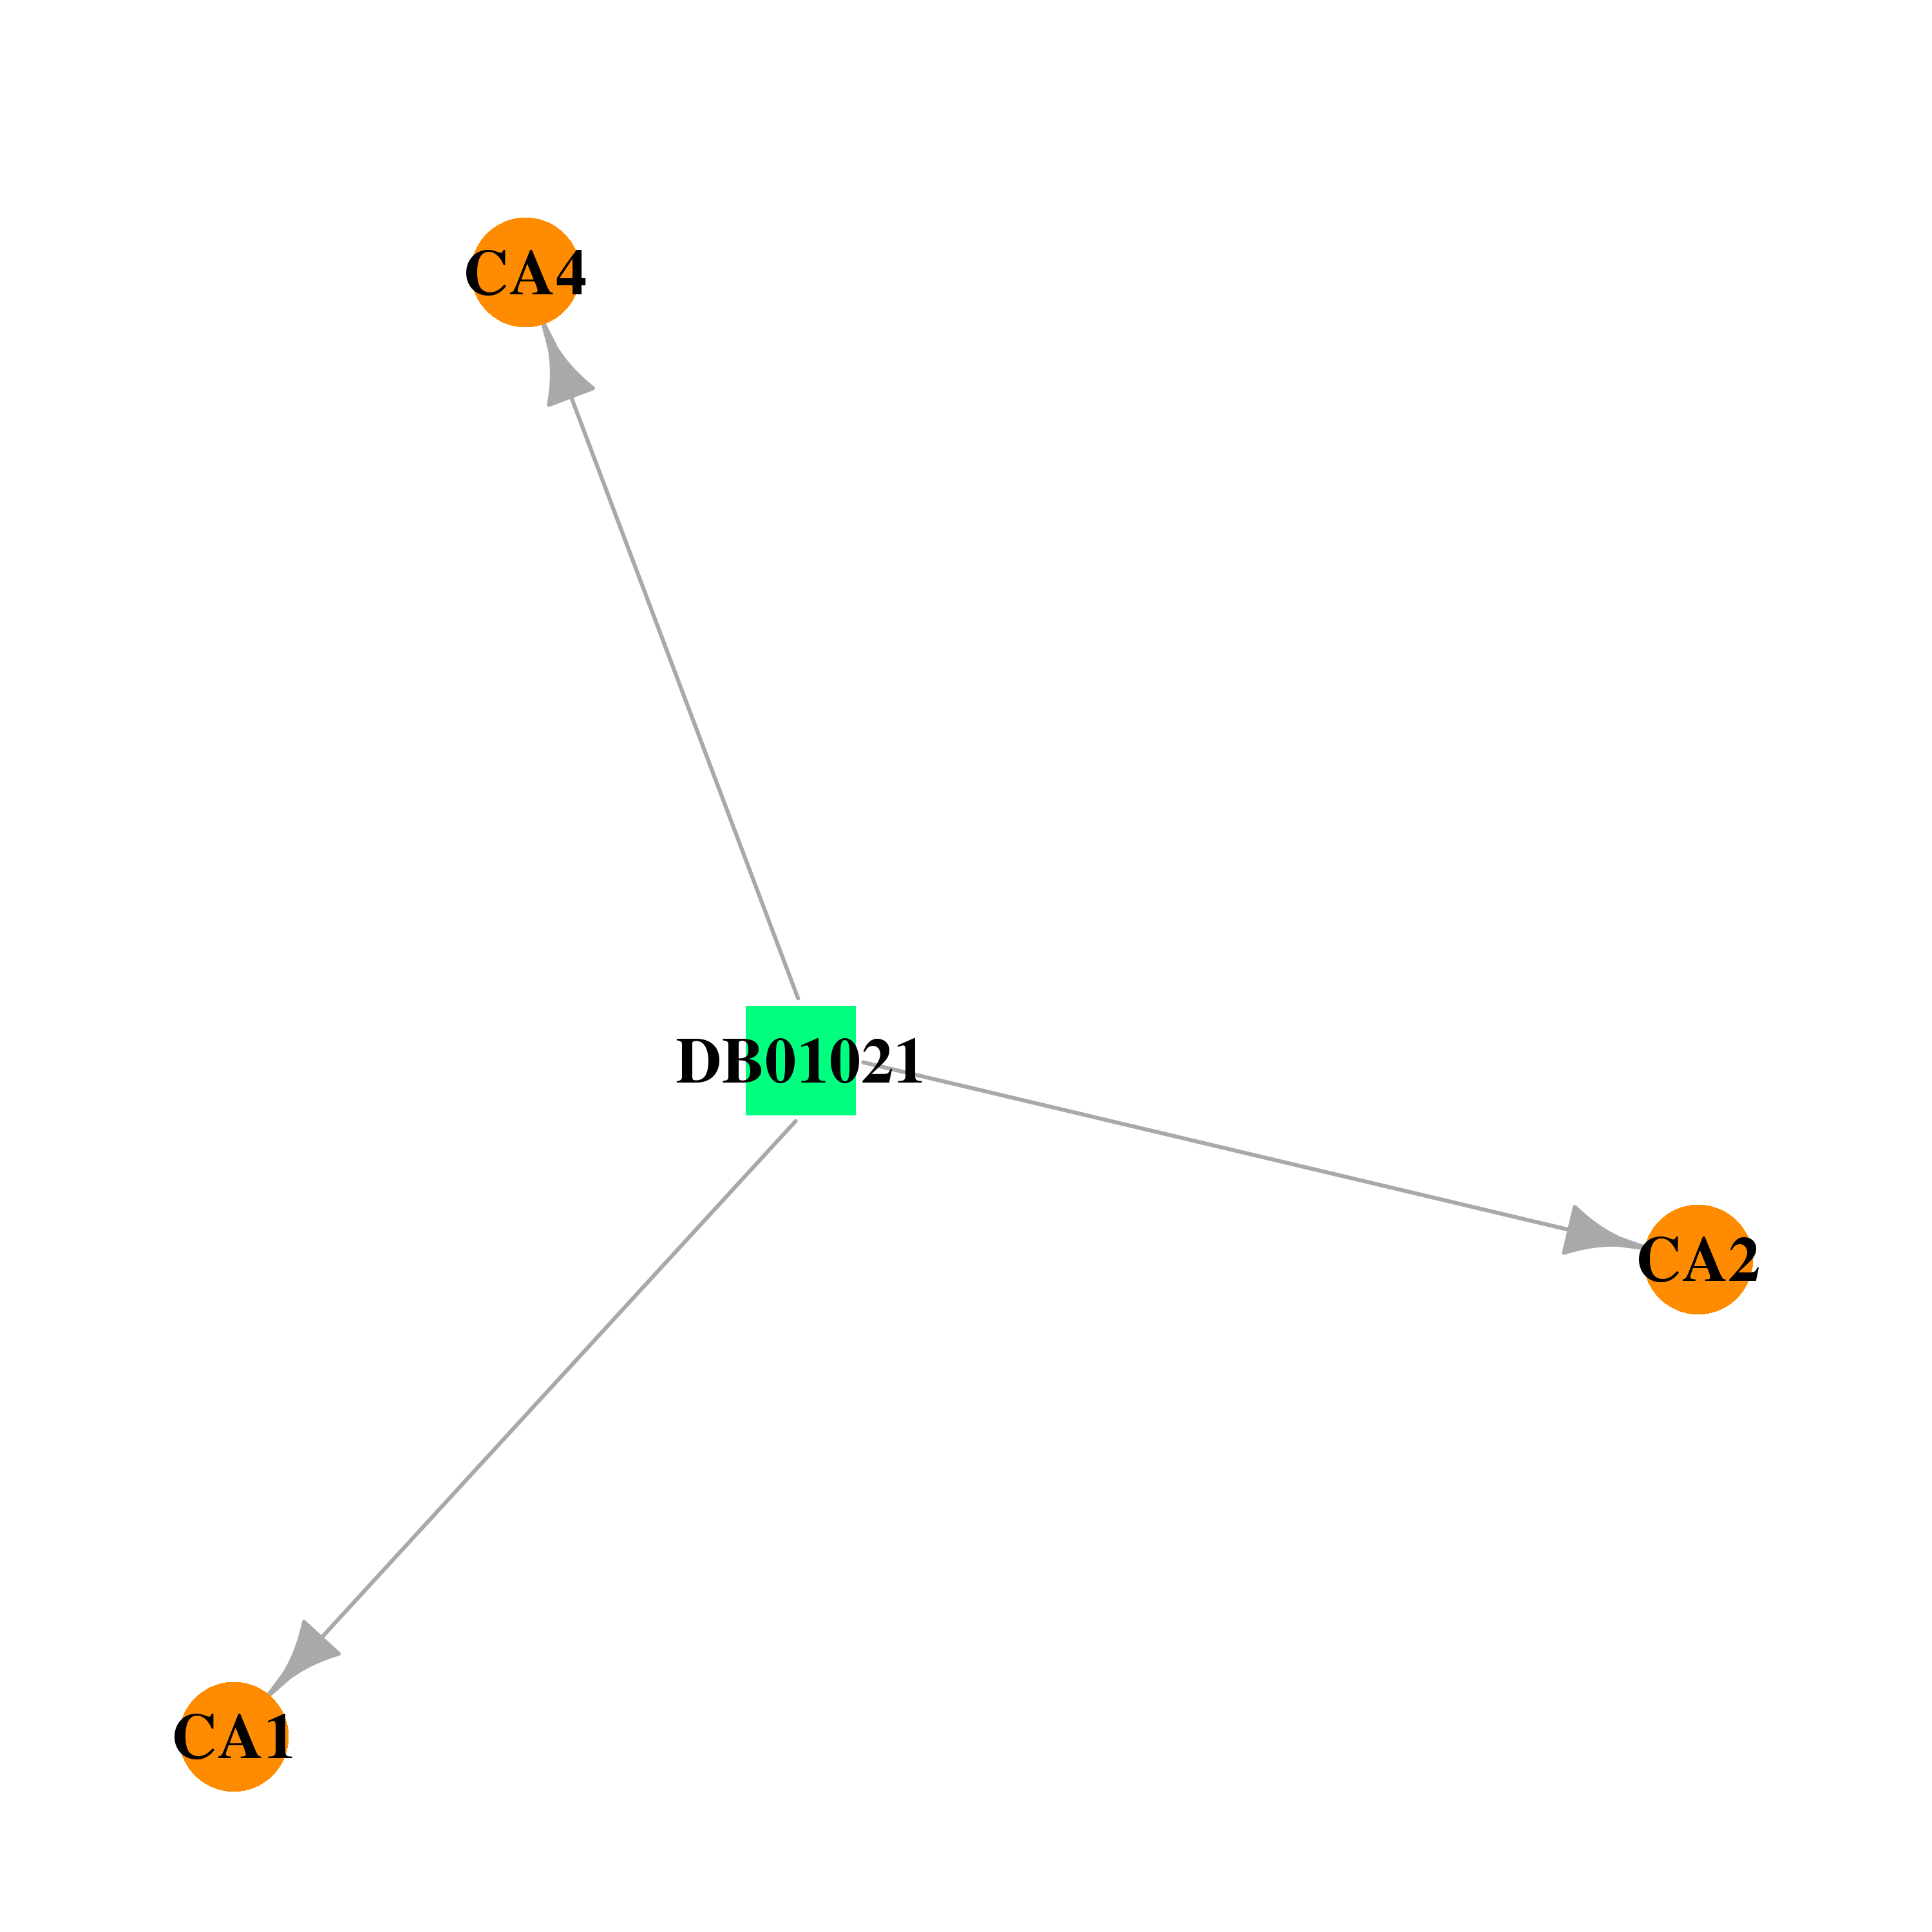 | 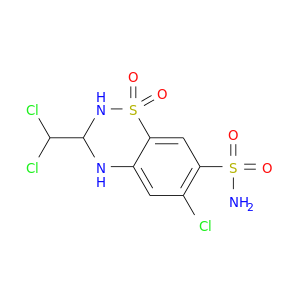 |
| DB01031 | carbonic anhydrase I | illicit; approved | Ethinamate | 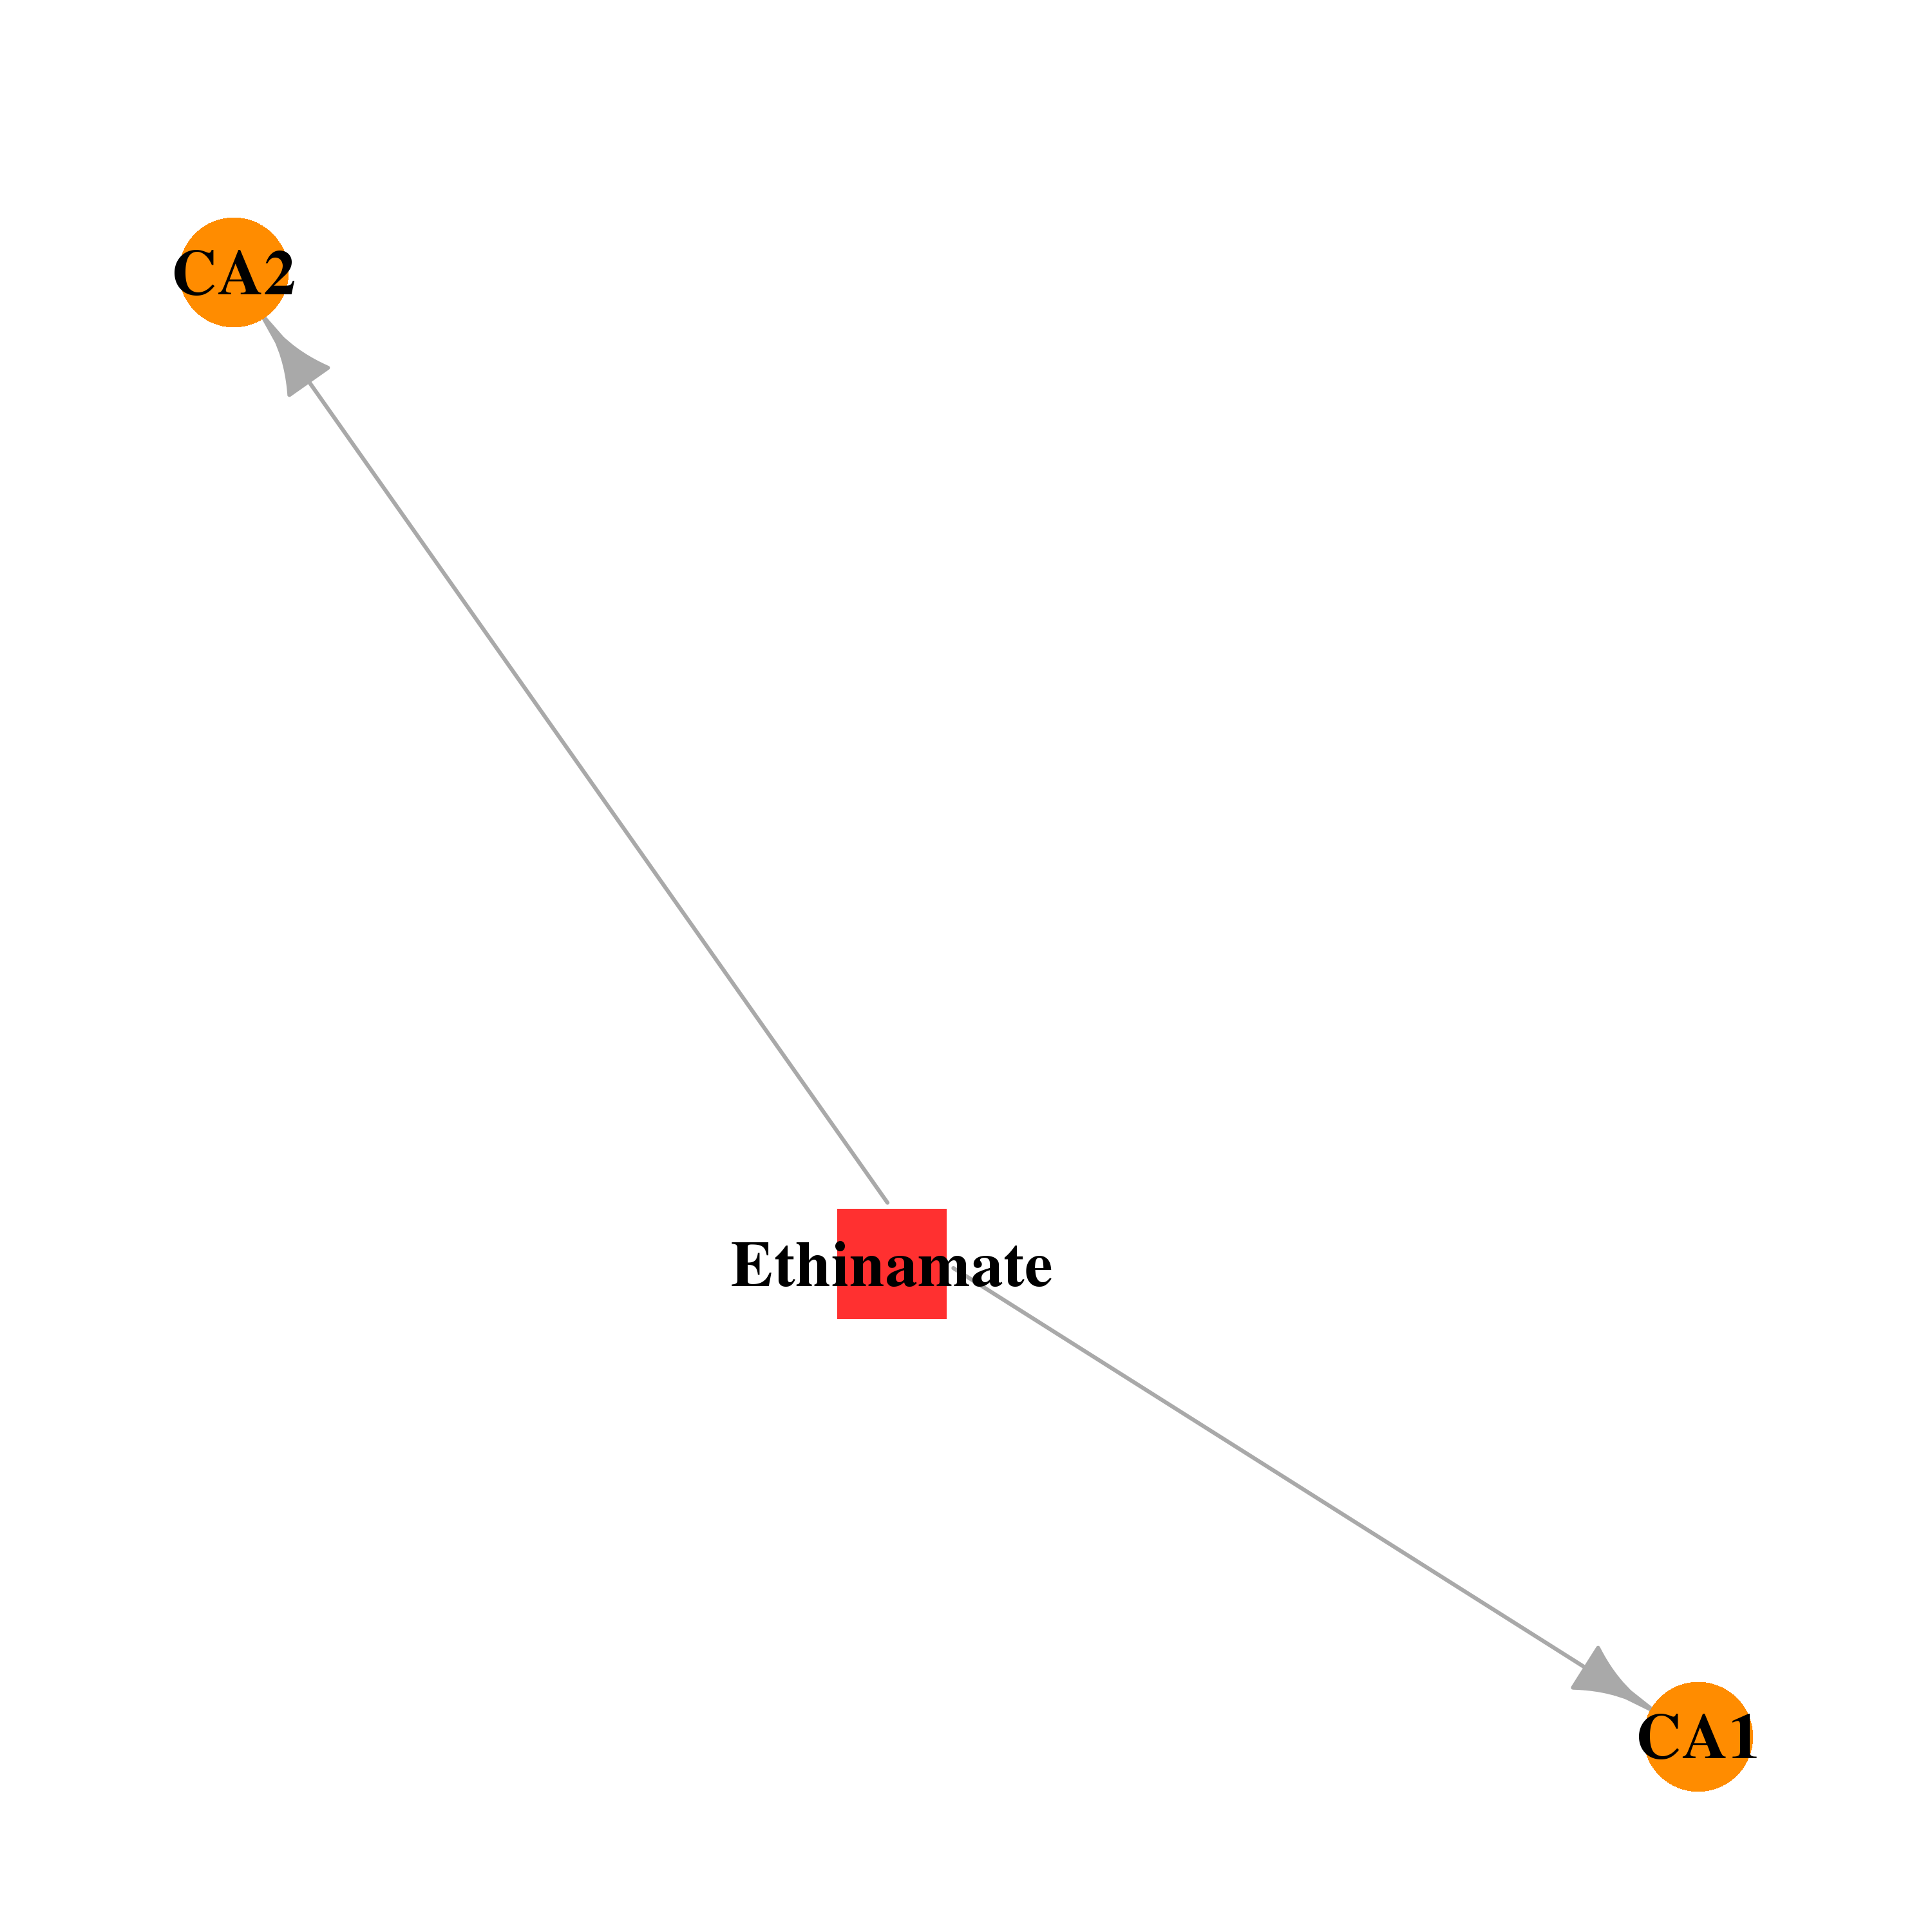 |  |
| DB01119 | carbonic anhydrase I | approved | Diazoxide | 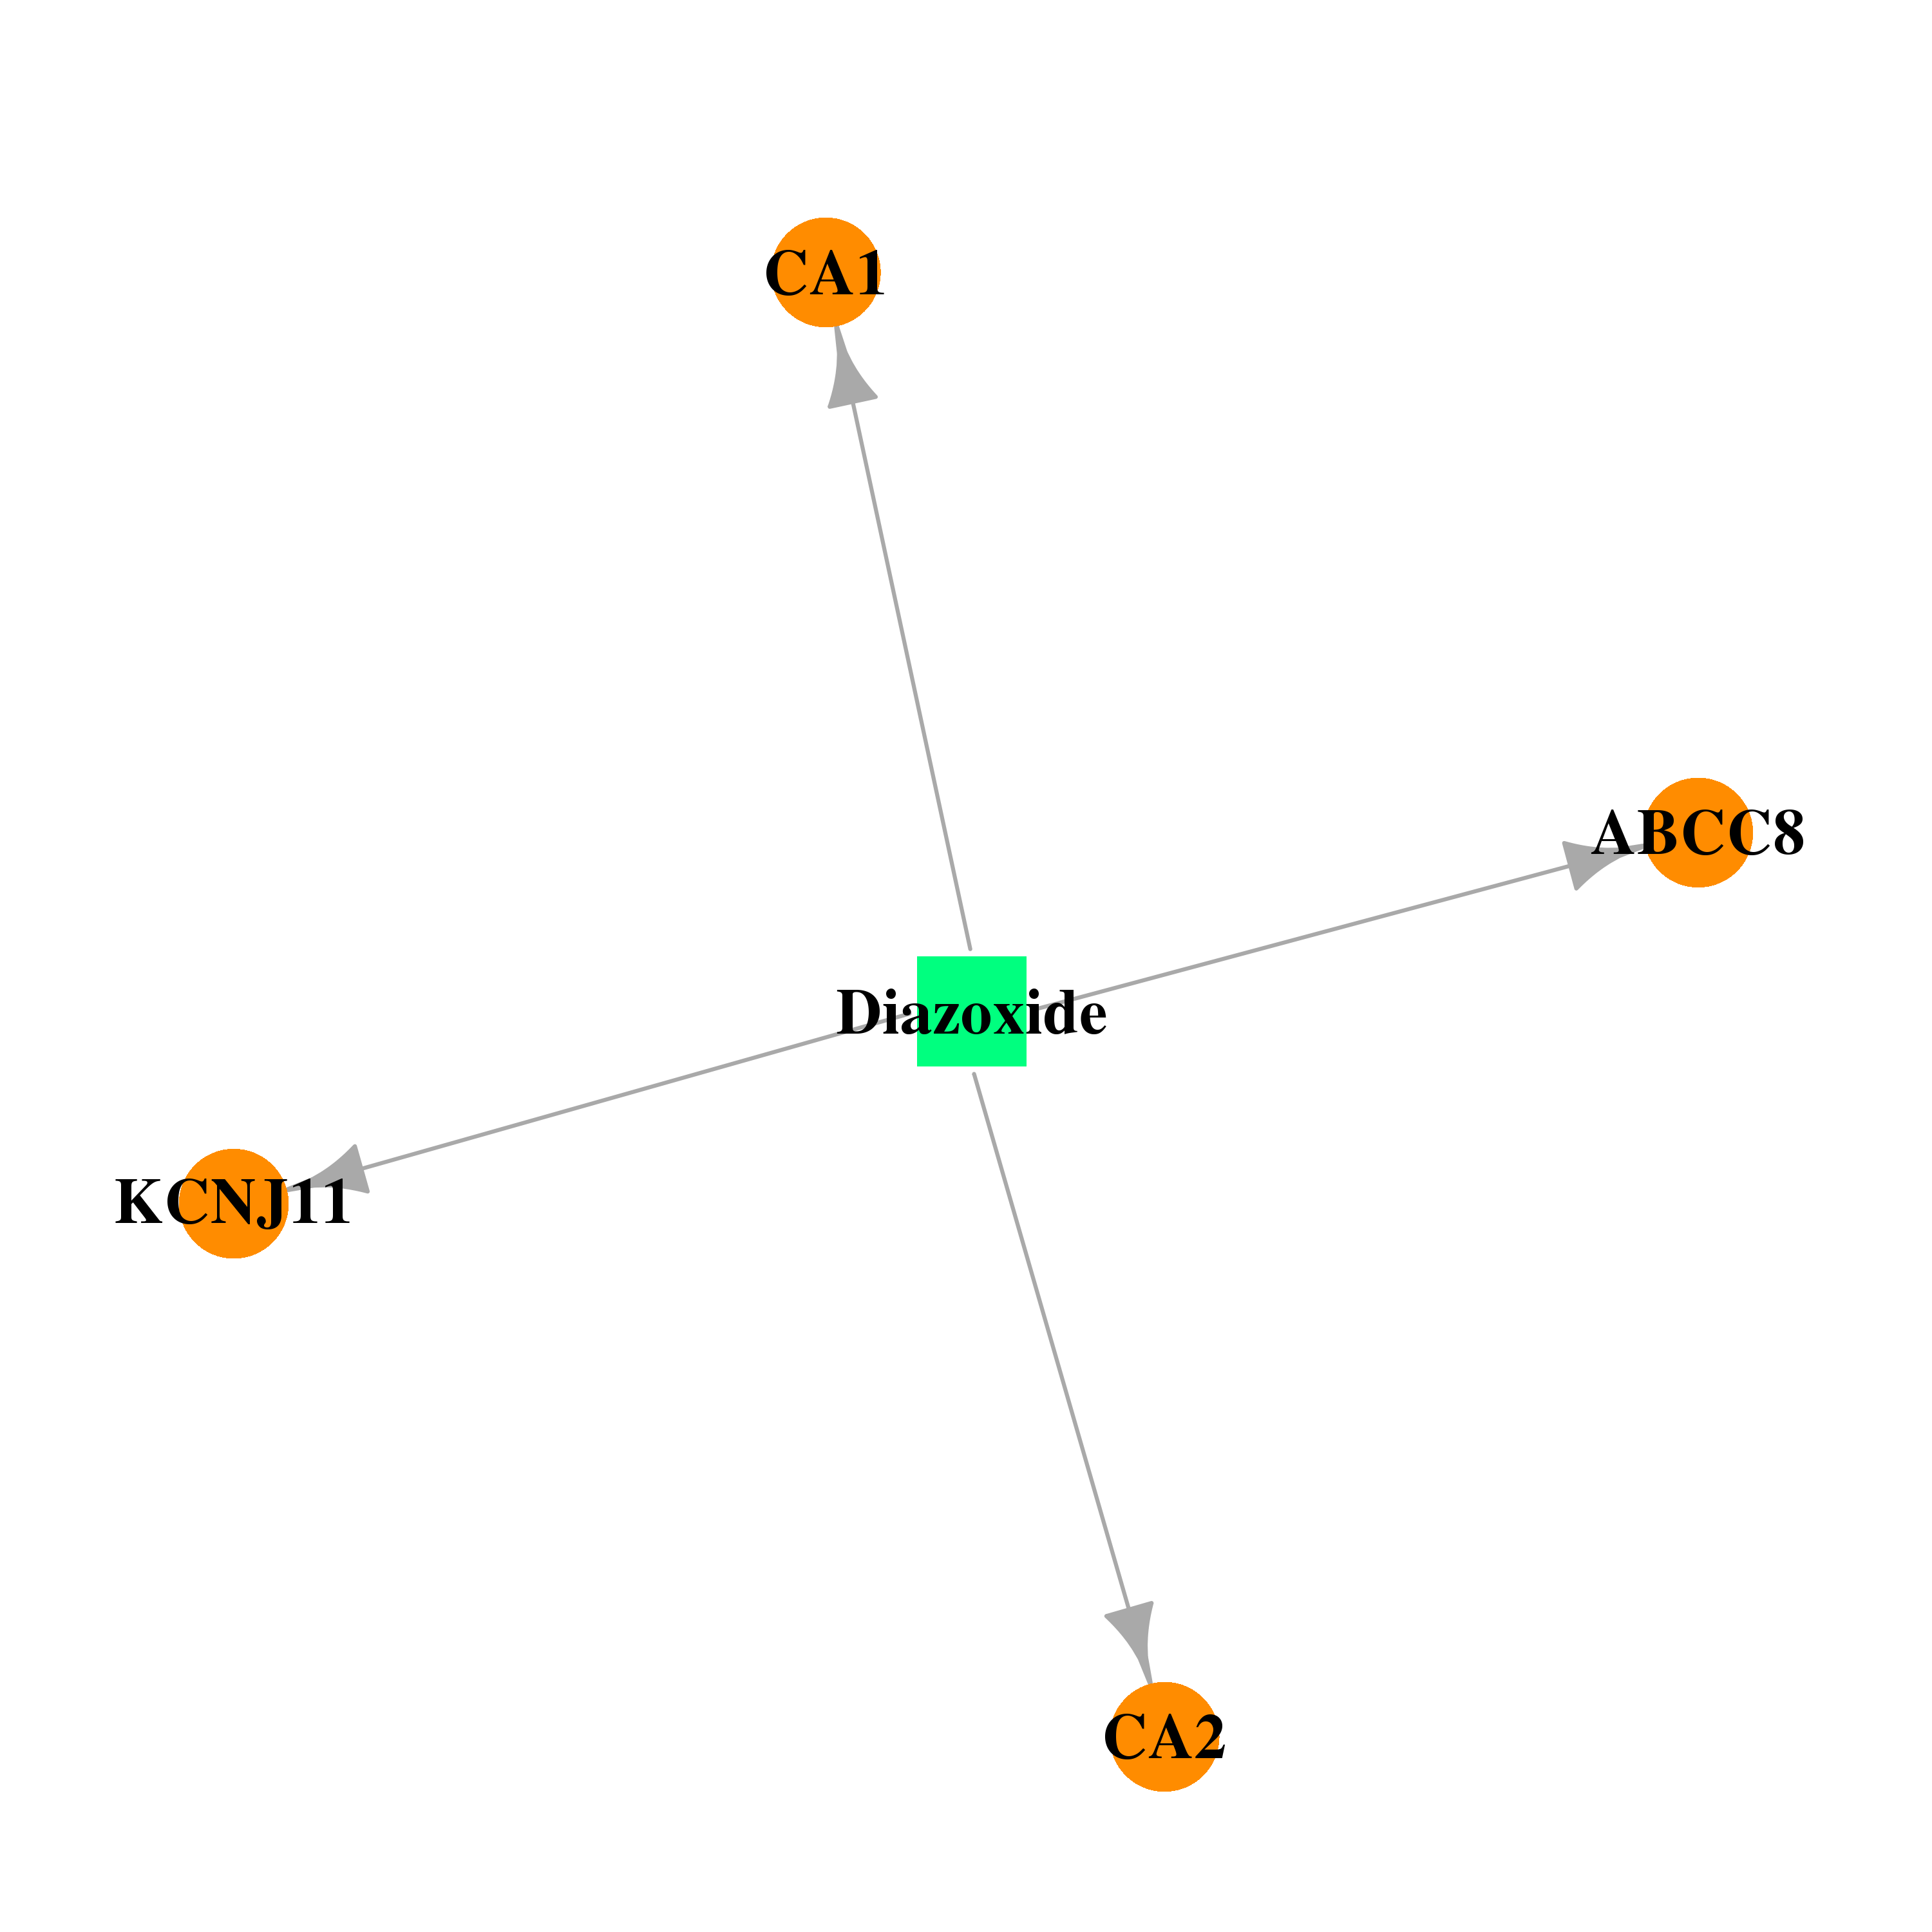 | 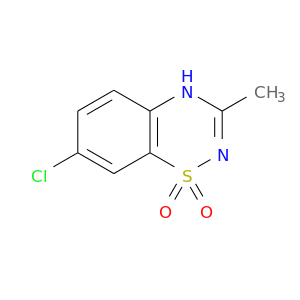 |
| DB01144 | carbonic anhydrase I | approved | Dichlorphenamide | 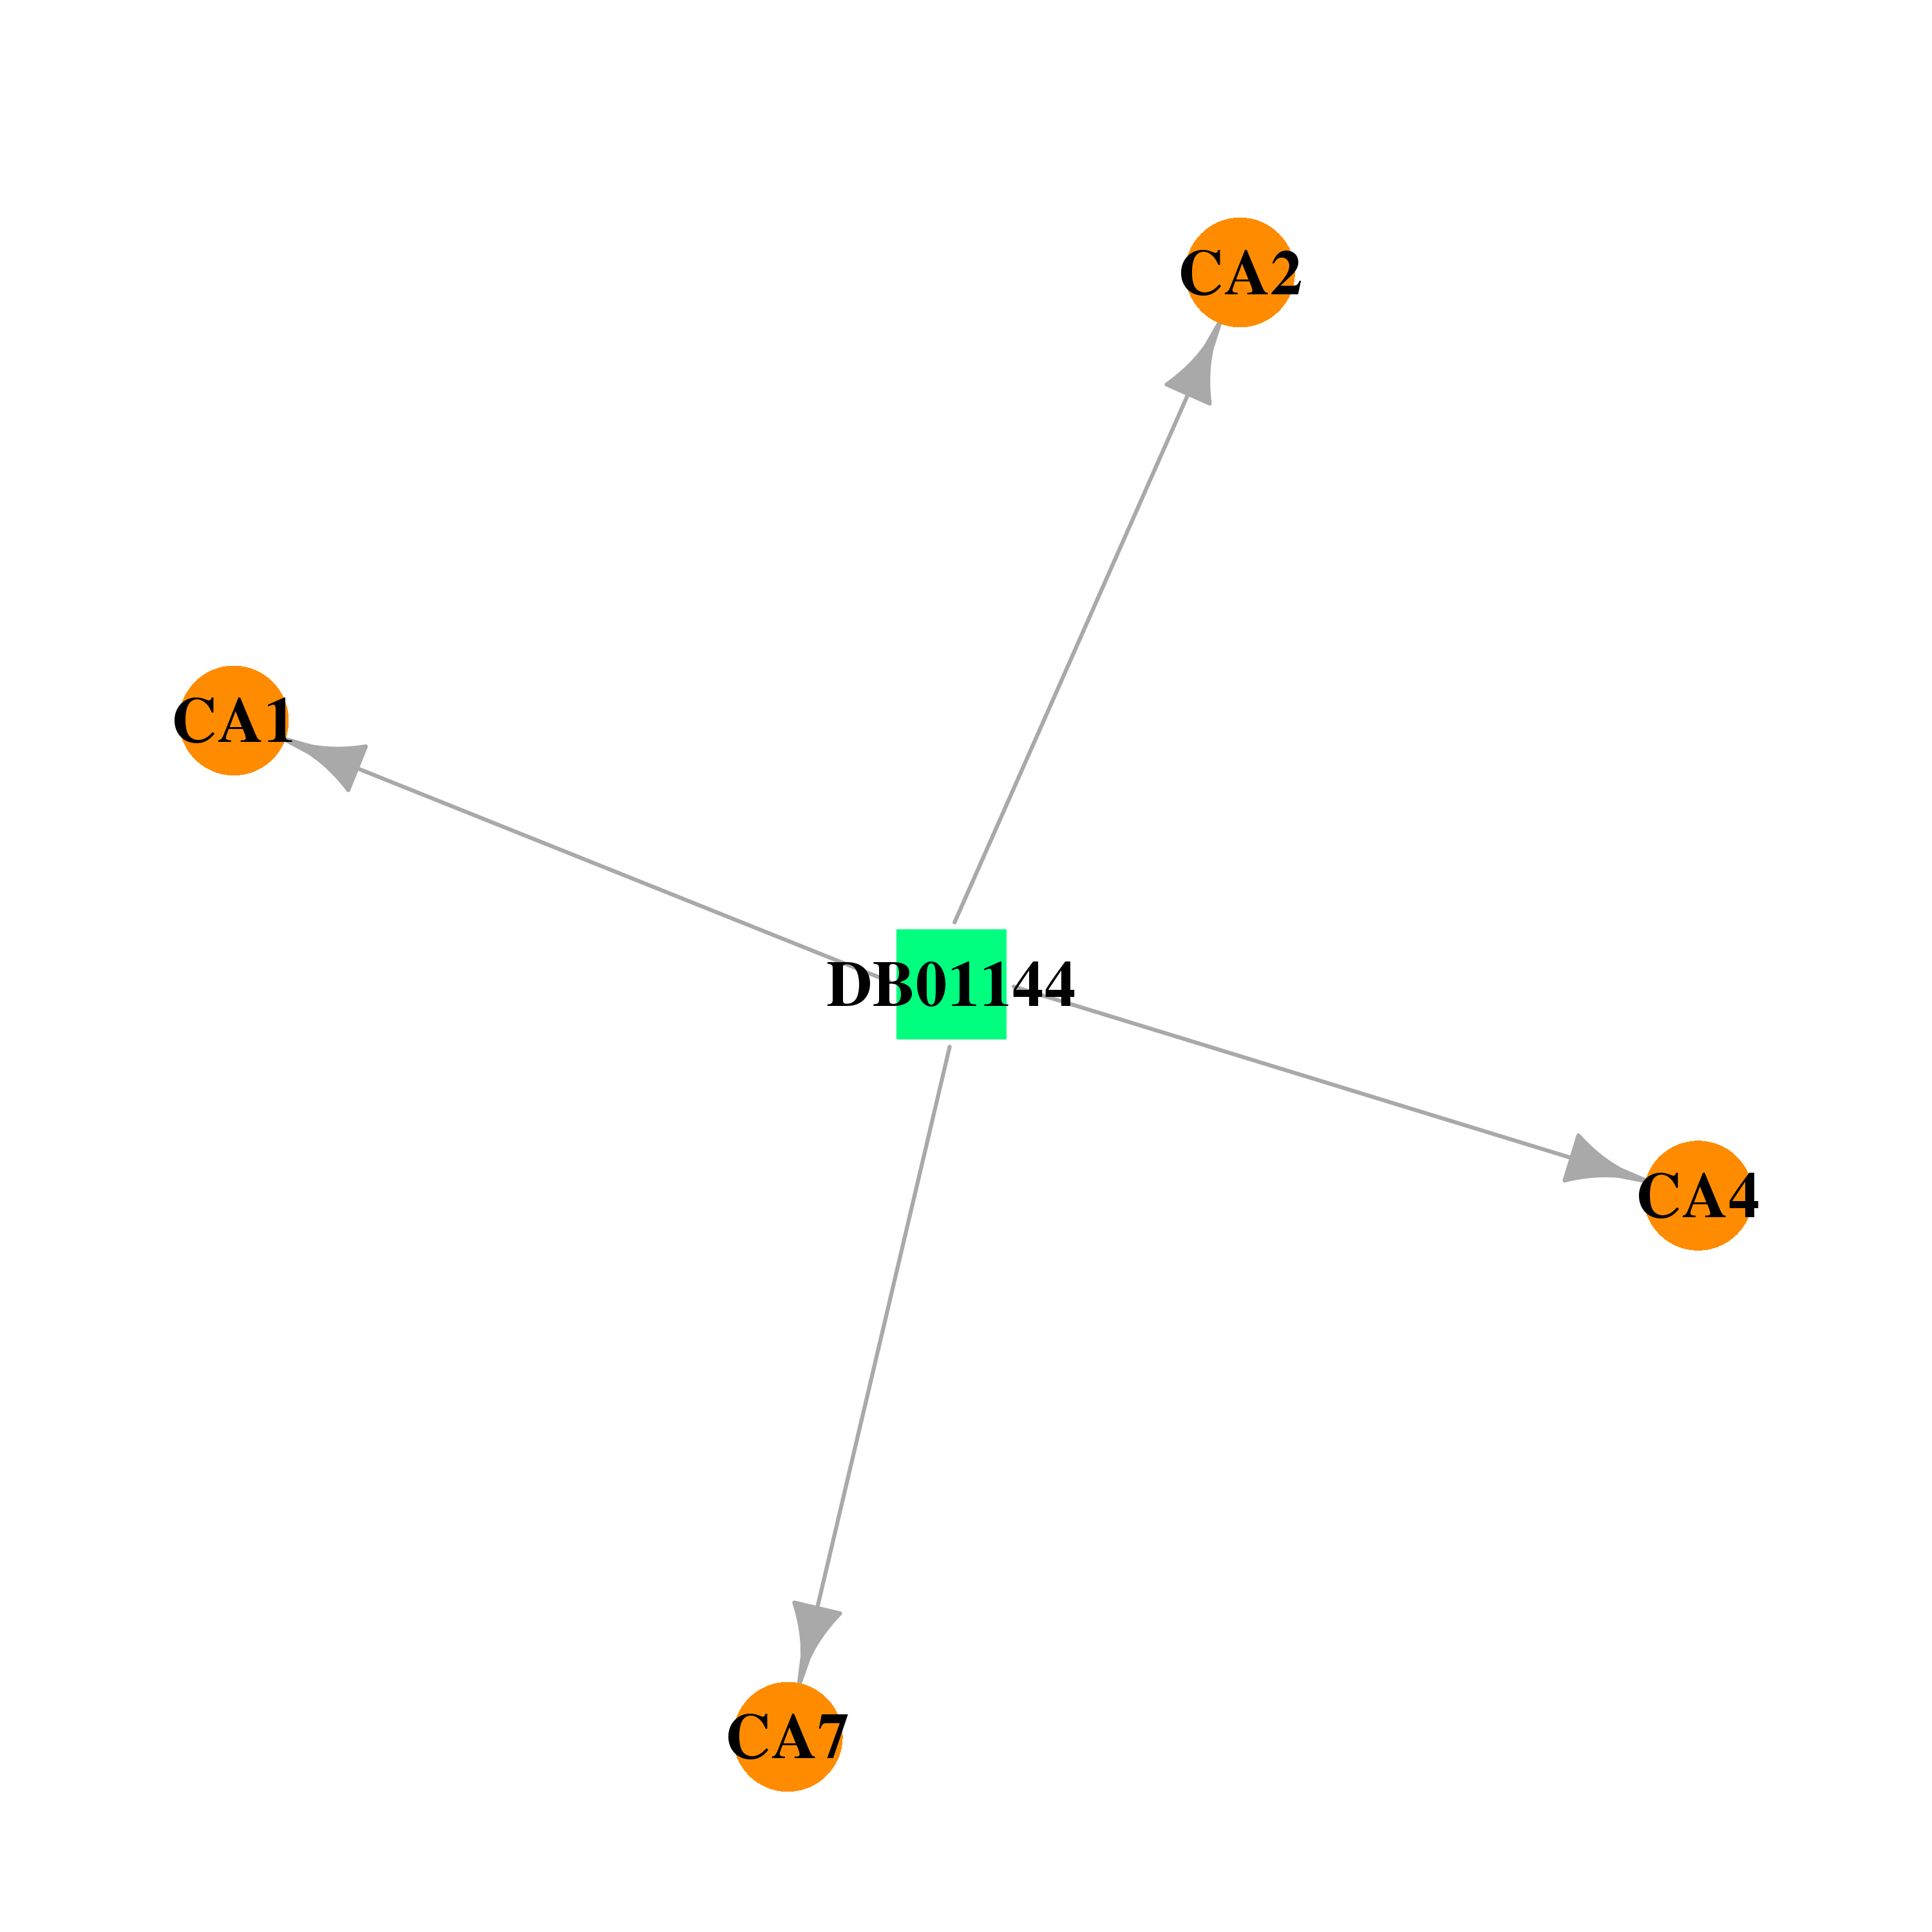 |  |
| DB01194 | carbonic anhydrase I | approved | Brinzolamide |  |  |
| DB01325 | carbonic anhydrase I | approved | Quinethazone | 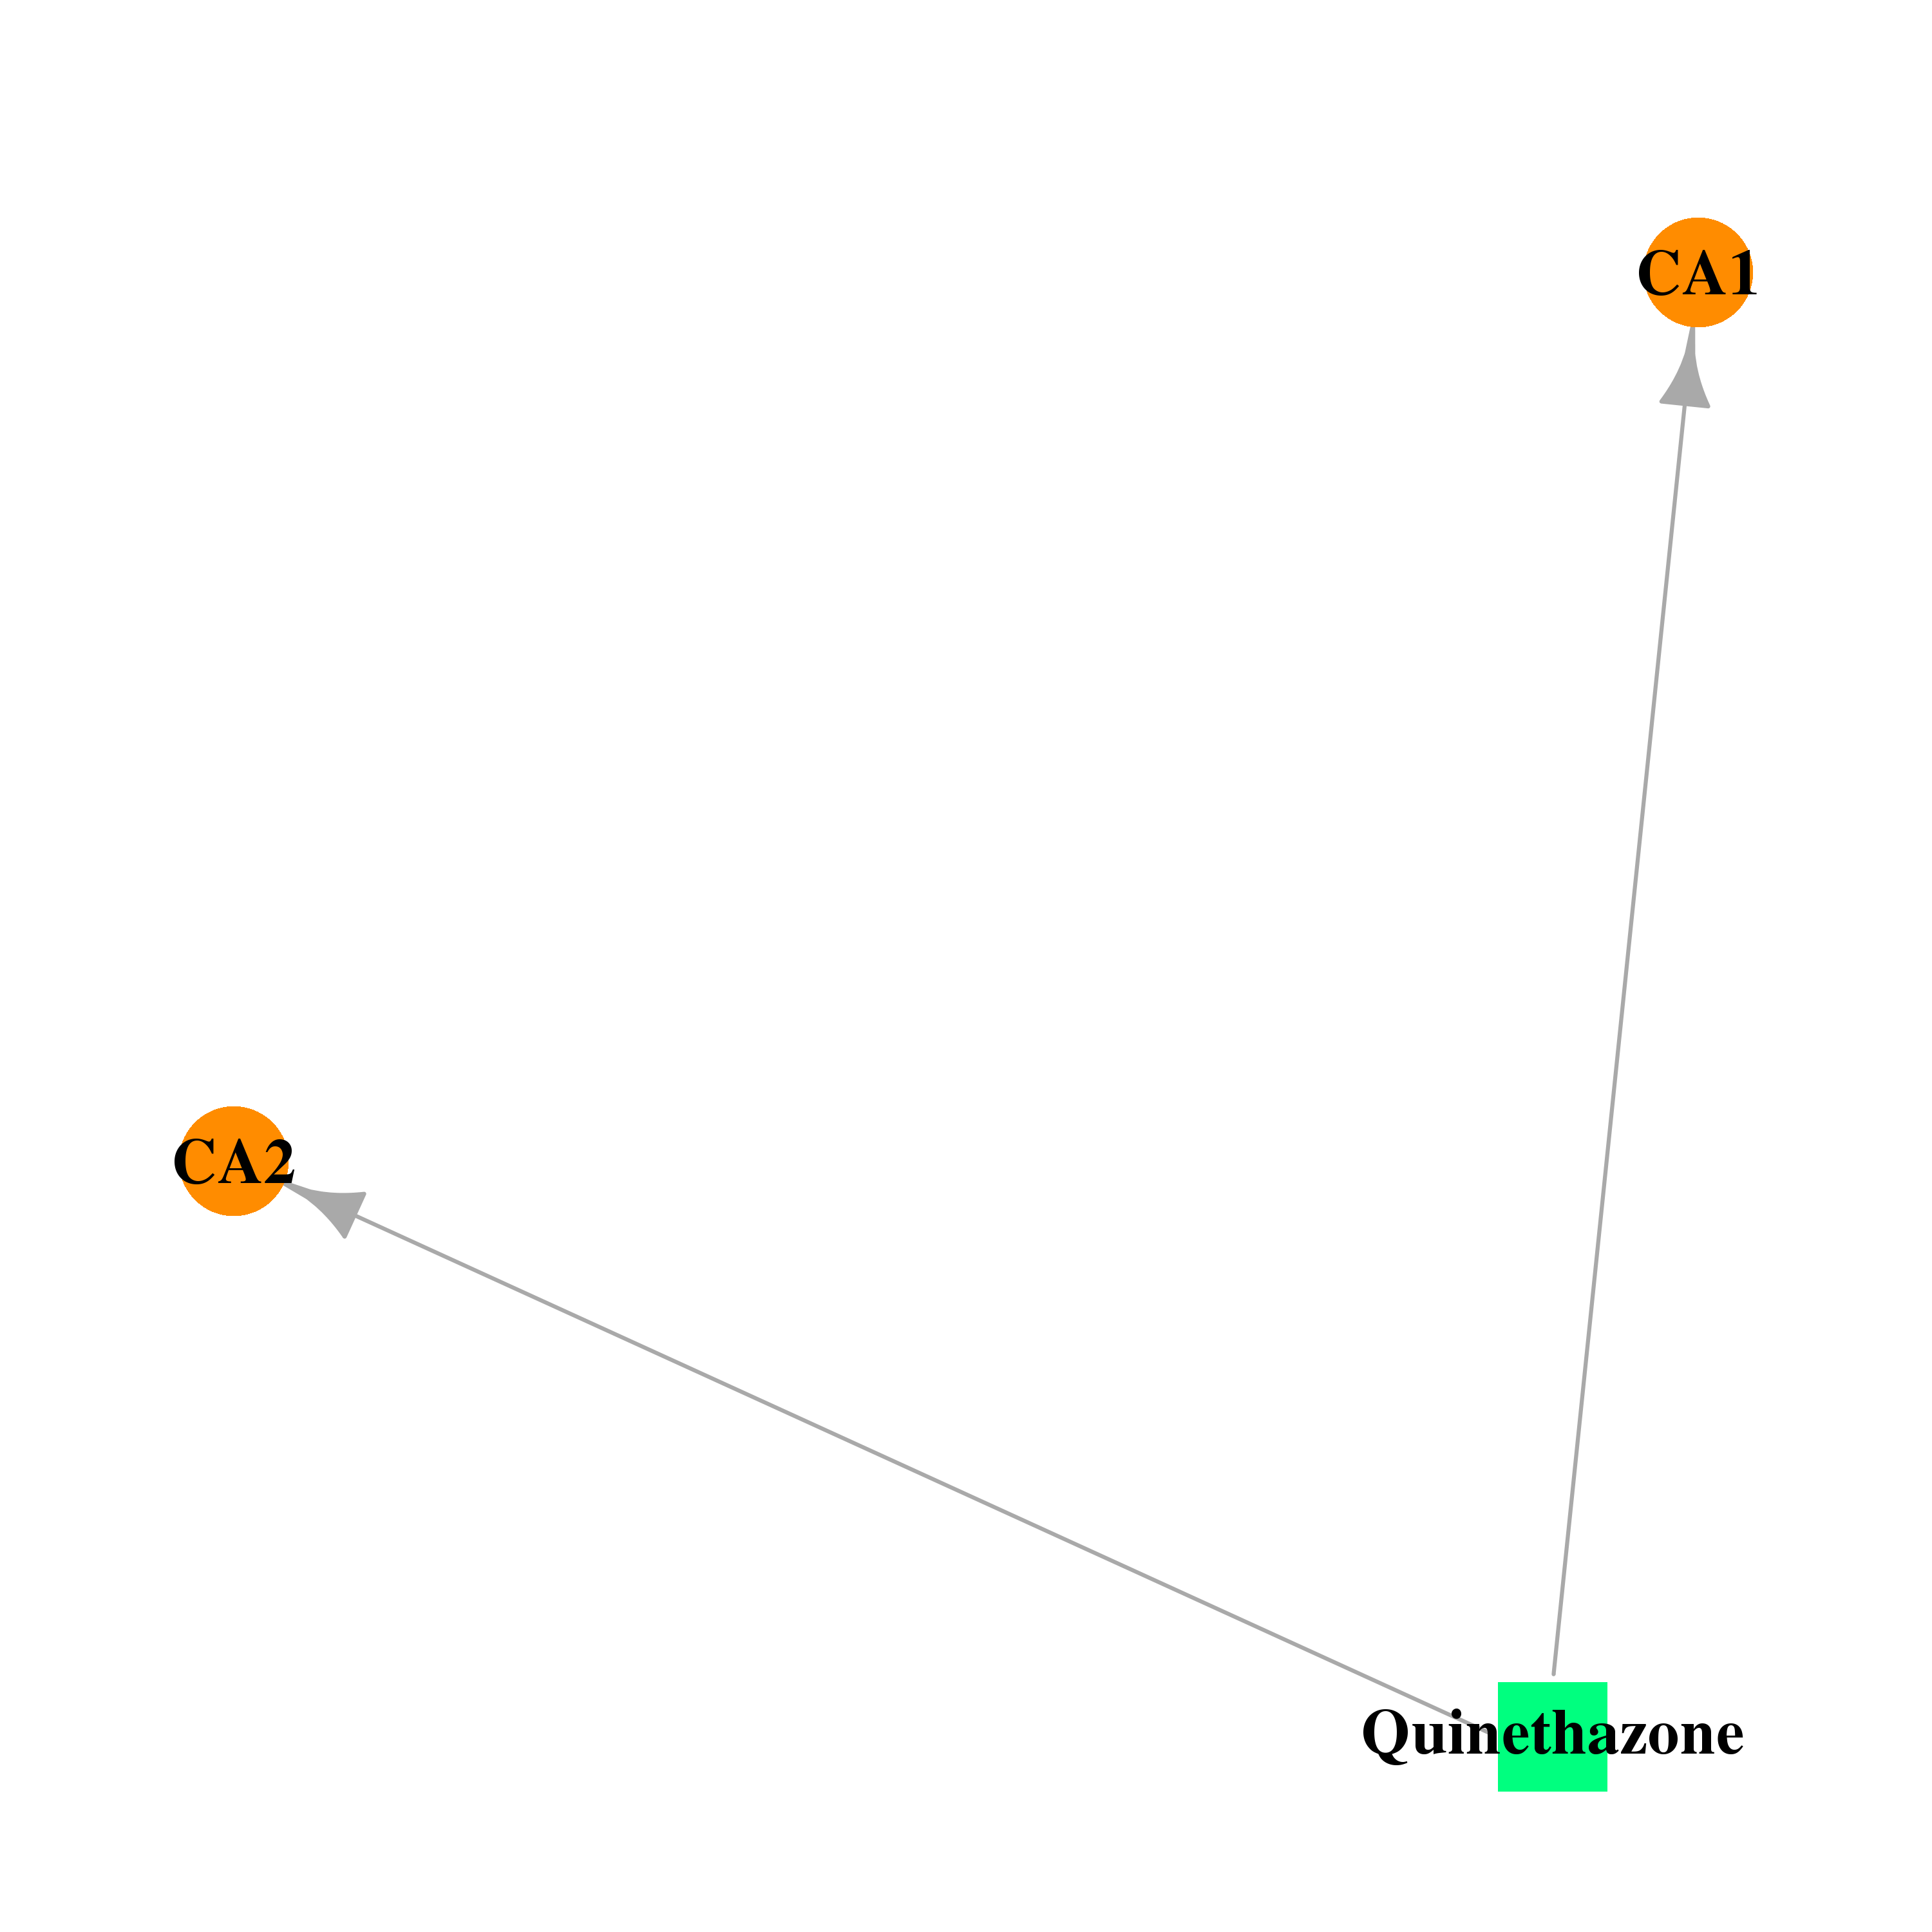 |  |
| DB08155 | carbonic anhydrase I | experimental | N-{2-[4-(AMINOSULFONYL)PHENYL]ETHYL}ACETAMIDE | 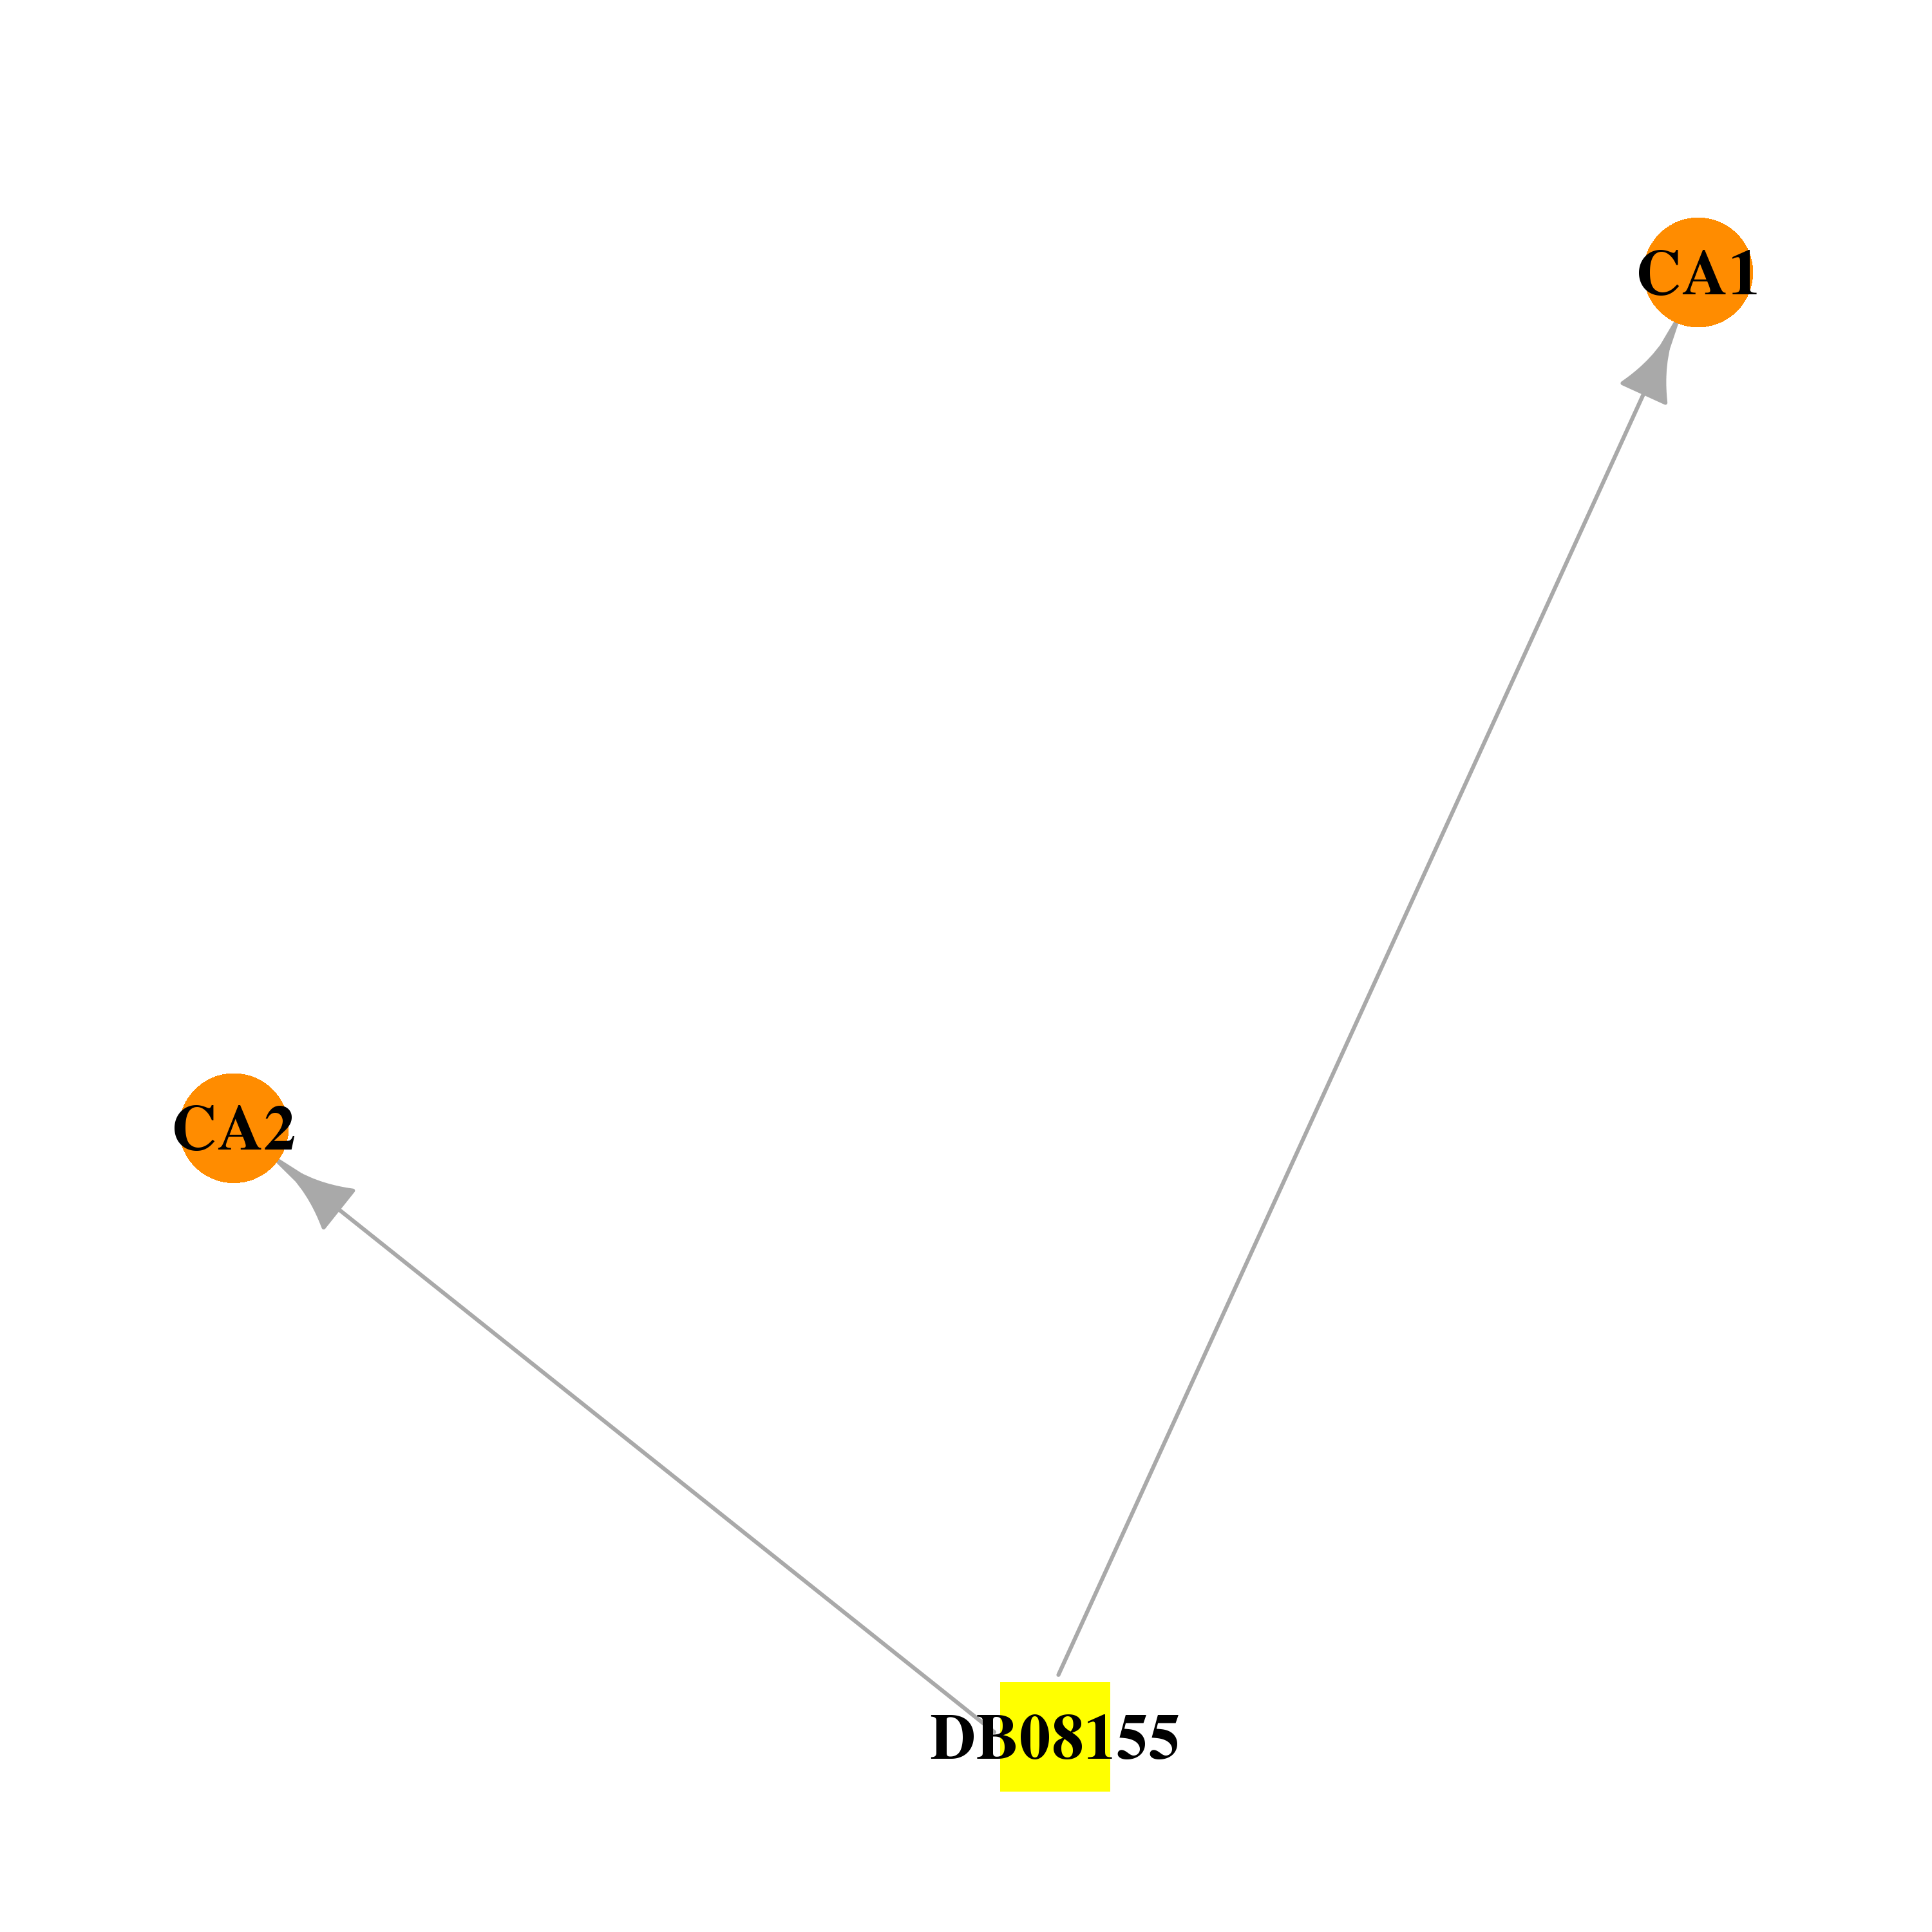 | 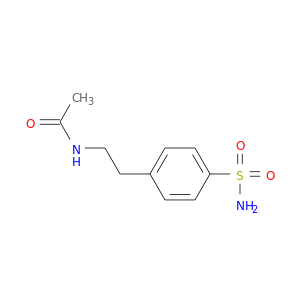 |
| DB08156 | carbonic anhydrase I | experimental | 3-[4-(AMINOSULFONYL)PHENYL]PROPANOIC ACID | 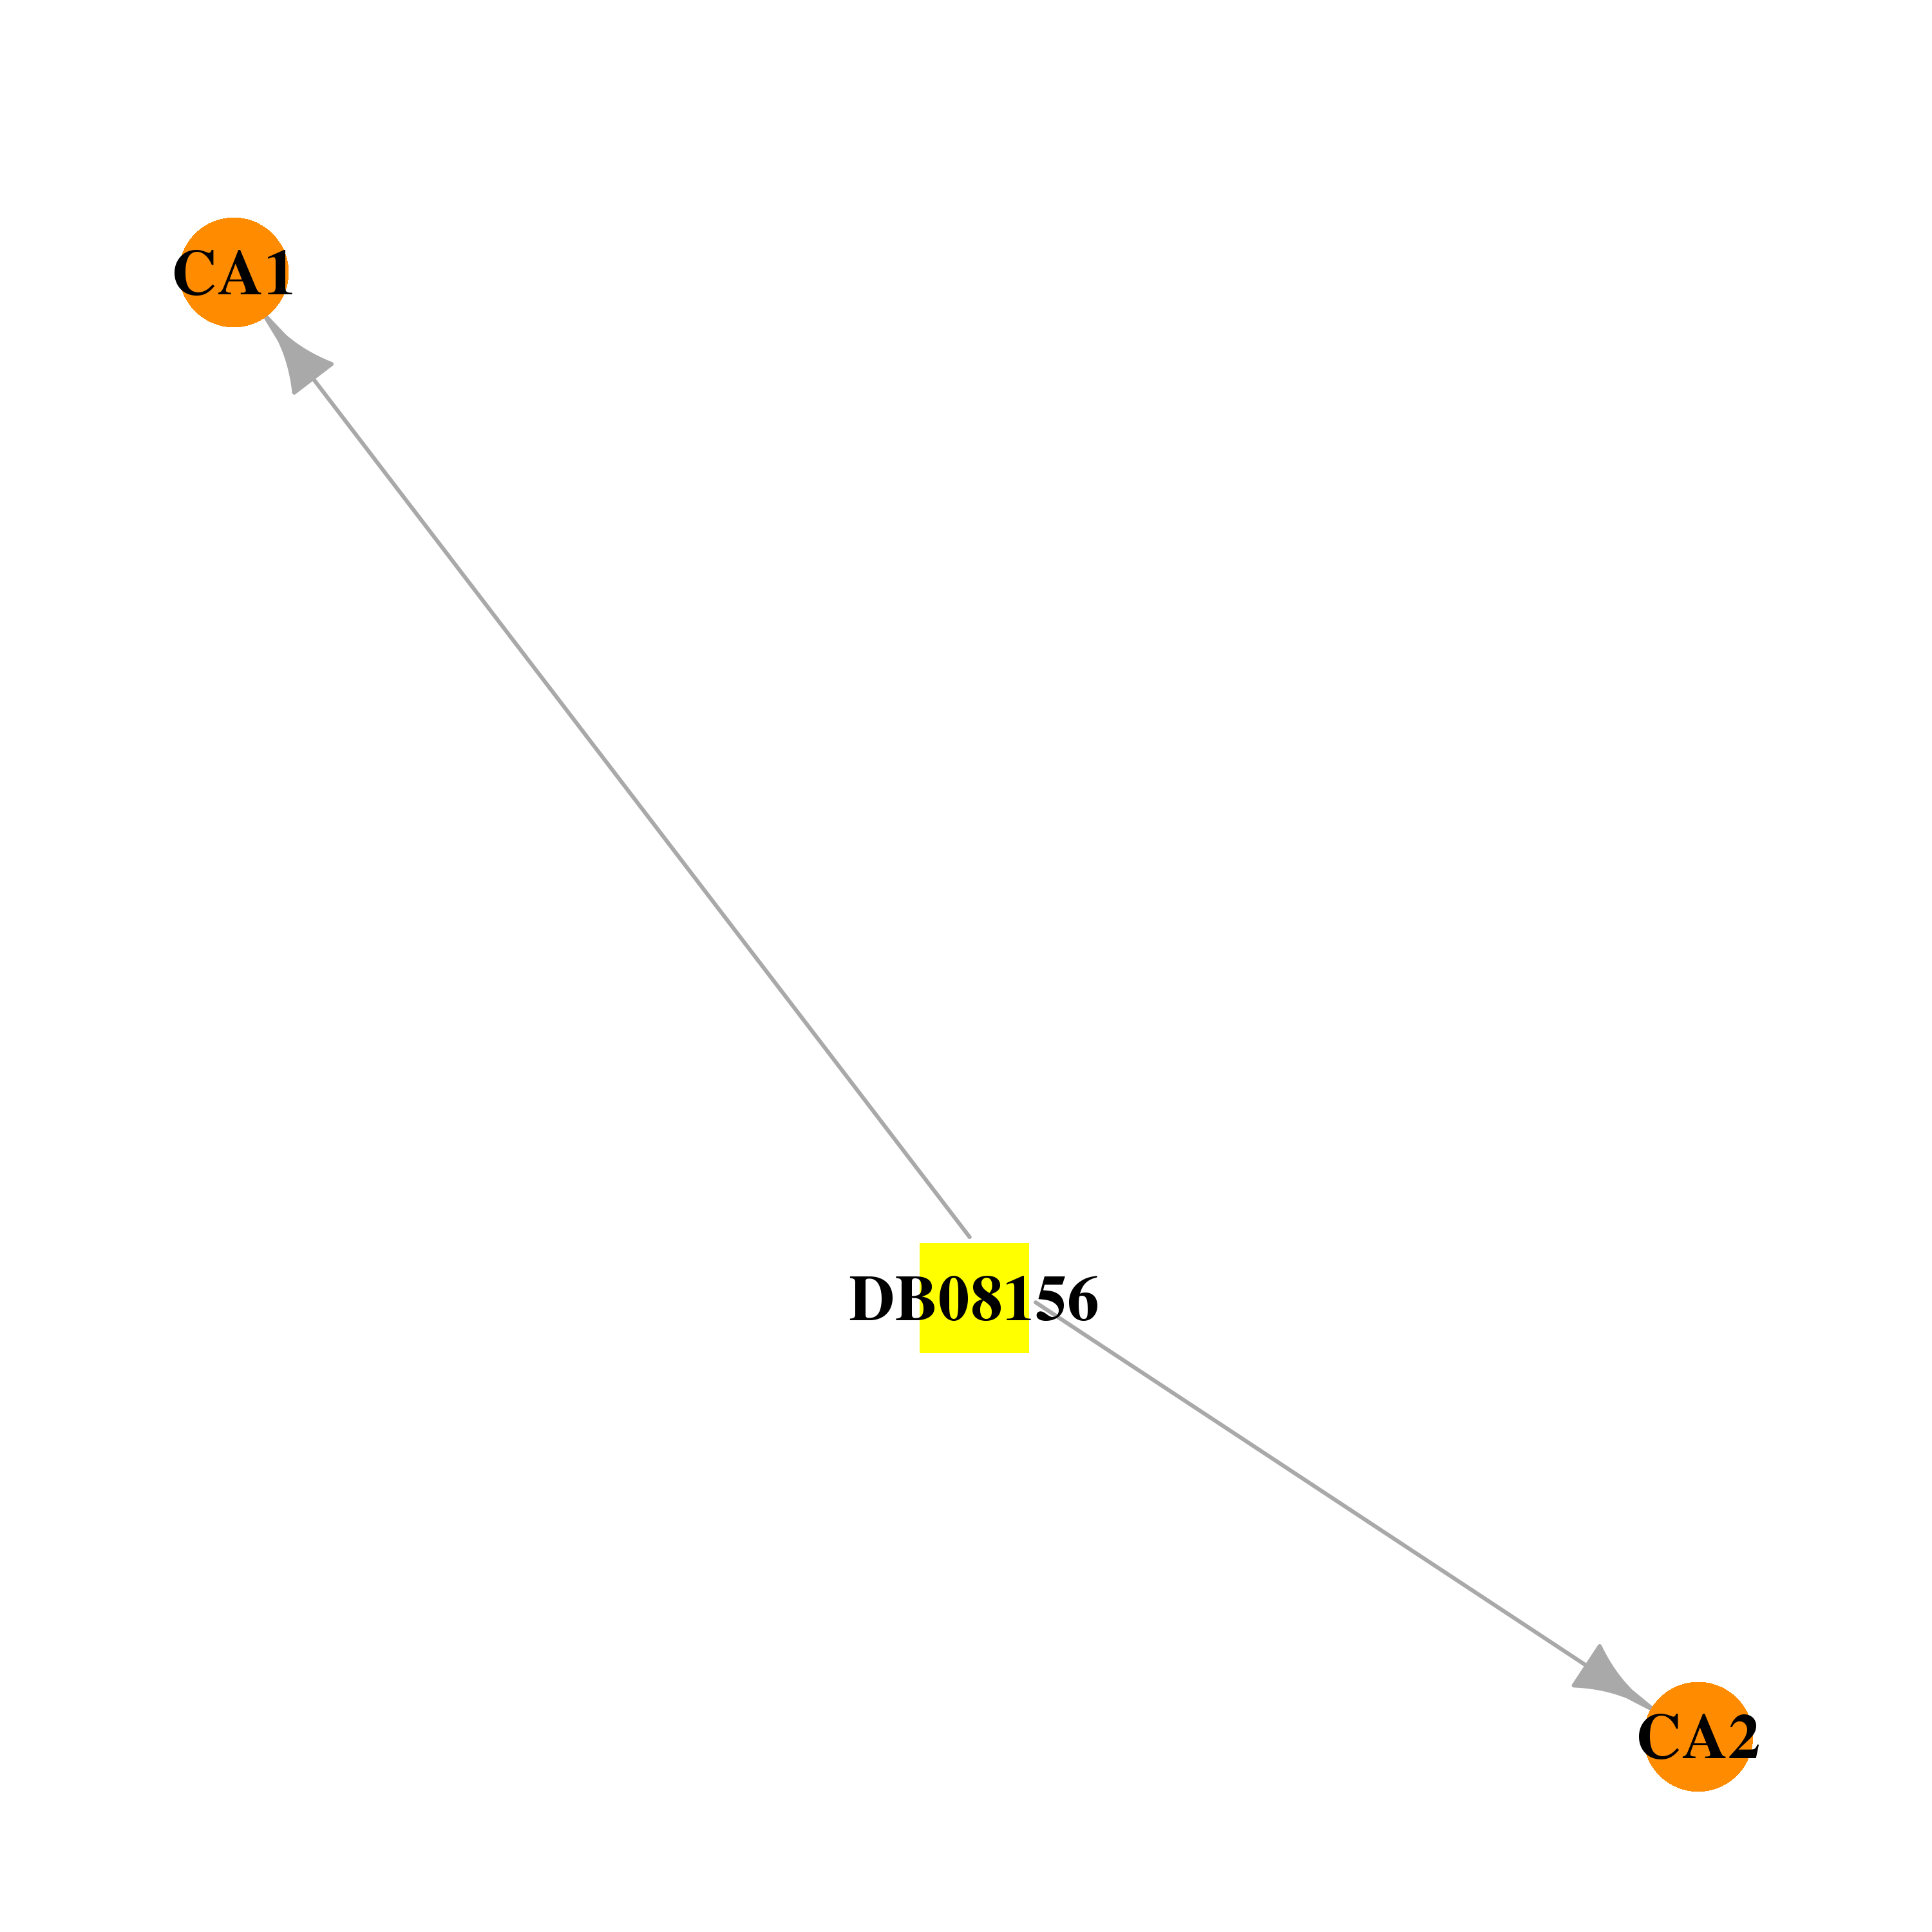 | 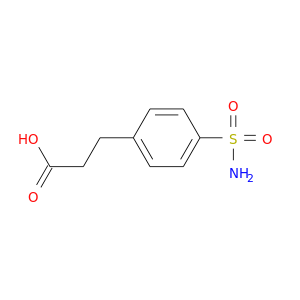 |
| DB08157 | carbonic anhydrase I | experimental | ETHYL 3-[4-(AMINOSULFONYL)PHENYL]PROPANOATE | 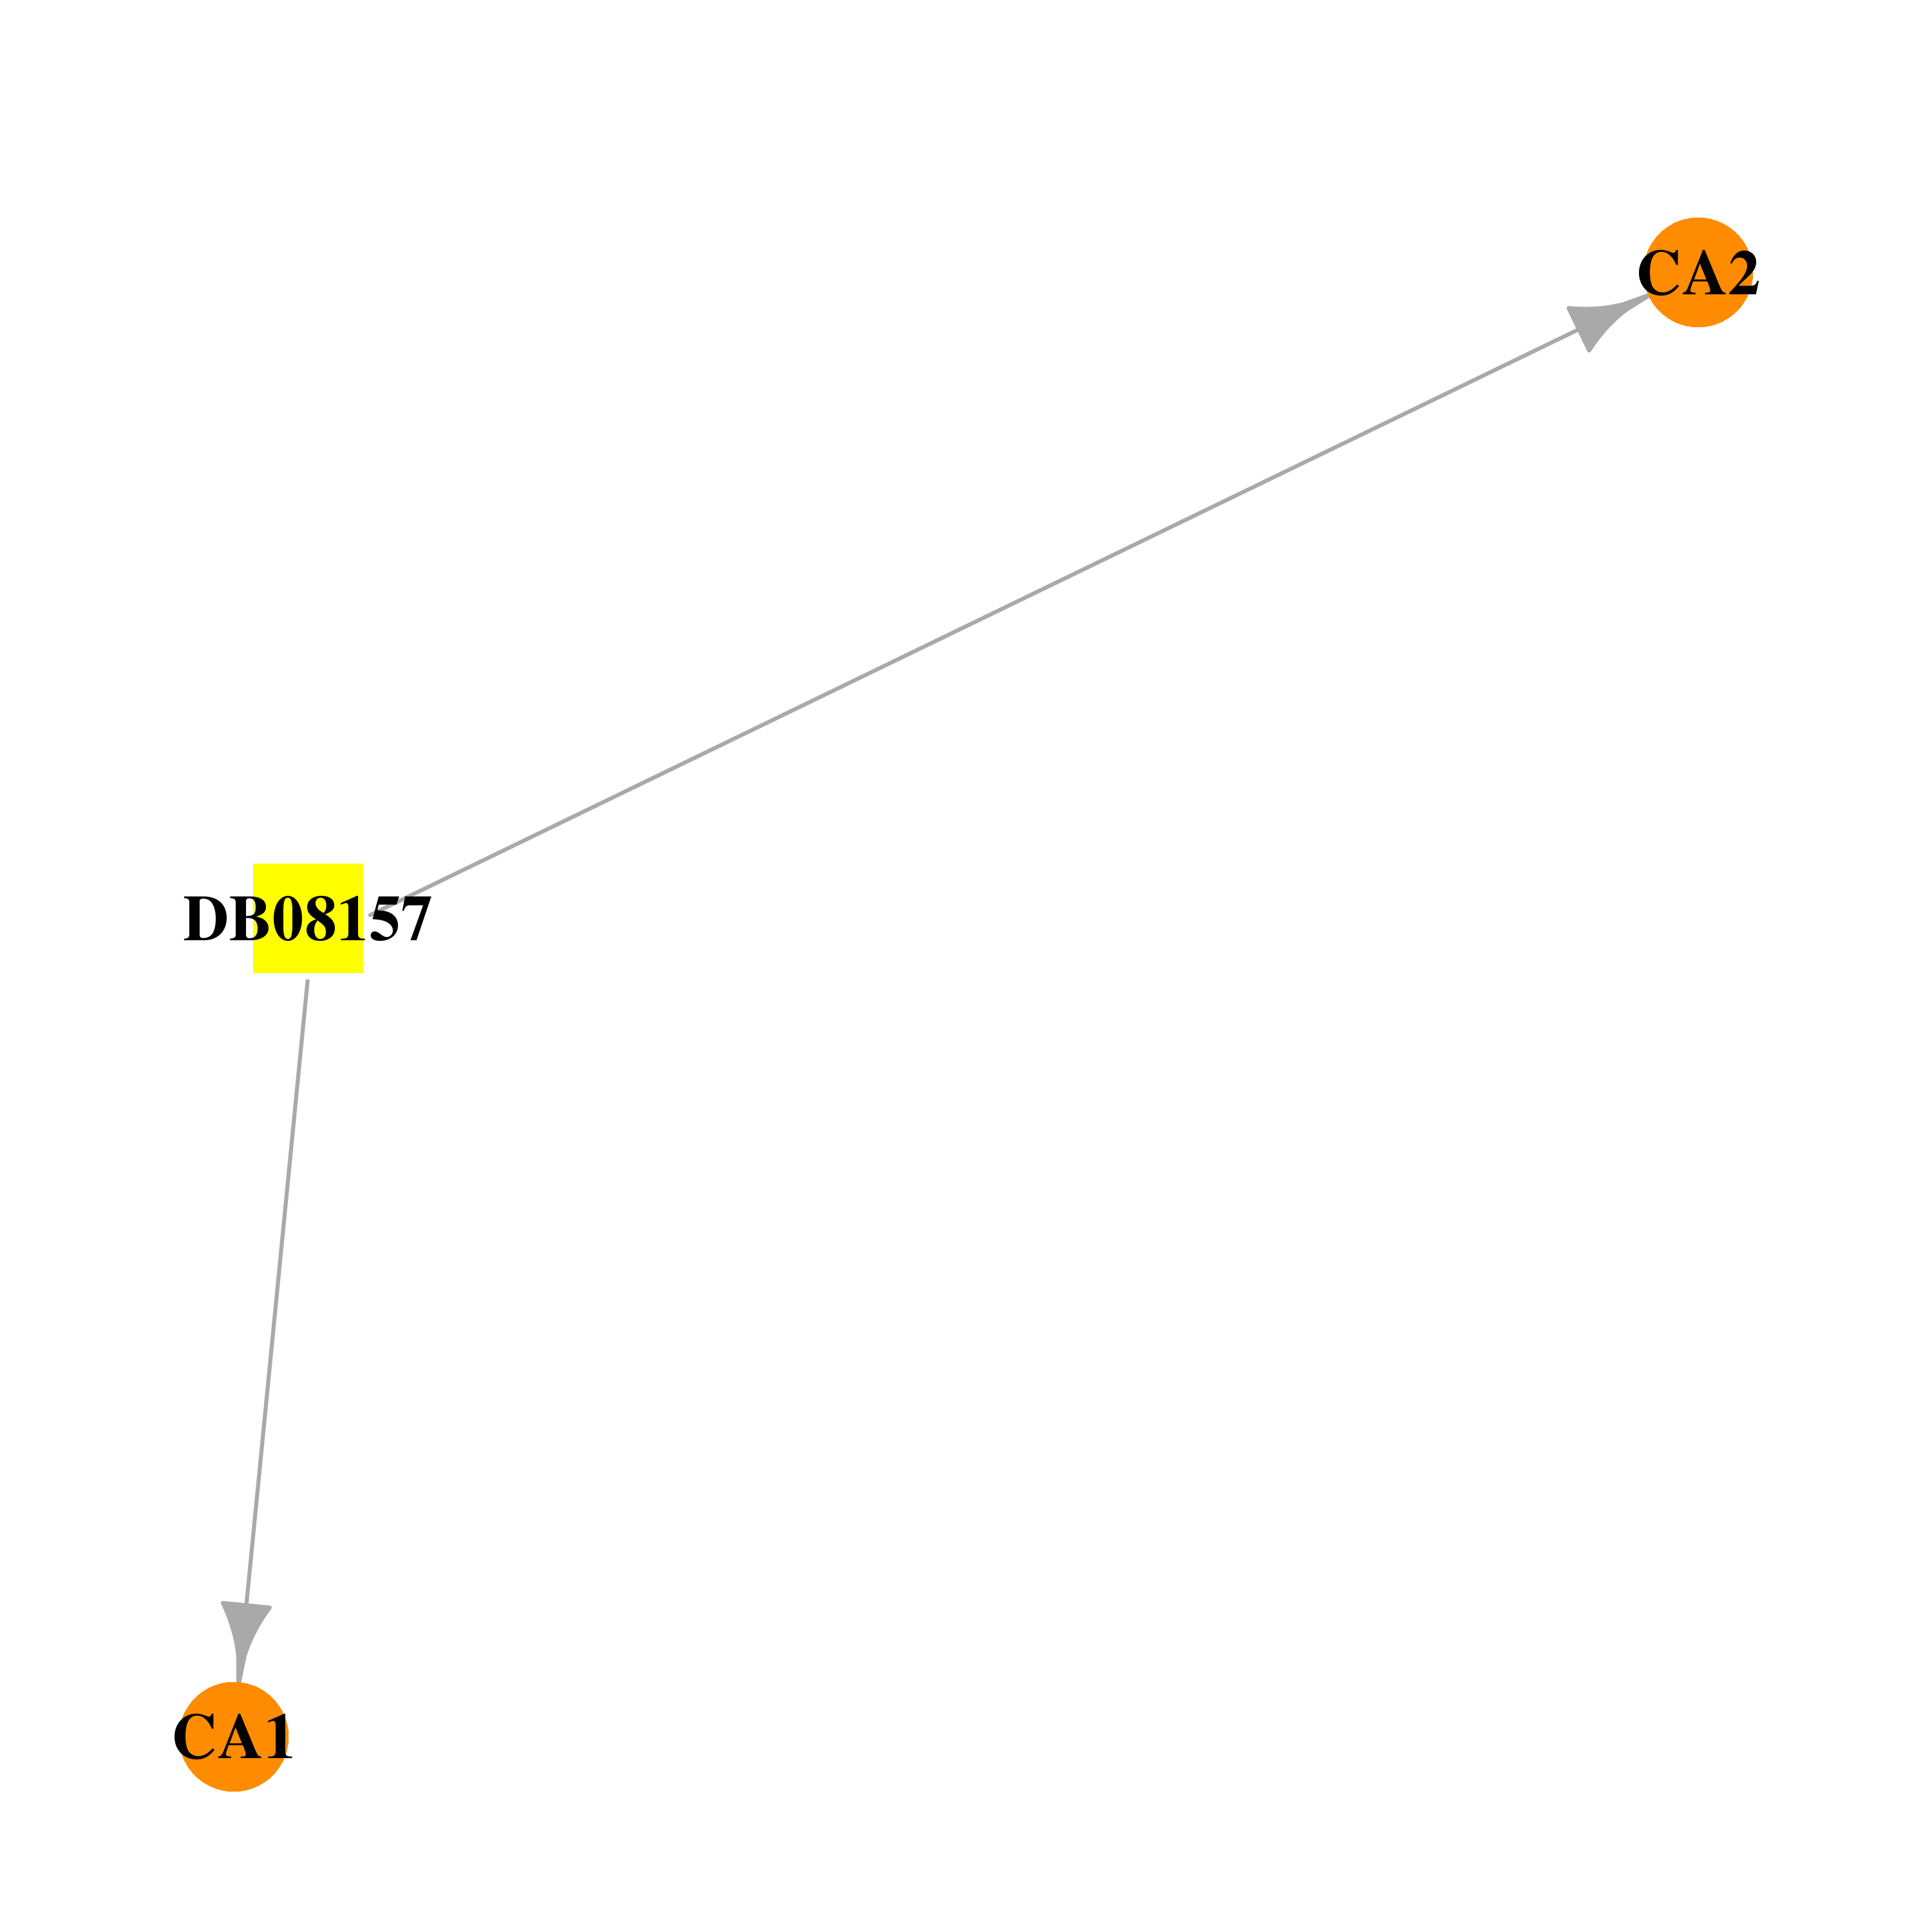 | 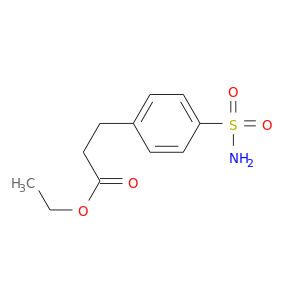 |
| Top |
| Cross referenced IDs for CA1 |
| * We obtained these cross-references from Uniprot database. It covers 150 different DBs, 18 categories. http://www.uniprot.org/help/cross_references_section |
: Open all cross reference information
|
Copyright © 2016-Present - The Univsersity of Texas Health Science Center at Houston @ |